
 Open Access Article
 This Open Access Article is licensed under a Creative Commons Attribution-Non Commercial 3.0 Unported Licence
The role of human serum and solution chemistry in fibrinogen peptide–nanoparticle interactions†
Angela
Zapata
 a,
Mai-Loan
Nguyen
a,
Caleb
Ling
a,
Jacqueline
Rogers
a,
Sangeetha
Domiano
a,
Clive
Hayzelden
b and
Korin E.
Wheeler
*a
a,
Mai-Loan
Nguyen
a,
Caleb
Ling
a,
Jacqueline
Rogers
a,
Sangeetha
Domiano
a,
Clive
Hayzelden
b and
Korin E.
Wheeler
*a
aDepartment of Chemistry & Biochemistry, Santa Clara University, Santa Clara, CA 95053, USA. E-mail: kwheeler@scu.edu
bDepartment of Biology, San Francisco State University, San Francisco, CA 94132, USA
First published on 21st April 2020
Abstract
In living systems, the biomolecules that coat nanoparticles (NPs) alter the NP biological identity and response. Although some biomolecules are more effective in mediating NP stability or biological fate, it is difficult to monitor an individual biomolecule within the complexity of the biota. To understand the dependence of protein–NP interactions on common variations in blood, we have evaluated binding between silica NPs and a model gamma-fibrinogen (GF) peptide. Fibrinogen is commonly identified within the protein corona fingerprint of human serum, but its abundance on the NP varies. To assess the relative importance of human serum and solution conditions, GF peptide and silica NP interactions were evaluated with and without serum across various pH, NaCl concentrations, and glucose concentrations. Initial evaluation of the GF peptide and silica NP complexes using circular dichroism and dynamic light scattering show little change in the secondary structure of the peptide and no significant agglomeration of NPs, suggesting peptide–NP complexes are stable across study conditions. Fluorescence anisotropy was used to monitor GF peptide–NP binding. Both with and without serum, binding constants for the gamma-fibrinogen peptide vary significantly upon addition of diluted HS (1![[thin space (1/6-em)]](https://www.rsc.org/images/entities/char_2009.gif) :500) and 29 mM sodium chloride. Yet, results indicated that gamma-fibrinogen binding interactions with silica NPs are comparatively insensitive to physiologically relevant pH changes and dramatic increases in glucose concentrations. Results highlight the importance of blood chemistries, which vary across individuals and disease states, in mediating protein corona formation.
:500) and 29 mM sodium chloride. Yet, results indicated that gamma-fibrinogen binding interactions with silica NPs are comparatively insensitive to physiologically relevant pH changes and dramatic increases in glucose concentrations. Results highlight the importance of blood chemistries, which vary across individuals and disease states, in mediating protein corona formation.
Introduction
Many powerful biomedical tools and techniques rely on nanotechnology, including targeted drug delivery, cancer therapies, imaging devices, and diagnostics. For those applications where nanoparticles (NPs) interact directly with living systems or biological fluids, interactions of NPs with biomolecules must be considered as NPs readily adsorb a coating of biomolecules.1–5 In biological fluids such as blood, this coating is dominated by proteins and is often referred to as the protein corona.6,7 The protein corona confers a new biological identity on the NPs and mediates biological response to the NPs, including cell uptake, immune response, pharmacokinetics, biodistribution, therapeutic efficacy, and toxicity.6–10 A complete understanding of protein corona populations and evolution in the body will expedite the transition of NPs into clinical settings.4,10–12There are many factors that influence the NP protein corona, including NP biophysical features, solution conditions, and the features of the biomolecules present in solution. In clinical settings, this complicates application of our understanding of protein coronas formed under laboratory conditions to coronas formed in living systems.4,10–12 For example, individuals with diseases or at different stages of life have altered blood chemistries, including varied metabolites and protein expressions. Wide variation of protein coronas across individuals, coined “personalized protein coronas”,11–14 has been confirmed by proteomic approaches.12,15 Additionally, molecular dynamics simulations at the atomic level show that metabolites including glucose and cholesterol can mediate the profiles of fibrinogen adsorption at the NP surface.13
Minor variations in the corona, or even in an individual protein at the surface of a particle, can alter recognition and cellular uptake of the NP.8,9,15,16 Studies of the protein corona range from identification and quantification of the dozens to hundreds of proteins within the corona to evaluation of individual protein–NP interactions at the atomic or molecular level. Full characterization of the corona elucidates the characteristics of a population, but insights into an individual protein of interest, outside of quantification, require creative and challenging approaches. On the other hand, characterization of individual protein–NP interactions typically provides atomic-level insights but sacrifices the true biological complexity of a physiological corona. Thus, there is a need for approaches to monitor a protein of interest across expected variations in the personalized protein corona, which can only be assessed in the presence of true biochemical complexity.
To assess the role of the complexity of the human serum (HS) protein corona and solution chemistry in mediating binding of a peptide to NPs, we employ fluorescence anisotropy. A small fluorescent molecule, when excited with plane-polarized light, emits light that is largely depolarized because the molecule tumbles rapidly in solution during its fluorescent lifetime. However, when bound by a larger biomolecule or colloid, the effective volume is increased, rotation is slowed, and measured anisotropy will increase. Although fluorescence anisotropy has long been used for screening, evaluation of drug candidates and mechanisms of action,17–19 it has yet to be applied to protein–NP interactions. A related technique, fluorescence correlation spectroscopy, has been used to evaluate the dynamic nature of the NP protein corona and monitor intracellular dynamics.20,21 Fluorescence anisotropy, however, is more readily available, requires less costly instrumentation, and can be performed in 96 well-plates for a higher throughput approach.18 Here we use fluorescence anisotropy to obtain insight into the interactions between a fluorophore-labeled peptide and NPs. Since only the peptide has a fluorescent label, a Langmuir adsorption isotherm can be obtained even in the presence of the other biomolecules in solution, such as those found in HS.
The ease of peptide synthesis and modification means that peptide–NP studies have served to establish an understanding of the biophysical principles behind biomolecular interactions with NPs.5,22–24 Moreover, peptide-coated NPs are valuable biomedical tools for drug delivery, uptake, imaging, and labeling.4,5 In the present study, we focus on a gamma-fibrinogen (GF) peptide interacting with silica particles. Fibrinogen is one of the most abundant blood proteins and consistently appears in characterizations of protein corona populations formed from blood proteins across a variety of NPs, including silica, gold, and silver.9,25–27 Due to its role in blood clotting and the immune system, fibrinogen–NP interactions have also received significant attention in studies of single proteins interacting with NPs.27–31 Beyond the physiological relevance, the GF peptide (sequence: YSMKETTMKIIPFNRLSIG) is an easily modified model biomolecule to evaluate biophysical properties that mediate NP interactions.
We focus on silica NPs because of their increasing popularity in biomedical applications including molecular imaging, drug delivery, and other biomedical assays.24,32–35 Silica NPs are well-studied in reaction with blood proteins36,37 and provide a broad platform with flexible silanization chemistries for functionalization.22,38 Peptides are often applied to silica NPs to not only increase NP stability, but also enhance biomedical applications, such as increasing cell penetration.39 In studies of silica NPs – peptide interactions, NP size and functionalization mediate binding, as do the peptide biophysical properties.22,24,39–41 A comparison of positively, negatively, and neutrally charged peptides identifies electrostatic, hydrophobic, and hydrogen bonding interactions at the aqueous silica interface.39,41,42 These interactions are dominated by electrostatics as the silica NP size increases.22 Notably, however, experimental measurements tend to assess averages across individual peptide configurations. More detailed modeling and NMR studies find that in some cases even carboxylic acid groups can participate in binding to silica.43
Here-in, we characterize GF peptide interactions with silica NPs across an array of solution conditions, including diluted HS, varying concentrations of sodium chloride, glucose, and blood pHs (Table 1). The pH range chosen here is narrow, but captures the blood pH range of healthy adults, which is tightly regulated between 7.35–7.45.44 Similarly, the concentrations of sodium chloride reflect those in blood, but we chose to also test lower concentrations to assess the effects of sodium chloride in the interaction. Both pH and sodium chloride concentrations have demonstrated effects on peptide–silica NP systems. As previously noted, the low isoelectric point of silica NPs and surface siloxide groups enable interactions via positively charged amino acids and via hydrogen bonding.22,24,39 Thus, changes in pH that disrupt or charge H-bonds are expected to alter binding,22,39 while increases in sodium chloride may shield charged interactions and weaken peptide–silica NP complexes.24,40 On the other hand, the glucose concentrations we chose to study are higher than physiological relevance to push the limits and evaluate whether glucose concentrations altered binding. To assess the role of HS in mediating GF peptide–NP interactions, each solution variation was repeated in the presence of diluted HS as well. Neither glucose nor HS has been previously studied for mediation of peptide–silica NP interactions. Together, results further understanding of peptide–silica NP interaction, while parsing features of physiologically relevant solution conditions that mediate binding.
| Physiological condition | Experimental parameter | Rationale |
|---|---|---|
| pH | 7.2, 7.4, 7.6 | Capture range of blood pH in healthy adults |
| Human serum (HS) | 500× diluted | Representative of bloodstream environment |
| Concentration chosen: HS diluted for data collection | ||
| NaCl | 0.29 mM, 29 mM, 145 mM | Solute in blood |
| Concentrations chosen: highest concentration represents levels in blood. Lowest concentration represents that in a 500× dilution of HS | ||
| Glucose | 0.5 M, 1 M | Solute in blood |
| Concentrations chosen: blood glucose levels are in the 4–7 mM range for a healthy adult. Concentrations here are significantly higher to test binding model limits |
Results and discussion
First, we characterized changes in the secondary structure of the GF peptide and stability of the 50 nm silica NPs to gain insight into changes to structure, agglomeration, and NP surface charges. Finally, binding interactions across solution conditions were measured using fluorescence anisotropy, including a diluted solution of human serum.GF peptide secondary structural changes
To assess GF peptide secondary structural changes upon interaction with silica NPs, the GF peptide was characterized with circular dichroism (CD) spectroscopy (Fig. 1). CD spectra collected for GF peptide in buffer and with NPs are nearly identical in shape and intensity, suggesting the peptide undergoes little to no change in structure upon NP addition. This minimal change in peptide structure upon interaction with silica NPs is consistent with previous studies,24 with the exception of known aggregation prone peptides.5 When spectra of the GF peptide with NPs are collected in solutions with increased sodium chloride, the spectra again overlap to indicate no structural perturbations. Because sodium chloride disrupts ellipticity (λ < 200 nm),45 the high concentration sodium chloride samples (29 mM NaCl) show increased noise. Similarly, glucose is optically active45 and, although GF peptide spectra were collected with NPs in glucose, the glucose overshadowed any GF peptide spectra.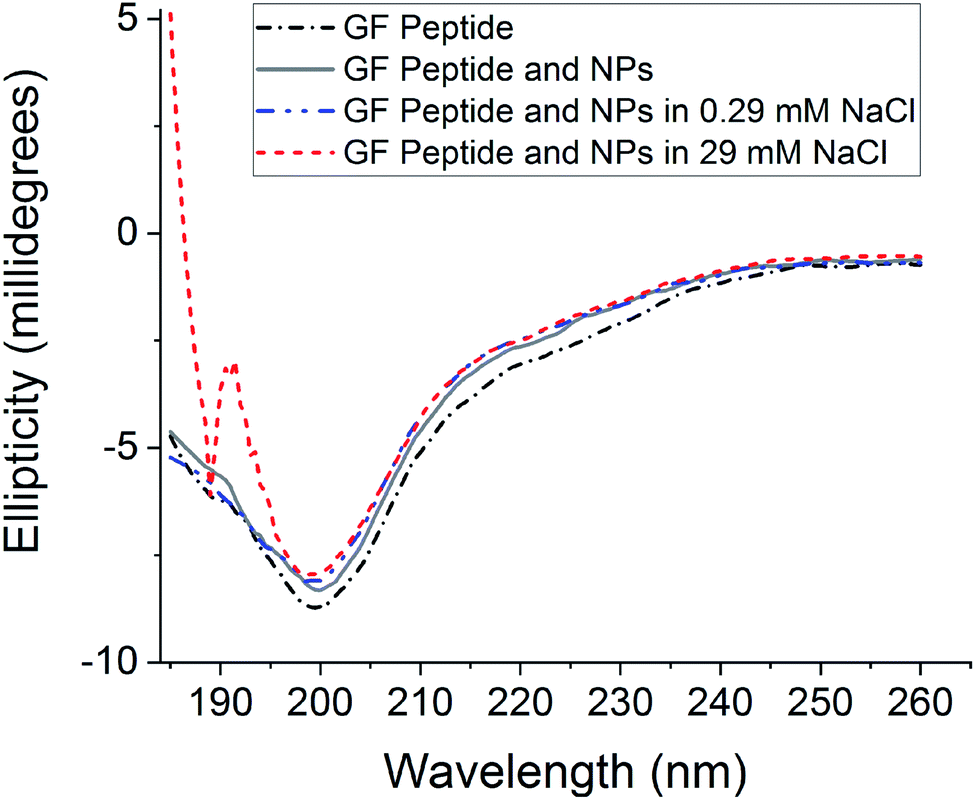 | ||
| Fig. 1 Circular dichroism spectra of GF peptide in various buffer conditions. All solutions were prepared with 25 μM in 5 mM phosphate buffer, pH 7.4 with additional sodium chloride, as noted. Displayed spectra are from one experiment representative of a total of three experiment datasets. | ||
Nanoparticle agglomeration
Dynamic light scattering (DLS) was used to measure effective hydrodynamic diameter and polydispersity values for NPs across solution conditions in both the presence and absence of GF peptide and/or HS (Table 2, with size distribution graphs in Fig. S.1†). Notably, the GF peptide increases the NP hydrodynamic diameter by roughly 1 nm, which is within the range of error. This minimal increase in hydrodynamic diameter with the addition of GF peptide is consistently true across solution environments, including the addition of sodium chloride and glucose, but not HS (vide infra). Since the GF peptide is quite small, a monolayer of peptide is not likely to give a measurable hydrodynamic diameter increase. These results are consistent with previous studies noting that NP coverage with a single type of protein or peptide is typically a monolayer.46,47 Specifically, several other peptides studied in reaction with silica NPs of various sizes and surface functionalities also showed monolayer or submonolayer coverage.22| Matrix | Hydrodynamic diameter, nm | Polydispersity | |||
|---|---|---|---|---|---|
| Ave | % RSD | Ave | % RSD | ||
| Silica NP | Buffer | 72.8 | 0.85 | 0.073 | 10 |
| 0.29 mM NaCl | 73.3 | 0.46 | 0.068 | 7.6 | |
| 29 mM NaCl | 73.4 | 1.4 | 0.062 | 21 | |
| 1 M glucose | 74.5 | 0.60 | 0.052 | 17 | |
| 0.29 mM NaCl + HS | 79.1* | 1.3 | 0.079 | 3.0 | |
| 29 mM NaCl + HS | 101.7** | 2.6 | 0.17 | 31 | |
| 1 M glucose + HS | 82.0*** | 1.1 | 0.084 | 5.9 | |
| Silica NP with GF peptide | Buffer | 73.7 | 0.62 | 0.049 | 9.6 |
| 0.29 mM NaCl | 73.8 | 0.71 | 0.053 | 13 | |
| 29 mM NaCl | 73.5 | 0.60 | 0.032 | 12 | |
| 1 M glucose | 73.8 | 0.69 | 0.070 | 4.7 | |
| 0.29 mM NaCl + HS | 77.9* | 2.0 | 0.080 | 12 | |
| 29 mM NaCl + HS | 89.8*** | 0.51 | 0.11 | 16 | |
| 1 M glucose + HS | 82.1*** | 1.4 | 0.098 | 8.3 | |
By comparing effective hydrodynamic diameter and polydispersity measurements for NPs across conditions in the presence of diluted HS, it is clear that addition of HS caused a more significant increase in hydrodynamic diameter. Average hydrodynamic diameter increased as much as 29 nm for silica NPs in matrices with HS and glucose or sodium chloride (72.8 nm in 5 mM sodium phosphate buffer, pH 7.4 vs. 101.7 nm with the addition of 29 mM NaCl and diluted HS). This increased hydrodynamic radius is not surprising given the increased protein load from HS. Not only does HS include larger proteins that increase the size of the corona, but it can also form several protein layers at the NP surface.48 In contrast to NP coatings with a single type of protein or peptide, protein coronas with a diversity of biomolecules are often multilayer.48 Although HS-driven NP agglomeration could also increase hydrodynamic diameter, the size distribution graphs show only minor peak shifts and broadening, but no evidence of a larger agglomerated population. Rather, the silica NPs appear well dispersed and increases in diameter are more likely due to formation of a protein corona.
Intriguingly, the diameter for this same sample (29 mM NaCl with diluted HS) is nearly 12 nm smaller upon addition of GF peptide. It is possible that the addition of GF peptide slightly disperses the HS protein corona in the presence of higher sodium chloride concentrations, but confirmation of this theory would require additional experiments.
Polydispersity, which relates to the tendency of particles to agglomerate in solution, provides an insight on how the physiochemical properties of the peptide or protein corona alters particle-to-particle interactions. The majority of samples showed narrow size distributions with polydispersities between 0.032–0.08. This is consistent with more detailed size distribution graphs (Fig. S.1†), where the majority of samples are monodisperse. Particles with HS protein coronas were slightly more monodisperse than their uncoated counterparts, indicating that the protein coronas enhance particle stability. Only a few show a secondary peak suggestive of a small population of agglomerated NPs. These polydisperse samples include silica NPs with HS and 29 mM NaCl. The broadest distributions were observed for samples containing HS and 29 mM sodium chloride. This is consistent with reduced charge repulsion at high ionic strength, which decreases electrostatic repulsion between particles, enabling NP agglomeration.49
To ensure the silica NPs remained intact in the presence of GF peptide and HS, the NPs were imaged with a Field Emission Scanning Electron Microscope (FESEM). Images reveal no significant differences in size, shape, or agglomeration of NPs in the presence of GF peptide and/or HS (Fig. 2). The NP size distributions were similar across conditions and had a median diameter of about 50 nm for all samples. In conjunction with the DLS results, this suggests that the NPs retain their usual structure and stability following reaction with the GF peptide and HS protein corona formation.
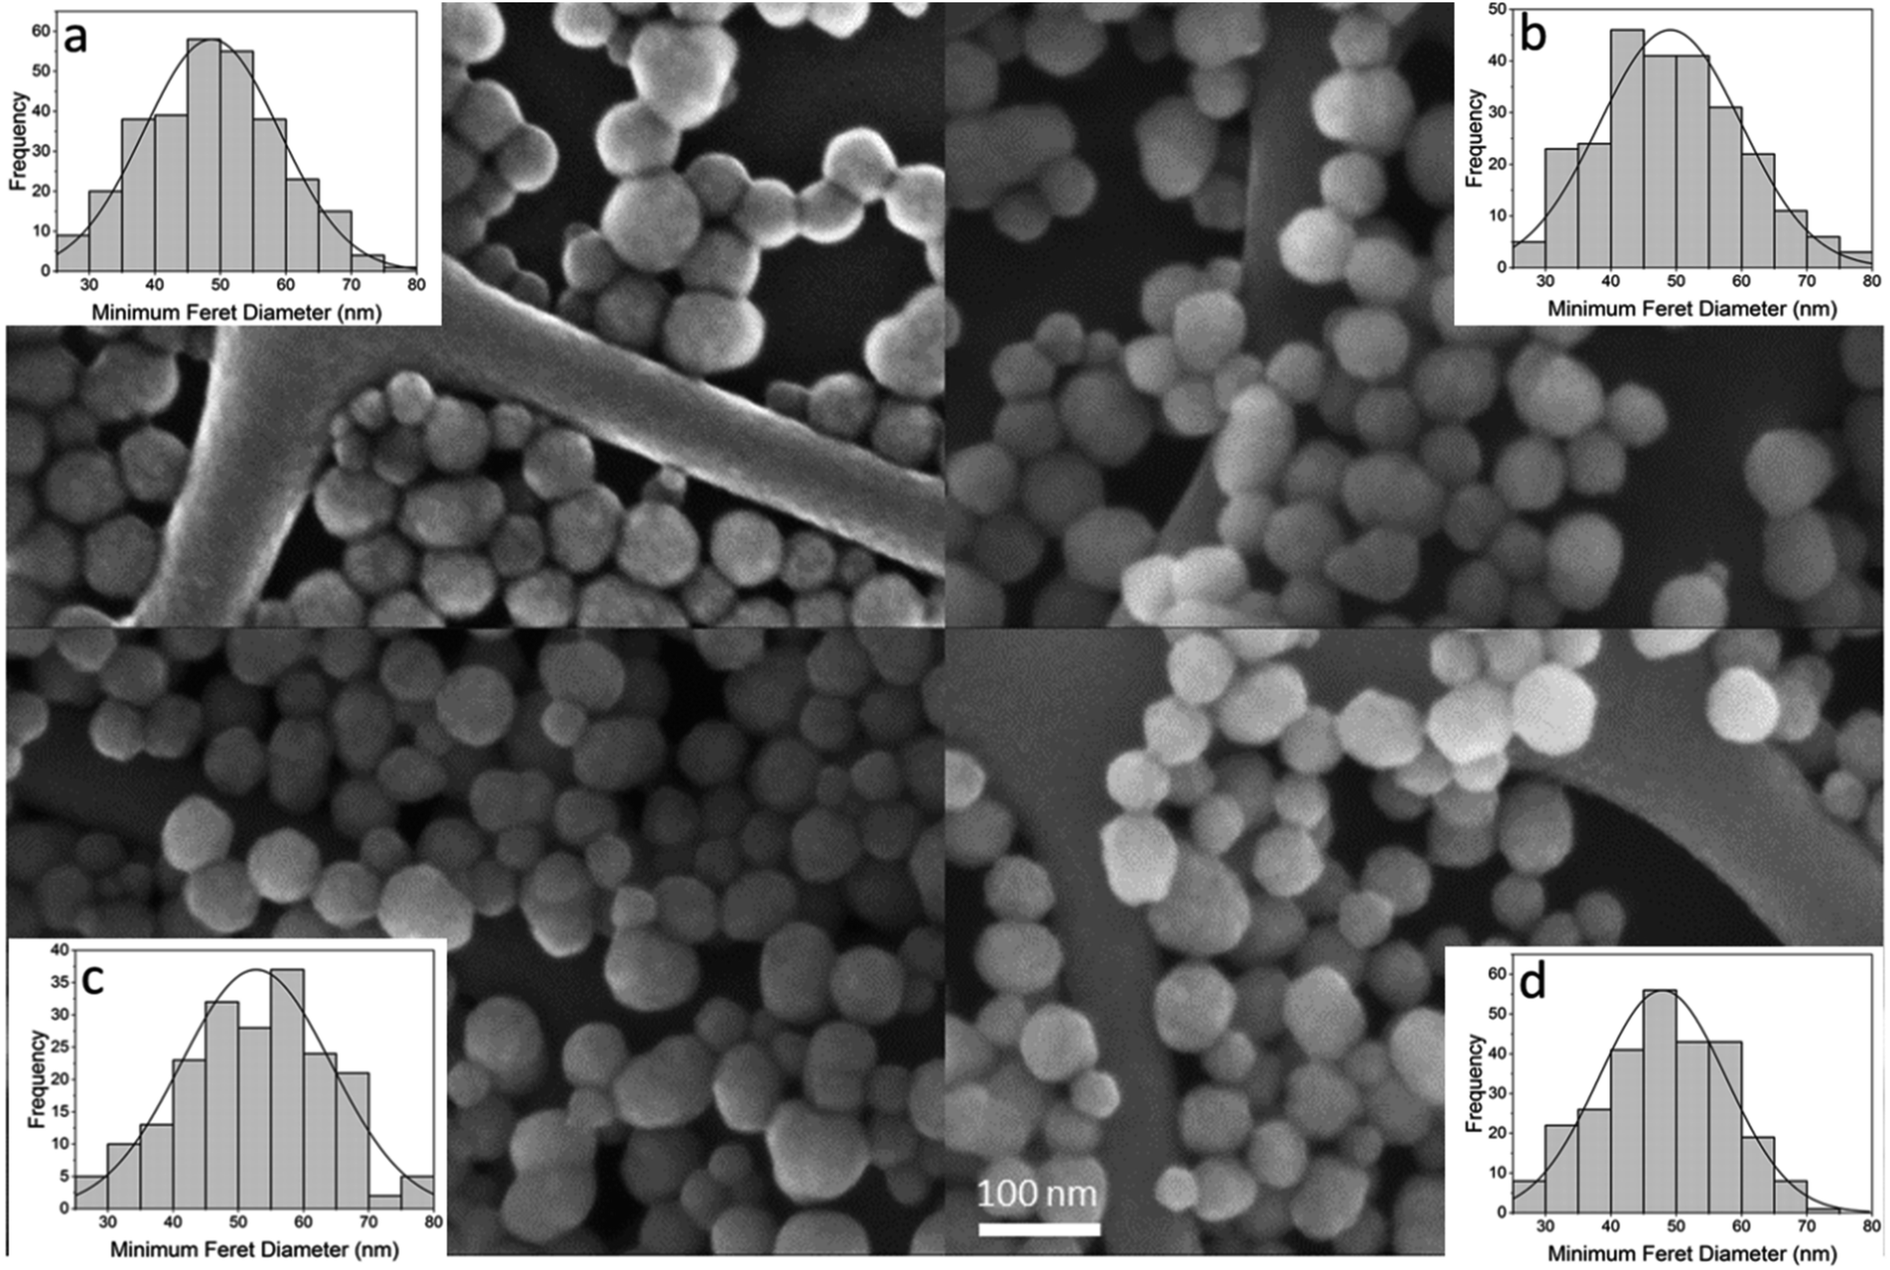 | ||
| Fig. 2 FESEM images of silica NPs with a nominal diameter of 50 nm mixed 1:1 with (a) 5 mM phosphate buffer, (b) 5 mM phosphate buffer with HS diluted 1:500, (c) 5 mM phosphate buffer with 2.5 μM GF peptide, and (d) 5 mM phosphate buffer with 2.5 μM GF peptide and HS diluted 1:500. FESEM images were recorded at an original electron-optical magnification of 1000 kX, and for all images a 100 nm scale bar is shown. Inset: distributions of minimum Feret diameters of silica NPs. Distributions generated from composite representative images containing ≥250 NPs. Particles identified and sized by ImageJ with ParticleSizer. Log-normal distribution fit produced by ParticleSizer. | ||
Nanoparticle zeta potential
The NP surface charge in each solution also provides insight into NP transformation upon GF peptide or HS corona formation, while informing mechanisms of GF peptide interaction with NPs (Fig. 3). Zeta potentials for silica NPs are uniformly negative around neutral pH due to the deprotonation of the silanol groups.22,50 The exact zeta potential for a given silica NP, however, is dependent on size22 and solution conditions, like pH. Given the narrow pH range of blood, expected changes in zeta potential are negligible. All studies were performed in low concentrations of phosphate buffer. Although other nanoparticles, like titanium dioxide, bind phosphate at their surfaces,51,52 there is no indication that silica NPs do the same. The negatively charged siloxides and hydrophobic siloxanes at the silica NP surface likely deter phosphate binding. Thus, it is quite common to use phosphate in silica NP studies, especially due to the physiological relevance of the buffer.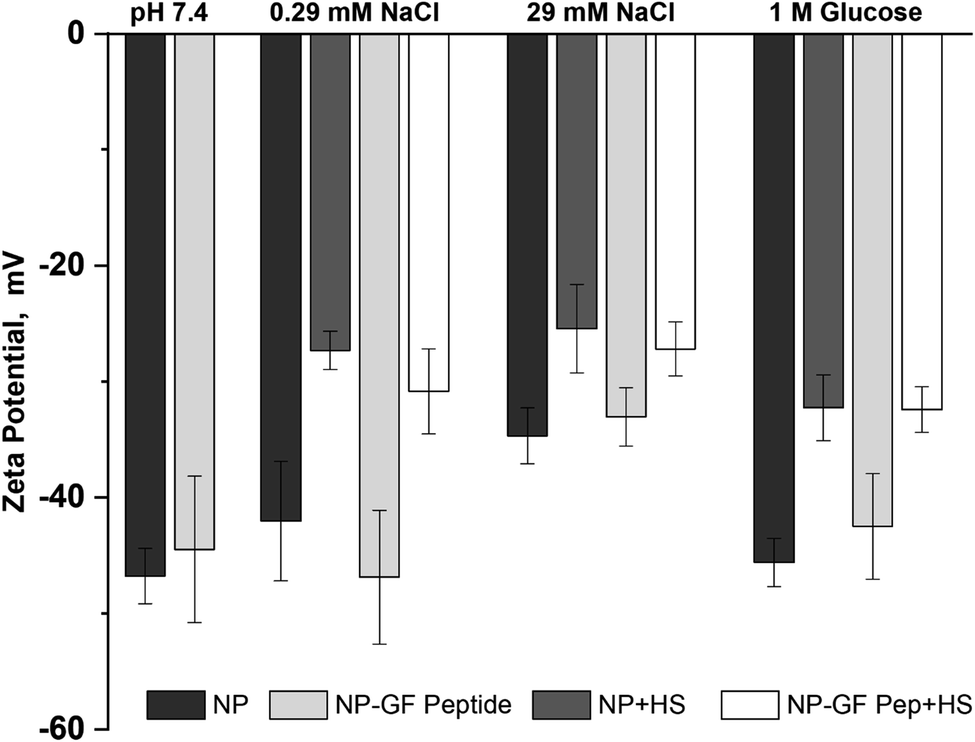 | ||
| Fig. 3 Zeta potential for NPs with and without GF peptide measured in the presence and absence of HS. All samples made in 5 mM phosphate buffer, pH 7.4 with additional solutes as listed. | ||
Across solution conditions, there is no considerable difference between the zeta potentials for NPs with and without GF peptide (within error). This remains true as 0.29 mM sodium chloride and 1 M glucose were added to solution. An increase to 29 mM sodium chloride shifted the zeta potential less negative, suggesting a charge shielding effect of the solutes.
Addition of HS, however, resulted in significantly less negative zeta potentials for NPs across all solutions with or without GF peptide present. Although also generally negatively charged, proteins in HS have a more heterogeneously charged surface, which explains the less negative zeta potential. Strikingly, the HS coated NPs all have a similar zeta potential (25–33 mV), independent of solution condition, suggesting a uniform coating of HS across conditions.
Fluorescence anisotropy
Given that GF peptide and silica NPs are stable upon interaction in all tested solution conditions, more detailed binding studies become possible. To enable fluorescence anisotropy methods for binding, the GF peptide was labeled with a fluorophore. Then, silica NPs were titrated into solutions of the fluorescently labeled GF peptide (Fig. 4). In addition to measuring GF peptide–NP binding across different solutions that include sodium chloride, glucose, and HS, we chose to also test a small range of physiologically relevant blood pHs for a healthy adult, including pH 7.2, 7.4, and 7.6. Since blood pH is tightly regulated in healthy adults between 7.35–7.45, this range is slightly beyond physiological relevance for blood.44 | ||
| Fig. 4 Fluorescence anisotropy binding curves for GF peptide titrated into silica NPs across solution conditions. All solutions were made in 5 mM phosphate buffer pH 7.4, except for the pH study solutions (pH 7.2 and 7.6). All binding curves include the titration of NPs into GF peptide within a solution of 5 mM phosphate buffer as a control to compare changes due to solution conditions. Confidence and prediction intervals (95%) are also displayed as shaded areas around each fitted curve. | ||
Importantly, fluorescence anisotropy can be performed in the presence of a complex mixture of other biomolecules. To test this, titrations were repeated across all solution conditions in the presence of diluted HS (a 1:500 dilution). Of course this is not a measure of the full impact of HS addition on GF peptide–NP interactions, but it is a low enough concentration of HS to ensure the titration curves fit well the Langmuir adsorption isotherm model (vide infra) and provided a comparison for the effects of the various solution conditions with and without HS. To assess the possibility that the GF peptide interacts with HS, which would interfere with the peptide–NP binding curves, we titrated HS into the GF peptide and found that there was no change in anisotropy across the titration. Thus, the titration of NP into GF peptide and HS solely measures the GF peptide–NP interactions, rather than peptide–HS protein interactions (Fig. S.2†).
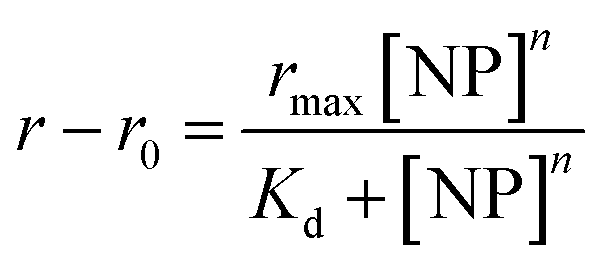
All titration curves (except at 145 mM NaCl) fit well to a Langmuir adsorption isotherm model (full fit parameters in Table S.1†), which has been used previously for protein–NP interaction studies.53–56 All samples were reproducible and gave strong fits (r2 values = 0.989–0.999, average % RSD < 5% calculated from the individual % RSD of each curve, n = 4 trials). The Langmuir isotherm includes several assumptions. First, it assumes homogeneous binding of single or submonolayer coverage.57 The hydrodynamic diameter results from DLS are consistent with monolayer, or less, coverage of GF peptide on silica NPs. Although HS increased the hydrodynamic diameter of NPs, the addition of GF peptide to this complex surface did not, suggesting the GF peptide is not forming multilayers atop the HS corona. In addition, the Langmuir isotherm assumes reversible binding and full equilibration on the experimental timescale.56 The assumption that the GF peptide binds in a monolayer and reversibly to silica NPs is consistent with previous peptide–silica NP studies.22,24,40 Experiments were designed to ensure samples were fully equilibrated by collecting data after a 2 h incubation. Fluorescence anisotropy measurements at shorter time points proved noisier (Fig. S.2†).
Dissociation binding constants (Kd) result from the Langmuir isotherm fits (Fig. 5). The dissociation constants for silica NP–GF peptide interactions are broadly in the range of many common blood proteins interacting with NPs with negative surface coatings.56,58 More specifically, the dissociation binding constants reported here are similar to other peptide–silica NP systems.23,59 In fact, the LacI fusion peptides have 19 nM dissociation constants, aligned with GF peptide (charge at pH 7.4 = 1.2).54 Yet, protein and peptide dissociation constants vary significantly. In part, this is due to variations in solution conditions, but also because peptide and NP size, composition, and charge mediate the interaction. Although the results appear consistent with previous reports, the use of a fluorescence detection method requires a fluorophore, which can influence interactions. By choosing a fluorophore with no charge or reactive/binding functional groups,60 a significantly smaller size than the peptide, and an N-terminal placement, we aimed to minimize interference from the fluorophore. Although this fluorophore does not interfere with oligomer formation in other peptides,60 we cannot rule out potential influence. Unfortunately, no other methods are available to assess peptide–NP interaction in HS. A comparison of titration results across samples can still provide insight into mechanisms of GF peptide–silica NP interaction.
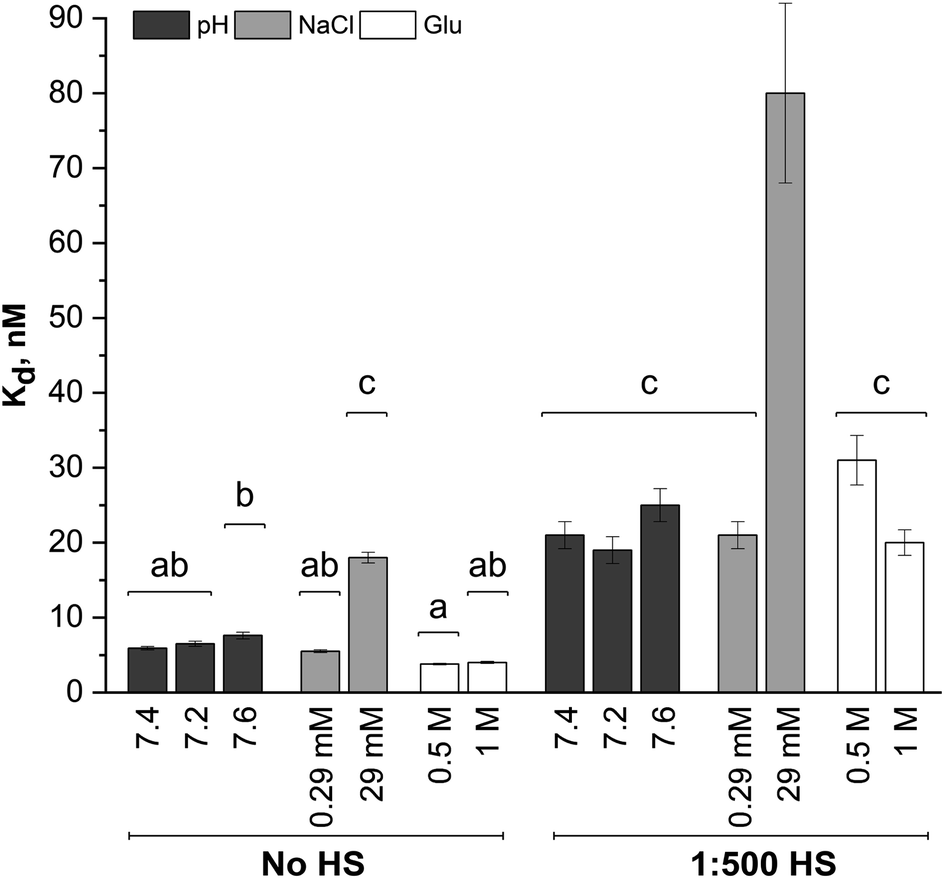 | ||
| Fig. 5 Dissociation binding constants from Langmuir adsorption isotherm fits to GF peptide–silica NP titrations across solution conditions with and without HS. Bars with the same letter indicate their means are not significantly different from each other as indicated by a Tukey post hoc test. Due to the failure to meet assumptions of the ANOVA tests and shared similarity of other conditions, the differences between groups a and b for the dissociation constants are not treated as truly significant. | ||
A two-way ANOVA was used to assess statistically significant differences in dissociation binding constants across samples. Differences in pH (7.2–7.6), a minor increase in sodium chloride (0.29 mM), and addition of glucose up to 1 M do not significantly alter the GF peptide–NP binding constant. Although this pH range is beyond physiological relevance for healthy human blood, tumor microenvironments can have a pH as low as 6.2,46,47 where pH may more significantly alter binding. Notably, the glucose concentrations evaluated here are well beyond those in blood, which are in the low mM range (up to 25 mM). Since no discriminate effect was seen in this low range; experiments were performed at significantly higher concentrations to push the limits in the system. We are confident, then, that the minor variations in pH within healthy human blood and any physiologically relevant concentration of glucose would not alter GF peptide–silica NP interactions. Notably, however, physiologically relevant pH ranges can vary more, e.g. lysosomes (pH 4.5–5.5), endosomes (pH 6.5), or a tumor microenvironment (pH 6.5–6.9). Across this broader pH range, the charge of the peptide and zeta potential of the silica NPs22 will vary and likely alter the interaction.
The addition of HS, even at a 1:500 dilution, significantly increases the Kd across all solution conditions. The minor changes in pH, sodium chloride concentrations (0.29 mM), and glucose are again insignificant even in the presence of HS. As HS concentrations increase toward physiologically relevant conditions, the GF peptide–NP would be further weakened. We speculate that this weakened binding is due to either competition at the NP surface, or weakened electrostatic interactions due to the decreased negative charge of the NP with an HS protein corona (as indicated by zeta potential measurements).
Within the study conditions, the addition of sodium chloride at the highest concentrations (29 mM) studied results in the greatest change in dissociation constant at five times higher than in buffer alone. This change is so significant, it renders the addition of diluted HS insignificant, as the ANOVA analysis groups the 29 mM NaCl samples with and without HS together. Increasing sodium chloride concentrations increases ionic strength and shields electrostatic interactions. The weakened binding as sodium chloride concentrations increase is indicative of an electrostatic peptide–NP interaction.40 Zeta potential results clearly indicated the silica NP is negatively charged. The GF peptide did not significantly shift the zeta potential; yet the one arginine and two lysines in the peptide sequence, as opposed to only one negative glutamate, indicate the peptide is slightly positively charged (calculated charge at pH 7.4 = 1.8). Although anisotropy techniques do not provide detailed insight into the binding mechanism, these results, combined, are consistent with other studies of similar peptides binding to silica NPs via positively charged amino acids and hydrogen bonds.24,39–41
In these fluorescence anisotropy binding studies, measurable dissociation constants were obtained at HS concentrations 500× lower and sodium chloride concentrations 5× lower than that in the bloodstream of a healthy adult. Although we studied binding at more typical physiological sodium chloride concentrations, 145 mM, the binding profile no longer conforms to a Langmuir adsorption model. Moreover, in solutions containing HS, binding completely breaks down. Although the addition of HS was insignificant by comparison to the sodium chloride effects under study conditions, the 29 mM concentration of sodium chloride is an order of magnitude closer than to true concentrations blood than the test concentrations of HS (at a 1:500 dilution). The interaction between GF peptide–NP will surely be weaker in physiologically relevant concentrations of HS and sodium chloride and, further, the more dramatic increase in HS concentration will likely weaken the interaction more than the increase in sodium chloride.
Conclusion
Fluorescence anisotropy enables evaluation of the interaction between GF peptides and silica NPs across solution conditions. Full characterization of silica NPs with and without the GF peptide reveals that both are structurally sound and stable through the interaction and across solution conditions, which suggests that the changes in fluorescence anisotropy signal in the binding assay are solely due to GF peptide adsorption. Data fit well to a Langmuir adsorption isotherm, suggesting the binding interaction is reversible and results in a single or submonolayer coverage of the silica NPs. Results indicate the GF peptide, which is slightly positive at pH 7.4, and silica NPs have an electrostatic interaction via charged amino acids or H-bonding, which weakens with the addition of sodium chloride. Although anisotropy techniques do not provide detailed insight into the binding mechanism, these results, combined, are consistent with other studies of similar peptides binding to silica NPs via positively charged amino acids and hydrogen bonds.24,39–41 Silica NP charge and surface curvature change with size,22,61 suggesting that these results may also vary with silica NP size and surface coating.Because the fluorescent probe is only on the GF peptide, fluorescence anisotropy allowed us to also monitor the GF peptide silica NP interaction within the complexity of HS, a yet unexplored parameter. The addition of just a 1:500 diluted solution of HS increases the dissociation constant by a factor of 3.5, while also decreasing the overall GF peptide load on the NP. This weakened adsorption is either due to competition for the silica surface, or simply due to an increase in the zeta potential of the silica NPs upon addition of HS. At physiologically relevant concentrations of HS, we anticipate further weakening of the interaction and potential displacement of the GF peptide from the surface of the silica NPs entirely.
Reaction conditions were chosen to reflect physiologically relevant conditions within the human bloodstream. Variations in pH, sodium chloride, and glucose levels can be found across individuals or even within an individual throughout the day. In light of reports highlighting more extreme changes in blood due to various disease states,15,17,18 insights into the solution conditions that drive the most variation in the protein corona are necessary to best design NPs for medicinal uses. The results reported here with the GF peptide suggest that the GF peptide–NP interactions are immune to minor changes in blood pH, but interactions are sensitive to any changes in ionic strength. Perhaps most relevant to the concept of the personalized protein corona,12,13,62 changes in glucose concentration, which may vary significantly in untreated diabetes, are insignificant in mediating GF peptide binding to silica NPs. This is of particular interest because diabetes has a comorbidity with cancer, for which there are a number of nano-based drug treatments in development.15,48 Further study will be required to expand these insights beyond the GF peptide interacting with silica NPs and more broadly to other relevant study systems.
Moreover, we emphasize the utility of fluorescence anisotropy to quickly and cheaply assess the relevant features mediating the interactions between NPs and a key biomolecule of interest, even within a complex and diverse solution such as HS. The anisotropy data shown here was collected on a plate reader, making the approach medium throughput and reducing demand for large sample volumes.37 This simple and sensitive approach is applicable to a wide range of biomolecules, coronas, and NPs to gain insight into protein corona formation and changes after formation. The technique could also be applied to other types of NPs, as long as the NP does not quench the fluorophore on the peptide. A foundational understanding of the biomolecular coating on NPs will pave the way to develop more personalized medicine diagnostic and nano-therapeutic tools.
Materials and methods
Reagents and supplies
All working solutions were made in Nanopure water, and unless otherwise stated, buffered with 5 mM sodium phosphate, pH 7.4. The phosphate buffer was made by mixing the required volumes of the monobasic and dibasic solutions of sodium phosphate (Sigma-Aldrich) and adjusting to the desired pH with additional monobasic/dibasic solution while monitoring with a pH meter. HyLite™ Fluor 488 labeled γ-fibrinogen, GF peptide (sequence: YSMKETTMKIIPFNRLSIG, labeled at the N terminus, >95% purity, Anaspec Inc.)51 was used for Fluorescence Anisotropy (FA) studies, while the unlabeled counterpart was used for Dynamic Light Scattering (DLS), Zeta Potential, Circular Dichroism (CD) and Field Emission Scanning Electron Microscope (FESEM) measurements. Stock solutions of peptide were made to a final concentration of 2.5 μM in 5 mM sodium phosphate pH 7.4, unless otherwise noted. Sodium chloride and glucose (Sigma-Aldrich) solutions added to the 5 mM phosphate buffer to given concentrations, then pH adjusted to 7.4 as needed. Silica NPs (50 nm) were purchased from Polysciences Inc. (Cat# 24040-10) and diluted 10× from stock in phosphate buffer after acclimating at room temperature for 30 min (from storage at 4 °C) and vortexing for 30 s to ensure no particle agglomeration was present. Human serum, HS (Cat# H4522, Sigma-Aldrich) stock solution was added directly to the peptide working solutions to a final concentration of 1:500 (v/v). Since the NaCl concentration of the stock solution is 145 mM, a 500× dilution of HS results in a concentration of 0.29 mM NaCl.
Instrument controls for DLS and zeta potential measurements were a NIST-traceable nanosphere size standard (Thermo Scientific, Cat# 3090A) and Brookhaven Instruments' reference material BI-ZR5, respectively. The NIST reference material was made by diluting 1 drop of the stock concentration in 1.6 mL of 5 mM sodium phosphate, pH 7.4. BI-ZR5 solutions were made as indicated in the protocol provided in 1 mM KCl (Sigma Aldrich). All buffers for DLS and zeta potential experiments were filtered using 0.02 μm membrane filters (Whatman™, Cat# 6809-1002). TEM imaging was performed on samples dispensed on ultrathin carbon film coated gold grids (Ted Pella Inc., Cat # 01824G).
Fluorescence anisotropy measurements
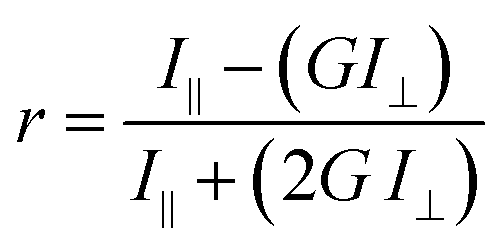
Endpoint FA measurements were made using a SpectraMax M5 Microplate Reader (Molecular Devices LLC) equipped with dual monochromators and a PMT detector. Instrument settings were as follows: λexc = 491 nm and λemi = 524 nm, PMT gain and carriage speed were set to medium at 80 flashes per read and normal, respectively. An autocalibration at the wavelengths selected as well as a 5 second plate shake was performed prior to the start of each read. All assays reported were set-up in 96-well Microfluor flat bottom plates (ThermoFischer Scientific Inc.). Experimental blank readings were generated from 5 mM sodium phosphate, pH 7.4 and subtracted from the raw titration readings prior to calculating anisotropy values using the equation:where r is the anisotropy, I‖ and I⊥ are the fluorescence emission intensities (perpendicular and parallel to the detector) measured, and G is the instrument's grating correction factor, set to 1 for all the measurements reported. Data acquisition and analysis (generation of anisotropy values) were performed employing the instrument's SoftMax Pro 7.0 software.
Each titration experiment comprised a pre-determined number of wells containing 120 μL of 2.5 μM GF peptide in the chosen solutions from Table 1. The silica NP solution was then added to each well at incremental 4 μL volumes until a saturation point on the curve was reached (determined experimentally in prior method development studies). A multichannel pipette was used to dispense and mix the NP solutions into each well. Prior to performing the fluorescence anisotropy measurements, the assays were incubated for 2 h, timed from the start of each titration. Each well on the plate corresponds to a separate assay point on the titration. Each assay was repeated 4 times to determine assay and measurement reproducibility. In addition, a control titration of NPs into GF peptide in 5 mM sodium phosphate, pH 7.4 was included in all the studies reported to monitor instrument or assay failures. Fluorescence anisotropy data was fit using with Origin® 2018b software. Curve fit parameters were calculated from the fitted data using the Langmuir adsorption isotherm model:57
Dynamic light scattering and zeta potential measurements
The effects of corona formation and solution conditions (NaCl, glucose, and HS) on the particles' hydrodynamic diameter, zeta potential, and polydispersity were assessed using a 90Plus Particle Analyzer with a Zeta-PALS optical bench (Brookhaven Instruments Corporation). DLS data was generated from intensity weighted size distributions using a 90° angle configuration. All samples, except those with glucose, had a particle refractive index, dispersant refractive index and viscosity set at 1.46, 1.33, and 0.89 cP respectively. For measurements in glucose solutions, the dispersant refractive index and viscosity were set at 1.35 and 1.1 cP.63,64 For zeta potential measurements, all samples were made by adding the GF peptide, NPs, and solution additives to a 5 mM sodium phosphate, pH 7.4 (as described in the Reagents and supplies section). All samples had a relatively constant ionic strength except for the samples with 29 mM NaCl, where ionic strength is significantly higher. Zeta potential values were calculated from electrophoretic light scattering measurements with a BIC BI-ZEL electrode assembly, using the Smoluchowski equation.GF peptide and silica NP samples were prepared at the same concentrations as those for fluorescence anisotropy binding studies within solutions outlined in Table 1. All matrices for DLS and zeta potential experiments were filtered using 0.02 μm membrane filters (Whatman Corp.). The GF peptide and NP solutions were mixed to a final volume of 2 mL and allowed to incubate for 2 h. Prior to DLS measurements, a 5 mM sodium phosphate, pH 7.4 buffer blank and a NIST traceable nanosphere size standard (92 nm Polystyrene, ThermoFischer Scientific) were measured to validate instrument performance. Zeta potential daily instrument validation was done using a 1 mM KCl blank and the BI-ZR5 reference material from Brookhaven Instruments Corp. Hydrodynamic diameter and polydispersity values reported are the average of 2 sample replicates and 2 technical replicates. Zeta potential values were generated from 3 sample replicates.
FESEM imaging
FESEM imaging was performed on samples dispensed on ultrathin carbon film coated gold grids (Ted Pella Inc.). Uncoated NP silica spheres were examined in a Carl Zeiss Ultra55 FESEM at accelerating voltages in the range 500 V to 6.66 keV using in-column annular secondary electron (in-Lens SE) and energy selective backscattered electron (EsB) detectors. No post-processing of the electron micrographs was performed. NP sizes were measured by ImageJ ParticleSizer analysis using a minimum Feret diameter lower bound of 18 nm to evaluate FESEM images containing at least 250 ParticleSizer-detected particles. Distribution figures include a log-normal fit produced by ParticleSizer.Circular dichroism measurements
The secondary structure of the GF peptide with and without NPs was evaluated using an Olis DSM 1000 circular dichroism spectrophotometer. Peptide solutions were mixed and allowed to incubate at room temperature for 2 h prior to CD measurements (also at room temperature). Measurements of 25 μM GF peptide were taken in a quartz cuvette (0.1 cm path length). For all samples, ellipticity was measured from 185 nm to 260 nm with a point every 0.5 nm and an integration time of 5 seconds. Spectra were smoothed using a 15-point Savitzky–Golay filter.ANOVA analysis
To assess the significance of deviation within the hydrodynamic diameter measurements and dissociation constants, ANOVA and Tukey post-hoc test were conducted in R (code provided in supplemental) to compare the means. A one-way ANOVA was used to compare hydrodynamic diameters for NPs with and without GF–peptide, while a two-way ANOVA was used to compare dissociation constants for samples with and without HS. Finally, a three-way ANOVA provided comparison of dissociation constants across solution conditions, presence of HS, and presence GF–peptides.The data was first checked for homoscedasticity and normal distribution ANOVA residuals using Levene's test and Shapiro–Wilke's test respectively (Table S.2†). If the data did meet these assumptions of an ANOVA, it was log-transformed. As the hydrodynamic diameter measurements met the assumptions of homoscedasticity and normal distribution either before or after log transformation, an ANOVA was appropriately used. The fluorescence anisotropy data, including dissociation constants and maximum values, did not meet the parametric assumptions. Due to the ANOVA's robustness to normality violations, the analysis was conducted to corroborate the trends that were visually identified. If the results of an ANOVA indicated there was significant variation in means among all conditions tested, a Tukey post-hoc test was used to identify which pairings of conditions were significantly different, using a 95% confidence interval.
Abbreviations
| GF | Gamma-fibrinogen |
| HS | Human serum |
| NP | Nanoparticle |
| FESEM | Field emission scanning electron microscope |
| DLS | Dynamic light scattering |
Conflicts of interest
There are no conflicts to declare.Acknowledgements
This research was supported by the National Institutes of Health awarded to K. E. W. under award number R15ES025929. We thank Paul Abbyad, Ph.D. (SCU) for sharing his expertise in fluorescence anisotropy and C.L. would like to thank the Bastiani Family for summer research support. We thank Carmen Domingo, Ph.D. for support of the electron microscopy core facility at SFSU. The FESEM and supporting facilities were obtained under NSF-MRI award #0821619 and NSF-EAR award #0949176, respectively.References
- A. Albanese, C. D. Walkey, J. B. Olsen, H. Guo, A. Emili and W. C. W. Chan, Secreted Biomolecules Alter the Biological Identity and Cellular Interactions of Nanoparticles, ACS Nano, 2014, 8(6), 5515–5526 CrossRef PubMed.
- D. Walczyk, F. B. Bombelli, M. P. Monopoli, I. Lynch and K. A. Dawson, What the Cell “Sees” in Bionanoscience, J. Am. Chem. Soc., 2010, 132(16), 5761–5768 CrossRef PubMed.
- S. Park and K. Hamad-Schifferli, Nanoscale Interfaces to Biology, Curr. Opin. Chem. Biol., 2010, 14(5), 616–622 CrossRef PubMed.
- M. Bros, L. Nuhn, J. Simon, L. Moll, V. Mailänder, K. Landfester and S. Grabbe, The Protein Corona as a Confounding Variable of Nanoparticle-Mediated Targeted Vaccine Delivery, Front. Immunol., 2018, 9, 1760 CrossRef PubMed.
- A. A. Shemetov, I. Nabiev and A. Sukhanova, Molecular Interaction of Proteins and Peptides with Nanoparticles, ACS Nano, 2012, 6(6), 4585–4602 CrossRef PubMed.
- I. Lynch, T. Cedervall, M. Lundqvist, C. Cabaleiro-Lago, S. Linse and K. A. Dawson, The Nanoparticle-Protein Complex as a Biological Entity; a Complex Fluids and Surface Science Challenge for the 21st Century, Adv. Colloid Interface Sci., 2007, 134–135, 167–174 CrossRef PubMed.
- P. Aggarwal, J. B. Hall, C. B. McLeland, M. A. Dobrovolskaia and S. E. McNeil, Nanoparticle Interaction with Plasma Proteins as It Relates to Particle Biodistribution, Biocompatibility and Therapeutic Efficacy, Adv. Drug Delivery Rev., 2009, 61(6), 428–437 CrossRef PubMed.
- C. C. Fleischer, U. Kumar and C. K. Payne, Cellular Binding of Anionic Nanoparticles Is Inhibited by Serum Proteins Independent of Nanoparticle Composition, Biomater. Sci., 2013, 1(9), 975–982 RSC.
- C. D. Walkey, J. B. Olsen, F. Song, R. Liu, H. Guo, D. W. H. Olsen, Y. Cohen, A. Emili and W. C. W. Chan, Protein Corona Fingerprinting Predicts the Cellular Interaction of Gold and Silver Nanoparticles, ACS Nano, 2014, 8(3), 2439–2455 CrossRef PubMed.
- M. Mahmoudi, Debugging Nano–Bio Interfaces: Systematic Strategies to Accelerate Clinical Translation of Nanotechnologies, Trends Biotechnol., 2018, 36(8), 755–769 CrossRef.
- M. J. Hajipour, S. Laurent, A. Aghaie, F. Rezaee and M. Mahmoudi, Personalized Protein Coronas: A “Key” Factor at the Nanobiointerface, Biomater. Sci., 2014, 2, 1210–1221 RSC.
- C. Corbo, R. Molinaro, M. Tabatabaei, O. C. Farokhzad and M. Mahmoudi, Personalized Protein Corona on Nanoparticles and Its Clinical Implications, Biomater. Sci., 2017, 5(3), 378–387 RSC.
- M. Tavakol, A. Montazeri, R. Naghdabadi, M. J. Hajipour, S. Zanganeh, G. Caracciolo and M. Mahmoudi, Disease-Related Metabolites Affect Protein-Nanoparticle Interactions, Nanoscale, 2018, 10, 7108–7115 RSC.
- M. J. Hajipour, J. Raheb, O. Akhavan, S. Arjmand, O. Mashinchian, M. Rahman, M. Abdolahad, V. Serpooshan, S. Laurent and M. Mahmoudi, Personalized Disease-Specific Protein Corona Influences the Therapeutic Impact of Graphene Oxide, Nanoscale, 2015, 7(19), 8978–8994 RSC.
- S. Wan, P. M. Kelly, E. Mahon, H. Stöckmann, P. M. Rudd, F. Caruso, K. A. Dawson, Y. Yan and M. P. Monopoli, The “Sweet” Side of the Protein Corona: Effects of Glycosylation on Nanoparticle-Cell Interactions, ACS Nano, 2015, 9(2), 2157–2166 CrossRef.
- S. Ritz, S. Schoettler, N. Kotman, G. Baier, A. Musyanovych, J. Kuharev, K. Landfester, H. Schild, O. Jahn and S. Tenzer, et al., Protein Corona of Nanoparticles: Distinct Proteins Regulate the Cellular Uptake, Biomacromolecules, 2015, 16(4), 1311–1321 CrossRef.
- T. Heyduk, Y. Ma, H. Tang and R. H. Ebright, Fluorescence Anisotropy: Rapid, Quantitative Assay for Protein-DNA and Protein-Protein Interaction, Methods Enzymol., 1996, 274, 492–503 Search PubMed.
- H. Zhang, Q. Wu and M. Y. Berezin, Fluorescence Anisotropy (Polarization): From Drug Screening to Precision Medicine, Expert Opin. Drug Discovery, 2015, 10(11), 1145–1161 CrossRef PubMed.
- S. Wang, C. Zhang, S. K. Nordeen and D. J. Shapiro, Vitro Fluorescence Anisotropy Analysis of the Interaction of Full-Length SRC1a with Estrogen Receptors α and β Supports an Active Displacement Model for Coregulator Utilization, J. Biol. Chem., 2007, 282(5), 2765–2775 CrossRef PubMed.
- G. U. Nienhaus, P. Maffre and K. Nienhaus, Studying the Protein Corona on Nanoparticles by FCS, Methods Enzymol., 2013, 519, 115–137 Search PubMed.
- M. Martinez-Moro, D. Di Silvio and S. E. Moya, Fluorescence Correlation Spectroscopy as a Tool for the Study of the Intracellular Dynamics and Biological Fate of Protein Corona, Biophys. Chem., 2019, 253, 106211 CrossRef PubMed.
- V. Puddu and C. C. Perry, Interactions at the Silica-Peptide Interface: The Influence of Particle Size and Surface Functionality, Langmuir, 2014, 30(1), 227–233 CrossRef PubMed.
- U. O. S. Seker and H. V. Demir, Material Binding Peptides for Nanotechnology, Molecules, 2011, 16(2), 1426–1451 CrossRef PubMed.
- A. Sola-Rabada, M. Michaelis, D. J. Oliver, M. J. Roe, L. Colombi Ciacchi, H. Heinz and C. C. Perry, Interactions at the Silica-Peptide Interface: Influence of the Extent of Functionalization on the Conformational Ensemble, Langmuir, 2018, 34(28), 8255–8263 CrossRef PubMed.
- M. Rahimi, E.-P. Ng, K. Bakhtiari, M. Vinciguerra, H. A. Ahmad, H. Awala, S. Mintova, M. Daghighi, F. Bakhshandeh Rostami and M. de Vries, et al., Zeolite Nanoparticles for Selective Sorption of Plasma Proteins, Sci. Rep., 2015, 5(1), 17259 CrossRef PubMed.
- A. Solorio-Rodríguez, V. Escamilla-Rivera, M. Uribe-Ramírez, A. Chagolla, R. Winkler, C. M. García-Cuellar and A. De Vizcaya-Ruiz, A Comparison of the Human and Mouse Protein Corona Profiles of Functionalized SiO2 Nanocarriers, Nanoscale, 2017, 9(36), 13651–13660 RSC.
- W. Lai, Q. Wang, L. Li, Z. Hu, J. Chen and Q. Fang, Interaction of Gold and Silver Nanoparticles with Human Plasma: Analysis of Protein Corona Reveals Specific Binding Patterns, Colloids Surf., B, 2017, 152, 317–325 CrossRef PubMed.
- J. Deng, M. Sun, J. Zhu and C. Gao, Molecular Interactions of Different Size AuNP–COOH Nanoparticles with Human Fibrinogen, Nanoscale, 2013, 5(17), 8130 RSC.
- H. Derakhshankhah, A. Hosseini, F. Taghavi, S. Jafari, A. Lotfabadi, M. R. Ejtehadi, S. Shahbazi, A. Fattahi, A. Ghasemi and E. Barzegari, et al., Molecular Interaction of Fibrinogen with Zeolite Nanoparticles, Sci. Rep., 2019, 9(1), 1558 CrossRef PubMed.
- B. Kharazian, S. E. Lohse, F. Ghasemi, M. Raoufi, A. A. Saei, F. Hashemi, F. Farvadi, R. Alimohamadi, S. A. Jalali and M. A. Shokrgozar, et al., Bare Surface of Gold Nanoparticle Induces Inflammation through Unfolding of Plasma Fibrinogen, Sci. Rep., 2018, 8(1), 12557 CrossRef PubMed.
- L. Wang, C. Cui, R. Li, S. Xu, H. Li, L. Li and J. Liu, Study on the Oxidation of Fibrinogen Using Fe3O4 Magnetic Nanoparticles and Its Influence to the Formation of Fibrin, J. Inorg. Biochem., 2018, 189, 58–68 CrossRef PubMed.
- V. Shirshahi and M. Soltani, Solid Silica Nanoparticles: Applications in Molecular Imaging, Contrast Media Mol. Imaging, 2015, 10(1), 1–17 CrossRef PubMed.
- H.-R. Jia, Y.-X. Zhu, Q.-Y. Duan, Z. Chen and F.-G. Wu, Nanomaterials Meet Zebrafish: Toxicity Evaluation and Drug Delivery Applications, J. Controlled Release, 2019, 311–312, 301–318 CrossRef PubMed.
- Y. Song, Y. Li, Q. Xu and Z. Liu, Mesoporous Silica Nanoparticles for Stimuli-Responsive Controlled Drug Delivery: Advances, Challenges, and Outlook, Int. J. Nanomed., 2017, 12, 87–110 CrossRef CAS PubMed.
- Y. Feng, N. Panwar, D. J. H. Tng, S. C. Tjin, K. Wang and K. T. Yong, The Application of Mesoporous Silica Nanoparticle Family in Cancer Theranostics, Coord. Chem. Rev., 2016, 319(15), 86–109 CrossRef CAS.
- K. Hata, K. Higashisaka, K. Nagano, Y. Mukai, H. Kamada, S. Tsunoda, Y. Yoshioka and Y. Tsutsumi, Evaluation of Silica Nanoparticle Binding to Major Human Blood Proteins, Nanoscale Res. Lett., 2014, 9(1), 668 CrossRef PubMed.
- M. Lundqvist, I. Sethson, B.-H. H. Jonsson, M. Martin Lundqvist, I. Sethson, B. Jonsson, M. Lundqvist, I. Sethson and B.-H. H. Jonsson, Protein Adsorption onto Silica Nanoparticles: Conformational Changes Depend on the Particles' Curvature and the Protein Stability, Langmuir, 2004, 20(24), 10639–10647 CrossRef CAS PubMed.
- Z. Li, J. C. Barnes, A. Bosoy, J. F. Stoddart and J. I. Zink, Mesoporous Silica Nanoparticles in Biomedical Applications, Chem. Soc. Rev., 2012, 41(7), 2590–2605 RSC.
- G. Grasso, S. Mercuri, A. Danani and M. A. Deriu, Biofunctionalization of Silica Nanoparticles with Cell-Penetrating Pepties: Asorption Mechanism an Bining Energy Estimation, J. Phys. Chem. B, 2019, 123(50), 10622–10630 CrossRef CAS PubMed.
- B. Hellner, S. B. Lee, A. Subramaniam, V. R. Subramanian and F. Baneyx, Modeling the Cooperative Adsorption of Solid-Binding Proteins on Silica: Molecular Insights from Surface Plasmon Resonance Measurements, Langmuir, 2019, 35(14), 5013–5020 CrossRef CAS PubMed.
- S. V. Patwardhan, F. S. Emami, R. J. Berry, S. E. Jones, R. R. Naik, O. Deschaume, H. Heinz and C. C. Perry, Chemistry of Aqueous Silica Nanoparticle Surfaces and the Mechanism of Selective Peptide Adsorption, J. Am. Chem. Soc., 2012, 134(14), 6244–6256 CrossRef CAS PubMed.
- V. Puddu and C. C. Perry, Peptide Adsorption on Silica Nanoparticles: Evidence of Hydrophobic Interactions, ACS Nano, 2012, 6(7), 6356–6363 CrossRef CAS PubMed.
- B. Shi, Y. K. Shin, A. A. Hassanali and S. J. Singer, DNA Binding to the Silica Surface, J. Phys. Chem. B, 2015, 119(34), 11030–11040 CrossRef CAS PubMed.
- D. L. Nelson, A. L. Lehninger and M. M. Cox, Lehninger Principles of Biochemistry, W.H. Freeman, 2008 Search PubMed.
- S. M. Kelly, T. J. Jess and N. C. Price, How to Study Proteins by Circular Dichroism, Biochim. Biophys. Acta, 2005, 1751(2), 119–139 CrossRef CAS PubMed.
- J. A. Yang, B. J. Johnson, S. Wu, W. S. Woods, J. M. George and C. J. Murphy, Study of Wild-Type α-Synuclein Binding and Orientation on Gold Nanoparticles, Langmuir, 2013, 29(14), 4603–4615 CrossRef CAS PubMed.
- C. Röcker, M. Pötzl, F. Zhang, W. J. Parak and G. U. Nienhaus, A Quantitative Fluorescence Study of Protein Monolayer Formation on Colloidal Nanoparticles, Nat. Nanotechnol., 2009, 4, 577–580 CrossRef PubMed.
- T. Cedervall, I. Lynch, M. Foy, T. Berggård, S. C. Donnelly, G. Cagney, S. Linse and K. A. Dawson, Detailed Identification of Plasma Proteins Adsorbed on Copolymer Nanoparticles, Angew. Chem., Int. Ed., 2007, 46(30), 5754–5756 CrossRef CAS PubMed.
- D. E. Koppel, Analysis of Macromolecular Polydispersity in Intensity Correlation Spectroscopy: The Method of Cumulants, J. Chem. Phys., 1972, 57(11), 4814–4820 CrossRef CAS.
- M. J. Limo, A. Sola-Rabada, E. Boix, V. Thota, Z. C. Westcott, V. Puddu and C. C. Perry, Interactions between Metal Oxides and Biomolecules: From Fundamental Understanding to Applications, Chem. Rev., 2018, 28, 11118–11193 CrossRef PubMed.
- Z. Xu and V. H. Grassian, Bovine Serum Albumin Adsorption on TiO2 Nanoparticle Surfaces: Effects of Ph and Coadsorption of Phosphate on Protein-Surface Interactions and Protein Structure, J. Phys. Chem. C, 2017, 121(39), 21763–21771 CrossRef CAS.
- J. Kim and K. Doudrick, Emerging Investigator Series: Protein Adsorption and Transformation on Catalytic and Food-Grade TiO2 Nanoparticles in the Presence of Dissolved Organic Carbon, Environ. Sci.: Nano, 2019, 6(6), 1688–1703 RSC.
- P. Pino, B. Pelaz, Q. Zhang, G. Ulrich and W. J. Parak, Protein Corona Formation around Nanoparticles-- from the Past to the Future, Mater. Horiz., 2014, 1(3), 301–313 RSC.
- S. H. D. P. Lacerda, J. J. Park, C. Meuse, D. Pristinski, M. L. Becker, A. Karim and J. F. Douglas, Interaction of Gold Nanoparticles with Common Human Blood Proteins, ACS Nano, 2010, 4(1), 365–379 CrossRef PubMed.
- J. M. Dennison, J. M. Zupancic, W. Lin, J. H. Dwyer and C. J. Murphy, Protein Adsorption to Charged Gold Nanospheres as a Function of Protein Deformability, Langmuir, 2017, 33(31), 7751–7761 CrossRef CAS PubMed.
- S. P. Boulos, T. A. Davis, J. A. Yang, S. E. Lohse, A. M. Alkilany, L. A. Holland and C. J. Murphy, Nanoparticle-Protein Interactions: A Thermodynamic and Kinetic Study of the Adsorption of Bovine Serum Albumin to Gold Nanoparticle Surfaces, Langmuir, 2013, 29(48), 14984–14996 CrossRef CAS PubMed.
- G. M. S. Finette, Q. M. Mao and M. T. W. Hearn, Comparative Studies on the Isothermal Characteristics of Proteins Adsorbed under Batch Equilibrium Conditions to Ion-Exchange, Immobilised Metal Ion Affinity and Dye Affinity Matrices with Different Ionic Strength and Temperature Conditions, J. Chromatogr. A, 1997, 763(1–2), 71–90 CrossRef CAS PubMed.
- S. H. De Paoli Lacerda, J. J. Park, C. Meuse, D. Pristinski, M. L. Becker, A. Karim and J. F. Douglas, Interaction of Gold Nanoparticles with Common Human Blood Proteins, ACS Nano, 2010, 4(1), 365–379 CrossRef CAS PubMed.
- H. Chen, X. Su, K.-G. Neoh and W.-S. Choe, Engineering LacI for Self-Assembly of Inorganic Nanoparticles on DNA Scaffold through the Understanding of LacI Binding to Solid Surfaces, Adv. Funct. Mater., 2009, 19(8), 1186–1192 CrossRef CAS.
- L. M. Jungbauer, C. Yu, K. J. Laxton and M. J. LaDu, Preparation of Fluorescently-Labeled Amyloid-Beta Peptide Assemblies: The Effect of Fluorophore Conjugation on Structure and Function, J. Mol Recognit., 2009, 22(5), 403–413 CrossRef CAS PubMed.
- Y. R. Shi, M. P. Ye, L. C. Du and Y. X. Weng, Experimental Determination of Particle Size-Dependent Surface Charge Density for Silica Nanospheres, J. Phys. Chem. C, 2018, 122(41), 23764–23771 CrossRef CAS.
- M. J. Hajipour, S. Laurent, A. Aghaie, F. Rezaee and M. Mahmoudi, Personalized Protein Coronas: A “Key” Factor at the Nanobiointerface, Biomater. Sci., 2014, 2(9), 1210–1221 RSC.
- A. Weatherbee, I. Popov and A. Vitkin, Accurate Viscosity Measurements of Flowing Aqueous Glucose Solutions with Suspended Scatterers Using a Dynamic Light Scattering Approach with Optical Coherence Tomography, J. Biomed. Opt., 2017, 22(8), 1–10 Search PubMed.
- A. V. Malinin, A. A. Zanishevskaja, V. V. Tuchin, Y. S. Skibina and I. Y. Silokhin, Photonic Crystal Fibers for Food Quality Analysis, in Biophotonics: Photonic Solutions for Better Health Care III, ed. J. Popp, W. Drexler, V. V. Tuchin and D. L. Matthews, SPIE, 2012, vol. 8427, p. 842746 Search PubMed.
Footnote |
| † Electronic supplementary information (ESI) available. See DOI: 10.1039/c9na00793h |
| This journal is © The Royal Society of Chemistry 2020 |