 Open Access Article
The detection and identification of dengue virus serotypes with quantum dot and AuNP regulated localized surface plasmon resonance†
Ankan Dutta
Chowdhury
a,
Kenshin
Takemura
b,
Indra Memdi
Khorish
c,
Fahmida
Nasrin
b,
Mya Myat
Ngwe Tun
d,
Kouichi
Morita
d and
Enoch Y.
Park
 *abc
*abc
aResearch Institute of Green Science and Technology, Shizuoka University, 836 Ohya Suruga-ku, Shizuoka 422-8529, Japan. E-mail: park.enoch@shizuoka.ac.jp
bDepartment of Bioscience, Graduate School of Science and Technology, Shizuoka University, 836 Ohya Suruga-ku, Shizuoka 422-8529, Japan
cCollege of Agriculture, Graduate School of Integrated Science and Technology, Shizuoka University, 836 Ohya Suruga-ku, Shizuoka 422-8529, Japan
dDepartment of Virology, Institute of Tropical Medicine, Nagasaki University, Sakamoto 1-12-4, Nagasaki City 852-8523, Japan
First published on 13th December 2019
Abstract
The dengue hemorrhagic fever or dengue shock syndrome has become a severe human fatal disease caused by infection with one of the four closely related but serologically distinct dengue viruses (DENVs). All four dengue serotypes are currently co-circulating throughout the subtropics and tropics. Since the fatality rate increases severely when a secondary infection occurs by a virus serotype different from that of the initial infection, serotype identification is equally important as virus detection. In this study, the development and validation of a rapid and quantitative DENV serotype-specific (serotypes 1–4) biosensor are reported by optimizing the stable system between cadmium selenide tellurium sulphide fluorescent quantum dots (CdSeTeS QDs) and gold nanoparticles (AuNPs). Four different nanoprobes are designed using each primer–probe serotype-specific hairpin single-stranded DNA covalently bound at different positions to CdSeTeS QDs, which generates an altered fluorescence signal for each serotype of DENV. In fourplex reactions with free functionalized AuNPs and the four nanoprobes, the standard dilutions of the target virus DNA from 10−15 to 10−10 M were successfully detected. The limit of detection was found to be in the femtomolar range for all four serotypes, where the serotype detection ability was undoubtedly established. To confirm the applicability of this sensing performance in long chained complex RNAs, the sensor was also applied successfully to RNAs extracted from DENV culture fluids for serotype identification as well as quantification, which can lead to a potential diagnostic probe for point-of-care detection.
Introduction
Metallic nanoparticles such as Au, Ag, and Pt influence the quantum yield of adjacent fluorophores in a manner dependent on the shape, size and concentration of the nanostructure.1-3 Among the parameters, the absorption and emission of the fluorescent materials and the surface plasmon resonance wavelength of metal nanostructures, distance and spectral characteristics of nanoparticles play the most important roles in the fluorescence of the adjacent fluorophores.4–7 If all these parameters are kept constant at their optimized conditions, fluorometric systems can be established by modulating the distance between metal nanoparticles and quantum dots (QDs) based on their localized surface plasmon resonance (LSPR) effect. Recently, these types of systems have emerged as useful alternatives for enhancing the sensitivity of different detection platforms in biosensing.6,8–11 The mechanism of plasmon enhancement or quenching can be mainly attributed to the change in the excitation rate due to a local field effect from the adjacent metal nanoparticles and the change in the emission rate by surface plasmon coupled emission, which can control the fluorescence intensity.2 The application of plasmonic metallic nanoparticles in biosensing has been stimulated by the interaction of these nanoparticles with electromagnetic waves, which induces oscillations of the plasmons (free electrons) at the particle surface.1 This phenomenon has led to the development of LSPR-based biosensors for various analytes. To optimize the distance between fluorescent QDs and metal nanoparticles, short chained oligomers can be used as potential linkers. Different surface plasmon resonance effects can be achieved on QDs by varying the length of the oligomers, which can be used as new biosensor systems for DNA/RNA detection.The development of ultrasensitive DNA/RNA detection has been in great demand over the last decade for its various biomedical applications, including gene profiling, drug diffusion, and clinical diagnostics.12–17 The development of DNA/RNA detection methods in proper biosensing devices has great potential to gather maximum information from a small volume of analyte at a very low cost. In the case of viral disease detection, successful DNA/RNA based biosensors can offer significant advantages over existing diagnostic technologies such as PCR, antigen–antibody interaction or protein identification in terms of detection time and chances of reducing false positive responses.18,19 Recently, a few fluorometric reports have claimed to achieve the desired low-level detection.20–22 However, most of the detection protocols are highly dependent on PCR amplification. This still remains as the most challenging task to overcome this limitation. In case of dengue-like viral fever, which affects a significant and ever-increasing portion of the world's population annually, a low detection level without any further treatment is highly desired for the development of rapid detection tools. Recently, there have been many reports on dengue DNA detection by RT-PCR, electrochemical and fluorometric methods;23–28 however, the successful application for point of-care detection without any amplification step including the ability of serotype identification from clinically isolated RNA is rarely reported.
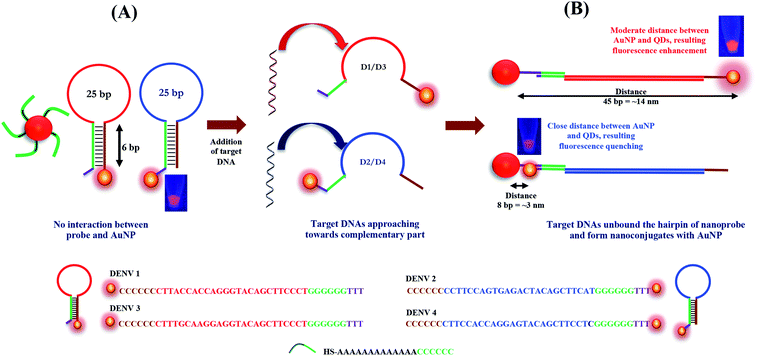
Herein, we report a new biosensing technique for the quantitative detection of DENV together with the determination of its serotype based on the distance-dependent LSPR between CdSeTeS QDs and AuNPs. Firstly, four different nanoprobes were designed as hairpin structures, where the loop portions of each hairpin are exactly complementary with the target analytes of four different DENV serotypes. The fixed regions of all the hairpins are self-complementary by six poly guanine (poly-G) and poly cytosine (poly-C), where one side is covalently bonded with CdSeTeS QDs. In addition, AuNPs functionalized with thiolated poly-C were also synthesized. In the sensing mixture of nanoprobes and the functionalized AuNPs, initially there should be no interaction between the AuNPs and the CdSeTeS QDs due to the closed hairpin structure of the single-stranded probe DNA (ssDNA). However, after the addition of the complementary DNA/RNA of DENV, it can open the hairpin structure of the nanoprobe due to the better hybridization of the nanoprobe ssDNA and complementary RNA of DENV in its loop region, leaving the poly-G region of the nanoprobe free. The poly-C-functionalized AuNPs, which are free in the sensing solution, can undergo complementary binding with the free poly-G region of the nanoprobe (as depicted in Fig. 1). The hairpin region was designed as a highly conserved sequence on the serotype of analyte DENV RNA. The distance between the QDs and the AuNPs should be determined by the base pairs of the loop region at different positions, which triggers the LSPR enhancement (at around 14 nm) or quenching (at around 3 nm) effect on the fluorescence of the QDs, depending on the distance. It is noteworthy that the extent of the LSPR-fluorescence signal changes is completely dependent on the concentration of the target analytes in the optimized condition for sensing, creating a calibration curve in the concentration range of 10−15 to 10−10 M.
Experimental
Materials
Phosphate saline buffer (PBS, pH 7.4), methanol, potassium hydroxide, polyoxyethyelene (20), sorbitan monolaurate (Tween 20), sulfuric acid, sodium citrate, tri-sodium citrate, hydrogen peroxide, chloroform and acetone were purchased from FUJIFILM Wako Pure Chemical Ind. Ltd. (Osaka, Japan). Tetramethylbenzidine (TMBZ) was purchased from Dojindo (Kumamoto, Japan). HAuCl4, N-(3-dimethylaminopropyl)-N-ethylcarbodiimide hydrochloride (EDC), bovine serum albumin (BSA), N-hydroxysuccinimide (NHS), 1-octadecene, tellurium (Te), L-cysteine, hexadecylamine (HDA), cadmium oxide (CdO), trioctylphosphine oxide (TOPO), trioctylphosphine (TOP), selenium (Se) and sulfur (S) were purchased from Sigma Aldrich (Saint Louis, MO, USA). Oleic acid was purchased from Nacalai Tesque (Kyoto, Japan).Synthesis of CdSeTeS QDs
The synthesis of the CdSeTeS QDs was carried out according to the previously reported method via organometallic hot-injection synthesis with CdO, Se, Te and S as the basic precursors.29Synthesis of AuNPs
The synthesis of AuNP was carried out via the citrate reduction method. In brief, 35 μL of 2 mM HAuCl4 and 300 μL of 100 mM tri-sodium citrate were added to 25 mL of pure boiling water in a 100 mL flask under vigorous stirring. Then the solution was boiled for 15 min until the color changed to pink. Subsequently, the AuNP solution was cooled to room temperature for further use.30Preparation of oligomeric solutions and DENV RNAs from DENV culture fluids
A calculated amount of diethyl pyrocarbonate (DEPC)-treated water, as estimated by the supplier, was added to a DNA-containing well, purchased from FASMAC (Atsugi, Japan) to obtain the concentration of 1 mM as the stock. The exact concentration of the DNA solutions was further verified by the absorption value at 260 nm in their UV-Visible spectrum (Table 1).| DNA | Sequences |
|---|---|
| a These synthetic ssDNAs were synthesized according to the conserved region of dengue RNAs, as presented in the ESI, marked in green colour. b For the selectivity test, these synthetic ssDNAs were chosen from their corresponding references. | |
| Probe DNA 1 | NH2-CCCCCCCTTACCACCAGGGTACAGCTTCCCTGGGGGGTTT |
| Probe DNA 2 | CCCCCCCCTTCCAGTGAGACTACAGCTTCATGGGGGGTTT-NH2 |
| Probe DNA 3 | NH2-CCCCCCCTTTGCAAGGAGGTACAGCTTCCCTGGGGGGTTT |
| Probe DNA 4 | CCCCCCCTTCCACCAGGAGTACAGCTTCCTCGGGGGGTTT-NH2 |
| Probe DNA for AuNP | SH-AAAAAAAAAAAACCCCCCT |
![[thin space (1/6-em)]](https://www.rsc.org/images/entities/char_2009.gif) |
|
| Target DNAs | |
| ssDNA 1a | AGGGAAGCTGTACCCTGGTGGTAAG |
| ssDNA 2a | ATGAAGCTGTAGTCTCACTGGAAGG |
| ssDNA 3a | AGGGAAGCTGTACCTCCTTGCAAAG |
| ssDNA 4a | GAGGAAGCTGTACTCCTGGTGGAAG |
![[thin space (1/6-em)]](https://www.rsc.org/images/entities/char_2009.gif) |
|
| Target DNAs for selectivity | |
| Influenza virusb | AAATACAACGGCATAATAACTGAAA31 |
| Zika virusb | TGCTAAAACGCGGAGTAGCCCGTGT32 |
| Norovirusb | TCCTGACATCATACAAGCTAACTCC33 |
![[thin space (1/6-em)]](https://www.rsc.org/images/entities/char_2009.gif) |
|
| Real samples | |
| Dengue RNAs | Given in Table S1 ESI, the region is marked in green color |
For the selectivity test, we purchased synthetic DNAs from FASMAC (Atsugi, Japan) of influenza virus (A/California/7/2009) (H1N1),31 zika virus32 and genogroup II RNA of norovirus33 according to the used DNAs mentioned in the references of their corresponding studies. In case of real sample analysis, DENV RNA was extracted from the DENV culture fluid using the High Pure RNA Isolation Kit (Roche Diagnostics, Mannheim, Germany) according to the manufacturer's instructions. The virus strains used for this study were clinical isolates from dengue patients in the Philippines as follows: DENV-1, strain 99St12A; DENV-2, strain 00St22A; DENV-3, strain SLMC50; and DENV-4, strain SLMC318.34 These viruses were propagated onto C6/36 mosquito cell lines.
Functionalization of AuNPs with SH-AAAAAAAAAAAACCCCCCT
The AuNP solution was stirred for 2 h with 0.1 mM of thiol-linked ssDNAs solution at pH 6.4, where the thiol group was covalently linked with the AuNPs. After successful functionalization of the AuNPs, the nanocomposite was washed several times with DI water and centrifuged at 6000 × g to obtain oligonucleotide-conjugated AuNPs free from excess probe ssDNA.Preparation of nanoprobes
The synthesized CdSeTeS QDs were incubated with different hairpin-structured probe ssDNAs of 0.1 mM, corresponding to each DENV serotype via the covalent interaction with the functionalized amine group of the probe ssDNAs and the –COOH group of CdSeTeS QDs to construct the nanoprobe.3 In brief, 3 mg of EDC was first mixed with 10 mg of carboxylic-functionalized CdSeTeS QDs and then further activated with 5 mg of NHS for 30 min before the addition of functionalized ssDNAs. The reaction mixture was then stirred overnight for the maximum conjugation of the probe ssDNA with the QDs and then purified by centrifugation (3000 × g) for 5 min. Consequently, four types of hairpin-structured DENV 1–4 nanoprobes were obtained.Physicochemical analysis
Transmission electron microscopy (TEM) images were obtained using a TEM (JEM-2100F; JEOL, Tokyo, Japan) operated at 200 kV to check the size and surface morphology of the as synthesized nanocomposites. UV-Vis absorption and fluorescence spectra were obtained using a filter-based multimode microplate reader (Infinite® F500; TECAN, Ltd, Männedorf, Switzerland). X-ray diffraction (XRD) was carried out for all samples in dried powder form using a RINT ULTIMA XRD (Rigaku Co., Tokyo, Japan) with an Ni filter and a Cu-Kα source. Dynamic light scattering (DLS) measurements were performed using a Zetasizer Nano series (Malvern Inst. Ltd., Malvern, UK). The different chemical environments of the CdSeTeS QDs nanocomposites before and after the conjugation of AuNPs were accounted thorough FTIR (ATR 8700, Shimadzu Co., Tokyo, Japan). The samples were dried in an oven and then mixed homogenously with dried crystals of KBr to make pellets. Then the pellets were immediately used for the FTIR analysis to avoid any water absorption.LSPR-mediated DENV serotype identification principle
Fig. 1 displays a schematic overview of the preparation and detection principle of the biosensor. Firstly, CdSeTeS QDs conjugated with the hairpin ssDNAs were synthesized, as mentioned above, and then mixed with the functionalized AuNP solution. There was no specific interaction occurring due to the close-loop structure of the hairpin ssDNA in the nanoprobe. However, after the addition of the target ssDNA/RNA sequences of each DENV serotype, the target ssDNAs opened up the complementary ssDNA loop sequence of the hairpin, forming a DNA/DNA or DNA/RNA hybridization. Thus, in this stage, a linear strand of the probe ssDNA conjugated with the QDs could be achieved, where the target DNA/RNAs were aligned with the nanoprobe through strong complementary binding. Initially, the synthetic ssDNA and probe ssDNAs were used for analysis. In the next case, real RNA samples were used for sensing. Before the addition of the target RNAs, they were heated to 95 °C to denature any secondary structure between themselves and then added to the sensing solution immediately at room temperature. The probe ssDNAs concentration was always maintained at 1.1 × 10⁻⁹ M while the target ssDNAs concentration was varied from 10−9 to 10−15 M. Since a slight excess amount of probe ssDNAs should not affect the fluorescence of the resulting solution (Fig. S1, ESI†), we used a slightly higher amount of probe ssDNAs with respect to the target ssDNA of 100 μL. In addition, the poly-C-functionalized AuNPs, which were free in the sensing solution, also underwent complementary binding with the free poly-G region of the nanoprobe. Therefore, in all four cases of the DENV serotypes, the target DNA/RNAs formed a linear structure of AuNP-complementary DNA/RNA-CdSeTeS QDs. Depending on the nanoprobe design, the QDs should be present either in the far end or very close to the AuNP, as shown in the Fig. 1. Since the enhancement or quenching of the fluorescence signal was triggered based on the distance between the QDs and the bonded plasmonic AuNPs, different changes in the signal occur with different analytes. The extent of the fluorescence enhancement/quenching of the QDs was dependent on the LSPR signal from the AuNPs, which was equivalent to the concentration of the target DNA/RNA.Results and discussion
Characterization of CdSeTeS QD–dsDNA–AuNP nanocomposites
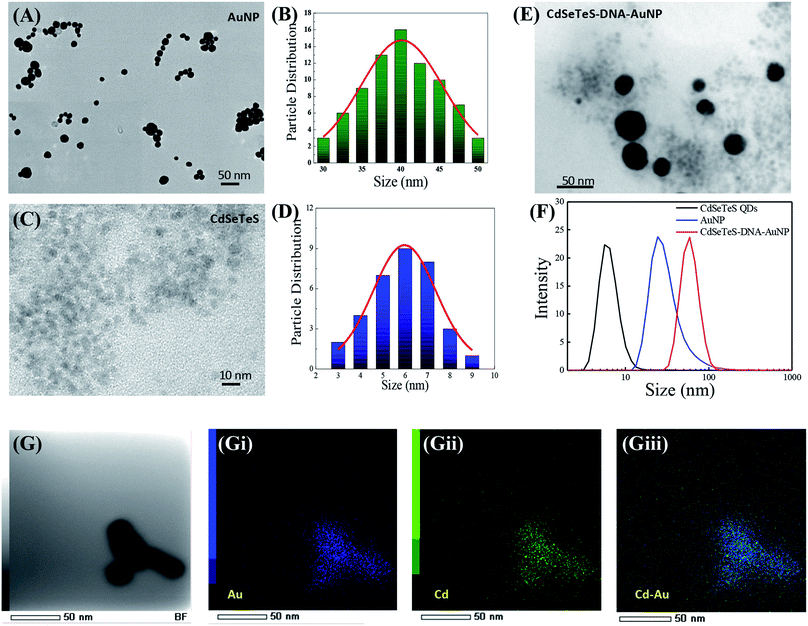
The TEM image of the as-synthesized AuNPs is shown in Fig. 2(A), where the spherical particle shape is consistently observed with a homogeneous distribution. The particle size distribution was calculated in Fig. 2(B) to be in the range of 30–50 nm with the average particle size of 39 ± 0.5 nm. Since the particle size of the SPR molecule can influence the LSPR intensity significantly, the homogeneity of the AuNPs is highly desirable. Similarly, the as-synthesized CdSeTeS QDs were also analyzed via TEM, which had a particle size distributed in the range of 7–15 nm with the average particle size of 11.4 ± 0.5 nm (Fig. 2(C)). The UV-Vis spectrum of the CdSeTeS QDs is presented in Fig. S2 of ESI,† showing the signature absorption hump of at 540 nm, which indicates their successful synthesis.29,35 After the successful conjugation of the nanocomposites through the analyte ssDNA, CdSeTeS QD–dsDNA–AuNP was further characterized via TEM. For the characterization, the DENV 1 target analyte was used to construct the CdSeTeS QD–dsDNA–AuNP nanocomposite. Since the other 3 target ssDNAs have a similar structure with DENV 1 and form the identical nanocomposite conformation, all the characterizations were carried out for the CdSeTeS QD–dsDNA–AuNP nanocomposite with DENV 1. In Fig. 2(E), it is clearly observed from the image that the small sized QDs (∼5.9 nm) (Fig. 2(D)) and the AuNPs (∼40 nm) were closely arranged due to the covalent attachment controlled by the short linker of the ssDNA chain. The concentration of the AuNPs was much less than that of the CdSeTeS QDs concentration, and hence relatively high amounts of QD were found near each single AuNP (Fig. 2(E)). The nanocomposite formation was further verified by hydrodynamic diameter measurement, where the hydrodynamic diameter of the CdSeTeS QD–dsDNA–AuNP nanocomposite together with its individual components was determined by DLS (Fig. 2(F)). The bare CdSeTeS QDs and AuNPs showed a hydrodynamic size of 7.5 ± 0.5 nm and 27.4 ± 1.5 nm, respectively, which is slightly different than their solid-state size calculated from the TEM image. As small sized and charged particles, the QDs and the AuNP are well solvated in aqueous buffer medium, resulting in a decrease in their hydrodynamic radius.36 In the case of the CdSeTeS QD–dsDNA–AuNP nanocomposite, it possessed a diameter of 76 ± 2.8 nm, which is larger than its individual size, confirming its agglomerated distribution, which was also corroborated by the TEM image. In the case of the elemental mapping of an isolated cluster of the CdSeTeS QD–dsDNA–AuNPs nanocomposite, as depicted in Fig. 2(G), the individual elements can be observed distinctly. The nanocomposite was mapped with Au and Cd, as shown in Fig. 2(Gi) and 2(Gii), respectively, whereas their merged image in Fig. 2(Giii) proves the successful linkage of these two components of CdSeTeS QDs and AuNP by the ssDNA chain.The nanocomposite was further characterized by XRD to illustrate the structural changes in its two crystalline components of CdSeTeS QDs and AuNPs. The crystalline nature of the bare AuNPs was confirmed by XRD analysis. In Fig. 3(A), the diffraction features of the bare AuNP show two characteristic peaks at 38.1° and 44.6°, corresponding to the (111) and (200) planes, respectively.37 Similarly, the diffraction pattern of the bare CdSeTeS QDs indicates that the QDs are highly crystalline and cubic in nature (Fig. 3(A)), exhibiting three characteristic peaks at the 2 theta values of 26.7°, 44.2° and 51.8° for the (111), (220) and (311) crystal planes, respectively.33 It is noteworthy that the position of these peaks remained almost unchanged even after conjugation with the AuNPs, indicating that the attachment only takes place in the functional groups of the CdSeTeS QDs without affecting its own crystal lattice. In addition, two small but clear peaks at 2theta = 38.1° and 44.6° appeared in the spectrum due to the incorporation of the AuNPs on the nanocomposite, confirming the successful formation of the CdSeTeS QD–dsDNA–AuNPs. However, the relative intensities of the Au peaks decreased obviously and the Au peak at 44.6° partially overlapped with the peak at 44.2° for the CdSeTeS QDs since the contribution of AuNPs is much lower than that of the CdSeTeS QDs in the CdSeTeS QD–dsDNA–AuNPs nanocomposite. Therefore, it can be concluded from the XRD results that the structural conformation of the AuNPs and QDs remained the same even after the formation of the nanocomposite. Therefore, all the changes in the fluorescence originating from the nanocomposites solely depend on the LSPR effect.
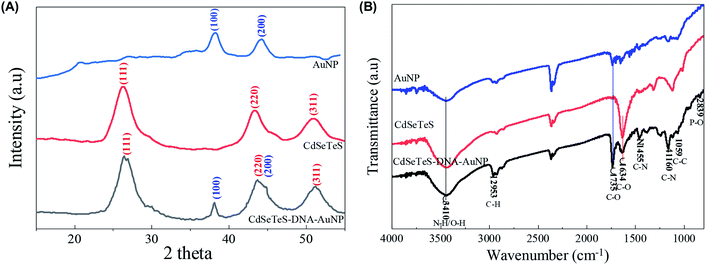 | ||
| Fig. 3 Characterization of AuNP, CdSeTeS QDs and CdSeTeS–dsDNA–AuNP nanocomposites. XRD patterns (A) and FTIR spectra (B). | ||
FTIR spectroscopy analysis was also performed to reveal the conjugation of DNA with the AuNPs and its subsequent binding to the CdSeTeS QDs, as shown in Fig. 3(B). In the case of the bare CdSeTeS QDs, the spectrum exhibited all of their standard transmitted peaks as reported earlier, particularly at 1735 cm−1, which is attributed to the asymmetric carboxylate (–COO−) group.33 In case of the bare AuNPs, their FTIR spectrum revealed the presence of different functional groups such as hydroxyl, amine and –COOH linkages. In the case of the CdSeTeS QD–dsDNA–AuNPs nanocomposite, the bands observed at 3410.1 cm−1, 2953.3 cm−1 and 1735.6 cm−1 correspond to the –OH/NH2 stretching, C–H stretching, and C–O stretching of carboxylic acid, respectively.38 The band at 1160 cm−1 represents the C–N stretching, which is quite common for DNA, indicating the presence of DNA in the AuNPs.39 The band at 1059 cm−1 is the characteristic peak assigned to the vibration of ribose (C–C sugar) or associated with the phosphate groups of DNA.40 Another indicative peak was also observed at 839 cm−1 for the antisymmetric vibration of the P–O bond of the phosphate group (839 cm−1) of DNA.41 The combination of these characteristic peaks of the nanocomposite with DNA indicates the successful formation of AuNP–DNA with the CdSeTeS QDs.
Designing four DENV nanoprobes for serotype detection employing the distance-dependent LSPR mechanism
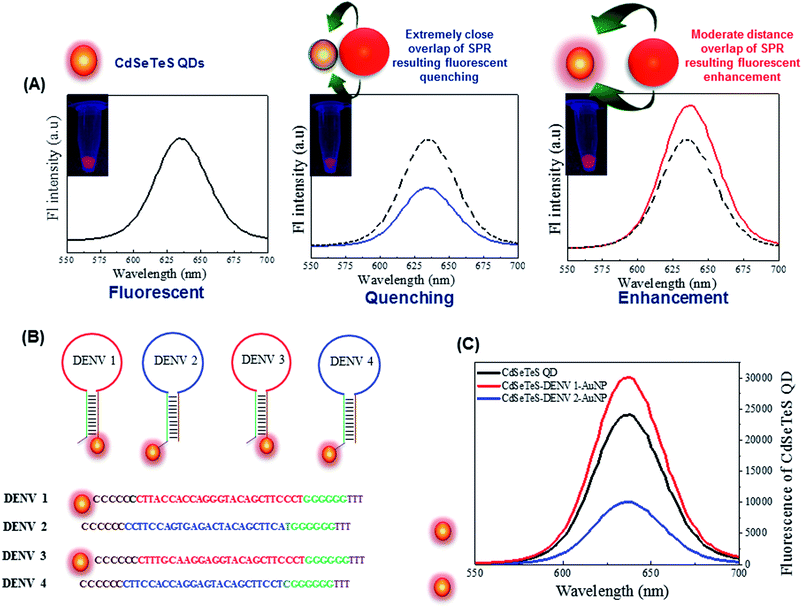
LSPR originating from the surface resonance electrons of noble metal nanoparticles such as Au and Ag can have either enhancement or quenching effects on the adjacent fluorophore. This depends on the distance of the fluorophores separated from the metal nanoparticle and the relative position of the LSPR wavelength from the excitation or emission wavelength of the fluorophores.5 The fluorescence property of the CdSeTeS QDs was measured by calculating their quantum efficiency (quantum yield = 0.33, given in Fig. S3, ESI†), which is quite satisfactory for this fluorometric investigation. Therefore, the quantum efficiency and the emission intensity of the CdSeTeS QD fluorophore can be enhanced or quenched by the surrounding metal AuNP via the equilibrium of the two-way electron transfer process of non-radiative energy transfer and local field enhancement effect.2 When this duo is in very close proximity (for example ∼2 nm), non-radiative energy transfer dominates, which results in the quenching of the fluorescence. Due to the increased distance, the local field enhancement effect becomes significant, contributing to the enhancement in fluorescence intensity. The emission intensity reaches maximum at an optimal distance of about 14–20 nm depending on the size and shape of both nanocomponents, as depicted in the schematic diagram in Fig. 4(A). When the distance is increased to more than 20 nm, the fluorescence intensity does not have any significant effect on the neighboring group of metal nanoparticles. Therefore, in case of a large distance from the AuNPs, the electric field intensity becomes insignificant, causing no observable changes in the emission intensity of the CdSeTeS QDs.Thus, employing the distance-dependent fluorescence behavior, we designed four types of nanoprobes for four specific DENV serotypes. As illustrated in Fig. 4(B), four hairpin structures with 40 bp ssDNA oligonucleotides were synthesized, which consisted of a 5′/3′ terminus with an amino group (NH2) for the conjugation of the CdSeTeS QDs. The probes contained 25 bp complementary sequences with four DENV serotypes assigned in four different colors in the scheme in Fig. 4(B). The remaining 15 bp were designed with 6 poly-G and 6 poly-C for the loop formation in addition with 3 bp T in the poly-C end. Therefore, after conjugation with the complementary DENV serotype ssDNA, the loop can be opened and the GGGGGGTTT region can be bonded with the free AuNP-SH-CCCCCCAAAAAAAAAAAA probe, which is free in the sensing solution. The probe ssDNA has 6 G–C complementary binding, whereas 25 unbound nucleotides in the loop region. After the addition of the target ssDNAs, the conjugated structure contained 25 complementary bonded nucleotides with the target ssDNA and 6 new G–C binding with free AuNPs with 6 free nucleotides in the end, which indicates the higher stability of the conjugated structure over the former. Additionally, compared with similar studies on DNA hairpin, it can be concluded that the straight chain form of DNA has much higher stability than the looped form due to the much higher number of complementary DNA nucleotides.42–44 Since the NH2 group is bonded with the ssDNA nanoprobes in the 5′ end in the case of DENVs 2 and 4, the CdSeTeS QDs should be positioned very close to the AuNPs (<6 nm), resulting in quenching. On the other hand, in the case of DENVs 1 and 3, since the NH2 group is bonded with the ssDNA nanoprobes in the 3′ end, the distance between the AuNPs and the CdSeTeS QDs should be approx. 40 bp or 12–14 nm, resulting in a fluorescence enhancement. The initial fluorescence of the probe showed only the fluorescence of the QDs, as designated in the scheme in Fig. 1(A). However, the QD fluorescence increased in the presence of the AuNPs at a certain distance due to the LSPR effect. Therefore, after the addition of DENV 1/3, the target ssDNA bound the loop structure of the probe ssDNA and opened it in such way that the distance between the QDs and the AuNPs was ∼14 nm, which is perfect for the LSPR effect, resulting in an enhancement of the QD fluorescence from its initial value, as depicted in Fig. 1(B). These two types of conjugation are shown in Fig. 4(C), where DENV 1 enhances the fluorescence of CdSeTeS QDs, whereas the DENV 2 produces the quenching effect compared to the bare CdSeTeS QDs, supporting our hypothesis of this present work.
DENV serotype detection
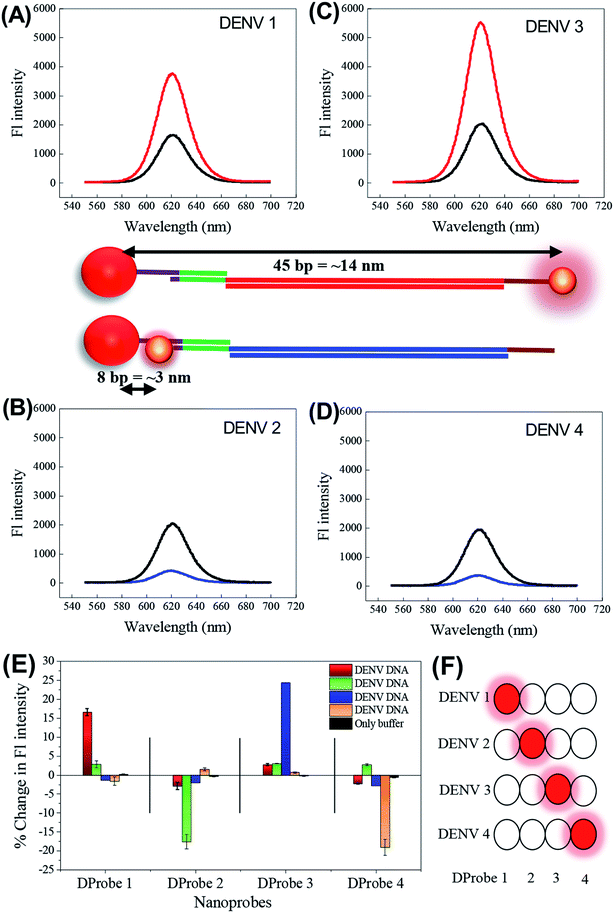
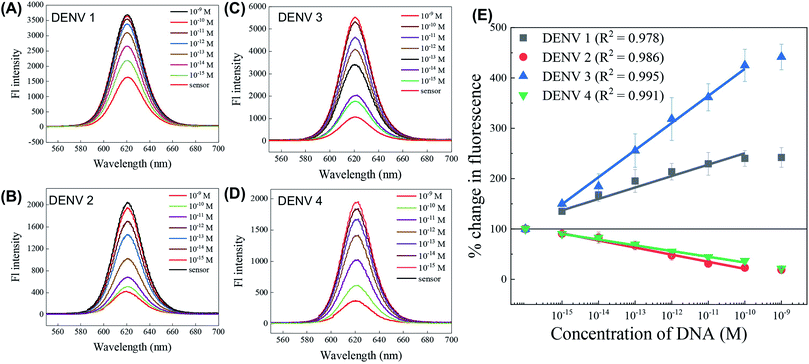
The nanoprobes of four types of ssDNA–CdSeTeS QDs and ssDNA–AuNPs were mixed with the 4 serotypes of DENV ssDNAs (DENV-1, 2, 3 and 4), separately, for serotyping. From the different vials, we can obtained four different positioned CdSeTeS QD–DNA–AuNP nanocomposites, where the distance between the AuNPs and the CdSeTeS QDs was also different. The fluorescence intensity was recorded in the wavelength range of 500–700 nm upon the excitation of the CdSeTeS QDs at 480 nm. It is clear from the Fig. 5(A–D), the nanocomposites showed a fluorescence enhancement for DENVs 1 and 3 (Fig. 5(A) and (C)) and quenching for DENVs 2 and 4 (Fig. 5(B) and (D)), respectively. To check their cross reactivity, the interaction between all sixteen possible combination of the four nanoprobes with four serotype target DENV ssDNAs is presented in Fig. 5(E) and their schematic representation is shown in Fig. 5(F). It can be clearly observed that the assigned nanoprobes, which were designed for a specific DENV analyte, are very sensitive for the exact complementary target ssDNAs, where the other ssDNAs and the bare buffer medium show almost insignificant signals. In case of DProbe 1, the target DENV 1 showed a change in fluorescence of 17.1% with respect to the initial fluorescence, whereas the DENV 2, 3 and 4 showed only the 2.3%, −1.4% and −1.6% changes, which are almost negligible compared with the target signals. Similar or better specificity was observed in case of DProbe 2, DProbe 3 and DProbe 4. Therefore, from the above results, we can obtain exact information about the DENV serotype. By changing the QDs with different emission wavelengths in future, we can also distinguish the exact serotype in a one-pot reaction mixture.Calibration for four DENV serotypes
After the successful identification of the serotype, the quantification of the target ssDNA was examined and expressed in terms of the corresponding calibration lines in Fig. 6. The fluorescence spectra of the four target analytes are presented in Fig. 6(A–D), which representing the four serotypes of DENV ssDNAs in the concentration range of 10−15 to 10−9 M with their individually designed CdSeTeS QD–dsDNA–AuNP nanoprobes. A steady increase in the fluorescence intensity was achieved in the case of DENVs 1 and 3 (Fig. 6(A) and (C)), whereas a decreases in peak intensity was observed in case of DENVs 2 and 4 (Fig. 6(B) and (D)), respectively. The calibration lines from these four graphs are plotted in Fig. 6(E), where linear calibration lines were found for all in the concentration range of 10−15 to 10−10 M. In the case of 10−9 M concentration or higher, the signals tended to saturation. The correlation coefficients were found to be in the range of 0.978 to 0.99. The quenching calibration lines for DENVs 2 and 4 maintained an equal slope; however, the enhanced calibrations for DENVs 1 and 3 changed greatly. Due to the small difference in the content of guanidine bases for all the serotype duplexes, the formation of CdSeTeS QD–dsDNA–AuNP with the analyte ssDNA may be not exactly the same. Since the distance is very sensitive for the LSPR enhancement, the concentration vs. fluorescence signals are slightly varied for each probe, producing different slopes. In addition, the ssDNA probe for DENV 1 forms different types of hairpin structures with a higher energy of 7 kcal mol−1 compared to that of the other three of 4.9–5.1 kcal mol−1. The most possible secondary structures of all four ssDNA probes are presented in Fig. S4, ESI.† Therefore, due to the more conjugated hairpin, the slope of the enhanced intensity for DENV 1 is lower than that of DENV 3. The limit of detection (LOD) was calculated by 3 × standard deviation of lowest signal divided by the slope of the calibration line,45 which was found to be 24.6, 11.4, 39.8 and 39.7 fM for DENVs 1, 2, 3 and 4 with the correlation coefficient (R2) of 0.964, 0.963, 0.995 and 0.972, respectively.Detection of four DENV serotypes isolated from real samples with the proposed sensor
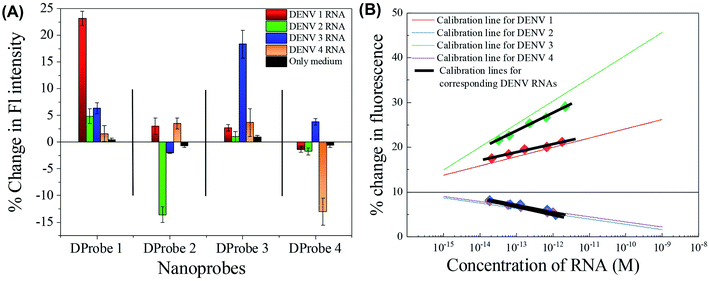
After the successful detection of the synthetic small target ssDNAs, the sensing application was extended towards real DENV samples. The aim of the present work is to apply the protocol in direct extracted DENV RNAs without any further pre-treatment or amplification process. Thus, DENV RNAs were extracted from four serotypes of DENV culture fluids and the four types of nanoprobes were used for the analysis. The sequences of the full RNAs are given in Table S1, ESI.† To avoid any secondary loop formation of the RNAs, the RNA samples were incubated at 95 °C for 2 min before the analysis. During the cooling time to normal temperature, the sensor was added to the RNA samples, which helped to make stronger hybridization between the loop region of the nanoprobe with the RNA strand. The stability of the RNAs at 95 °C was also measured by UV-Vis spectroscopy, as presented in Fig. S5, ESI.† As presented in Fig. 7(A), the fluorescence signal of the CdSeTeS QDs was clearly altered depending on the analyte serotype, similar to that of the synthetic ssDNAs in Fig. 5(E). The fluorescence curves are presented in Fig. S6, ESI† for all four samples reacted with all four nanoprobes, and their comparative bar diagram is shown in Fig. 7(A). The percentage changes were not as good as the previous calibration line in DI water. Particularly in the case of DProbe3, the change in fluorescence was 19.2% for DENV 3 with respect to the initial fluorescence, whereas DENV 1, 2 and 4 showed 2.9%, 3.1% and 4.6% respectively. However, considering the presence of interferences in the sample medium, this 4-fold enhancement is acceptable for real analysis, where the concentration of RNA is in the picomolar range. In case of DProbe 1, 2 and 4, the changes were 23.7%, −13.4% and −12.9%, respectively, for their corresponding targets, where the signals for other interferences were almost negligible. The sensors were then tested for the detection of RNA samples, where the concentration was diluted in four separate solutions to make the proper calibration lines. The percentage changes of the obtained fluorescence for each serotype were plotted in Fig. 7(B) and the corresponding calibration lines were generated. The calibration lines for the real RNA analysis are plotted in bold black lines, which are compared with the calibration lines found in water medium. The 5, 10, 50 and 100-fold diluted results maintained the linearity for all the serotypes. Although the slopes of the calibration lines deviated largely from the water medium, they were still linear. Here, the probe to target binding is DNA/RNA instead of DNA/DNA, which may be the reason for the decrease in the slope. It is obvious that the binding nature of RNA/RNA and RNA/DNA is not exactly the same;46 however, to understand the trend of binding for the sensing application in this work, the comparison of these two calibration lines is quite satisfactory. All the nanoprobes were also tested with the bare medium, and it was found that the nanoprobes still showed the desired sensitivity for the exact complementary targets even in the complex medium. To confirm the applicability in real sample analysis, evaluation of the different isolates representing the different lineages of each serotype is also required. In future, before proceeding to on-site monitoring, the detectability in the different lineages of each serotype needs to be established. In addition, a few other viral synthetic ssDNAs were also used with the sensor to check any possible non-specific interaction. The zika virus was chosen since it is from same the flavivirus family of dengue, whereas influenza is a common enveloped virus like dengue. Norovirus was selected as an example of a non-enveloped virus. The nanoprobes showed negligible interactions with the zika virus and norovirus, as presented in Fig. S7, ESI,† confirming the absence of any non-specific interaction from any part of the nanoprobe. In the case of the influenza virus, there was a 1.37-fold enhancement observed compared with the sensor, whereas the target virus of DENV 1 showed a 3.64-fold enhancement, which is quite high to confirm its specific nature. Therefore, from the above results, it can be concluded that the CdSeTeS–dsDNA nanoprobes can successfully identify the DENV serotypes with the detection of the analyte concentration in DENV culture fluid samples, which can serve as an alternative for point-of-care diagnosis in serotype determination of DENV.Conclusions
A sensitive DENV DNA detection biosensor with serotype identification ability was proposed in the present study by altering the distance-based LSPR between AuNPs and CdSeTeS QDs. Four different nanoprobes were constructed using each primer-probe serotype specific hairpin ssDNAs and covalent bonding with CdSeTeS QDs. The synthesized nanoprobes could successfully identify the DENV serotypes, where a fluorescence enhancement was observed for DENVs 1 and 3 and quenching indicated the presence of DENVs 2 and 4. In reaction with free ssDNA-functionalized AuNPs and the nanoprobes, target ssDNA of 10−15 to 10−10 M was successfully detected. The limit of detection was calculated to be 24.6, 11.4, 39.8 and 39.7 fM for the synthetic ssDNAs of DENVs 1, 2, 3 and 4, respectively. To the best of our knowledge, this is the first attempt for DENV serotype detection together with quantification without any amplification employing the distance-dependent LSPR phenomenon of fluorescent CdSeTeS QDs with adjacent AuNPs. In addition, to confirm its applicability in complex systems, the sensor was also applied to the real DENV RNAs extracted from DENV culture fluids without pre-treatment, which showed satisfactory performances for serotype identification with quantification. This result can make the sensing process a potential diagnostic probe for point-of care detection in the future.Conflicts of interest
There are no conflicts to declare.Acknowledgements
ADC thanks the Japan Society for the Promotion of Science (JSPS) for a postdoctoral fellowship (No. P17359). This work was supported and partly by the Bilateral Joint Research Project of the JSPS, Japan.References
- L. Zhang, Y. Song, T. Fujita, Y. Zhang, M. Chen and T. H. Wang, Adv. Mat., 2014, 26, 1289–1294 CrossRef CAS PubMed.
- A. L. Feng, M. L. You, L. Tian, S. Singamaneni, M. Liu, Z. Duan, T. J. Lu, F. Xu and M. Lin, Sci. Rep., 2015, 5, 7779 CrossRef CAS PubMed.
- F. Nasrin, A. D. Chowdhury, K. Takemura, J. Lee, O. Adegoke, V. K. Deo, F. Abe, T. Suzuki and E. Y. Park, Biosens. Bioelectron, 2018, 122, 16–24 CrossRef CAS PubMed.
- M. Li, S. K. Cushing, Q. Wang, X. Shi, L. A. Hornak, Z. Hong and N. Wu, J. Phys. Chem. Lett., 2011, 2, 2125–2129 CrossRef CAS.
- M.-X. Li, W. Zhao, G.-S. Qian, Q.-M. Feng, J.-J. Xu and H.-Y. Chen, Chem. Commun., 2016, 52, 14230–14233 RSC.
- K. Takemura, O. Adegoke, N. Takahashi, T. Kato, T.-C. Li, N. Kitamoto, T. Tanaka, T. Suzuki and E. Y. Park, Biosens. Bioelectron, 2017, 89, 998–1005 CrossRef CAS PubMed.
- Y. Ke, X. Wen, D. Zhao, R. Che, Q. Xiong and Y. Long, ACS Nano, 2017, 11, 7542–7551 CrossRef CAS PubMed.
- A. Neely, C. Perry, B. Varisli, A. K. Singh, T. Arbneshi, D. Senapati, J. R. Kalluri and P. C. Ray, ACS Nano, 2009, 3, 2834–2840 CrossRef CAS PubMed.
- J. Wang, Y. Shan, W.-W. Zhao, J.-J. Xu and H.-Y. Chen, Anal. Chem., 2011, 83, 4004–4011 CrossRef CAS PubMed.
- C. Li, C. Wu, J. Zheng, J. Lai, C. Zhang and Y. Zhao, Langmuir, 2010, 26, 9130–9135 CrossRef CAS PubMed.
- H. Nishi, S. Hiroya and T. Tatsuma, ACS Nano, 2015, 9, 6214–6221 CrossRef CAS PubMed.
- X. Zhao, R. Tapec-Dytioco and W. Tan, J. Am. Chem. Soc., 2003, 125, 11474–11475 CrossRef CAS PubMed.
- A. H. Loo, Z. Sofer, D. Bouša, P. Ulbrich, A. Bonanni and M. Pumera, ACS Appl. Mater. Interfaces, 2016, 8, 1951–1957 CrossRef CAS PubMed.
- J.-L. Ma, B.-C. Yin, H.-N. Le and B.-C. Ye, ACS Appl. Mater. Interfaces, 2015, 7, 12856–12863 CrossRef CAS PubMed.
- A. D. Chowdhury, R. Gangopadhyay and A. De, Sens. Actuators, B, 2014, 190, 348–356 CrossRef CAS.
- A. Dutta Chowdhury, N. Agnihotri, R.-a. Doong and A. De, Anal. Chem., 2017, 89, 12244–12251 CrossRef CAS PubMed.
- S. Dutta, A. D. Chowdhury, S. Biswas, E. Y. Park, N. Agnihotri, A. De and S. De, Biochem. Eng. J., 2018, 140, 130–139 CrossRef CAS.
- J. Lee, M. Morita, K. Takemura and E. Y. Park, Biosens. Bioelectron., 2018, 102, 425–431 CrossRef CAS PubMed.
- E. Nebling, T. Grunwald, J. Albers, P. Schäfer and R. Hintsche, Anal. Chem., 2004, 76, 689–696 CrossRef CAS PubMed.
- X. Lu, X. Dong, K. Zhang, X. Han, X. Fang and Y. Zhang, Analyst, 2013, 138, 642–650 RSC.
- Y. Zhang, C. Zhu, L. Zhang, C. Tan, J. Yang, B. Chen, L. Wang and H. Zhang, Small, 2015, 11, 1385–1389 CrossRef CAS PubMed.
- M. Stanisavljevic, S. Krizkova, M. Vaculovicova, R. Kizek and V. Adam, Biosens. Bioelectron., 2015, 74, 562–574 CrossRef CAS PubMed.
- A. Dutta Chowdhury, A. B. Ganganboina, F. Nasrin, K. Takemura, R.-a. Doong, D. I. S. Utomo, J. Lee, I. M. Khoris and E. Y. Park, Anal. Chem., 2018, 90, 12464–12474 CrossRef CAS PubMed.
- M. N. M. Nuzaihan, U. Hashim, M. M. Arshad, S. Kasjoo, S. Rahman, A. Ruslinda, M. Fathil, R. Adzhri and M. Shahimin, Biosens. Bioelectron., 2016, 83, 106–114 CrossRef CAS PubMed.
- M. A. Iyer, G. Oza, S. Velumani, A. Maldonado, J. Romero, M. d. L. Munoz, M. Sridharan, R. Asomoza and J. Yi, Sens. Actuators, B, 2014, 202, 1338–1348 CrossRef CAS.
- A. A. Odeh, Y. Al-Douri, C. Voon, R. M. Ayub, S. C. Gopinath, R. A. Odeh, M. Ameri and A. Bouhemadou, Microchim. Acta, 2017, 184, 2211–2218 CrossRef.
- N. Mehta, B. Perrais, K. Martin, A. Kumar, T. C. Hobman, M. N. Cabalfin-Chua, M. E. Donaldo, M. S. S. Painaga, J. Y. Gaite and V. Tran, Am. J. Trop. Med. Hyg., 2019, 100, 1534–1540 CrossRef CAS PubMed.
- E. M. Euliano, A. N. Hardcastle, C. M. Victoriano, W. E. Gabella, F. R. Haselton and N. M. Adams, Sci. Rep., 2019, 9, 1–11 CrossRef CAS PubMed.
- O. Adegoke, T. Nyokong and P. B. Forbes, J. Alloys Compd., 2015, 645, 443–449 CrossRef CAS.
- S. V. Salihov, Y. A. Ivanenkov, S. P. Krechetov, M. S. Veselov, N. V. Sviridenkova, A. G. Savchenko, N. L. Klyachko, Y. I. Golovin, N. V. Chufarova and E. K. Beloglazkina, J. Magn. Magn. Mater., 2015, 394, 173–178 CrossRef CAS.
- O. Adegoke, T. Kato and E. Y. Park, Biosens. Bioelectron, 2016, 80, 483–490 CrossRef CAS PubMed.
- O. Adegoke, M. Morita, T. Kato, M. Ito, T. Suzuki and E. Y. Park, Biosens. Bioelectron, 2017, 94, 513–522 CrossRef CAS PubMed.
- O. Adegoke, M.-W. Seo, T. Kato, S. Kawahito and E. Y. Park, Biosens. Bioelectron, 2016, 86, 135–142 CrossRef CAS PubMed.
- M. H. P. Ly, M. L. Moi, T. B. H. Vu, M. M. N. Tun, T. Saunders, C. N. Nguyen, A. K. T. Nguyen, H. M. Nguyen, T. H. Dao and D. Q. Pham, BMC Infect. Dis., 2018, 18, 31 CrossRef PubMed.
- G.-C. Fan, H. Zhu, Q. Shen, L. Han, M. Zhao, J.-R. Zhang and J.-J. Zhu, Chem. Commun., 2015, 51, 7023–7026 RSC.
- C. Zhang, X. Li, C. Tian, G. Yu, Y. Li, W. Jiang and C. Mao, ACS Nano, 2014, 8, 1130–1135 CrossRef CAS PubMed.
- S. Krishnamurthy, A. Esterle, N. C. Sharma and S. V. Sahi, Nanoscale Res. Lett., 2014, 9, 627 CrossRef PubMed.
- G.-X. Liang, M.-M. Gu, J.-R. Zhang and J.-J. Zhu, Nanotechnology, 2009, 20, 415103 CrossRef PubMed.
- S. M. Watson, H. D. A. Mohamed, B. R. Horrocks and A. Houlton, Nanoscale, 2013, 5, 5349–5359 RSC.
- S. R. Ede, A. Ramadoss, S. Anantharaj, U. Nithiyanantham and S. Kundu, Phys. Chem. Chem. Phys., 2014, 16, 21846–21859 RSC.
- A. C. Moço, P. H. Guedes, J. M. Flauzino, H. S. da Silva, J. G. Vieira, A. C. Castro, É. V. Gomes, F. M. Tolentino, M. M. Soares and J. M. Madurro, Electroanalysis, 2019, 31, 1580–1587 CrossRef.
- P. Zhang, T. Beck and W. Tan, Angew. Chem., 2001, 40, 402–405 CrossRef CAS.
- F. Li, Y. Huang, Q. Yang, Z. Zhong, D. Li, L. Wang, S. Song and C. Fan, Nanoscale, 2010, 2, 1021–1026 RSC.
- S. Deng, L. Cheng, J. Lei, Y. Cheng, Y. Huang and H. Ju, Nanoscale, 2013, 5, 5435–5441 RSC.
- A. D. Chowdhury, N. Agnihotri, A. De and M. Sarkar, Sens. Actuators, B, 2014, 202, 917–923 CrossRef CAS.
- F. A. Tanious, J. M. Veal, H. Buczak, L. S. Ratmeyer and W. D. Wilson, Biochemistry, 1992, 31, 3103–3112 CrossRef CAS.
Footnote |
| † Electronic supplementary information (ESI) available. See DOI: 10.1039/c9na00763f |
| This journal is © The Royal Society of Chemistry 2020 |

