
 Open Access Article
 This Open Access Article is licensed under a
 Creative Commons Attribution 3.0 Unported Licence
A highly sensitive and selective hydroquinone sensor based on a newly designed N-rGO/SrZrO3 composite†
Khursheed
Ahmad
a,
Praveen
Kumar
a and
Shaikh M.
Mobin
 *abc
*abc
aDiscipline of Chemistry, Indian Institute of Technology Indore, Simrol, Khandwa Road, Indore 453552, India. E-mail: xray@iiti.ac.in; Tel: +91 731 2438 752
bDiscipline of Biosciences and Bio-Medical Engineering, Indian Institute of Technology Indore, Simrol, Khandwa Road, Indore 453552, India
cDiscipline of Metallurgy Engineering and Materials Science, Indian Institute of Technology Indore, Simrol, Khandwa Road, Indore 453552, India
First published on 9th December 2019
Abstract
Herein, we have reported a novel composite of nitrogen doped reduced graphene oxide (N-rGO) and strontium zirconate (SrZrO3). This new composite (N-rGO/SrZrO3) was synthesized using the reflux method. The physicochemical properties of N-rGO/SrZrO3 were determined using different advanced techniques such XRD, FE-SEM, EDX, FTIR and BET. Furthermore, a glassy carbon electrode was modified with N-rGO/SrZrO3 (GCE-2). This modified electrode was employed for the sensing of HQ. The electrochemically active surface area (ECSA) of this modified electrode (GCE-2) was calculated by employing the Randles–Sevcik equation. Furthermore, GCE-2 exhibited a good detection limit (0.61 μM) including high selectivity towards HQ.
1. Introduction
Hydroquinone (HQ) which is a di-substituted phenol (1,4-dihydroxybenzene) compound has been extensively employed in various fields (dyes, cosmetics, photo-stabilizers, pharmaceuticals, oil-refinery, plasticizers, pesticides, textile etc.).1–3 HQ exists in the environment as a toxic pollutant and its degradation is difficult under ecological circumstances.4,5 Moreover, HQ has negative impacts on the environment and human health.5 Even trace amounts of HQ may also cause hypoesthesia, puking, debility, fatigue, kidney damage and headache.6–9 HQ is widely used in cosmetics for bleaching purposes but long-term/excessive use may be responsible for skin damage or severe allergy.6 Thus, a sensitive and reliable method is required to detect trace levels of HQ. In last few decades, various approaches and methods (chemiluminescence, flow injection, pulse radiolysis, high performance liquid chromatography, synchronous fluorescence, electrochemical and solid-phase extraction) have been widely used for the determination of HQ.10–16 Among these methods, the electrochemical approach has emerged as a most promising detection technique due to its simplicity, cost effectiveness, ease of handling, selectivity and high sensitivity.17,18 Various novel electrode materials have been employed for the electrochemical detection of HQ. Previously, Qi et al. prepared a novel S,N doped 3D graphene for the sensing of phenol derivatives.18 Gan et al. employed a hybrid composite of graphene oxide and MnO2 whereas Peng et al.19 used a MoS2/reduced graphene oxide composite for the sensing of HQ.20 Although electrochemical techniques are the most promising approach, their performance largely depends on the electrode materials (electro-catalysts). The charge transfer, presence of surface electrochemically active sites and surface morphology also influence the performance of the electrochemical sensing devices.18 In some cases, transition metal oxides may suffer from poor conductivity and this phenomenon restricts their electrochemical applications. To address such issues, reduced graphene has been employed as a promising conductive support for poorly semiconducting metal oxides.19 Moreover, some research groups created active sites inside reduced graphene oxide by doping atoms into the graphene matrix.18 Therefore, it is of great interest to design and develop new electrode materials with a unique surface morphology for electrochemical sensors.Perovskite materials with the general formula ABO3 possess excellent physicochemical properties such as ferroelectric, magnetic and two-dimensional electrical conductivity.21,22 In last few years, ABO3 perovskites have been explored in various applications such as photovoltaics, catalysis, batteries, opto-electronics, super-capacitors, fuel cells, sensors etc.23–25 Recently, among zirconium based perovskites such as BaZrO3, CaZrO3, and SrZrO3 perovskites, ferroelectric strontium zirconate (SrZrO3) has attracted much attention owing to its outstanding thermo-mechanical and electrical properties.26 It has a highly stable nature at high temperature and acts as a sensor. Previously, the SrZrO3 perovskite had been employed as an electrode material for water splitting applications and also been proposed as future materials for non-volatile memory applications.27 Thus, SrZrO3 has potential for electrochemical applications. For the last few years, our research group has been working on hybrid materials for dye sensitized solar cells, electrochemical sensors, perovskite solar cells and water splitting applications.28–33
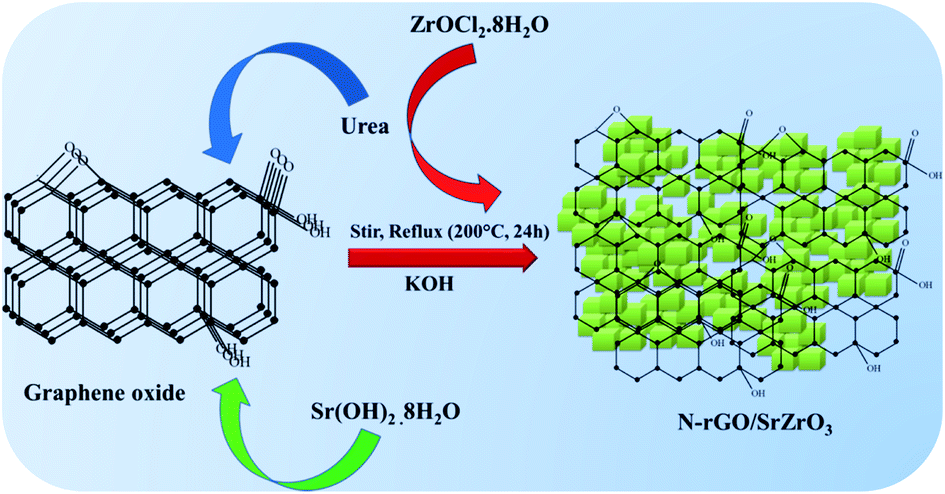
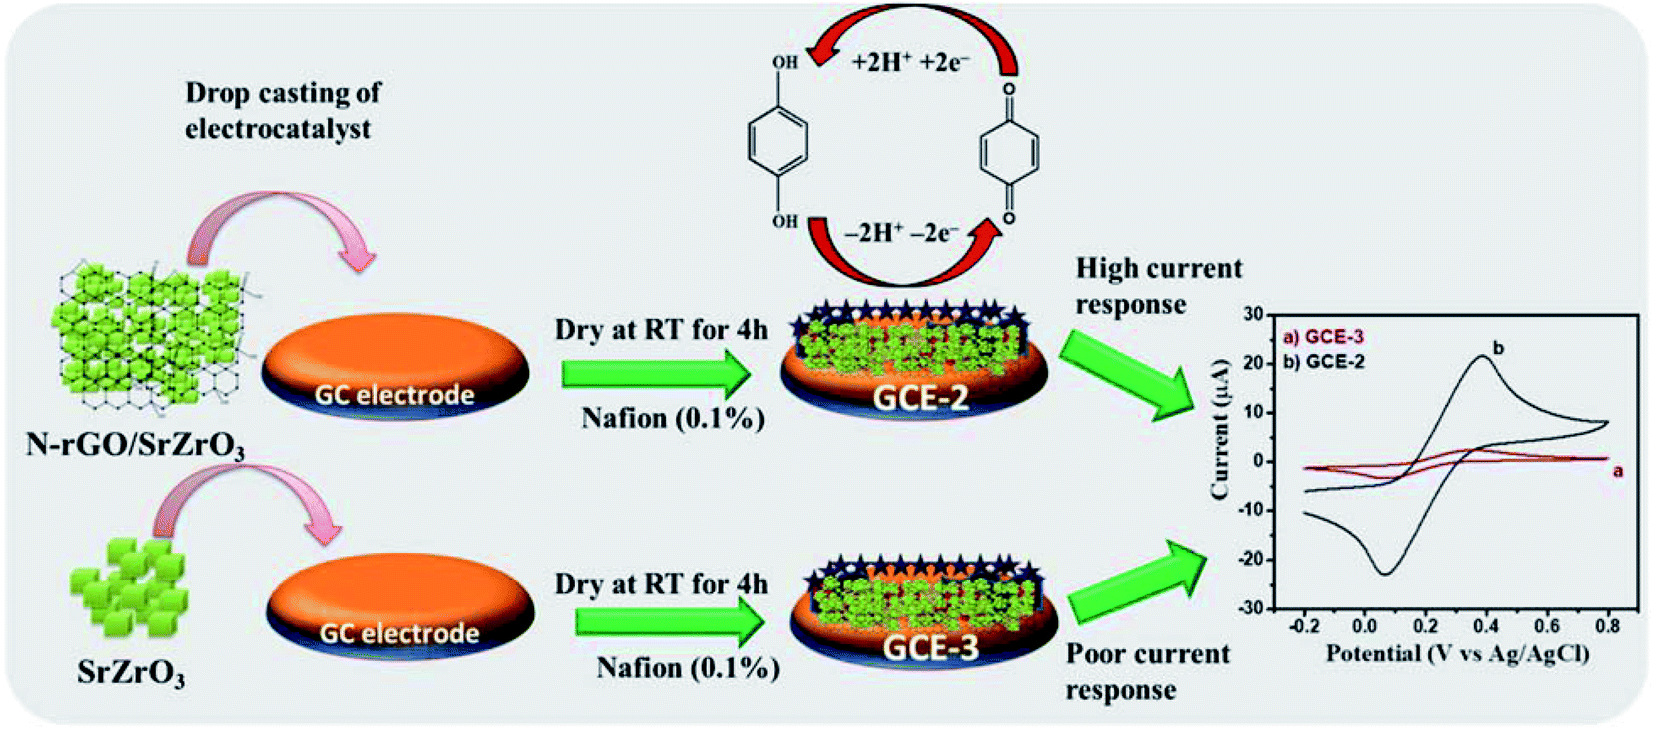
Herein, for the first time, a novel composite of SrZrO3 cubes embedded on nitrogen doped reduced graphene oxide (N-rGO/SrZrO3) has been synthesized for the electrochemical sensing of HQ (Scheme 1).
 | ||
| Scheme 1 Schematic representation of the synthesis of the N-rGO/SrZrO3 composite. | ||
2. Materials and methods
2.1 Chemicals and reagents
Phosphate buffered saline (PBS) solutions, ZrOCl2·8H2O, graphite, urea, Sr(OH)2·8H2O, potassium hydroxide, hydroquinone and other used chemicals/reagents/solvents were purchased from Alfa Aesar, Loba, Fisher Scientific, TCI, SRL and Merck, India.2.2 Synthesis of the N-rGO/SrZrO3 composite
Graphene oxide (GO) was synthesized according to our previous report.33 50 mg of GO was dispersed in deionized (D.I.) water and sonicated for 2 h at RT. 1.0 gm of urea was added to the GO and stirred for 30 min. 0.48 gm of Sr(OH)2·8H2O was added to the GO dispersion, followed by the addition of 0.538 gm of ZrOCl2·8H2O with continuous stirring at RT. Furthermore, 10 gm of potassium hydroxide (KOH) dissolved in DI water was added slowly to the precursor solution and the stirring continued for 24 h at 200 °C under reflux (Scheme 1). Finally, the obtained precipitate was washed with diluted acetic acid and water to remove the residues and dried overnight at 60 °C.2.3 Fabrication of the N-rGO/SrZrO3 composite modified glassy carbon electrode
The bare GCE is denoted as GCE-1. A glassy carbon electrode (GCE) was polished using alumina slurry and sonicated for 30 minutes, followed by drop casting of 8 μL of the N-rGO/SrZrO3 composite (GCE-2) with 0.1% Nafion onto the active surface area of the GCE (3 mm) which was further kept to dry at RT for 4 h. For control experiments, the active area of the GCE was also drop casted with SrZrO3 (GCE-3) and N-rGO (GCE-4) followed by Nafion deposition.3. Results and discussion
3.1 General characterization of N-rGO/SrZrO3
Powder X-ray diffraction (XRD) measurements were performed to understand and confirm the formation of the prepared samples (SrZrO3, N-rGO and N-rGO/SrZrO3 composite). The XRD patterns of SrZrO3 (black) and the N-rGO/SrZrO3 composite (brown) were recorded in the 2θ range of 10–80° and are presented in Fig. 1. In the case of SrZrO3, the diffraction peaks were observed at 21.4°, 25.01°, 30.6°, 43.75°, 54.15°, 63.53° and 72.27° which corresponded to the (020), (111), (200), (202), (240), (400) and (402) planes respectively. The XRD examinations confirmed the formation of SrZrO3 and all the diffraction peaks were found to be well-matched with previous JCPDS card no 44-0161. Moreover, the high intensity of the diffraction peaks suggested the crystalline nature of the prepared SrZrO3.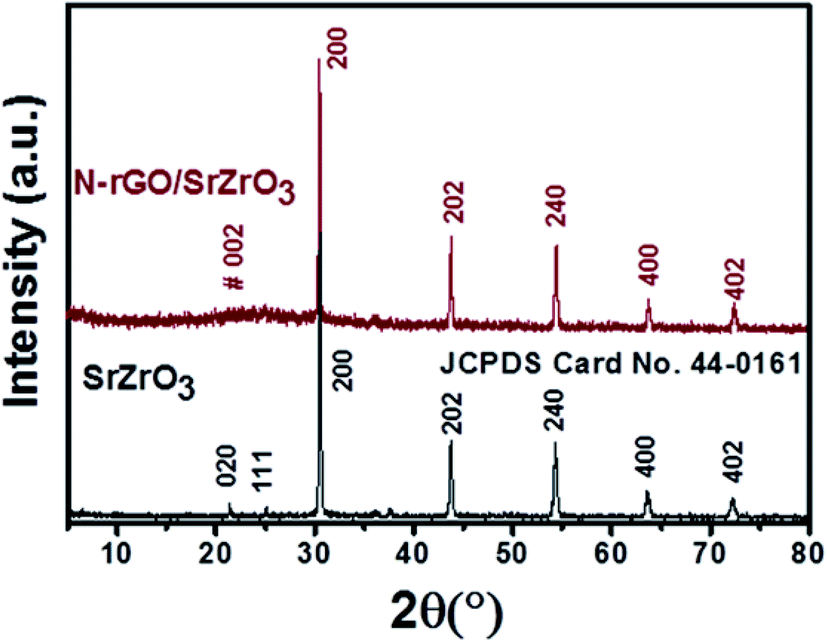 | ||
| Fig. 1 PXRD patterns of SrZrO3 (black) and N-rGO/SrZrO3 (brown). | ||
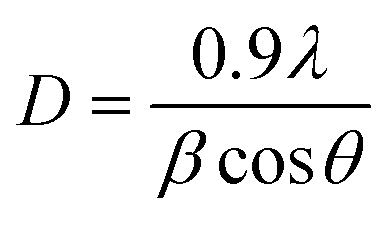
In the case of the hybrid composite composed of N-rGO and SrZrO3, similar diffraction planes were observed. However, a broader diffraction peak appearing at ∼23.91° was also observed which was attributed to the (002) plane of N-rGO. Therefore, the XRD investigations suggested the successful formation of the N-rGO/SrZrO3 composite. However, the two (020) and (111) diffraction planes were absent in the XRD pattern of N-rGO/SrZrO3 which may be due to the broad diffraction peak and amorphous nature of rGO. The crystallite size of the prepared SrZrO3 and N-rGO/SrZrO3 composite was determined by employing the Debye–Scherrer equation given below:
 | (1) |
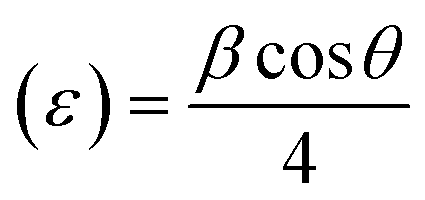
In eqn (1), β = broadening of the diffraction line and λ = 2.2897 Å. The crystallite size of SrZrO3 and the N-rGO/SrZrO3 composite was found to be 51.1 nm and 43.6 nm respectively. The other crystal parameters are shown in Table S1.† Furthermore, the micro strain (ε) was also calculated using the following equation according to previous reports:34–36
 | (2) |
The ε was deduced to be 0.040 and 0.047 for SrZrO3 and N-rGO/SrZrO3 respectively. The dislocation density (δ) was also calculated using the following formula:
| Dislocation density (δ) = 1/D2 | (3) |
The dislocation density was calculated to be 0.000382 and 0.000526 for SrZrO3 and N-rGO/SrZrO3 respectively. The XRD pattern of the separately prepared N-rGO was also recorded and is presented in Fig. S1.† The recorded XRD pattern exhibited a broad diffraction peak between 20° to 30° which confirmed the formation of N-rGO.
Fourier-transform infrared (FTIR) analysis was also conducted to understand the presence of chemical bonds in SrZrO3 and the N-rGO/SrZrO3 composite. The obtained FTIR spectra of SrZrO3 (black) and N-rGO/SrZrO3 (brown) are displayed in Fig. 2.
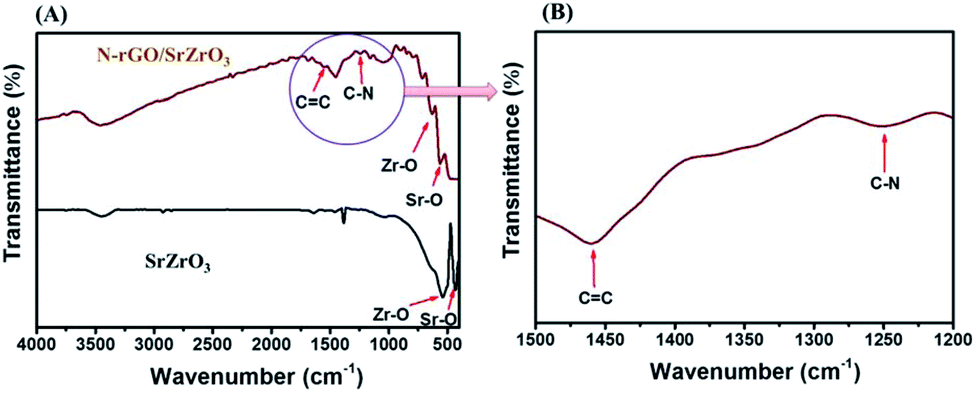 | ||
| Fig. 2 (A) FTIR spectra of SrZrO3 (black) and N-rGO/SrZrO3 (brown). (B) Enlarged view. | ||
In the case of SrZrO3, two adsorption bands were observed at 440 cm−1 and 533.7 cm−1. These two bands were assigned to the presence of Sr–O and Zr–O stretching vibration modes in SrZrO3 (black) respectively (Fig. 2A). The FTIR spectrum of the N-rGO/SrZrO3 composite showed adsorption bands at 568.1 cm−1 and 622.3 cm−1 which were assigned to the Sr–O and Zr–O stretching vibration modes whereas the other adsorption bands at 1244.1 cm−1 and 1559.6 cm−1 suggested the presence of C–N and C![[double bond, length as m-dash]](https://www.rsc.org/images/entities/char_e001.gif) C bonds respectively. The FTIR analysis confirmed the formation of the N-rGO/SrZrO3 composite (brown) as shown in Fig. 2A (brown). The FTIR spectra of N-rGO are presented in Fig. S2† which showed CC and C–N bonds. The C–N bond confirmed the doping of N atoms into the rGO framework. The particle surface morphology of the prepared SrZrO3 and N-rGO/SrZrO3 composite was determined by FE-SEM analysis and the recorded images are shown in Fig. 3.
C bonds respectively. The FTIR analysis confirmed the formation of the N-rGO/SrZrO3 composite (brown) as shown in Fig. 2A (brown). The FTIR spectra of N-rGO are presented in Fig. S2† which showed CC and C–N bonds. The C–N bond confirmed the doping of N atoms into the rGO framework. The particle surface morphology of the prepared SrZrO3 and N-rGO/SrZrO3 composite was determined by FE-SEM analysis and the recorded images are shown in Fig. 3.
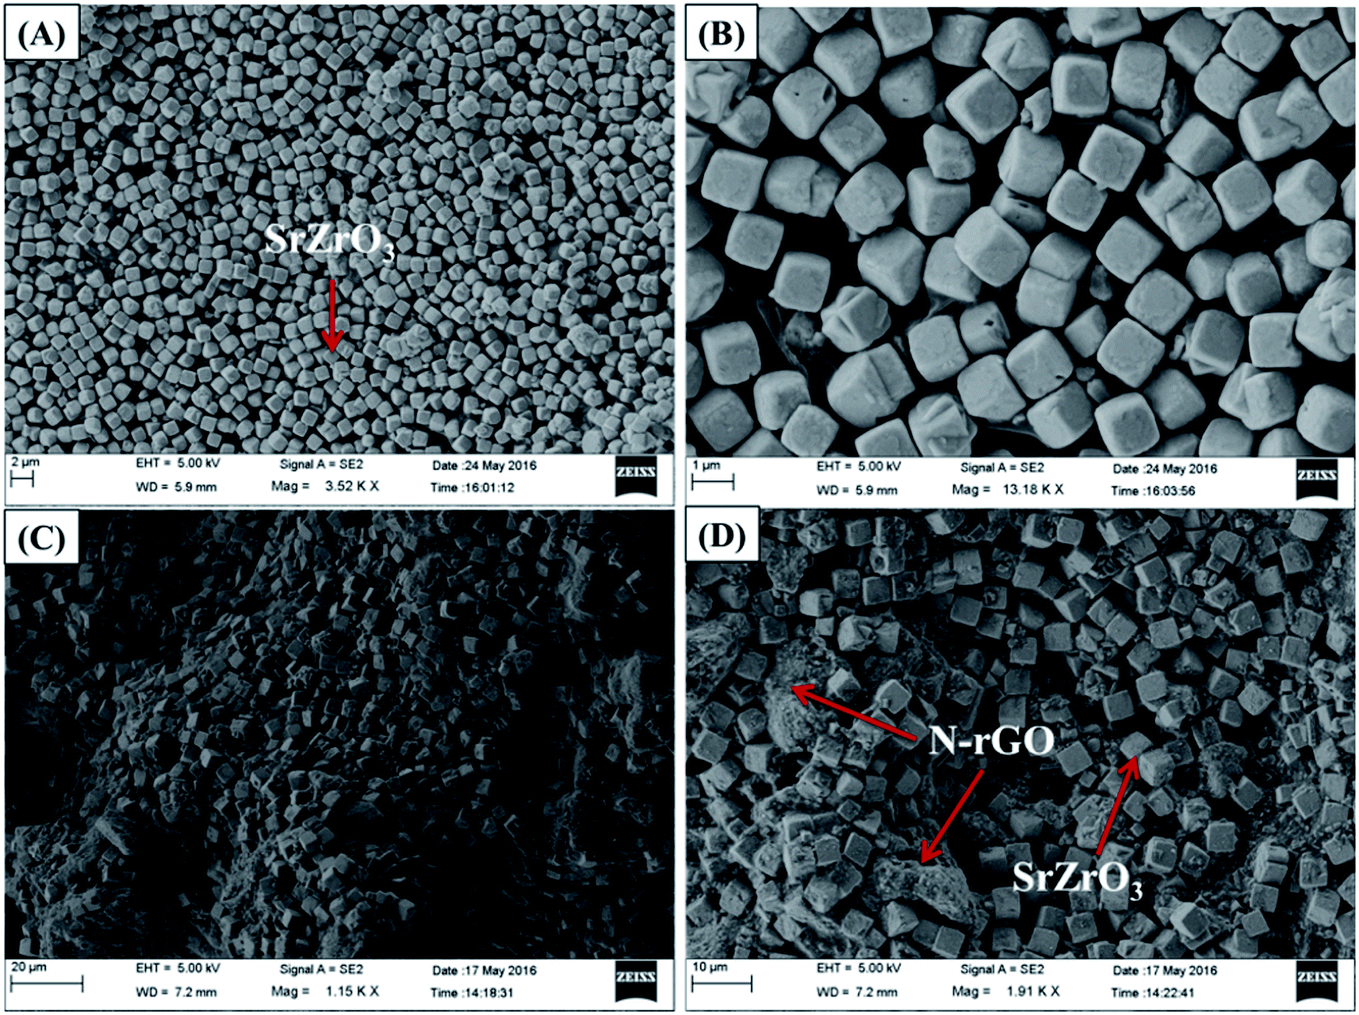 | ||
| Fig. 3 (A and B) FE-SEM images of SrZrO3 and (C and D) N-rGO/SrZrO3. | ||
The obtained results clearly showed that the prepared SrZrO3 has a cube like surface morphology (Fig. 3A and B). Furthermore, the recorded FE-SEM images of the N-rGO/SrZrO3 composite also showed that the SrZrO3 cubes are embedded in the 3D-network of N-rGO sheets resulting in the N-rGO/SrZrO3 composite (Fig. 3C and D). The FE-SEM analysis of the prepared N-rGO showed a sheet like surface morphology and the recorded FE-SEM images are shown in Fig. S3.† The elemental composition analysis of a hybrid composite is a crucial factor which also suggests the formation of the composites with the presence of elements. The recorded EDX spectra and EDX mapping images of SrZrO3 are presented in Fig. 4. The obtained EDX spectrum showed the presence of Sr, Zr and O elements which confirmed the formation of SrZrO3 (Fig. 4B). The EDX mapping images of the Sr, Zr and O elements are displayed in Fig. 4C and D. The EDX spectrum and mapping images of the N-rGO/SrZrO3 composite are presented in Fig. 5 which showed the presence of N, C, Sr, Zr, and O (Fig. 5B) and suggested the formation of the N-rGO/SrZrO3 composite (Fig. 5C–G).
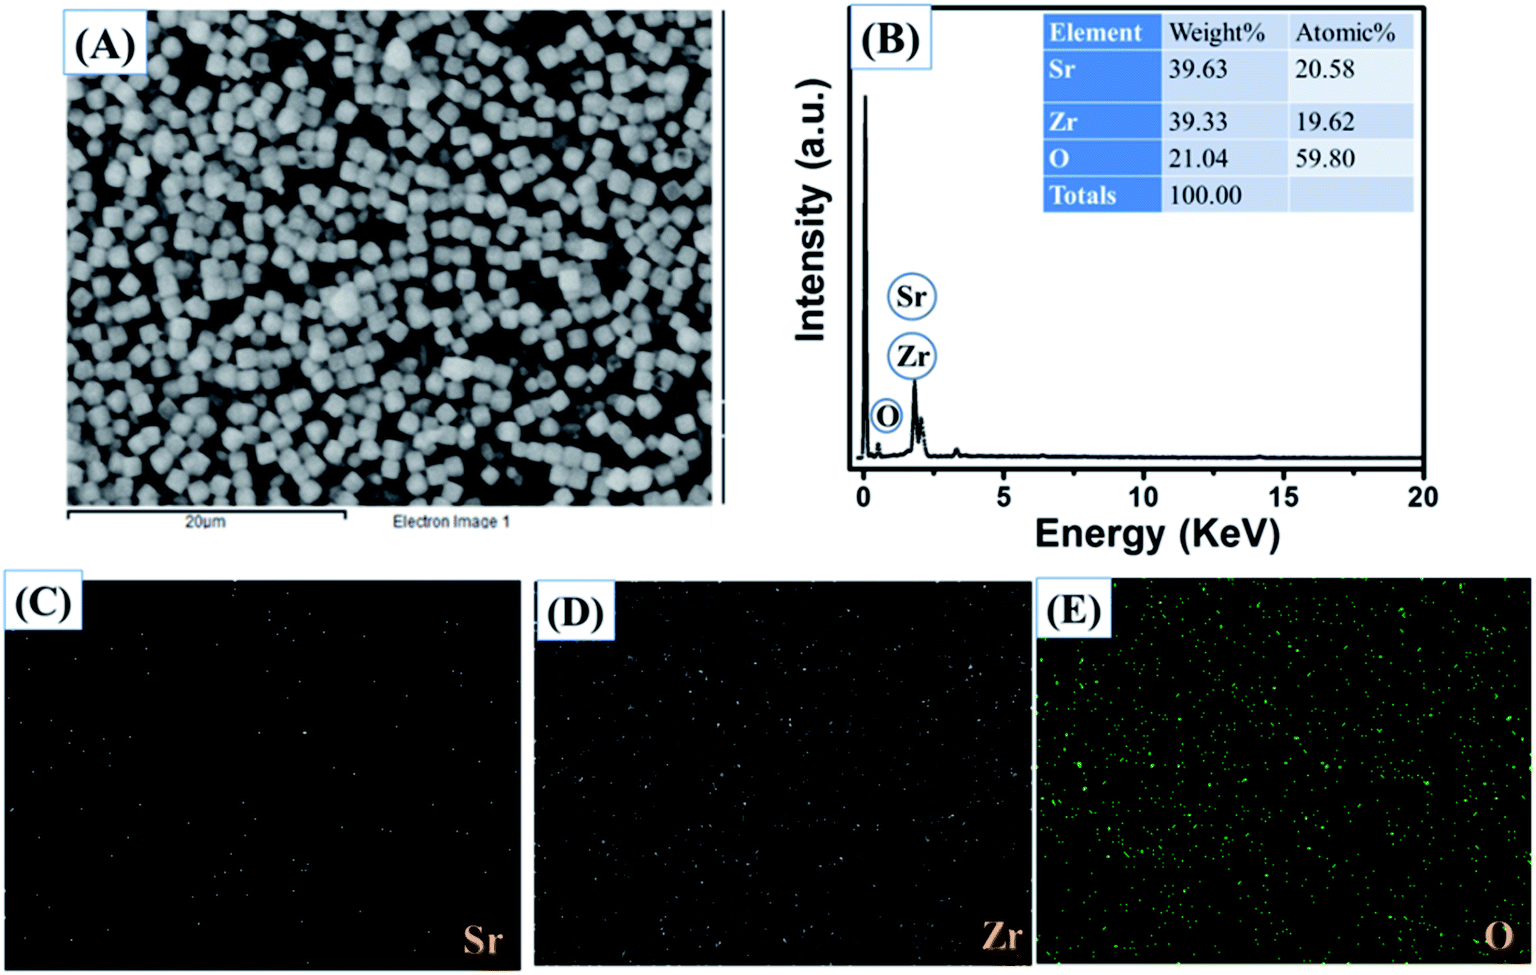 | ||
| Fig. 4 (A) Electron image, (B) EDX spectrum and (C–E) EDX mapping images of SrZrO3. | ||
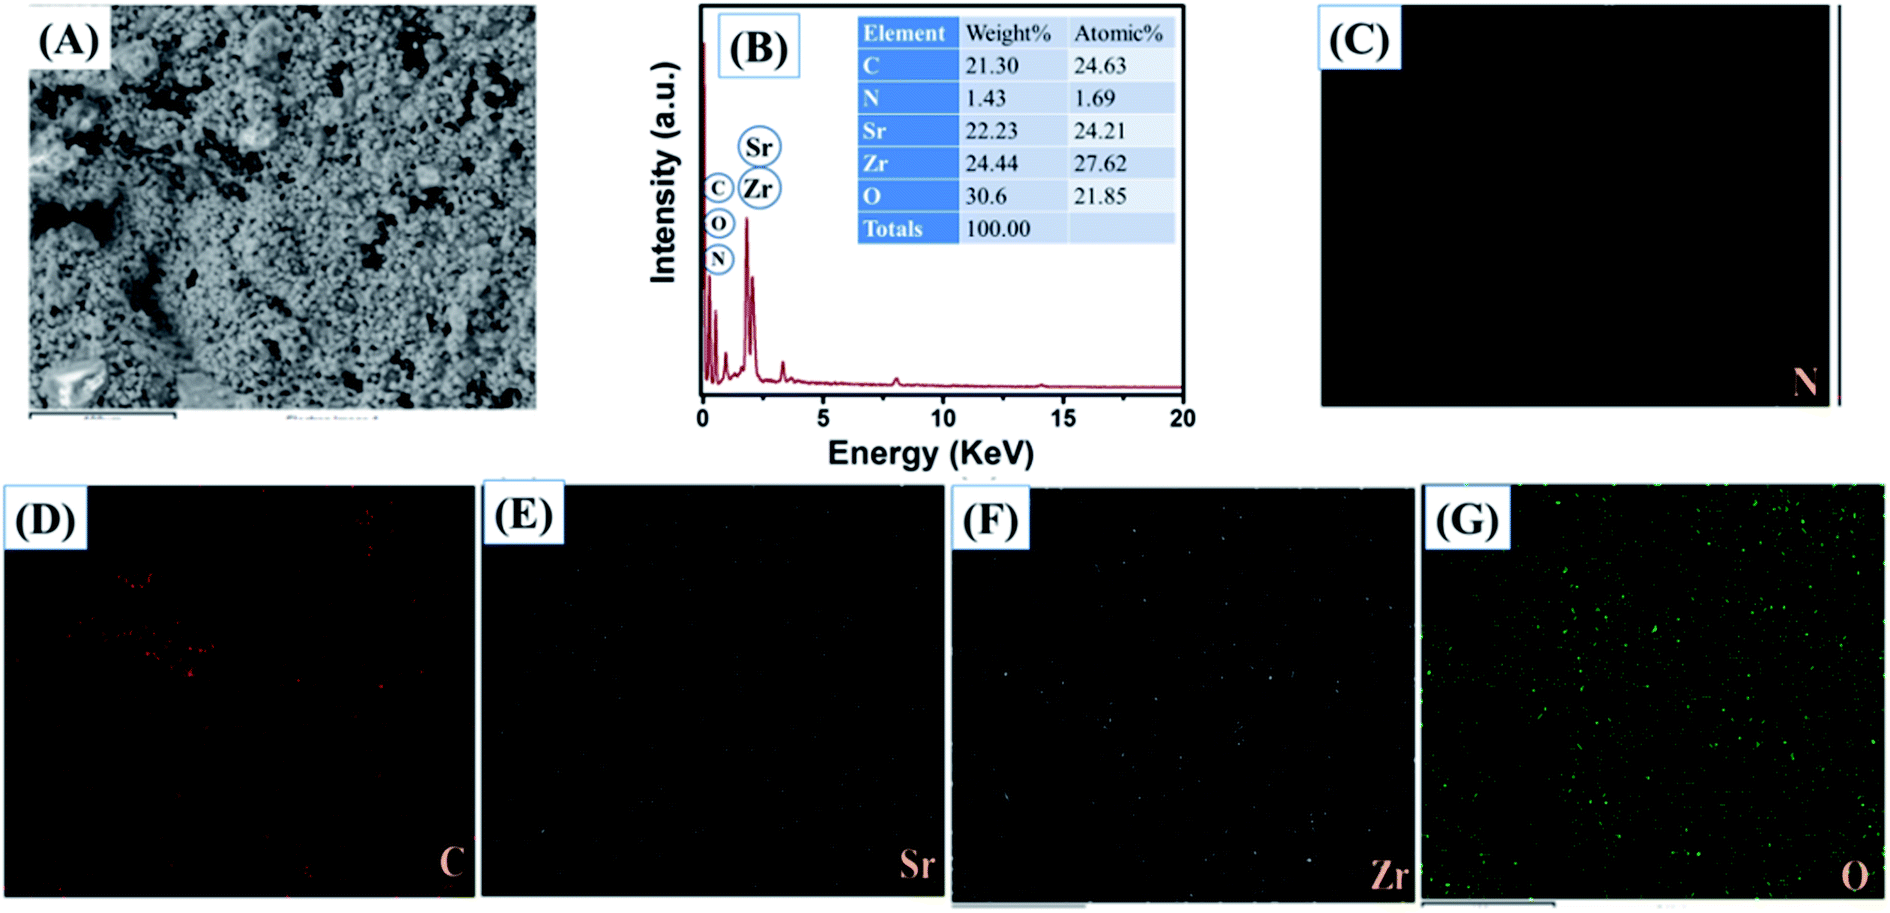 | ||
| Fig. 5 (A) Electron image, (B) EDX spectrum and (C–G) EDX mapping images of N-rGO/SrZrO3. | ||
3.2 Cyclic voltammetry investigations
First, the electrochemical performance of GCE-2 was compared with differently modified electrodes (GCE-3; GCE-4) and bare GCE (GCE-1) in the presence of 250 μM hydroquinone (HQ) in 0.1 M PBS (pH 7.0) at an applied scan rate of 100 mV s−1 by employing the CV method.The CV curves are presented in Fig. 6 which showed that the lowest current was obtained for GCE-1 whereas GCE-2 showed highest current compared to GCE-3 and GCE-4. Thus, it can be clearly understood that GCE-2 has good electrocatalytic characteristics towards HQ which may be due to the synergistic effects between N-rGO and SrZrO3 and the high surface area of N-rGO/SrZrO3 (54.2 m2 g−1) compared to pristine SrZrO3 (32.9 m2 g−1). The N2 adsorption–desorption isotherms of SrZrO3 and N-rGO/SrZrO3 are shown in Fig. S4.†
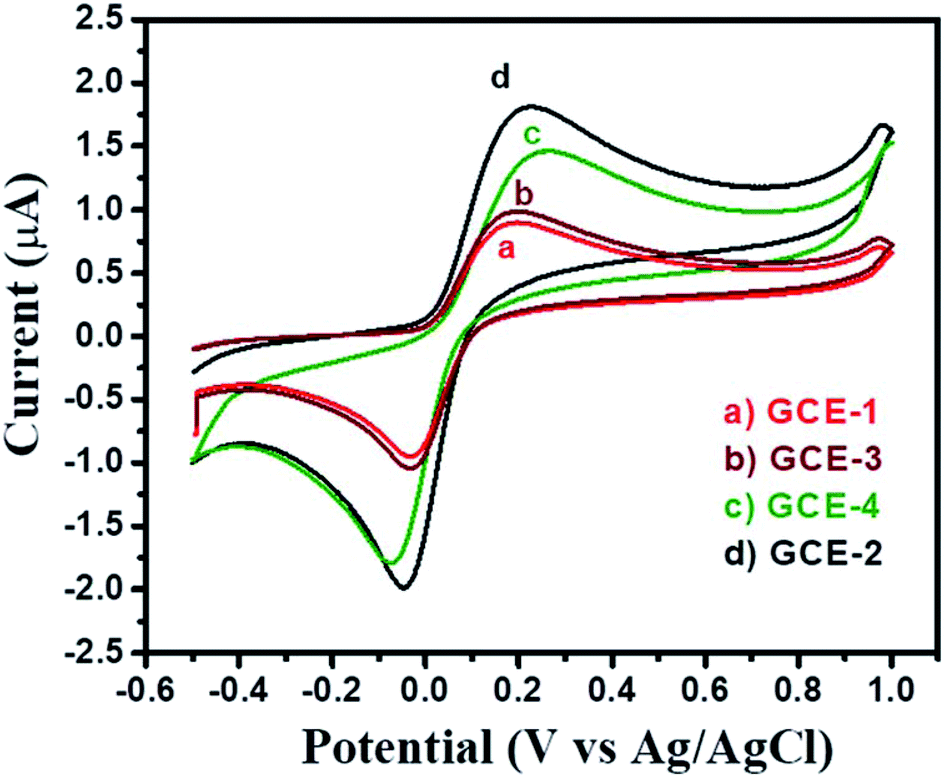 | ||
| Fig. 6 CV curves of bare GCE-1 (red), GCE-2 (black), GCE-3 (brown) and GCE-4 (green) in the presence of 250 μM HQ in 0.1 M PBS at a scan rate of 100 mV s−1. | ||
The electrochemically active surface area (ECSA) of GCE-1 and modified GC electrodes (GCE-2, GCE-3 and GCE-4) was calculated by recording CV curves (Fig. S5†) in the [Fe(CN)6]3−/4− redox couple by employing the Randles–Sevcik equation:37
| Ip = 2.69 × 10⁵AD1/2n3/2y1/2C | (4) |
The obtained CV results for GCE-2 exhibited the highest current response at pH = 7.0 and this pH was used for further electrochemical investigations (Fig. 7).
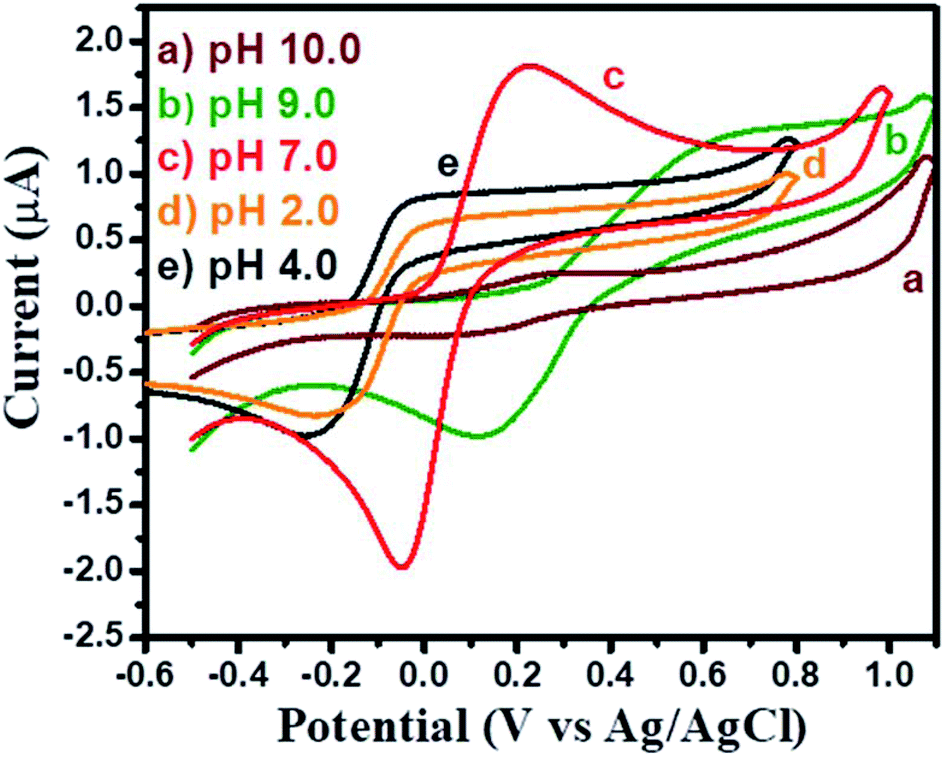 | ||
| Fig. 7 CV curves of GCE-2 in the presence of 250 μM HQ in 0.1 M PBS at a scan rate of 100 mV s−1 at different pH values. | ||
To check the effect of concentrations on the electrocatalytic activity of GCE-2, CV curves were recorded by varying the concentration (50–500 μM) of HQ at optimized pH at a scan rate of 100 mV s−1 (Fig. 8A).
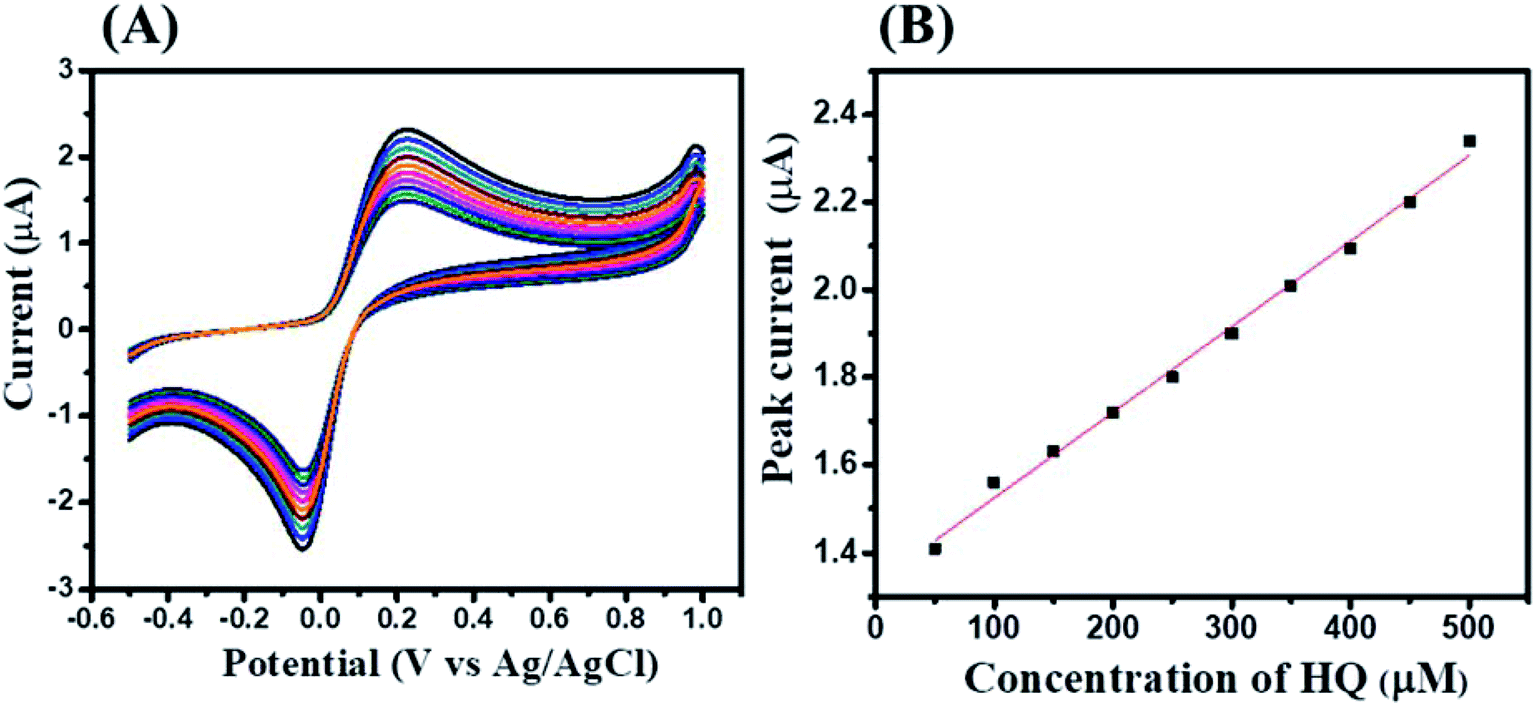 | ||
| Fig. 8 CV curves of GCE-2 (A) in the presence of different concentrations of HQ (50–500 μM) in 0.1 M PBS (pH 7.0) with a scan rate of 100 mV s−1 and the calibration plot of peak current versus concentration (B). | ||
The obtained results showed that the electrocatalytic current increases with increasing concentration of HQ. The calibration curve of the peak current against the concentration of HQ is plotted in Fig. 8B which showed a linearly increase in the current response.
Furthermore, the effect of scan rate on the electrocatalytic activity of GCE-2 was also investigated by tuning the scan rate (100–1000 mV s−1) in the presence of 250 μM HQ in 0.1 M PBS at pH 7.0 (Fig. 9A). The obtained results suggested that the electrocatalytic current response increased linearly upon increasing the scan rate as plotted in the calibration curve of the peak current versus square root of the scan rate (Fig. 9B). This linearly increased current suggested a diffusion controlled process.
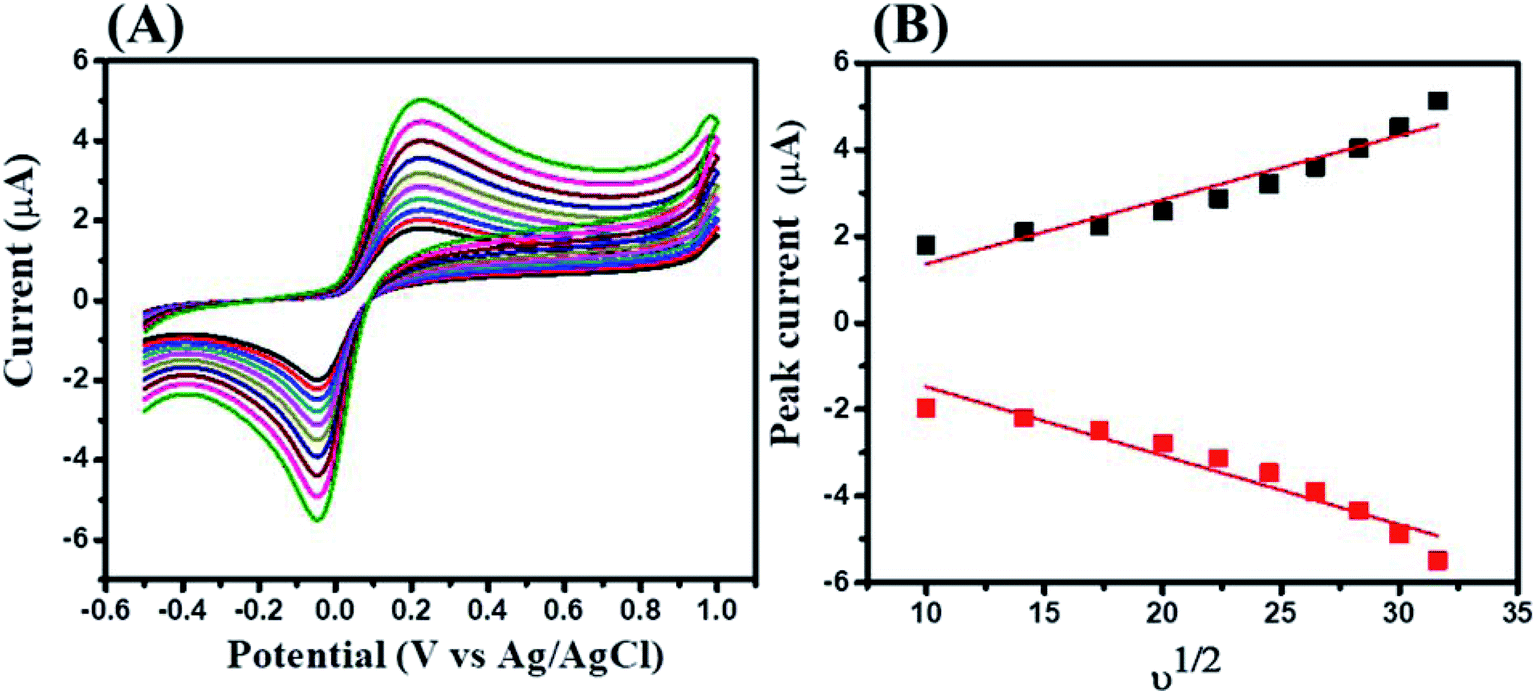 | ||
| Fig. 9 CV curves of GCE-2 (A) at different scan rates (100–1000 mV s−1) in the presence of 250 μM HQ in 0.1 M PBS (pH 7.0) and the calibration plot of peak current versus square root of the scan rate (B). | ||
3.3 Square wave voltammetry investigations
The square wave voltammetry (SWV) approach has been known for its higher sensitivity compared to cyclic voltammetry. Thus, we have employed the SWV electrochemical approach for the electrochemical sensing of HQ. SWV curves were recorded for GCE-1, GCE-2, GCE-3 and GCE-4 in the presence of 250 μM HQ in 0.1 M PBS (pH = 7.0). The observations revealed that a higher current response was obtained for GCE-2 (Fig. 10) compared to the other electrodes (GCE-1, GCE-3 and GCE-4). | ||
| Fig. 10 SWV curves of GCE-1 (red), GCE-2 (black), GCE-3 (brown) and GCE-4 (green) in the presence of 250 μM HQ in 0.1 M PBS (pH = 7.0). | ||
This enhanced current may be due to the synergy effect, high specific surface area (Fig. S4†) and electrochemical surface area (Fig. S5†) of N-rGO/SrZrO3 compared to pristine SrZrO3. Furthermore, the SWV curves of GCE-2 were also recorded in the presence of different concentrations (25 μM, 50 μM, 75 μM, 100 μM, 125 μM, 150 μM, 250 μM, 400 μM, 600 μM, 1000 μM, 1300 μM, 1700 μM, 2000 μM and 2500 μM) of HQ (Fig. 11A). The obtained results showed that the current response increases with increasing concentration of HQ. The calibration plot was plotted between the peak current and concentrations of HQ which revealed that the current increases in a linear way (Fig. 11B).
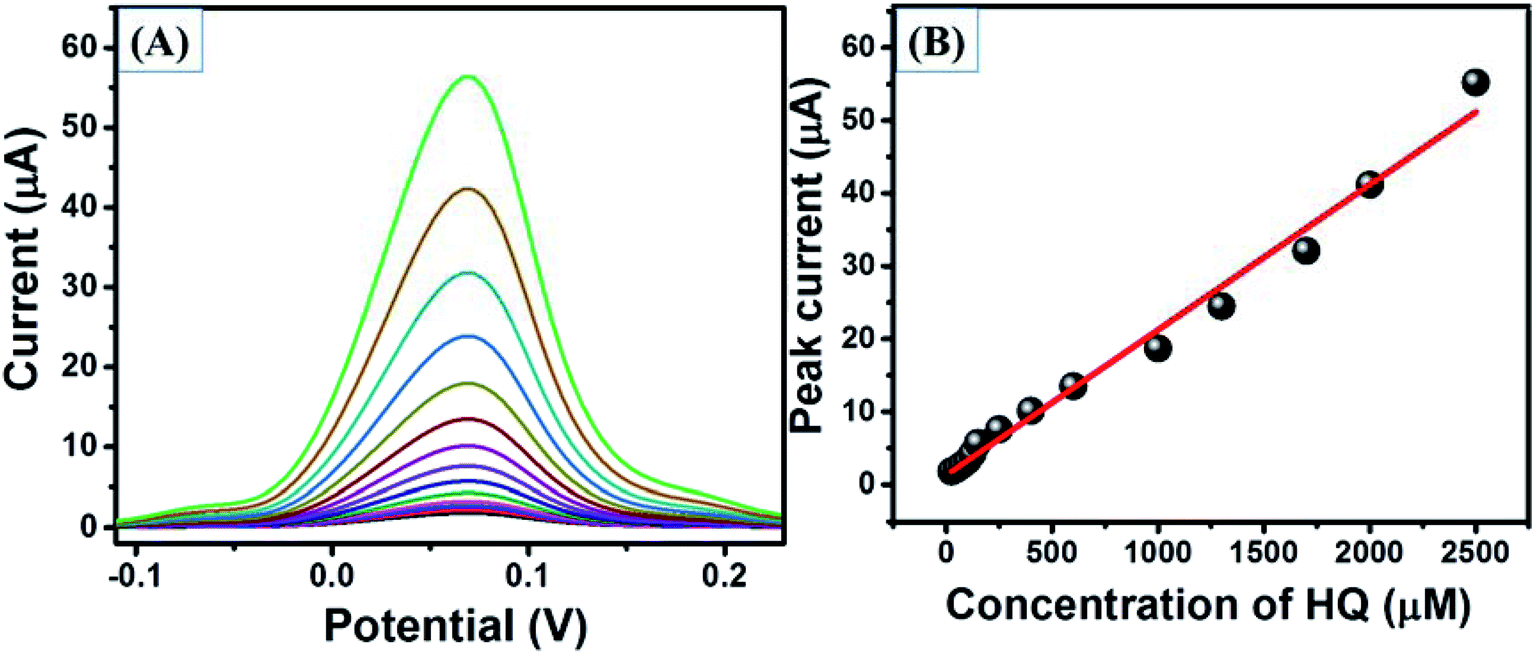 | ||
| Fig. 11 SWV curves (A) of GCE-2 in the presence of different concentrations of HQ and the calibration plot (B) of peak current versus concentrations of HQ. | ||
The probable mechanism of the sensing of HQ has been adopted from previous literature.7 The electrochemical detection of HQ involves the reversible oxidation–reduction reaction as suggested by CV investigations. The two bonds (oxygen–hydrogen) of the phenolic hydroxyl groups broke and in the meantime, HQ lost two electrons and two protons and converted to the quinoid structure (Scheme 2).
 | ||
| Scheme 2 Schematic illustration of the electrochemical sensing of HQ. | ||
Therefore it is clear that the first step involves the conversion of HQ to quinone by releasing 2 protons and subsequently, reverting to HQ by accepting the released protons as depicted in Scheme 2.
3.4 Selectivity
Selectivity is one of the most important characteristics of any ideal sensor. There are many interfering species which may cause an interfering atmosphere which results in inaccurate determination of the analyte. Thus, we have checked the selectivity of GCE-2 towards HQ sensing by using the SWV method. Initially, we have recorded the SWV curve of GCE-2 in the presence of 1400 μM HQ (Fig. 12a). Furthermore, 2500 μL of glucose + fructose was injected and the SWV curve was also recorded (Fig. 12b). Subsequently, 1500 μL of hydrazine + Mg2+ (Fig. 12c) and 1500 μL of dopamine + uric acid + ascorbic acid (Fig. 12d) were also injected and the recorded SWV curves revealed insignificant variation in the current response which indicated the higher selectivity of GCE-2 towards HQ.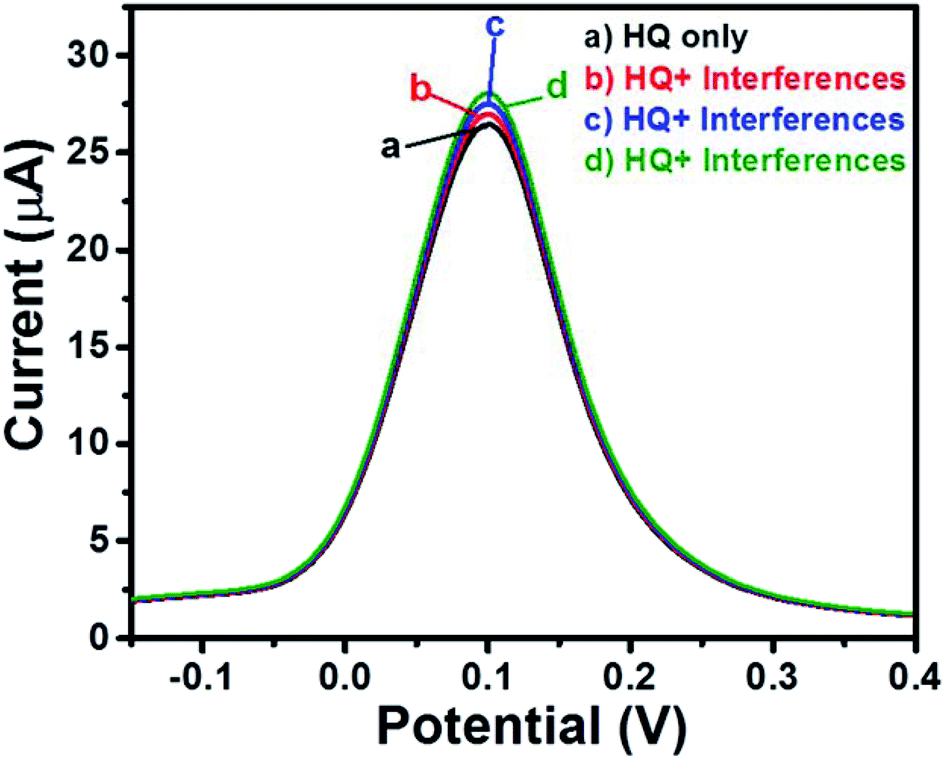 | ||
| Fig. 12 SWV curves of GCE-2 in the presence of different interfering species. | ||
3.5 Repeatability and stability
The repeatability of GCE-2 for the sensing of HQ was also evaluated by recording 5 consecutive SWV curves in the presence of 1600 μM HQ in 0.1 M PBS at pH 7.0 using the SWV method (Fig. S7†). The relative standard deviation (RSD) of the peak current was found to be 2.67%. Subsequently, to check the stability, GCE-2 was kept for 18 days in a vacuum desiccator and the current response was checked using SWV and an insignificant change was observed which confirms its stability for long-term use.3.6 Comparison
The detection limit was calculated to be 0.61 μM using the equation 3.3 × σ/slope (where σ is the standard deviation). Dang et al.7 employed a CePO4/CPE sensor to detect HQ which showed a detection limit of 0.70 μM. Zhang et al.38 employed a polarized glassy carbon electrode which showed a detection limit of 3.7 μM. Carboxylic functional multi-walled carbon nanotubes have been used to construct a HQ sensor by Feng et al.39 and the developed sensor has shown a detection limit of 2.3 μM. We have compared the detection limit obtained by GCE-2 with previously reported sensors and the results are summarized in Table 1. From Table 1, it is clear that GCE-2 has advantages over previously reported sensors in terms of the detection limit and wide linear range.| No. | Electrode | Linear range (μA μM−1) | Limit of detection (LOD) μM | References |
|---|---|---|---|---|
| 1. | CePO4/CPE | 0.4–50 | 0.70 | 7 |
| 2. | Polarized glassy carbon electrode | 10–300 | 3.57 | 38 |
| 3. | Carboxylic functional multi-walled carbon nanotubes | 10–120.0 | 2.3 | 39 |
| 4. | Carbon nanocages–RGO/GCE | 1–400 | 0.87 | 40 |
| 5. | Poly-amidosulfonic acid/MWNTs/GCE | 8–391 | 2.60 | 41 |
| 6. | MWCNT–poly-malachite green/GCE | 10–480 | 1.60 | 42 |
| 7. | Carbon nano-fragment–AuNPs | 9–500 | 0.86 | 43 |
| 8. | AuNPs/Fe3O4/APTESGO/GCE | 3–137 | 1.1 | 44 |
| 9. | GCE-2 | 25–2500 | 0.61 | This work |
4. Conclusion
Finally, it can be concluded that a SrZrO3 cube embedded nitrogen doped reduced graphene oxide (N-rGO–SrZrO3) composite has been prepared by using the reflux method. Furthermore, a highly selective electrochemical sensor (hydroquinone sensor) was fabricated by employing N-rGO–SrZrO3 as the electrode modifier. Different electrochemical approaches (cyclic voltammetry and square wave voltammetry) have been employed for the determination of hydroquinone. The fabricated sensor has shown excellent performance towards the detection of hydroquinone using square wave voltammetry compared to cyclic voltammetry. Moreover, the fabricated sensor exhibited a good detection limit, repeatability, reproducibility and high selectivity towards the sensing of hydroquinone.Conflicts of interest
There are no conflicts to declare.Acknowledgements
K. A. would like to thank the UGC, India, for RGNFD. P. K. acknowledges DST-Inspire for providing fellowship. We sincerely acknowledge SIC and Discipline of Chemistry, IIT Indore, for providing characterization facility. S. M. M. thanks the CSIR (Project: 01(2935)/18/EMR-II), SERB-DST (Project: EMR/2016/001113) and IIT Indore, India, for financial support.References
- Y. Zhang, S. Xiao, J. Xie, Z. Yang, P. Pang and Y. Gao, Simultaneous electrochemical determination of catechol and hydroquinone based on graphene-TiO2 nanocomposite modified glassy carbon electrode, Sens. Actuators, B, 2014, 204, 102–108 CrossRef CAS.
- J. He, R. Qiu, W. Li, S. Xing, Z. Song, Q. Li and S. Zhang, A voltammetric sensor based on eosin Y film modified glassy carbon electrode for simultaneous determination of hydroquinone and catechol, Anal. Methods, 2014, 6, 6494–6503 RSC.
- P. Kerzic, W. Liu, M. Pan, H. Fu, Y. Zhou and A. Schnatter, et al., Analysis of hydroquinone and catechol in peripheral blood of benzene-exposed workers, Chem.-Biol. Interact., 2010, 184, 182–188 CrossRef CAS PubMed.
- H. J. Du, J. S. Ye, J. Q. Zhang, X. D. Huang and C. Z. Yu, A voltammetric sensor based on graphene-modified electrode for simultaneous determination of catechol and hydroquinone, J. Electroanal. Chem., 2011, 650, 209–213 CrossRef CAS.
- J. Ahmed, M. M. Rahman, I. A. Siddiquey and A. M. Asiri, Efficient hydroquinone sensor based on zinc, strontium and nickel based ternary metal oxide (TMO) composites by differential pulse voltammetry, Sens. Actuators, B, 2018, 256, 383–392 CrossRef CAS.
- M. Deng, S. R. Lin, X. J. Bo and L. P. Guo, Simultaneous and sensitive electrochemical detection of dihydroxybenzene isomers with UiO-66 metal-organic framework/mesoporous carbon, Talanta, 2017, 174, 527–538 CrossRef CAS PubMed.
- Y. Dang, Y. Zhai, L. Yang, Z. Peng, N. Cheng and Y. Zhou, Selective electrochemical detection of hydroquinone and catechol at a one-step synthesised pine needle-like nano-CePO4 modified carbon paste electrode, RSC Adv., 2016, 6, 83994–84002 RSC.
- Y. Song, T. Yang, X. Zhou, H. Zheng and S.-I. Suye, A microsensor for hydroquinone and catechol based on a poly(3,4-ethylenedioxythiophene) modified carbon fiber electrode, Anal. Methods, 2016, 8, 886–892 RSC.
- Y. H. Huang, J. H. Chen, X. Sun, Z. B. Su, H. T. Xing, S. R. Hu, W. H. Weng, X. Guo, W. B. Wu and Y. S. He, One-pot hydrothermal synthesis carbon nanocages-reduced graphene oxide composites for simultaneous electrochemical detection of catechol and hydroquinone, Sens. Actuators, B, 2015, 212, 165–173 CrossRef CAS.
- M. Pistonesi, M. Di Nezio, M. Centurión, M. Palomeque, A. Lista and B. Fernández Band, Determination of phenol, resorcinol and hydroquinone in air samples by synchronous fluorescence using partial least-squares (PLS), Talanta, 2006, 69, 1265–1268 CrossRef CAS PubMed.
- H. Cui, Q. L. Zhang, A. Myint, X. W. Ge and L. J. Liu, Chemiluminescence of cerium(IV)–rhodamine 6G–phenolic compound system, J. Photochem. Photobiol., A, 2006, 181, 238–245 CrossRef CAS.
- A. Afkhami and H. Khatami, Indirect kinetic-spectrophotometric determination of resorcinol, catechol, and hydroquinone, J. Anal. Chem., 2001, 56, 429–432 CrossRef CAS.
- J. Garcia-Mesa and R. Mateos, Direct automatic determination of bitterness and total phenolic compounds in virgin olive oil using a pH-based flow-injection analysis system, J. Agric. Food Chem., 2007, 55, 3863–3868 CrossRef CAS PubMed.
- A. Kovács, M. Mórtl and A. Kende, Development and optimization of a method for the analysis of phenols and chlorophenols from aqueous samples by gas chromatography–mass spectrometry, after solid-phase extraction and trimethylsilylation, Microchem. J., 2011, 99, 125–131 CrossRef.
- B. Mishra, L. Kumbhare, V. Jain and K. Priyadarsini, Pulse radiolysis studies on reactions of hydroxyl radicals with selenocystine derivatives, J. Phys. Chem. B, 2008, 112, 4441–4446 CrossRef CAS PubMed.
- E. Podolina, O. Rudakov, E. Khorokhordina and L. Kharitonova, Use of acetonitrile for the extraction of dihydric phenols from salt aqueous solutions followed by HPLC determination, J. Anal. Chem., 2008, 63, 468–471 CrossRef CAS.
- K. He, X. Wang, X. Meng, H. Zheng and S.-I. Suye, Amperometric determination of hydroquinone and catechol on gold electrode modified by direct electrodeposition of poly(3,4-ethylenedioxythiophene), Sens. Actuators, B, 2014, 193, 212–219 CrossRef CAS.
- Y. Qi, Y. Cao, X. Meng, J. Cao, X. Li, Q. Hao, W. Lei, Q. Li, J. Li and W. Si, Facile synthesis of 3D sulfur/nitrogen co-doped graphene derived from graphene oxide hydrogel and the simultaneous determination of hydroquinone and catechol, Sens. Actuators, B, 2018, 279, 170–176 CrossRef.
- T. Gan, J. Sun, K. Huang, L. Song and Y. Li, A graphene oxide–mesoporous MnO2 nanocomposite modified glassy carbon electrode as a novel and efficient voltammetric sensor for simultaneous determination of hydroquinone and catechol, Sens. Actuators, B, 2013, 177, 412–418 CrossRef CAS.
- Y. Peng, Z. R. Tang, Y. P. Dong, G. Che and Z. F. Xi, Electrochemical detection of hydroquinone based on MoS2/reduced graphene oxide nanocomposites, J. Electroanal. Chem., 2018, 816, 38–44 CrossRef CAS.
- S. Stolen, E. Bakken and C. E. Mohn, Oxygen-deficient perovskites: linking structure, energetics and ion transport, Phys. Chem. Chem. Phys., 2006, 8, 429–447 RSC.
- W.-J. Yin, J.-H. Yang, J. Kang, Y. Yan and S.-H. Wei, Halide perovskite materials for solar cells: a theoretical review, J. Mater. Chem. A, 2015, 3, 8926–8942 RSC.
- G. Guo, K. Lian, F. Gu, D. Han and Z. Wang, Three dimensionally ordered macroporous Pd–LaMnO3 self-regeneration catalysts for methane combustion, Chem. Commun., 2014, 50, 13575–13577 RSC.
- S. K. Gupta, P. S. Ghosh, A. K. Yadav, N. Pathak, A. Arya, S. N. Jha, D. Bhattacharyya and R. M. Kadam, Luminescence Properties of SrZrO3/Tb3+ Perovskite: Host-Dopant Energy-Transfer Dynamics and Local Structure of Tb3+, Inorg. Chem., 2016, 55, 1728–1740 CrossRef CAS PubMed.
- J. Staniforth, S. E. Evans, O. J. Good, R. J. Darton and R. M. Ormerod, A novel perovskite based catalyst with high selectivity and activity for partial oxidation of methane for fuel cell applications, Dalton Trans., 2014, 43, 15022–15027 RSC.
- Z. Guo, B. Sa, B. Pathak, J. Zhou, R. Ahuja and Z. Sun, Band gap engineering in huge-gap semiconductor SrZrO3 for visible-light photocatalysis, Int. J. Hydrogen Energy, 2014, 39, 2042–2048 CrossRef CAS.
- Z. Guo, B. Sa, J. Zhou and Z. Sun, Role of oxygen vacancies in the resistive switching of SrZrO3 for resistance random access memory, J. Alloys Compd., 2013, 580, 148–151 CrossRef CAS.
- K. Ahmad and S. M. Mobin, Graphene oxide based planar heterojunction perovskite solar cell under ambient condition, New J. Chem., 2017, 41, 14253–14258 RSC.
- K. Ahmad, S. N. Ansari, K. Natarajan and S. M. Mobin, Design and Synthesis of 1D-Polymeric Chain Based [(CH3NH3)3Bi2Cl9]n Perovskite: A New Light Absorber Material for Lead Free Perovskite Solar Cells, ACS Appl. Energy Mater., 2018, 1, 2405–2409 CrossRef CAS.
- K. Ahmad, S. N. Ansari, K. Natarajan and S. M. Mobin, A (CH3NH3)3Bi2I9 Perovskite Based on a Two-Step Deposition Method: Lead-Free, Highly Stable, and with Enhanced Photovoltaic Performance, ChemElectroChem, 2019, 6, 1–8 CrossRef.
- K. Ahmad and S. M. Mobin, High surface area 3D-MgO flowers as the modifier for the working electrode for efficient detection of 4-chlorophenol, Nanoscale Adv., 2019, 1, 719–727 RSC.
- K. Ahmad, A. Mohammad and S. M. Mobin, Hydrothermally grown α-MnO2 nanorods as highly efficient low cost counter-electrode material for dye-sensitized solar cells and electrochemical sensing applications, Electrochim. Acta, 2017, 252, 549–557 CrossRef CAS.
- K. Ahmad, A. Mohammad, P. Mathur and S. M. Mobin, Preparation of SrTiO3 perovskite decorated rGO and electrochemical detection of nitroaromatics, Electrochim. Acta, 2016, 215, 435–446 CrossRef CAS.
- C. Hao, Y. Zhou, Y. Dang, S. Chai, G. Han, Z. Li, H. Zhang and Y. Zhang, The partial substitution of Cd by La ions in CdWO4 nanocrystal for the efficiently enhanced electrochemical sensing of BPA, Electrochim. Acta, 2019, 318, 581–589 CrossRef CAS.
- G. Vijayaprasath, R. Murugan, G. Ravi, T. Mahalingam and Y. Hayakawa, Characterization of dilute magnetic semiconducting transition metaldoped ZnO thin films by sol–gel spin coating method, Appl. Surf. Sci., 2014, 313, 870–876 CrossRef CAS.
- L. V. Devi, T. Selvalakshmi, S. Sellaiyan, A. Uedono, K. Sivaji and S. Sankar, Effect of La doping on the lattice defects and photoluminescence properties of CuO, J. Alloys Compd., 2017, 709, 496–504 CrossRef CAS.
- L. Xing and Z. Ma, A glassy carbon electrode modified with a nanocomposite consisting of MoS2 and reduced graphene oxide for electrochemical simultaneous determination of ascorbic acid, dopamine, and uric acid, Microchim. Acta, 2016, 183, 257–263 CrossRef CAS.
- H. Zhang, S. Li, F. Zhang, M. Wang, X. Li and H. Li, Simultaneous detection of hydroquinone and catechol on electrochemical-activated glassy carbon electrode by simple anodic and cathodic polarization, J. Solid State Electrochem., 2017, 21, 735–745 CrossRef CAS.
- S. Feng, Y. Zhang, Y. Zhong, Y. Li and S. Li, Simultaneous determination of hydroquinone and catechol using covalent layer-by-layer self-assembly of carboxylated-MWNTs, J. Electroanal. Chem., 2014, 733, 1–5 CrossRef CAS.
- Y. H. Huang, J. H. Chen, X. Sun, Z. B. Su, H. T. Xing, S. R. Hu, W. H. Weng, X. Guo, W. B. Wu and Y. S. He, One-pot hydrothermal synthesis carbon nanocages-reduced graphene oxide composites for simultaneous electrochemical detection of catechol and hydroquinone, Sens. Actuators, B, 2015, 212, 165–173 CrossRef CAS.
- F. Hu, S. Chen, C. Wang, R. Yuan, D. Yuan and C. Wang, Study on the application of reduced graphene oxide and multiwall carbon nanotubes hybrid materials for simultaneous determination of catechol, hydroquinone, p-cresol and nitrite, Anal. Chim. Acta, 2012, 724, 40–46 CrossRef CAS PubMed.
- Y. Umasankar, A. P. Periasamy and S.-M. Chen, Electrocatalysis and simultaneous determination of catechol and quinol by poly(malachite green) coated multiwalled carbon nanotube film, Anal. Biochem., 2011, 411, 71–79 CrossRef CAS PubMed.
- Z. Huo, Y. Zhou, Q. Liu, X. He, Y. Liang and M. Xu, Sensitive simultaneous determination of catechol and hydroquinone using a gold electrode modified with carbon nanofibers and gold nanoparticles, Microchim. Acta, 2011, 173, 119–125 CrossRef CAS.
- S. Erogul, S. Z. Bas, M. Ozmen and S. Yildiz, A new electrochemical sensor based on Fe3O4 functionalized graphene oxide-gold nanoparticle composite film for simultaneous determination of catechol and hydroquinone, Electrochim. Acta, 2015, 186, 302–313 CrossRef CAS.
Footnote |
| † Electronic supplementary information (ESI) available: Experimental section, Fig. S1–S7, and Tables S1 and S2. See DOI: 10.1039/c9na00573k |
| This journal is © The Royal Society of Chemistry 2020 |