 Open Access Article
Fast and selective detection of volatile organic compounds using a novel pseudo spin-ladder compound CaCu2O3†
N.
Lavanya
ab,
G.
Veerapandi
 a,
S. G.
Leonardi
c,
N.
Donato
c,
G.
Neri
 *c and
C.
Sekar
 *a
*a
aDepartment of Bioelectronics and Biosensors, Alagappa University, Karaikudi-630 004, India. E-mail: Sekar2025@gmail.com
bSensobix Canada Inc, Toronto-M1S0G4, Ontario, Canada
cDepartment of Engineering, University of Messina, Messina, Italy. E-mail: gneri@unime.it
First published on 20th August 2020
Abstract
Spin-ladders are a class of unique materials in low dimensional systems with a complex structure and intriguing properties originating from quantum fluctuations. Spin-ladder compounds with an even and odd number of legs have quite generic features and have the potential for promising technological applications. In this paper, a novel pseudo spin-ladder CaCu2O3 compound (2-leg) based conductometric gas sensor has been proposed, for the first time, for the detection of volatile organic compounds (VOCs). Nanostructured CaCu2O3 rods were synthesized by a hydrothermal method and annealed in air at different temperatures (200, 400 and 600 °C). Powder XRD, SEM-EDX, XPS, photoluminescence (PL) and electrical characterisation studies indicated that CaCu2O3 crystallized in an orthorhombic structure with a tiny rod-shaped morphology. The gas sensing properties of the nanostructured CaCu2O3 were then investigated by fabricating thick-film conductometric sensors and exposing them to ethanol and acetone, chosen as the representative VOC target gases. CaCu2O3 annealed at a low temperature (200 °C) showed excellent performance towards both ethanol and acetone monitoring. At the optimal operating temperature of 200 °C, the sensor showed a response, S = Rg/Ra, of 2.6 towards 10 ppm ethanol and 2.4 towards acetone with a fast response/recovery time of 25 and 150 s for both VOCs tested. In addition, the proposed sensor shows high selectivity against some common interfering gases.
1. Introduction
Volatile organic compounds (VOCs) include a large variety of organic chemicals having the melting point below room temperature and the boiling point between 50 and 260 °C, as per the definition by the World Health Organization (WHO). They have a different chemical nature and are present everywhere in indoor and outdoor ambient environments, produced by a number of industrial (including petrochemical plants, burning fuels, solvents, paints) and domestic (furniture and cooking) sources. VOCs (e g. acetone, ethanol, isoprene, etc.) are also found in the exhaled human breath, mainly as a result of the biochemical reactions occurring in our body or due to the ingestion of food, beverages or drugs. The concentrations of such VOCs are usually very low, at the sub-ppm level, or even lower.1,2 Abnormal concentrations of VOCs in breath are reported to correlate with unhealthy/injurious body/organ conditions, for instance, ethanol for drunken people, acetone for diabetes, trimethylamine for uremic patients and ammonia gas for renal disease.3,4 Hence, VOCs in the exhaled breath can potentially be used as disease-specific biomarkers for non-invasive early detection for monitoring health. Among them, acetone and ethanol are surely the most important and therefore the most largely investigated ones.Breath acetone can be produced by the oxidation of fatty acids during diabetes and ketoacidosis due to the lack of insulin. Excessive acetone circulating in the blood system is excreted from the lungs. A higher acetone concentration ranging from 1.7 ppm to 3.7 ppm could be detected in breath for those who are diabetic, while the breath of healthy humans typically contains less than 0.8 ppm.5 Thus, gas sensors with sub-ppm acetone detection capacity play an important role in the development of non-invasive monitoring methods or in early diagnosis of potential diabetic patients.6 The demand for breath ethanol detection is also very high. Acute and/or chronic ingestion of high ethanol quantities results in health problems.7 To date, various gas sensors have been successfully developed to detect VOCs by metal oxides controlling the morphology or by introducing additives8–12 and also numerous efforts have been made to improve the sensing performances by choosing novel nanomaterials.13–15 Wang et al.16 reported a high performance ethanol sensor based on Au-modified three-dimensionally ordered macroporous ZnO:In. The sensor based on the 0.05 mol% Au-loaded 3D ZnO:In is reported to exhibit the highest sensitivity (∼240) to 100 ppm ethanol at 250 °C with high selectivity and good stability. Sunghoon Park17 reported the application of TiO2 nanoparticle functionalised In2O3 nanowires for sensing ethanol and acetone at operating temperatures of 350 °C and 250 °C, respectively. The TiO2 nanoparticle functionalised In2O3 nanowire sensors exhibited enhanced acetone gas sensing properties, with 5.1 times higher response when exposed to 10 ppm acetone gas, when compared to the as-synthesized In2O3 nanowire sensors.
Apart from such unique approaches to modify the known binary semiconducting metal oxides for improving the sensing performances, attempts are also being made to make use of ternary metal oxides for VOC detection. Zhou et al.13 reported the synthesis of cube-shaped ZnSnO3 with hollow structures which exhibited a high response to 100 ppm ethanol at 260 °C, which was approximately 1.77-times higher than that of ZnSnO3 solid cubes. Xue-Zhi Song et al.14 reported the synthesis of hollow NiFe2O4 microspindles through a metal–organic framework (MOF) route and its application in acetone gas sensing with a high sensitivity of 52.8 towards 200 ppm.
In the present work, we report the design and development of a new gas sensor based on a novel spin ladder compound, namely CaCu2O3. Cuprates, containing Cu–O ladders, are of high interest because of their unique magnetic properties and possible relation to high-Tc cuprate superconductors.18 Moreover, they show fascinating and fundamental effects of low- dimensional magnetism depending on the number of Cu–O chains called “legs” in the spin ladder structure. In an ideal case of isolated ladders with antiferromagnetic (AFM) exchange within the rungs and legs, even-leg compounds (e.g. SrCu2O3) reveal a spin-gap behaviour and thus the magnetic susceptibility exponentially vanishes at low temperatures. On the other hand, for odd-leg ladder compounds such as Sr2Cu3O5, the magnetic susceptibility remains finite.19 Among the spin ladder cuprates, the CaCu2O3 compound received a lot of attention due to its pseudo-spin ladder structure with 2-legs and a buckled angle in the rungs. CaCu2O3 has a crystal structure similar to the two-leg spin-ladder compound SrCu2O3 and is nonmagnetic at low temperatures below 15 K. However, in contrast to the Sr-123 counterpart where the Cu spin chains parallel to the b axis are coupled in the ab planes into ladders via a strong rung antiferromagnetic (AF) exchange, in CaCu2O3 the Cu–O–Cu bond angle in the rungs deviates significantly from 180°, resulting in a reduced rung coupling of 123° (Fig. 1). Remarkably, no hint for a spin gap in the Ca compound was noticed so far. This suggests that the corrugation of the ladders changes the spin topology from nearly isolated two-leg ladders to pseudo-ladders with significant interladder interactions, i.e. the coupled spin chains in this pseudo-ladder compound form anisotropic bilayers parallel to the bc plane.18–21 Owing to an appreciable inter-plane magnetic exchange along the c direction (Jc) concomitant with a strongly reduced rung interaction Jr, CaCu2O3 orders antiferromagnetically at TN = 25 K.
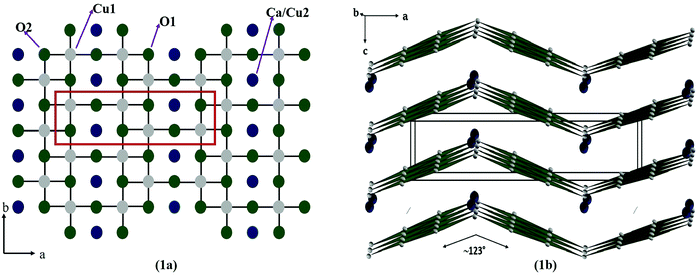 | ||
| Fig. 1 Crystal structure of the CaCu2O3 system representing the crystallographic ab plane (a) and the ac plane (b). | ||
Due to these interesting structural and physical properties, we have synthesized nanostructured CaCu2O3via a facile hydrothermal method and investigated its physical properties in order to assess its suitability for gas sensing applications. Therefore, thick-film conductometric sensors have been fabricated using CaCu2O3 as a sensing layer and the gas sensing properties were investigated by exposing them to ethanol and acetone, chosen as the representative target gases. To the best of our knowledge, this represents the first approach for the sensing of these gaseous substances using spin-ladder compound based sensors. Indeed, the use of cuprate compounds as gas sensors has been very limited so far and restricted only to a few gases. For example, Gupta et al. reported the possible application of high Tc cuprates, YBCO and BSCCO, well known superconducting materials, as sensing materials for FET sensors for the detection of simple gases such as NH3, H2, CO, CO2, NO, NO2, and hydrocarbon gases.21 Compounds of the high Tc cuprate family were also investigated for resistive oxygen sensor applications.22,23
The as-prepared CaCu2O3 was annealed at different temperatures (200, 400 and 600 °C) with the aim to optimize the sensing properties. At 200 °C it demonstrated the most excellent performance towards ethanol and acetone monitoring, operating at an optimal operating temperature of 200 °C. The sensor showed a good response towards 10 ppm ethanol/acetone with a fast response/recovery time in addition to a high selectivity against common interfering gases. These results are encouraging because this is the first ever report on the CaCu2O3 system for important applications as a conductometric gas sensor. The high-performance sensing behavior of CaCu2O3 towards acetone and ethanol gases suggests that this novel ternary system can be a promising candidate for gas sensor applications; thus, the present study paves the way for the fabrication of advanced gas sensors using ternary metal oxides from the high Tc cuprate family.
2. Materials and methods
2.1 Synthesis of nanostructured CaCu2O3
Nanostructured CaCu2O3 was synthesized by a hydrothermal method. 0.1 M of CaCO3 and 0.2 M CuO were dissolved in 200 mL of distilled water under magnetic stirring for 30 min. The obtained solution was transferred into a Teflon-lined stainless steel autoclave (250 mL) and heated at 200 °C for 24 h in an ambient atmosphere. After cooling to room temperature, the resultant powder was rinsed with deionized water and ethanol repeatedly, separated by centrifugation, and annealed at 200 °C, 400 °C and 600 °C for 5 h to obtain CaCu2O3 powder samples. Accordingly, they were named as CaCu2O3-200, CaCu2O3-400, and CaCu2O3-600, respectively.2.2 Characterization studies
Powder X-ray diffraction (XRD) analysis was carried out on a Bruker diffractometer within the 2θ range of 20 to 80° using CuKα as the X-ray source (λ = 1.5406 Å). The surface morphology of the samples was characterized using a field emission-scanning electron microscope ZEISS 1540XB equipped with an EDX detector. Room temperature photoluminescence (PL) measurements were carried out on a NanoLog modular Horiba spectrofluorometer, using a Xe lamp as the excitation light source at 325 nm. Emission spectra were recorded between 350 and 750 nm.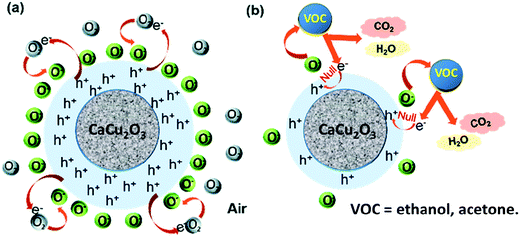 | ||
| Scheme 1 Schematic representation of the sensing mechanism for the CaCu2O3 based conductometric sensor towards ethanol and acetone. | ||
Conductometric sensors were fabricated by mixing the samples with a suitable quantity of water in order to obtain a paste and then printing a thick film (∼10 μm) on alumina planar substrates (3 mm × 6 mm) supplied with interdigitated Pt electrodes and a heating element on the back side. I–V vs. temperature data were collected from the sensing layer by means of a Keithley 2400 source/meter by putting the sensor in a stainless steel vacuum chamber, at a vacuum level of 10−8 mbar, equipped with a cryogenic thermal chuck in a double stage configuration. Sensing tests were performed in this homemade apparatus which operated at a controlled temperature and to perform resistance measurements while varying the carbon dioxide concentration in the carrier stream. The measurements were performed under dry synthetic air total stream of 100 sccm, collecting the sensor's resistance data in the four probe mode by means of an Agilent 34970A multimeter. Relative humidity (RH = 60%) was generated by an air bubbler, controlled by the temperature of the bubbler and monitored using a humidity sensor (Vaisala Humidity and Temperature Probe model No. HMT333). The gas response was defined as the ratio S = R/R0, where R and R0 represent the electrical resistance of the sensor at different gas concentrations and in dry air, respectively. The response time, τres, was defined as the time required for the sensor to reach 90% of the saturation signal and the recovery time, τrec, was defined as the time needed to bring the signal back to 90% of the baseline signal.
3. Results and discussion
3.1 Morphological and microstructural properties
Fig. 2 shows the SEM images of the CaCu2O3 sample annealed at 200 °C indicating the rod-shaped morphology with nearly uniform diameters. The thermal properties and the crystallization process of the CaCu2O3 system have been studied and an equilibrium phase diagram of the CaO–CuO pseudo-binary system at 1 bar of O2 has been proposed in our earlier studies.24 The results clearly indicated that CaCu2O3 is thermally stable for up to 800 °C where the uptake of oxygen begins with an increase in its mass as witnessed in the thermogravimetry analysis. Hence, we have carefully chosen a low temperature of 400 °C and 600 °C for annealing the nanostructured CaCu2O3 prepared by the hydrothermal method. This low temperature annealing did not change the morphology and the crystal structure except that the crystallinity changed as evidenced by the powder XRD results. Further, large-size rod shaped CaCu2O3 single crystals grown by the travelling solvent floating zone (TSFZ) method exhibited a preferred growth direction as the b-axis of the orthorhombic system (space group: Pmmn). The topology of the tiny rod-shaped CaCu2O3 nanocrystals synthesized in the present work is in agreement with the above results reported for large single crystals.The actual composition of the elements in the end product CaCu2O3, as examined by energy dispersive X-ray spectroscopy (EDX) attached with FE-SEM, is shown in Fig. 3. The results indicated that the product is composed of only the major constituent elements Ca, Cu, oxygen and atmospheric carbon. No other peaks related to any elemental impurity are observed, confirming that the synthesized CaCu2O3 nanorods are of high purity.
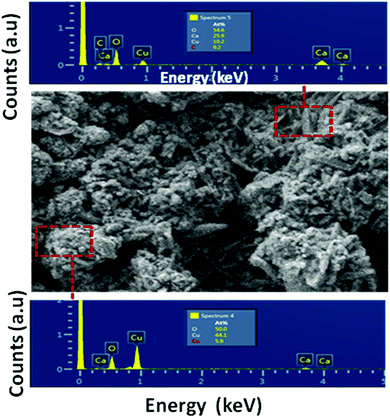 | ||
| Fig. 3 Energy dispersive X-ray spectra (EDX) of the selected zone of the CaCu2O3-200 sample annealed at 200 °C in air. | ||
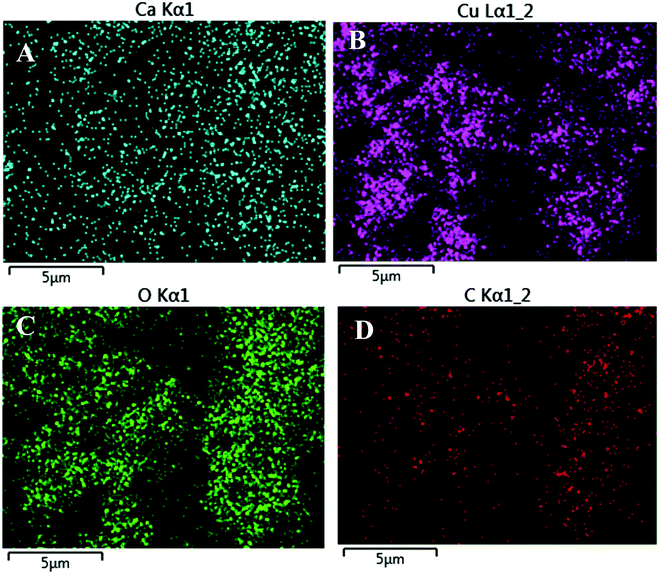
Fig. 4 shows the EDX mapping images of the CaCu2O3-200 sample. These results also confirmed the presence of calcium, copper and oxygen and their even distribution in the sample.
Fig. 5A shows the X-ray diffraction patterns of all the three CaCu2O3 samples annealed at 200, 400, and 600 °C, respectively. In the case of the CaCu2O3-200 sample (pattern a), sharp well-defined diffraction peaks at 2θ values of 32.44, 35.46, 38.65, 48.71, 53.46, 58.26, 61.42, 66.29, 68.10, 72.31 and 75.04° corresponding to the diffraction planes (201), (310), (301), (220), (102), (112), (212), (611), (130), (502) and (330), respectively, have been observed. All these peaks could be assigned to the orthorhombic phase of the CaCu2O3 lattice with the space group Pmmn (JCPDS data card no. 01-071-2295). The lattice parameters (Å) and the cell volume were calculated to be a = 3.56, b = 4.32, c = 9.87 and V = 151.79 Å3, respectively, for the CaCu2O3 sample annealed at 200 °C in ambient air. No additional peaks corresponding to the possible impurity phases such as CuO, CaO, Cu2O or Ca2CuO3 were observed indicating the high purity of the synthesized compound. It has been reported that the actual composition of CaCu2O3 is Ca0.86Cu2.14O2.93, and here, the “Ca” deficiency is balanced by the excessive “Cu” and the charge neutrality is maintained.24 Interestingly, the “orthorhombic” crystal structure is still maintained in the off-stoichiometric Ca0.86Cu2.14O2.93 system and the compounds are chemically and thermally stable as reported by Sekar et al.24 When the sample was annealed at 400 °C (pattern b), the X-ray diffraction peak positions remained the same, but the intensity of the peaks decreased significantly which could be attributed to the reduction in the crystallinity and shrinkage of the crystallite size due to the removal of impurities such as organic residues present in the sample. However, subsequent annealing at 600 °C (pattern c) led to an increase in the peak intensities while retaining the positions at the same 2 theta values, suggesting the improved crystallinity and uptake of oxygen at this elevated temperature. These results suggest that the rod-shaped nanocrystalline CaCu2O3 could be prepared by a hydrothermal method followed by low temperature annealing in an ambient atmosphere.
Photoluminescence (PL) spectroscopy is an important tool for evaluation of defects in semiconductor materials. Fig. 5B shows the PL emission spectra, acquired at room temperature, of the CaCu2O3 annealed at 200, 400 and 600 °C in air. When excited by ultraviolet light (325 nm), the samples present a broad bluish green or green emission, characterized by the presence of two maxima at 510 and 537 nm, respectively. It is clearly observed that on increasing the annealing temperatures, the overall band intensity decreased. This is well known; reduction of the defects is then expected and this consequently could explain the remarkable decrease of the photoluminescence effect. However, the intensity changes with the thermal treatment, and is more pronounced for the green component at 537 nm, which is derived from the transition between the electrons near the conduction band and the deeply trapped holes, which are ionized oxygen vacancies. These results suggest that annealing promotes redistribution of the intermediate states in the optical band-gap.
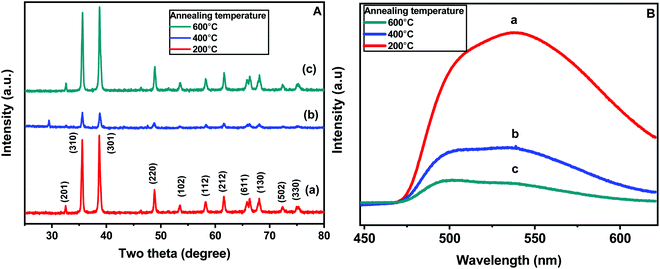 | ||
| Fig. 5 (A) Powder XRD patterns and (B) the photoluminescence spectra of the CaCu2O3 samples annealed at (a) 200 °C, (b) 400 °C, and (c) 600 °C in an ambient air atmosphere. | ||
The survey scan X-ray photoelectron spectrum (Fig. 6a) indicates the occurrence of all the peaks corresponding to the constituent elements Ca, Cu and O of the CaCu2O3 compound. The Ca 2p spectrum of calcium is shown in Fig. 6b. The occurrence of the peaks at 346.58 eV and 350.1 eV for Ca 2p3/2 and Ca 2p1/2 and the difference in the peak separation value of 3.52 eV confirm that the Ca ion is in the +2 state. Fig. 6c presents the XPS spectra of Cu. The fitted peaks at around 931.8 eV and 951.8 eV are due to Cu 2p3/2 and Cu 2p1/2 of Cu+ and the peaks at 933.3 eV and 953.5 eV are due to Cu 2p3/2 and Cu 2p1/2 of Cu2+. These results are in very good agreement with the report that Cu is in the mixed valence state (+1 and +2), in order to accommodate the intrinsic deficiency of Ca and excessive Cu leading to the off-stoichiometry Ca0.86Cu2.14O2.96 of the Ca-123 system.24 Thus, it could be concluded that the valence of copper is a mixture of +1 and +2 [ref. 25]. The O 1s spectrum of oxygen is shown in Fig. 6d. The observed peak at 528.4 eV is because of O2− of the oxides and the peak at 531.3 eV is due to the O− ions absorbed to compensate the deficiency in the system.26
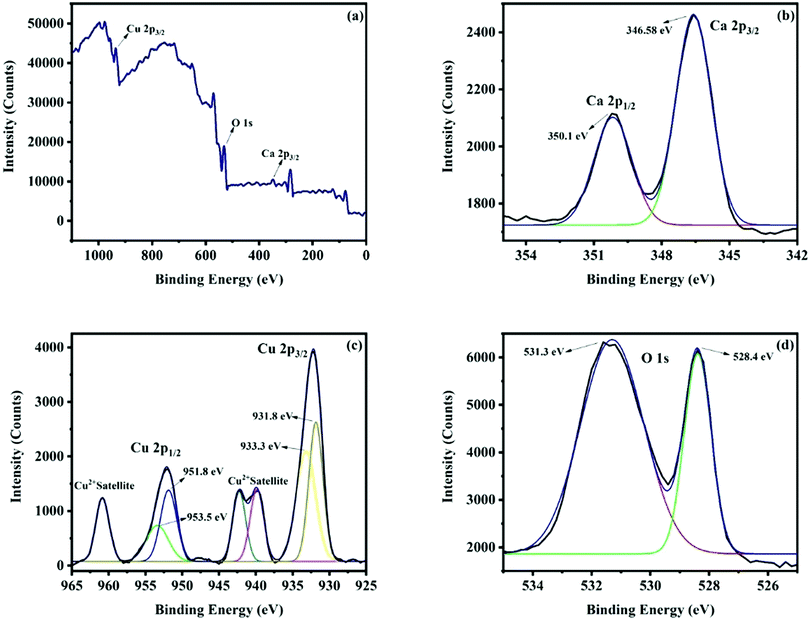 | ||
| Fig. 6 (A) Survey scan XPS spectrum of the CaCu2O3-200 sample annealed at 200 °C in air; (B) the Ca 2p spectrum of calcium, (C) the Cu 2p spectrum of copper, and (D) the O ls spectrum of oxygen. | ||
3.2 Electrical and sensing tests
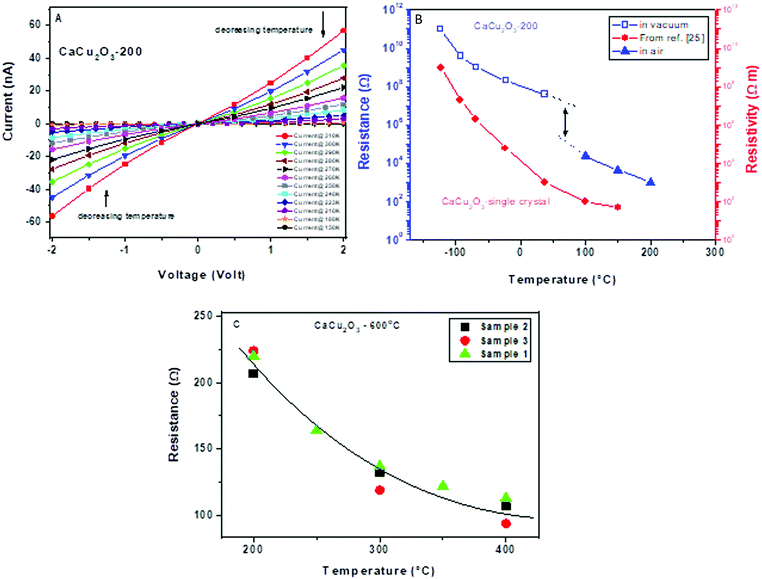
The electrical characteristics of the CaCu2O3 samples were first evaluated. Fig. 7A shows the current–voltage (I–V) vs. temperature characterization data of the CaCu2O3 sample annealed at 200 °C, in a cryogenic temperature range spanning from 310 to 150 K and under high vacuum (10−8 mbar).The almost linear trend of the resistance within the voltage range investigated suggests a quasi-ohmic behavior. Further, by decreasing the temperature an increase of the electrical resistance is observed, as expected for the semiconducting material (see also Fig. 7B). In this graph, the resistance measured for the sensor based on the same sample is also shown during its functioning at a higher temperature in dry air. The misalignment between the two curves is mainly due to the presence or absence of oxygen in these measurements, considering that the presence of oxygen decreases the resistance for p-type semiconducting materials. For comparison, the resistivity of the CaCu2O3 single crystal is also shown, as reported by Lisunov et al.27 It appears that the trend of electrical parameters vs. temperature is almost the same for the single crystal and our powder material. From this plot, we can also note a very low resistance in air of the sensing layer (in a range of few hundreds/thousands of Ohm). On increasing the annealing temperature of the as prepared CaCu2O3 (from 200 to 600 °C), a decrease of the baseline resistance (not shown) was noted. As the XRD data did not give any evidence of the phase change and/or the grain size increase, it can be hypothesized that under the annealing conditions here, the concentration of defects decreased, as confirmed by the photoluminescence data, due to an increase of the diffusion/dislocation processes and this influences positively the pathway for carrier conduction. Fig. 7C shows the trend of the baseline resistance in air of the three sensors fabricated using the CaCu2O3-600 sample. The good correspondence of the baseline resistance demonstrates the reliability in the fabrication procedure for the sensors.
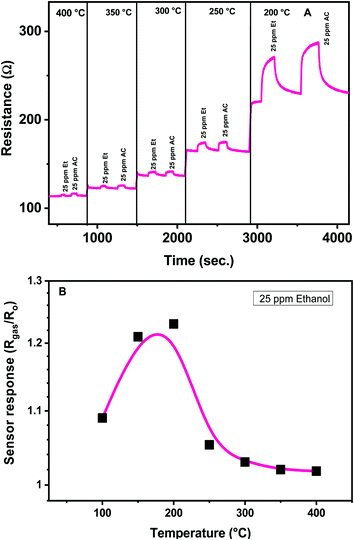
The sensing characteristics (sensitivity, response and recovery time, repeatability and stability) of the developed CaCu2O3 sensors towards some VOCs were evaluated at different temperatures. The operating temperature of the sensor is a key parameter for the conductometric gas sensor, because it can affect the sensor performances largely.28 In particular, the temperature influences the adsorption of oxygen molecules, so different oxygen adsorbed species are present on the surface of the semiconductor sensing layer, contributing to determine the baseline resistance in air and the reactivity of oxygen toward the gas present in the environment around the sensor. The effect of the operating temperature on the electrical and sensing characteristics toward low concentrations of ethanol and acetone for the CaCu2O3-600 sensor has been examined in detail in a temperature range from 400° to 200 °C (Fig. 8A).
The effect of the operating temperature on the CaCu2O3-600 sensor response to 25 ppm of ethanol has been highlighted in Fig. 8B. The sensors show a typical Gaussian shape behavior, exhibiting maximum response at an optimal operating temperature of 200°. No noticeable gas sensing properties have been observed at temperatures lower than 100 °C. Further, below 200 °C, the recovery time of the sensors is very long, so this temperature was chosen for conducting successive sensing experiments.
This characteristic Gaussian behavior can be interpreted on the basis of the adsorption/desorption and reaction processes occurring on the sensing layer surface. At operating temperatures < 200 °C, the sensitivity is low because the adsorbed reducing molecules are not activated enough to react with the surface adsorbed oxygen species. An increase in the operating temperature above 200 °C contributes to overcome the activation energy barrier to the reaction and consequently results in a significant increase in the electron concentration. However, at higher temperatures over 300 °C, gas adsorption is strongly reduced and not adequately compensated by the increase of the surface reaction rate and consequently the sensitivity decreases.
By observing the response registered from the various sensors at this temperature (Fig. 9), we further confirmed that the CaCu2O3 sensing material behaves as a p-type semiconductor, i.e. in the presence of ethanol or acetone (both are reducing gases) its resistance increases. It is well known that when using p-type semiconducting sensing materials, after exposure to air, oxygen molecules can be adsorbed on the surface of the sensor forming a hole accumulation layer.29 Upon exposure to VOCs, the electrons come back to the surface of the sensor, which results in a decrease of the hole accumulation layer, leading consequently to an increase of the sensor's resistance.
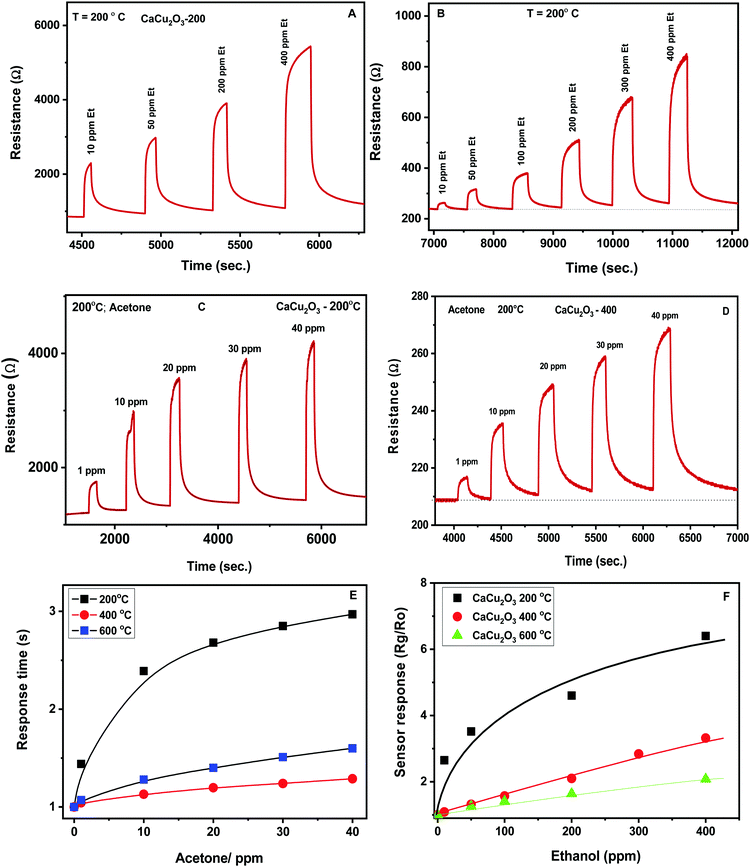
The dynamic response towards different concentrations of ethanol for the CaCu2O3-200 and CaCu2O3-400 sensors is shown in Fig. 9A and B. The response increases with the ethanol concentration and after measuring under each pulse of the target gas, the exposure to a flux of dry air leads to the initial value of the resistance rapidly, highlighting the good reversibility of the sensor. The same behavior of the above mentioned sensors has been noted during monitoring acetone (Fig. 9C and D). The response time for the CaCu2O3-200 sensor at 10 ppm towards ethanol was found to be about 25 seconds. The recovery time was approximately 150 seconds, indicating that the recovery time was rather slow in comparison with the response time. Almost the same response/recovery times were found for the other sensors and for acetone as the target gas.
The sensors show, for each gas, a largely differentiated response. This is better evidenced by the corresponding calibration curves (Fig. 9E and F). It is clearly evidenced that an increase of the annealing temperature led to a strong decrease of the sensor response towards both VOCs tested.
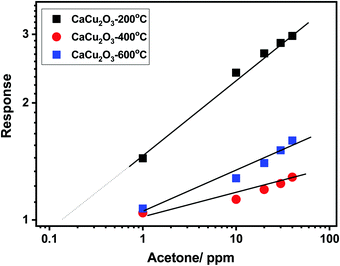
This behavior has been further confirmed by plotting the calibration curves of the sensors investigated in the log–log scale (see Fig. 10). Additionally, the log–log scale allows us to appreciate the low limit of detection (LOD) for both VOCs of the CaCu2O3-200 sensor. This sensor is very effective in detecting acetone at sub-ppm levels, (LOD acetone = ∼100 ppb), whereas the LODs of other sensors are much higher, around 1 ppm for acetone. The same results have been found for ethanol. These results are due to the different annealing temperatures of the CaCu2O3 sensing material. It is well known that the annealing temperature can modify many structural and morphological properties, thus influencing the sensitivity and dynamics characteristics of the sensors.30,31
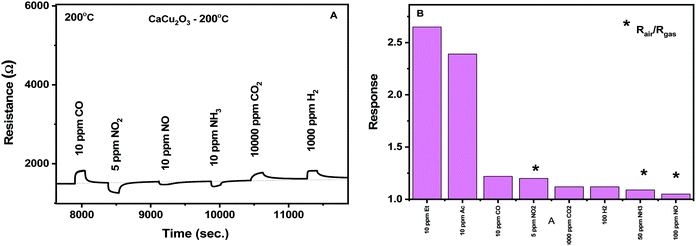
The selectivity of the CaCu2O3 conductometric sensor was evaluated toward some common gases such as NO2, hydrogen, CO, methane, ammonia and oxygen. According to the results obtained (Fig. 11A and B), the sensor shows excellent sensitivity to the VOCs tested. This suggests that the developed sensor can be suitable for the detection of these gases in real samples such as exhaled human breath.
The reproducibility of the sensor response is presented in Fig. 12. It appears clearly that the response to the successive pulses of ethanol, at the same concentration of 25 ppm, is identical both in terms of the resistance change (response) and the dynamic characteristics (response/recovery time). Tests evaluating the reproducibility of the response for a longer time, as well as the baseline drift, are in progress.
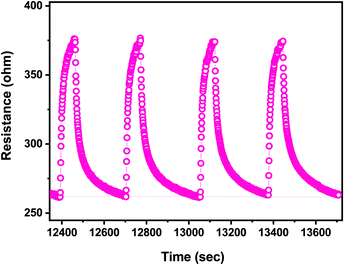 | ||
| Fig. 12 Reproducibility of the response of the CaCu2O3-based sensor to four pulses of ethanol at the same concentration (25 ppm). | ||
Typically, sensing properties depend largely on morphological and microstructural properties. For example, structures with a small particle size, preferably in the nanometer range and/or with a high surface-to-volume ratio, have higher sensitivity than the bulk structures.32–34 The same can be applied to the particle shape, with this parameter playing a key role in many reported cases.35,36 Considering CaCu2O3, the characterization data indicated that both the particle size and shape are not so different after annealing. Thus, the large differences in the sensing properties have to be searched in other properties, which change with the annealing treatment. Looking at the large differences in the photoluminescence intensity with the annealing treatment, we tried to find a correlation between this property and the sensing properties (see Fig. 13). Indeed, photoluminescence gives indications about the defect state in a semiconductor material, which is strongly associated with the sensing properties.37 From the PL data in Fig. 5B, it appears that the CaCu2O3-200 sample has a higher green emission intensity, which confirms the hypothesis made.
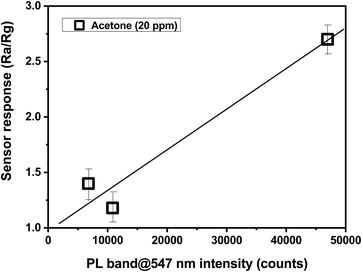 | ||
| Fig. 13 Correlation between the response of the different CaCu2O3-based sensors to 20 ppm of acetone and the intensity of PL green emission. | ||
The gas sensing mechanism for the developed sensor involves a change in the electrical resistance due to the chemical interaction of the target gas with the CaCu2O3 surface, involving gas adsorption, surface reaction, and desorption processes. Among others, Morrison described the conditions for the transport of electric charges through the metal oxide semiconducting layer in the presence of oxygen and reactive gases.38 These conditions largely depend on the n- or p-type behavior of the sensing layer. Data here indicate clearly that CaCu2O3 behaves as a p-type semiconductor, i.e. the carriers for electrical conduction are holes, h+. Thus, in air, charge transfer between the oxygen molecules absorbed and the surface occurs to form active oxygen species (O2−, O−, and O2−) by electron acceptors like oxygen vacancies, creating a positive accumulation zone by holes and a surface negative charge layer. When the sensor is exposed to the reduced VOCs molecules, they react with the adsorbed oxygen to form CO2 and water and release electrons. The electron–hole pair annihilation induces a decrease of the hole concentration which decreases the net surface negative charge and increases the overall resistance of the CaCu2O3 sensor. A detailed analysis of the reactions involved for acetone and ethanol has been previously reported.39 In the schematic representation (Scheme 1)below are represented all the steps which were carried out for the resistance variation and, hence, for the sensor response:
The surface defect content reached maximum at a calcination temperature of 200 °C, and the sensor response reached maximum as well. Therefore, it is reasonable to think that a higher number of defects present on the CaCu2O3-200 sensor is responsible for a higher sensor response due to the more number of adsorbed oxygen molecules produced.
It is known that the surface structures and the composition of the sensing layer are the essential factors governing the response of the sensor towards different gases. The CaCu2O3 sensitive material showed better selectivity to ethanol and acetone gas which could be related to the preferential adsorption of these VOC molecules on its surface. This strong adsorption could be attributed to the high polarities of these gases which implies a strong adsorption at the sensing layer surface. This facilitates the activation of target gas reactions with oxygen at the surface, and leads to a higher selectivity as we observed in our sensor.
4. Conclusions
A nanostructured pseduo-ladder (2-leg) compound CaCu2O3 was directly synthesized by a facile, low cost and template-free low temperature hydrothermal method and annealed at different temperatures in an ambient atmoshere. The products were characterized carefully to understand their physical, structural and chemical properties. The gas sensing properties of the novel spin ladder compound CaCu2O3 towards two important VOCs such as acetone and ethanol were investigated. Specifically, the effect of the annealing temperature on the sensing performances of CaCu2O3 was evaluated. All the fabricated sensors showed reversible resistance changes when exposed to ethanol and acetone vapors. The CaCu2O3 sample annealed at 200 °C exhibited the best gas sensing performances (high response value and good selectivity) to acetone and ethanol vapors at the optimum working temperature of 200 °C. The developed sensor also exhibited a fast response–recovery time as well as a good signal repeatability, stability and selectivity, demonstrating that CaCu2O3, hitherto largely investigated for its superconducting properties, displays interesting gas sensing characteristics. It is noteworthy that the present result is the first direct gas sensor measurement using a novel spin ladder material CaCu2O3.Conflicts of interest
There are no conflicts to declare.Acknowledgements
The authors GVP and CS acknowledge the MHRD-RUSA 2.0 (No. F.24-51/2014-U, Policy (TN Multi-Gen), dated 09.10.2018) and the CSIR (No. 03(1419)/18/EMR-II dated:04.06.2018) for financial assistance.References
- K. Ralf, Volatile organic compounds in the atmosphere, Blackwell, Oxford, UK, 2007, pp. 1–500 Search PubMed.
- H. L. Wang, L. Nie, J. Li, Y. F. Wang, G. Wang, J. H. Wang and Z. P. Hao, Characterization and assessment of volatile organic compounds (VOCs) emissions from typical industries, Chin. Sci. Bull., 2013, 58, 724–730 Search PubMed.
- X. Han, Y. Sun, Z. Feng, G. Zhang, Z. Chen and J. Zhan, Au-deposited porous single-crystalline ZnO nanoplates for gassensing detection of total volatile organiccompounds, RSC Adv., 2016, 6, 37750–37756 Search PubMed.
- A. Mirzaei, S. G. Leonardi and G. Neri, Detection of hazardous volatile organic compounds (VOCs) by metal oxide nanostructures-based gas sensors, Ceram. Int., 2016, 42, 15119–15141 Search PubMed.
- X. Lian, Y. Li, X. Tong, Y. Zou, X. Liu, D. An and Q. Wang, Synthesis of Ce-doped SnO2 nanoparticles and their acetone gas sensing properties, Appl. Surf. Sci., 2017, 407, 447–455 Search PubMed.
- Y.-Y. Yin, F. Li, N. Zhang, S. Ruan, H. Zhang and Y. Chen, Improved gas sensing properties of silver functionalized ZnSnO3 hollow nanocubes, Inorg. Chem. Front., 2018, 5, 2123–2131 Search PubMed.
- S. G. Leonardi, A. Mirzaei, A. Bonavita, S. Santangelo, P. Frontera, F. Panto, P. L. Antonucci and G. Neri, A comparison of the ethanolsensingproperties of alpha-ironoxide nanostructures prepared via the sol–gel and electrospinning techniques, Nanotechnology, 2016, 27, 075502 Search PubMed.
- L. Cheng, S. Y. Ma, T. T. Wang and J. Luo, Synthesis and enhanced acetone sensing properties of 3D porousflower-like SnO2 nanostructures, Mater. Lett., 2015, 143, 84–87 Search PubMed.
- S. M. Li, L. X. Zhang, M. Y. Zhu, G. J. Ji, L. X. Zhao, J. Yin and L. J. Bie, Acetone sensing of ZnO nanosheets synthesized using room-temperature precipitation, Sens. Actuators, B, 2017, 611–623 Search PubMed.
- N. Rajesh, J. C. Kannan, T. Krishnakumar, S. G. Leonardi and G. Neri, Sensing behavior to ethanol of tin oxide nanoparticles prepared by microwave synthesis with different irradiation time, Sens. Actuators, B, 2014, 194, 96–104 Search PubMed.
- X. Li, Y. Chang and Y. Long, Influence of Sn doping on ZnO sensing properties for ethanol and acetone, Mater. Sci. Eng., C, 2012, 32, 817–821 Search PubMed.
- N. Zhang, X. Ma, Y. Yin, Y. Chen, C. Li, J. Yin and S. Ruan, Synthesis of CuO–CdS composite nanowires and their ultrasensitive ethanol sensing properties, Inorg. Chem. Front., 2019, 6, 238–247 Search PubMed.
- T. Zhou, T. Zhang, R. Zhang, J. Deng, Z. Lou, G. Lu and L. Wang, Highly sensitive sensing platform based on ZnSnO3 hollow cubes for detection of ethanol, Appl. Surf. Sci., 2017, 400, 262–268 Search PubMed.
- X.-Z. Song, F.-F. Sun, S.-T. Dai, X. Lin, K.-M. Sun and X.-F. Wang, Hollow NiFe2O4 microspindles derived from Ni/Fe bimetallic MOFs for highly sensitive acetone sensing at low temperatures, Inorg. Chem. Front., 2018, 5, 1107–1114 Search PubMed.
- M. Parthibavarman, V. Hariharan and C. Sekar, High sensitivity humidity sensor based on SnO2 nanoparticles synthesized by microwave irradiation, Mater. Sci. Eng., C, 2011, 31, 840–844 Search PubMed.
- Z. Wang, Z. Tian, D. Han and F. Gu, Au-modified three-dimensionally ordered macroporous ZnO:In for high-performance ethanol sensors, J. Mater. Chem. C, 2020, 8, 2812–2819 Search PubMed.
- P. Sunghoon, Acetone gas detection using TiO2 nanoparticles functionalized In2O3 nanowires for diagnosis of diabetes, J. Alloys Compd., 2017, 696, 655–662 Search PubMed.
- M. Azuma, Z. Hiroi, M. Takano, K. Ishida and Y. Kitaoka, Observation of a spin gap in SrCu2O3 comprising spin-1/2 quasi-1D two-leg ladders, Phys. Rev. Lett., 1994, 73, 3463 Search PubMed.
- Z. Hiroi, M. Azuma, M. Takanom and Y. Bando, A new homologous series Srn−1Cun+1O2n found in the SrO–CuO system treated under high pressure, J. Solid State Chem., 1991, 95, 230–238 Search PubMed.
- T.-K. Tim, H. R, S.-L. Drechsler, Z. Hu, C. Sekar, G. Krabbes, J. Málek, M. Knupfer, J. Fink and H. Eschrig, Unusual electronic structure of the pseudoladder compound CaCu2O3, Phys. Rev. B: Condens. Matter Mater. Phys., 2003, 67, 02451 Search PubMed.
- R.-P. Gupta, Z. Gergintschew, D. Schipanski and P.-D. Vyas, New gas sensing properties of high Tc cuprates, Sens. Actuators, B, 1999, 56, 65–72 Search PubMed.
- K. Sahner, J. Straub and R. Moos, Cuprate-ferrate compositions for temperature independent resistive oxygen sensors, J. Electroceram., 2006, 16, 179–186 Search PubMed.
- R. Blase, K. Härdtl and U. Schönauer, Oxygen Sensor based on non-doped cuprate, US Pat., US 5792666, 1997 Search PubMed.
- C. Sekar, G. Krabbes and A. Teresiak, Effect of Zn doping on crystal growth and structure of the pseudo-ladder compound CaCu2O3, J. Cryst. Growth, 2005, 2733-4, 403–411 Search PubMed.
- G. Z. Xing, J. B. Yi, J. G. Tao, T. Liu, L. M. Wong, Z. Zhang, G. P. Li, S. J. Wang, J. Ding, T. C. Sum, C. H. A. Huan and T. Wu, Comparative study of room temperature ferromagnetism in Cu doped ZnO nanowires enhanced by structural inhomogeneity, Adv. Mater., 2008, 20, 3521 Search PubMed.
- D. Jean-Charles, D. Gonbeau, P. Vinatier and A. Levasseur, Systematic XPS studies of metal oxides, hydroxides and peroxides, Phys. Chem. Chem. Phys., 2000, 6, 1319–1324 Search PubMed.
- K. G. Lisunov, E. Arushanov, B. Raquet, J. M. Broto, F. C. Chou, N. Wizent and G. Behr, Hopping conductivity in CaCu2O3 single crystals, J. Phys.: Condens. Matter., 2006, 18, 8541–8549 Search PubMed.
- G. Neri, First fifty years of chemoresistive gas sensors, Chemosensors, 2015, 3, 1–20 Search PubMed.
- H.-J. Kim and J.-H. Lee, Highly sensitive and selective gas sensors using p-type oxide semiconductors: Overview, Sens. Actuators, B, 2014, 192, 607–627 Search PubMed.
- B. Zhao, M. Hu, X. Qiang and Y. Qin, Effect of annealing temperature on the characteristics and sensing properties of WO3 nanowires, J. Mater. Sci.: Mater. Electron., 2018, 29, 5307–5315 Search PubMed.
- Y. Wei, C. Chen, G. Yuan and S. Gao, SnO2 nanocrystals with abundant oxygen vacancies: preparation and room temperature NO2 sensing, J. Alloys Compd., 2016, 681, 43–49 Search PubMed.
- A. Rothschild and Y. Komem, The effect of grain size on the sensitivity of nanocrystalline metal-oxide gas sensors, J. Appl. Phys., 2004, 95, 6374–6380 Search PubMed.
- C. N. Xu, J. Tamaki, N. Miura and N. Yamazoe, Grain-size effects on gassensitivity of porous SnO2-based elements, Sens. Actuators, B, 1991, 3, 147–155 Search PubMed.
- Y.-F. Sun, S.-B. Liu, F.-L. Meng, J.-Y. Liu, Z. Jin, L.-T. Kong and J.-H. Liu, Metal oxide nanostructures and their gas sensing properties: a review, Sensors, 2012, 12(3), 2610–2631 Search PubMed.
- G. Bailly, J. Rossignol, B. Fonseca, P. Pribetich and D. Stuerga, Microwave gas sensing with hematite: shape effect on ammonia detection using pseudocubic, rhombohedral, and spindlelike particles, ACS Sens., 2016, 6, 656–662 Search PubMed.
- N. Saito, K. Watanabe, K. Suematsu, H. Haneda, I. Sakaguchi and K. Shimanoe, Pyramid-shaped ZnO particles with high sensitivity to ethanolgas, 17th international meeting on chemical sensors – IMCS 2018.
- T. Lin, X. Lv, Z. Hu, A. Xu and C. Feng, Semiconductor metal oxides as chemoresistive sensors for detecting volatile organic compounds, Sensors, 2019, 19, 233 Search PubMed.
- R. S. Morrison, Semiconductor gas sensors, Sens. Actuators, B, 1982, 2, 329–341 Search PubMed.
- M. F. Afsar, M. A. Rafiq and A. I. Y. Tokc, Two-dimensional SnS nanoflakes: synthesis and application to acetone and alcohol sensors, RSC Adv., 2017, 7, 21556 Search PubMed.
Footnote |
| † Electronic supplementary information (ESI) available. See DOI: 10.1039/d0ma00375a |
| This journal is © The Royal Society of Chemistry 2020 |


