
 Open Access Article
 This Open Access Article is licensed under a Creative Commons Attribution-Non Commercial 3.0 Unported Licence
Probing the bacterial detoxification of cadmium to form cadmium sulfide quantum dots and the underlying mechanism
Reddhy
Mahle
a,
Partha
Kumbhakar
bc,
Ashim
Pramanik
b,
Pathik
Kumbhakar
 b,
Sumita
Sahoo
d,
Rabibrata
Mukherjee
d,
Chandra Sekhar
Tiwary
*c and
Rintu
Banerjee
*a
b,
Sumita
Sahoo
d,
Rabibrata
Mukherjee
d,
Chandra Sekhar
Tiwary
*c and
Rintu
Banerjee
*a
aAgricultural and Food Engineering Department, Indian Institute of Technology Kharagpur, India. E-mail: rb@iitkgp.ac.in
bDepartment of Physics, National Institute of Technology Durgapur, West Bengal 713209, India
cDepartment of Metallurgical and Materials Engineering, Indian Institute of Technology Kharagpur, India. E-mail: Chandra.tiwary@metal.iitkgp.ac.in
dInstability and Soft Patterning Laboratory, Department of Chemical Engineering, Indian Institute of Technology Kharagpur, India
First published on 2nd July 2020
Abstract
Microbe-reinforced mineralization of metals into biocompatible materials is a potential drive towards the green synthesis of materials. However, metal biomodification into nanoparticles verily exhibits non-uniformity of the nanoparticles due to limited study of the cell behavior and bio-mechanism, which mitigate their applications in the optoelectronics field. In the present study, we utilized the self-assembly behaviour of chemical species in a biological environment to produce mono-disperse and well-controlled cadmium sulfide quantum dots (CdS QDs). Cadmium quenching (up to 85%) by organic molecules, exported from bacterial (Pseudomonas aeruginosa) cells, has been established by studying the influence of biological growth parameters (cell age) and precursors (cysteine and cadmium) on the formation of CdS QDs. Herein, we elucidate the mechanism involved in the bacterial precipitation of cadmium into CdS QDs using AFM and TEM profiles, which confirm the hypothesis of QD formation involving the cell wall in the medium and its interaction with precursors. The green synthesis of CdS QDs with controllable surface functionalities (studied via FTIR spectroscopy) results in tunable photoluminescence.
1 Introduction
Semiconductor nanomaterials are invariably considered for application in solar energy conversion1 and for photoelectrochemical processes.2 These nanosized materials are often referred as quantum dots (QDs), and they exhibit distinctive electronic and optical properties3 owing to size dependency when the size reduces to less than Bohr exciton radius.4 Cadmium sulfide (CdS) particularly holds immense potential for electromechanical and optoelectronic applications due to the direct band gap in the visible region;5 similarly, CdS QDs have been widely utilized for biomedical and biological studies.6 The optical properties, i.e. photoluminescence and photostability, of CdS nanoparticles can be tuned with the help of dispersion stability, shape, size, and structure.7,8 Various synthesis approaches (milling, intense heat treatment, electrochemical or photochemical reduction, etc.) have been attempted to synthesize CdS nanomaterials.9 These processes involve intense processing and environmentally perilous chemicals that restrict control over size, shape, and dispersity. The primary predicaments due to these conventional methods of nanosized material production remain in their detrimental effect on the environment. This leads to a perpetual quest for environmentally innocuous and acceptable ways of nanomaterial synthesis.A biologically motivated green route of controlled CdS QD synthesis is a potentially effective and flexible approach utilizing biological molecules such as cysteine and organic thiols as capping agents. Plants, yeasts, and bacteria utilize these molecules to detoxify the harmful cadmium into CdS nanocrystals.10 These methods of nanoparticle formation involve the bottom-to-top approach, where participating atoms self-assemble to form the nuclei that further ripens into nanosized particles, albeit the produced nanoparticles usually suffer non-uniformity restricting their use.11 Bacteria, exhibiting superiority over other microbes due to rapid growth and quicker defense, encounter extremely harsh conditions such as heavy metal exposure and thus evolve defense mechanisms to cope with toxic surroundings.12 Heavy metal remediation by bacteria is accounted for the chemical detoxification coupled with energy-derived ion efflux from the cell by membrane transporters. The detoxification process includes extracellular precipitation, mineralization, complex formation or intracellular accumulation. The selection of the intra- and extra-cellular processes is a trade of yield versus size dispersion.13 Previously, Rhodopseudomonas palustris,14Moorella thermoacetica,15E. coli,16etc., have been utilized to synthesize CdS nanoparticles. However, the exact molecular mechanism involving cellular pathways for the production of CdS nanoparticles has not yet been established. Comprehension of the impact of external and internal factors of the microbial cell on quantum dot formation and its properties leads to a better microbial system for QD preparation.
In the present study, extracellular synthesis of CdS QDs was carried out by a versatile facultative anaerobe, Pseudomonas aeruginosa, ubiquitously found in the soil and water environment, often encountering metal-contaminated sites. The bacterial culture was grown under anaerobic conditions, where cysteine hydrochloride was used as a sulphur source (Fig. 1). The precipitated CdS was characterized by X-ray diffraction (XRD), Fourier transform infra-red (FTIR) spectroscopy, high-resolution transmission electron microscopy-energy-dispersive X-ray spectroscopy (HRTEM-EDX), and atomic force microscopy (AFM). Optical characterization, i.e. the band gap and photoluminescence emission, of the bio-precipitated CdS QDs was performed. The biological or cellular mechanism involved in the formation of CdS nanoparticles has been studied using time-dependent UV-vis absorption spectra, and AFM and TEM images. Thus, through this article, the authors attempt to contrive uniformly sized QDs unravelling the biological state of bacteria during detoxification of heavy metals such as cadmium17 and their fixation into eco-friendly and bio-compatible materials.
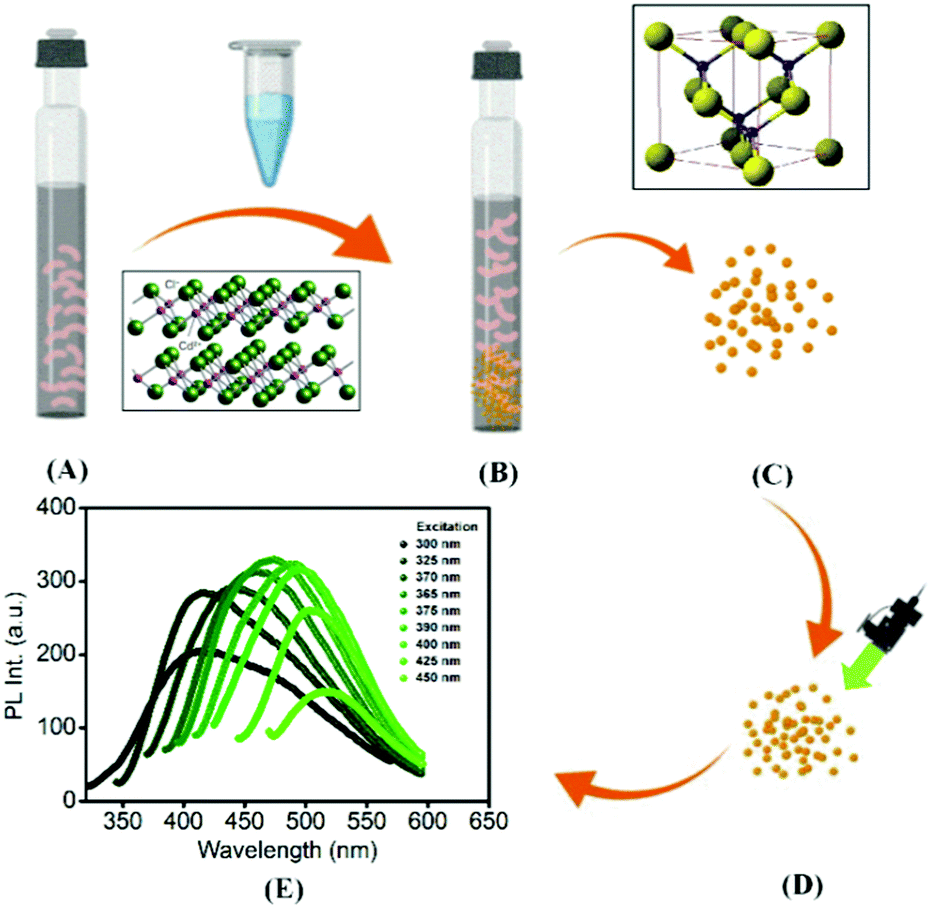 | ||
| Fig. 1 Schematic of the CdS precipitation: (A) actively growing P. aeruginosa cells in the growth media, (B) CdCl2 addition to the cells, (C) 6 h post cadmium addition, (D) LASER light incident on the CdS QDs and (E) optical response for CdS QDs. | ||
2 Experimental
2.1 Microorganism and culture conditions
Pseudomonas aeruginosa was recovered from Microbial Biotechnology and Downstream Processing Laboratory, Indian Institute of Technology, Kharagpur, India, and was cultivated at 37 °C in a modified P2 medium containing 0.25 g L−1 yeast extract. For energy sources, 0.4 M glucose was used. Magnesium sulfate heptahydrate (0.5 g L−1), and 0.01 g L−1 each of sodium chloride, ferrous sulfate heptahydrate and manganese sulfate monohydrate were used as a salt mixture into the media. Sodium β-glycerophosphate (1 g L−1) was used as a phosphorus source replacing KH2PO4 in the cadmium precipitation experiments to prevent cadmium phosphate formation. Sodium bicarbonate (2.5 g L−1) was used to maintain the pH of the culture during the experiment. Buffers used in the study included phosphate buffer (a mixture of KH2PO4 and K2HPO4 and pH 7.2 maintained with NaCl) and a wash buffer containing Tris HCl (100 mM pH 7.2), 10 mM tetrasodium EDTA and 400 mM NaCl. Cysteine hydrochloride monohydrate (0.2% (w/v)) was included in the media components to act as a reducing agent and a sulphur source. Pure cadmium chloride monohydrate was obtained from Merck. Cadmium standard for atomic absorption spectroscopy (AAS) was purchased from Agilent technologies.2.2 Preparation of CdS nano precipitates
CdS precipitates were synthesized via a green route using anaerobically grown Pseudomonas aeruginosa cells. Late log-phase to early stationary-phase cells were used as the inoculum for precipitation. During the experiment, 1 mM CdCl2 was added to the actively growing cell culture. The obtained precipitates were further characterized optically, physically and structurally to check for the efficiency of the method.2.3 Material characterization of CdS precipitates
Structural characterization of the microbially produced CdS QDs was carried out by using powder XRD with monochromatic nickel-filtered Cu Kα radiation in the 2θ range of 20 to 80°. The FTIR spectrum of the nano precipitates was recorded using a conventionally used technique of sample admixing with KBr, which was further pelletized by applying a pressure of 10 tons for few minutes under vacuum before analysis using a PerkinElmer spectrometer through the range of 4000 to 400 cm−1. CdS precipitates were micrographed using a JEOL 2200FS electron microscope, and the sample was prepared by placing one drop of the dilute solution of the precipitates in the media onto a copper grid supported on a thin film of amorphous carbon followed by drying the sample in a vacuum desiccator.2.4 Optical characterization
Optical spectra of CdS quantum dots were recorded using a UV-1800 spectrophotometer, Shimadzu, Japan. The band gap was estimated using Tauc plots generated from the absorption spectra with an assumption of direct bandgap for CdS and 1 cm path length as the cuvette width. Photoluminescence excitation (PLE) spectrum of the synthesized samples was recorded at different emission wavelengths using a spectro fluorimeter LS 55 (PerkinElmer).2.5 Bio-mechanism of CdS QDs
Green synthesis of CdS QDs involves an enzymatic pathway to carry out cadmium sulfide precipitation. However, a study on the impact of biological parameters was required to understand the biological mechanism of cadmium precipitation. Cadmium was provided to bacterial cells at different phases of their growth, and subsequently, the cadmium sulfide precipitation was recorded at each phase to establish the impact of cell age on QD formation. Cadmium precipitation in the form of CdS was detected by AAS. The effect of cysteine concentration on CdS synthesis was measured by examining CdS precipitation by cells grown in media with a gradient concentration of cysteine, i.e. 0.01–0.5%. CdCl2 was added to the cell culture at a concentration of 0.5–5 mM to check for the threshold concentration. Samples were withdrawn after 24 h and analyzed for viable cells and lag-phase duration. Controls were also prepared without addition of cadmium. The co-ordinated effect of cysteine and cadmium on the precipitation process was found out when log-phase P. aeruginosa cells were inoculated in the media with different concentrations of Cys·HCl and cadmium chloride solution. The synchronized effect of cysteine and cadmium was estimated in the form of CdS precipitation. Cysteine desulfhydrase specific activity was also measured to signify the direct impact of CdS on cell metabolic activity, i.e. enzyme production.To evaluate the time-regulated formation of CdS QDs, absorption spectra were recorded at different time intervals post cadmium addition to the media. Cell surface morphology was studied by atomic force microscopy (AFM, Agilent Technologies, USA, Model 5100), where cells were dried on a glass substrate and scanned to obtain the high-resolution micrographs of the cells with nano-precipitates. All the measurements were carried out in air at room temperature (25 °C) using a silicon nitride tip (PPP-NCL) in the intermittent contact mode.
3 Results and discussion
3.1 Biological synthesis of CdS QDs
To study the synthesis of CdS QDs using bacterial cells, a series of experiments were designed keeping the cell age constant. An actively growing culture of Pseudomonas aeruginosa (turbid white solution in Fig. 2(A)) was mixed with CdCl2 and incubated for 6 h, resulting in bright yellow precipitates, as shown in Fig. 2(A). The precipitate was collected and further characterization was carried out. The mass balance experiments were simultaneously performed to endorse the cadmium removal from the medium in the form of CdS precipitates (Table 1). From the table, it can be concluded that 85% cadmium was removed from the inoculated medium in the form of CdS. | ||
| Fig. 2 Physical characterization of bio-synthesised CdS QDs (A) bright yellow-colored CdS particles against P. aeruginosa cell precipitates, (B) X-ray diffractogram of the CdS QDs, (C) FTIR spectra of the CdS nanoparticle powder, (D) TEM micrograph depicting the cell covered with unreacted CdCl2 salt CdS quantum dots in a low amount, (E) CdS nanoparticle aggregates shown by TEM micrographs with EDX spectra indicating Cd and S peaks (top inset) and SAED pattern for lattice characterization, where Miller indices given as α = (111), β = (220), and μ = (311) (bottom inset), (F) magnified TEM images of CdS QDs (size ∼6 nm) with particle size distribution of CdS QDs (inset), and (G) comparative bar chart demonstrating the dispersity for different CdS QD preparation methods, i.e. (A) sono-chemical; (B) fungus-mediated; (C) starch-based; (D) chemical-mediated; (E) chemical bath-mediated and (F) present method (P. aeruginosa mediated). | ||
| Cysteine concentration (mM) | Removal from media Δ [cadmium] ± S.E. (mM) | EDTA-soluble fraction | Pellet | % CdS precipitation | |
|---|---|---|---|---|---|
| 11.78 | Inoculated | 2.70 ± 0.05 | 0.42 ± 0.05 | 2.28 ± 0.05 | 84.6 |
| Un-inoculated | 1.61 ± 0.05 | 1.6 ± 0.05 | 0.01 ± 0.05 | 0.3 | |
For controlled experiments, approximately 5% cadmium removal was observed, which may be due to the presence of cadmium phosphate or cadmium carbonate (quantified by dissolving in EDTA-containing wash buffer).
3.2 Material characterization of microbially synthesized CdS
The yellow-colored colloids were analyzed by XRD, followed by spectroscopy (UV-vis absorption, photoluminescence, and FTIR) and microscopy (TEM and EDX) methods.The XRD pattern shown in Fig. 2(B) reveals the peaks at 2θ values of 26.60, 43.90 and 51.62° corresponding to the (111), (220), and (311) planes of the diamond cubic phase of CdS (with lattice constant a = 5.32 Å (JCPDS File No. 10-454)). The broad XRD peaks implied the small crystallite size of 6 ± 0.3 nm, which was calculated using the Scherrer equation,18 and further confirmed by the TEM micrographs and the absorption spectra in subsequent sections. The surface functional groups of CdS QDs and their interaction with Pseudomonas aeruginosa were studied by FTIR spectroscopy (shown in Fig. 2(C)). A peak at 3443 cm−1 could be assigned to the O–H stretching vibration present as absorbed water on the CdS surface. The surface ligands on the CdS QDs were attributed to the bands at 2924, 2846, 1635, 1393, and 1021 cm−1, coming from the organic functional groups (alkyl, alkene, carbonyl, and amine) present in the media.3,19 Bands obtained at 490 cm−1 and 650 cm−1 signified the S–S and C–S stretching bonds, whereas peaks at 1237 and 2353 cm−1 were assigned to the organic sulfate group and CO2, respectively.20 Along with these peaks, a peak appeared at 1540 cm−1 ascribed to the aliphatic nitro groups on the surface of CdS QDs. The presence of all organic groups can be credited to the media components and cell metabolites produced and released during bacterial growth. This organically modified surface of QDs results in a controlled surface environment, which contrives the PL emission (Section 3.3) and thus ensures their application in biosensing. Due to inherent presence of organic surface states, the as-prepared CdS QDs circumvent surface functionalization unlike conventionally produced CdS QDs and, thus, promise application in biomedicines.
The representative bright-field TEM micrographs manifest the distribution of CdS QDs around Pseudomonas aeruginosa cells. In the TEM micrographs, the presence of unreacted cadmium salts and CdS QDs on the surface of the cells was observed (Fig. 2(D)). The high-magnification bright-field TEM image of the CdS QD region is shown in Fig. 2(E). It clearly shows that uniformly sized CdS QDs are produced in large quantities. The EDS spectrum has been found to contain peaks of elemental Cd and S (top inset in Fig. 2(E)). The formation of crystalline CdS QDs is further confirmed using a selected area electron diffraction (SAED) pattern that is showing (bottom inset in Fig. 2(E)) concentric circles, which match well with the (111), (220) and (311) reflection of CdS QDs. The size of the CdS QDs as calculated from the micrographs was found to be 6 ± 2 nm (Fig. 2(F)), which coincides with the size estimated through XRD results using the Scherrer equation mentioned in the previous section. The HRTEM image of the CdS QDs shows well-resolved lattice fringes, which imply the good crystalline nature of the nanoparticles. The lattice spacing value obtained from HRTEM was ∼1.324 Å, which matches with the (111) plane of CdS QDs (Fig. 2(F)). The particle size distribution of the CdS QDs measured from TEM images (inset in Fig. 2(F)) reveals the monodispersive behaviour of the QDs. Further the CdS size distribution, obtained for the current study, was compared with the dispersity achieved by the other preparation methods of QDs (Fig. 2(G)). From the bar chart, it can be inferred that the present method can be successfully utilized in producing monodispersive nanoparticles.21–25 From Fig. 2(G), method “B” reported first extracellular CdS QD preparation using fungus, which involved 5–20 nm QD production in 4–6 days. However, current work manifests the synthesis of monodispersive (4–7 nm) CdS QDs in an incubation period of 6 h.
3.3 Optical characterization
UV-visible absorption spectroscopy was utilized to monitor the optical absorption properties of the QDs. The absorption spectra of Pseudomonas aeruginosa with and without green synthesized CdS QDs are shown in Fig. 3(B). The absorption peak was observed at ∼260 nm corresponding to the π → π* transition in the surface ligands attached to the surface of CdS QDs. The blue shift in the peak was detected as compared to the bulk CdS (at 514 nm). The band gap of the CdS (given by the Tauc relation) was obtained from (αhν)2versus hν plot, as shown in Fig. 3(A). The direct band gap value of green synthesized CdS was estimated to be ∼3 eV; this value was shifted compared with the bulk value and this could be a sign of a size quantization effect in the synthesized sample. The particle size of the CdS QDs was estimated using the formula given by Brus, 1984.26 From the calculations, the radius of the precipitated nanoparticles is 3.18 nm which was found to be in parity with the particle size observed in the TEM micrographs and calculated from the X-ray diffractogram. The absorption tail in the range of 300–600 nm is due to CdS.27 These absorption bands contribute to the observed PL emission in CdS at 475 nm as supported by the PLE spectra in Fig. 3(C). However, unlike the traditional inorganic semiconductor QDs, the green synthesized CdS QDs emit excitation wavelength-dependent tunable PL, as shown in Fig. 3(D). Such tunable PL emission is due to the presence of organic ligands in the as-prepared colloidal solutions of CdS QDs.28 There is a clear shift in case of absorption and PL emission peaks. The origin of such shift of the PL emission center in comparison to that of the absorption maxima can be explained with the help of basic theory of spectroscopy; the optical absorption is not necessary with the presence of PL, but PL emission requires absorption: (i) when the energy from the light is absorbed, the material can relax the energy through non-radiative paths (i.e. without light emission), (ii) PL emission can come from the electronic energetic level well, which is lower than the absorption gap, as shown in Fig. 3(F). Therefore, the shift can be observed in between absorption and PL emission peaks. As it can be observed, the as-synthesized CdS QDs have absorption maxima at ∼260 nm (∼4.77 eV) with a tail starting from 300 nm and extending up to the visible region due to the sub-bands contributed by the surface ligands. This surface state-related sub-band is responsible for PL emission ∼475 nm (2.61 eV). Therefore, after absorbing photons, transition of electron occurs from the highest occupied molecular orbital (HOMO) to the lowest unoccupied molecular orbital (LUMO) levels having an energy gap of 4.77 eV. Those electrons at HUMO will move to surface ligand-related sub-bands at ∼3.30 eV after a nonradiative (NR) relaxation process, and finally move to LUMO after releasing the absorbed energy in the form of photons, i.e., PL (Fig. 3(F)). Herein, we used PLE spectra to clarify the bands that are responsible for blue PL emission. The range of the PLE spectrum matches well with the UV-vis absorption tail, as discussed earlier. Clearly, the PLE spectrum has a maximum at ∼375 nm. Therefore, CdS QDs exhibit the highest PL emission intensity at an excitation wavelength of 375 nm, as observed experimentally, although the sub-bands below and above 3.30 eV are also responsible for PL emission, as it could be understood from the broad nature of the PLE spectra (Fig. 3(C)). Furthermore, the excitation-dependent PL emission behaviour of the material is a result of different surface-related states present due to surface ligands in the biosynthesized CdS QDs. To confirm this, the measurement of emission wavelength-dependent PLE spectra of the material was performed (Fig. 3(E)). The as-observed shift in the PLE band generally occurs when PL emission occurs from multiple surface defect states (contributed by surface ligands (as observed in FTIR)) along with the intrinsic band gap of the material.29 | ||
| Fig. 3 Optical characterization of CdS QDs: (A) Tauc plot obtained for band gap estimation; (B) absorption spectra for the cells with and without CdS; (C) photoluminescence emission and absorption spectra; (D) excitation wavelength-dependent tunable PL emission; (E) emission wavelength-dependent PLE spectra of CdS nanoparticles and (F) energy band diagram representing the plausible electronics transition responsible for PL in CdS QDs. | ||
3.4 Bio-mechanism of CdS QDs
The CdS QD formation involves quenching of cadmium ions in the presence of Pseudomonas aeruginosa, where Cys·HCl was catabolized by L-cysteine desulfhydrase resulting in the release of sulfides that got precipitated in the form of CdS.The impact of growth phase on the cadmium removal is demonstrated in Fig. 4(A). It is evident from the curve that CdS formation occurred until the late stationary phase. There was a cessation of CdS precipitation post stationary phase, which could be linked to the declined expression of the metabolic enzymes particularly cysteine desulfhydrase.30 The impact of cysteine concentration on the precipitation of CdS was quantified by preparing culture media with different concentrations (0.05–1% (w/v)) of cysteine (shown in Table 2). More than the optimal amount of cysteine had adverse effects on P. aeruginosa due to cysteine toxicity, which has resulted in less cadmium removal.31 The cadmium chloride solution was added to Pseudomonas aeruginosa cells to find out the tolerance threshold (Table 3). Cadmium toxicity in the case of bacterial cells has been speculated to be associated with DNA damage via reactive oxygen species generation, which is likely to cause interference in the synthesis of proteins and other metabolites.32 According to Ron et al., 1992, cadmium mediates the stress response in the cells, which results in the production of a large number of proteins in response to stress.33
 | ||
| Fig. 4 Physical and biological mechanism underlying CdS nanoparticle generation: (A) growth phase vs. cadmium removal plot up to the late stationary phase, (B) CdS precipitation vs cadmium amount added for different concentrations of cysteine, i.e. X = 0.05%; Y = 0.1%; Z = 0.2%, (C) cysteine desulfhydrase enzyme-specific activity (IU mg−1) vs. cadmium added to the media for cysteine concentration, i.e. X = 0.05%; Y = 0.1%; Z = 0.2%, (D) TEM micrographs indicating the Cd salt accumulation on the bacterial cell surface and eventually forming CdS nanoparticles on the surface, around the cells in the growth media, (E) magnified image of nanoparticle accumulation on the cell surface, (F) CdS nanoparticles around the cell surface, and (G) time-based absorption spectra of the precipitates for t1 = 360 min; t2 = 90 min; t3 = 1 min and t4 = 0 min, and (H) surface roughness profile of the cells obtained at different time intervals, i.e. A = 0 min, B = 1 min, C = 90 min, and D = 360 min. | ||
| Cysteine concentration (mM) | Removal from media Δ [cadmium] ± S.E. (mM) | EDTA-soluble fraction | Pellet | % CdS precipitation | |
|---|---|---|---|---|---|
| 2.84 | Inoculated | 0.623 ± 0.05 | 0.070 ± 0.05 | 0.553 ± 0.05 | 55.3 |
| Un-inoculated | 0.893 ± 0.05 | 0.853 ± 0.05 | 0.04 ± 0.05 | 4 | |
| 5.69 | Inoculated | 0.860 ± 0.05 | 0.087 ± 0.05 | 0.773 ± 0.05 | 77.3 |
| Un-inoculated | 0.503 ± 0.05 | 0.499 ± 0.05 | 0.04 ± 0.05 | 4 | |
| 11.38 | Inoculated | 0.889 ± 0.05 | 0.06 ± 0.05 | 0.829 ± 0.05 | 82.9 |
| Un-inoculated | 0.518 ± 0.05 | 0.507 ± 0.05 | 0.01 ± 0.05 | 1 | |
| 28.45 | Inoculated | 0.132 ± 0.05 | 0.125 ± 0.05 | 0.07 ± 0.05 | 7 |
| Un-inoculated | 0.449 ± 0.05 | 0.396 ± 0.05 | 0.05 ± 0.05 | 5 | |
| 56.9 | Inoculated | 0.080 ± 0.05 | 0.06 ± 0.05 | 0.02 ± 0.05 | 2 |
| Un-inoculated | 0.350 ± 0.05 | 0.285 ± 0.05 | 0.06 ± 0.05 | 6 | |
| Cadmium conc. (mM) | Lag phase duration (h) | Colony formation |
|---|---|---|
| 1 | 0.5 | + |
| 0.5 | 2 | + |
| 1 | 4 | + |
| 2 | 10 | − |
| 4 | 24 | − |
| 5 | 24 | − |
The cadmium chloride solution was added to Pseudomonas aeruginosa cells to find out the tolerance threshold (Table 3). Cadmium toxicity in the case of bacterial cells has been speculated to be associated with DNA damage via reactive oxygen species generation, which is likely to cause interference in the synthesis of proteins and other metabolites.32 According to Ron et al., 1992, cadmium mediates the stress response in the cells, which results in the production of a large number of proteins in response to stress.33
The synchronized impact of cysteine and cadmium was estimated in the form of CdS precipitation, and growth parameters including cysteine desulfhydrase formation are presented in Fig. 4(B and C). Upon increasing the cadmium concentration above the optimized value, there was negligible CdS precipitation even when coupled with a tremendous increment in L-cysteine desulfhydrase specific activity. This may be due to the overproduction of L-cysteine desulfhydrase, which causes toxicity to the cell growth owing to the shift in cellular machinery. There has been an apparent diversion in the utilization of cysteine from protein production to sulfide generation. It is worth noting here that during escalation in the cadmium concentration, P. aeruginosa has encountered the metabolic burden of overproducing cysteine desulfhydrase and heavy metal toxicity.34 When cells encountered intolerable cadmium concentrations, the toxic effects of overproduction of cysteine desulfhydrase became profound, which eventually resulted in insufficient sulfide production and consequently cadmium removal. It further emphasized the significance of the optimized production of cysteine desulfhydrase and the ideal concentration of cadmium for improved cadmium removal. The maximum removal of cadmium in the form of CdS was achieved at optimum values of cadmium chloride and cysteine hydrochloride, i.e. 1 mM and 0.2% respectively. In the present study, the remediation method, carried out by Pseudomonas, is hypothesized to involve extracellular cell wall binding, further confirmed by the electron micrographs of the cadmium-treated cells (Fig. 4(D–F)). The absorption spectra of the cells were recorded at 0 min, 1 min, 90 min, and 360 min after CdCl2 addition. From the spectra Fig. 4(G), the absorption was found to be increasing with time with the highest absorption occurring at 360 min, beyond which there was no further increase in the absorption pattern. CdS QDs, prepared under optimal conditions, were checked for stability and due to the presence of proteins as growth components (67 μg mL−1), QDs were found to be stable for approximately 60 days.21
In the current study, CdS-precipitating bacterial cells were in situ visualized by imaging techniques. Time-dependent AFM micrographs reveal rod-shaped P. aeruginosa cells with a diameter of 500–600 nm and length of 3–4 μm with and without CdS QDs. The cells were scanned for surface roughness post cadmium salt addition. Fig. 4(H) manifests the surface roughness profile of the cells, which was obtained at different time intervals. From the plots, it was observed that salt crystals rest on the surface of the cells, which increases their overall height and width, and upon further increasing the time of incubation, the reaction between sulfide ions and cadmium salt causes deposition of nanosized QDs on the cell surface. When cells were scanned for 90 min post cadmium addition, there was a representation of the nanoparticle formation around the cells and their deposition on the cell surface. When the precipitates changed to bright yellow crystals 6 h post incubation, the cells were observed for any morphological changes due to nanoparticle precipitation. Comparison of the rendered 3D AFM image of the cells immediately after (Fig. 5(A)) and 6 h (Fig. 5(B)) post metal addition shows the active formation of precipitates. The AFM and TEM images establish the distinctive behaviour of cells during QD formation. The QD deposition (given by height profile (Fig. 4(H))) on the cells is the manifestation of the cell's resistance towards metal influx in the form of extracellular CdS formation.
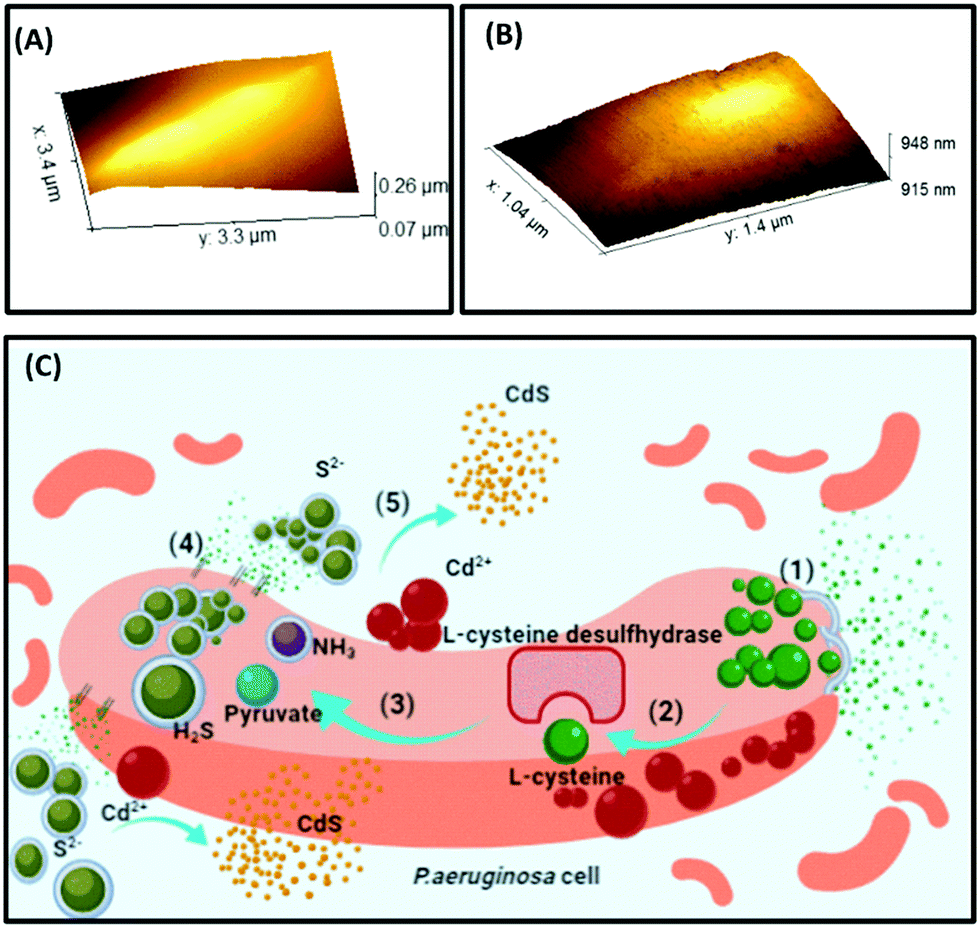 | ||
| Fig. 5 (A) AFM 3D micrograph of the bacterial cell without cadmium addition, (B) 3D image of the cell 360 min post CdCl2 addition representing the CdS deposition on the cell surface, and (C) schematic of the P. aeruginosa cells during cadmium salt addition to the media as suggested by the TEM and AFM micrographs: (1) Cysteine·HCl imported to the cells through membrane transporters, (2) cysteine binding to L-cysteine desulfhydrase enzyme for its catabolization, (3) cysteine catabolized to pyruvate, H2S, and NH3, (4) H2S is transported to extracellular environment via transporters, (5) cadmium salts on the surface of cells react with H2S to produce CdS QDs, which deposit on the cell surface and precipitate in the media. | ||
The plausible mechanism of the cadmium sulfide precipitation is shown as a schematic in Fig. 5(C), as validated and suggested by the micrographs, absorption spectra, and other optimization results.
4 Conclusion
In this study, cadmium, a toxic metal, was precipitated (up to 85%) by Pseudomonas aeruginosa in the form of CdS, providing an eco-friendly circumvention for toxicity removal. The as-prepared nano precipitates were found to be monodispersive (6 ± 2 nm) as confirmed by XRD, TEM and UV-vis, and tunable photoluminescence was observed owing to surface-functionalized ligands (due to bacterial cells validated by FTIR spectroscopy). The functionalized surface state of QDs owing to media and growth components vouches it to be potential for biomedical applications including biosensing. The cell growth parameters were shown to positively influence QD precipitation when supplied with optimum CdCl2 and Cys·HCl (sulfide source). The step-wise formation of QDs involved the cell wall interaction with the precursor, i.e. cadmium, and its conversion into insoluble CdS precipitates within 6 h, which was demonstrated by AFM micrographs and plotted height profiles. This is the first ever report of examining the control of cellular environment on metal detoxification and consequently QD synthesis and properties. It is considered an advanced step for the development of bio-based nano-material production with an insight into the cellular level mechanism involved in the process thus adds value to the greener ways of material fabrication.Conflicts of interest
There are no conflicts to declare.Acknowledgements
The authors thank the Central Research Facility, Indian Institute of Technology, Kharagpur for providing the sample analysis facilities. P. K. and C. S. T. are thankful for the support by AOARD Grant No. FA2386-19-1-4039. C. S. T. acknowledges a Ramanujan fellowship.References
- A. A. F. Husain, W. Z. W. Hasan, S. Shafie, M. N. Hamidon and S. S. Pandey, Renewable Sustainable Energy Rev., 2018, 94, 779–791 CrossRef CAS.
- L. Ge, Q. Liu, N. Hao and W. Kun, J. Mater. Chem. B, 2019, 7, 7283–7300 RSC.
- H. N. Abdelhamid and H. F. Wu, J. Mater. Chem. B, 2013, 1, 6094–6106 RSC.
- Z. Li, Q. Sun, Y. Zhu, B. Tan, Z. P. Xu and S. X. Dou, J. Mater. Chem. B, 2014, 2, 2793–2818 RSC.
- A. Cabot, R. K. Smith, Y. Yin, H. Zheng, B. M. Reinhard, H. Liu and A. P. Alivisatos, ACS Nano, 2008, 2, 1452–1458 CrossRef CAS PubMed.
- B. R. Singh, B. N. Singh, W. Khan, H. B. Singh and A. H. Naqvi, Biomaterials, 2012, 33, 5753–5767 CrossRef CAS PubMed.
- S. K. Mehta, S. Kumar, S. Chaudhary and K. K. Bhasin, Nanoscale, 2010, 2, 145–152 RSC.
- G. Sun, Y. Zhang, Q. Kong, C. Ma, J. Yu, S. Ge, M. Yan and X. Song, J. Mater. Chem. B, 2014, 2, 7679–7684 RSC.
- N. V. Hullavarad, S. S. Hullavarad and P. C. Karulkar, J. Nanosci. Nanotechnol., 2008, 8, 3272–3299 CrossRef CAS PubMed.
- E. D. Spoerke and J. A. Voigt, Adv. Funct. Mater., 2007, 17, 2031–2037 CrossRef CAS.
- A. Gour and N. K. Jain, Artif. Cells, Nanomed., Biotechnol., 2019, 47, 844–851 CrossRef CAS PubMed.
- P. Prabhakaran, M. A. Ashraf and W. S. Aqma, RSC Adv., 2016, 6, 109862 RSC.
- K. B. Narayanan and N. Sakthivel, Adv. Colloid Interface Sci., 2010, 156, 1–13 CrossRef CAS PubMed.
- H. J. Bai, Z. M. Zhang, Y. Guo and G. E. Yang, Colloids Surf., B, 2009, 70, 142–146 CrossRef CAS PubMed.
- K. K. Sakimoto, A. B. Wong and P. Yang, Science, 2016, 351, 74–77 CrossRef CAS PubMed.
- R. Y. Sweeney, C. Mao, X. Gao, J. L. Burt, A. M. Belcher, G. Georgiou and B. L. Iverson, Chem. Biol., 2004, 11, 1553–1559 CrossRef CAS PubMed.
- M. G. Mostofa, A. Rahman, M. M. U. Ansary, A. Watanabe, M. Fujita and L. S. P. Tran, Sci. Rep., 2015, 5, 14078, DOI:10.1038/srep14078.
- B. D. Cullity and S. R. Stock, Elements of X-ray diffraction, 2nd edn, 1978 Search PubMed.
- J. Coates, Encyclopedia of Analytical Chemistry, 2006 Search PubMed.
- M. Sanati and A. Andersson, J. Mol. Catal., 1993, 81, 51–62, DOI:10.1016/0304-5102(93)80022-M.
- A. Ahmad, P. Mukherjee, D. Mandal, S. Senapati, M. I. Khan, R. Kumar and M. Sastry, J. Am. Chem. Soc., 2002, 124, 12108–12109 CrossRef CAS PubMed.
- N. Arul Dhas and A. Gedanken, Appl. Phys. Lett., 1998, 72, DOI:10.1063/1.120624.
- N. S. Kozhevnikova, A. S. Vorokh and A. A. Uritskaya, Russ. Chem. Rev., 2015, 84, 225–250, DOI:10.1070/rcr4452.
- Q. Wei, S. Z. Kang and J. Mu, Colloids Surf., A, 2004, 247, 125–127, DOI:10.1016/j.colsurfa.2004.08.033.
- A. Mercy, R. Samuel Selvaraj, B. Milton Boaz, A. Anandhi and R. Kanagadurai, Indian J. Pure Appl. Phys., 2013, 51, 448–452 CAS.
- L. E. Brus, J. Chem. Phys., 1984, 80, 4403–4409 CrossRef CAS.
- Z. Zhou, G. J. Bedwell, R. Li, P. E. Prevelige and A. Gupta, Sci. Rep., 2014, 4, 3832, DOI:10.1038/srep03832.
- D. Tonti, F. Van Mourik and M. Chergui, Nano Lett., 2004, 4, 2483–2487 CrossRef CAS.
- A. Pramanik, S. Biswas, C. S. Tiwary, P. Kumbhakar, R. Sarkar and P. Kumbhakar, J. Colloid Interface Sci., 2020, 565, 326–336 CrossRef CAS PubMed.
- D. P. Cunningham and L. L. Lundie, Appl. Environ. Microbiol., 1993, 59, 7–14 CrossRef CAS PubMed.
- S. Park and J. A. Imlay, J. Bacteriol., 2003, 185, 1942–1950 CrossRef CAS PubMed.
- A. Wang and D. E. Crowley, J. Bacteriol., 2005, 187, 3259–3266 CrossRef CAS PubMed.
- Q. Zhai, Y. Xiao, J. Zhao, F. Tian, H. Zhang, A. Narbad and W. Chen, Sci. Rep., 2017, 7, 1182, DOI:10.1038/s41598-017-01180-x1.
- C. L. Wang, A. M. Lum, S. C. Ozuna, D. S. Clark and J. D. Keasling, Appl. Microbiol. Biotechnol., 2001, 56, 425–430 CrossRef CAS PubMed.
| This journal is © The Royal Society of Chemistry 2020 |