
 Open Access Article
 This Open Access Article is licensed under a Creative Commons Attribution-Non Commercial 3.0 Unported Licence
Simulation-based evaluation of zeolite adsorbents for the removal of emerging contaminants†
Michael
Fischer
 ab
ab
aCrystallography Group, Department of Geosciences, University of Bremen, Klagenfurter Straße 2-4, D-28359 Bremen, Germany. E-mail: michael.fischer@uni-bremen.de; Tel: +49-421-218 65163
bMAPEX Center for Materials and Processes, University of Bremen, D-28359 Bremen, Germany
First published on 1st April 2020
Abstract
A number of experimental studies have evaluated the potential of hydrophobic high-silica zeolites for the adsorptive removal of emerging organic contaminants, such as pharmaceuticals and personal care products, from water. Despite the widespread use of molecular modelling techniques in various other fields of zeolite science, the adsorption of pharmaceuticals and related pollutants has hardly been studied computationally. In this work, inexpensive molecular simulations using a literature force field (DREIDING) were performed to study the interaction of 21 emerging contaminants with two all-silica zeolites, mordenite (MOR topology) and zeolite Y (FAU topology). The selection of adsorbents and adsorbates was based on a previous experimental investigation of organic contaminant removal using high-silica zeolites (A. Rossner et al., Water Res., 2009, 43, 3787–3796). An analysis of the lowest-energy configurations revealed a good correspondence between calculated interaction energies and experimentally measured removal efficiencies (strong interaction – high removal), despite a number of inherent simplifications. This indicates that such simulations could be used as a screening tool to identify promising zeolites for adsorption-based pollutant removal prior to experimental investigations. To illustrate the predictive capabilities of the method, additional calculations were performed for acetaminophen adsorption in 11 other zeolite frameworks, as neither mordenite nor zeolite Y remove this pharmaceutical efficiently. Furthermore, the lowest-energy configurations were analysed for selected adsorbent-adsorbate combinations in order to explain the observed differences in affinity.
Introduction
Due to the ever-increasing use of pharmaceuticals and personal care products in modern society, organic pollutants are ubiquitously present in urban wastewaters.1–3 Incomplete removal of these “emerging contaminants” by conventional wastewater treatment facilities leads to their discharge into the aquatic environment, giving rise to significant concerns with regard to environmental and health issues.4–9 Agricultural runoff constitutes an additional source of pollution, as pharmaceuticals are widely used in livestock farming.10 Analyses of water samples from all continents (including Antarctica11) have shown that environmental pollution through pharmaceuticals is a problem of a truly global scale: a 2016 survey compiling measured environmental concentrations from more than 1000 publications showed that >600 different pharmaceutical substances (including transformation products) have been detected in the environment, with individual datasets coming from 71 countries across the world.1 To mitigate potentially harmful consequences, such as the development of antibiotic resistance in aquatic reservoirs,12 it is necessary to design improved wastewater treatment technologies that are able to efficiently remove pharmaceuticals and related organic pollutants. Currently, oxidation and advanced oxidation processes, membrane filtration, and adsorption-based processes are seen as the most promising advanced treatment options, with each technology having advantages and drawbacks.7,9,13–17In the field of adsorption-based removal of emerging contaminants, activated carbons (ACs) and related carbon-based materials constitute the most widely studied class of adsorbents,13,16–19 but several groups of silica-based materials have also been proposed,17,20 among them clay minerals,16,21–23 mesoporous silicas,24,25 natural zeolites,21,26,27 and synthetic hydrophobic high-silica zeolites.28 The first systematic study of highly siliceous zeolites targeting this application was reported in 2009 by Rossner et al., who investigated mordenite (MOR topology29) and zeolite Y (FAU topology) for the adsorption of 25 organic contaminants from spiked lake water.30 They observed quantitative removal of several compounds by mordenite, whereas zeolite Y removed only one pharmaceutical, the antidepressant fluoxetine, to a significant extent. In that work, an AC adsorbent outperformed both zeolites. Despite this, there are some practical aspects that might favour zeolites over activated carbons, at least for some applications: as zeolites possess well-defined micropores with diameters in the range of 5 to 10 Å, there is only negligible co-adsorption of natural organic matter (NOM), which cannot enter these narrow pores.31 Pore blockage by NOM can constitute a significant problem for ACs, which have a broader pore size distribution.19 The higher thermal stability of zeolites is a second advantage, as it permits thermal regeneration and reuse of the adsorbent, whereas ACs may partially decompose during thermal treatment.13 For these reasons, a number of experimental studies have followed up the work of Rossner et al. in evaluating the performance of high-silica zeolites for the removal of pharmaceuticals and related pollutants:31–42 for example, De Ridder et al. studied the adsorption of 15 pharmaceuticals of varying hydrophobicity and size, as well as seven nitrosamines, in high-silica mordenite and ZSM-5 (MFI topology).31 They observed efficient removal of positively charged, neutral, and negatively charged pharmaceuticals by the MOR-type adsorbent, whereas ZSM-5 rejected negatively charged species. This difference was explained with the lower negative surface charge of the MOR system, which had a higher Si/Al ratio (Si/Al = 100 compared to 40 for MFI). A series of studies employing high-silica zeolites for pharmaceutical adsorption was reported by Braschi, Martucci, and co-workers:32,33,35–38,40–42 these authors investigated pharmaceuticals from different groups, among them antibiotics (e.g., sulfonamides, erythromycin), the anticonvulsant carbamazepine, and the analgesic ketoprofen, and also considered different adsorbents (zeolite Y, mordenite, ZSM-5, zeolite beta). In several of their works, they performed X-ray diffraction experiments on pharmaceutical-loaded zeolite samples to locate the adsorbate in the zeolite pores, and to evaluate distortions of the framework upon adsorption.32,35,36,40 Moreover, they employed vibrational and NMR spectroscopy to study the role of host–guest and guest–guest interactions, e.g., to investigate the role of hydrogen bonds and the extent of dimer formation in the zeolite pores.33,37
While these spectroscopic investigations were complemented by first-principles calculations in the framework of density functional theory (DFT), there are few other computational investigations dealing with pharmaceutical adsorption in zeolites. In the view of the widespread use of computational chemistry methods in zeolite science,43,44 this appears somewhat surprising. In the field of molecular mechanics calculations, force-field based Monte Carlo (MC) and molecular dynamics (MD) simulations have been employed to study the adsorption and/or diffusion of organic molecules in all-silica zeolites for several species of considerable complexity, including substituted aromatics,45–51 organic structure-directing agents (OSDAs),52–58 and glucose.59 In contrast to this, applications of force field methods to study the interaction of pharmaceuticals with zeolites are scarce, with the MD investigation of salbutamol and theophylline diffusion in zeolite beta by Fatouros et al. being a rare example.60 These authors observed that the rigid theophylline molecule is unable to diffuse through the channels of zeolite beta, whereas the more flexible salbutamol can move along the channels, despite the similar molecular dimensions. Experimentally, it could be confirmed that salbutamol is indeed adsorbed inside the pores, whereas theophylline mostly remains at the external surface of the zeolite particles, affecting the release properties, which are important for drug delivery applications. The work of Fatouros et al. thus demonstrated the usefulness of computational methods to “screen” combinations of zeolite adsorbents and drug molecules prior to experimental investigations. While a similar MD-based approach was later used by Spanakis et al.,61 it is noteworthy that modelling techniques have not been employed more frequently to study the adsorption of pharmaceuticals in zeolites, aiming at applications in either drug delivery or wastewater treatment.
The present work aims to establish whether a fairly “generic” molecular simulation approach can be used for an approximate prediction of the removal efficiency of zeolite adsorbents for organic pollutants. Force-field based simulations are performed to find low-energy configurations of 21 organic molecules in zeolites MOR and FAU. The selection of pollutants follows the experimental work of Rossner et al.30 This experimental study constitutes a particularly suitable reference for the following reasons:
• It covers a large set of >20 pollutants, whereas most other experimental works have focussed on one or a few guest molecules.
• Six of the pharmaceuticals included in that study have been classified as high priority pharmaceuticals of particular relevance to the water cycle in a 2009 survey (carbamazepine, diclofenac, gemfibrozil, ibuprofen, naproxen, sulfamethoxazole).62
• Low concentrations in the ng L−1 range were studied, meaning that guest–guest interactions should be negligible.
• The adsorbents used have very high Si/Al ratios, and can thus be reasonably approximated using all-silica models.
The large majority of the 21 pollutants considered in the present work are used in medicine, but some organic compounds that find other uses are also included (e.g., the herbicide atrazine and the flame retardant TCEP). An analysis of the computational results shows that low calculated host-guest interaction energies (corresponding to strong interaction) coincide with high experimental removal efficiencies, with only few exceptions. For three pollutants, an analysis of low-energy configurations is used to understand the differences in affinity among different adsorbent-adsorbate pairs. Finally, the approach is extended to the study of acetaminophen (paracetamol) adsorption in 11 other zeolite frameworks, as neither MOR nor FAU appear well suited to remove this species.
It should be noted that the computationally inexpensive approach employed in the present work makes use of a number of inherent simplifications, which are discussed in detail in the Discussion section. It has to be emphasised that this work does not strive to achieve a highly accurate atomic-level picture of the interaction between zeolites and complex organic pollutants. Instead, a simple approach like the one proposed here could be used to identify those adsorbent-adsorbate combinations that are most interesting for experimental investigations or for more detailed computational studies, e.g., by means of electronic structure methods.
Computational details
Models of zeolite adsorbents
The models of all-silica zeolites with MOR and FAU topology were taken from the IZA database.29 Due to the very low amount of framework aluminium of the zeolite adsorbents used in the experimental study by Rossner et al. (MOR: Si/Al = 115; FAU: Si/Al = 405), it appears reasonable to approximate them as purely siliceous zeolites. In addition, the adsorption of acetaminophen was studied in 11 other zeolite frameworks, all of which are available in all-silica or high-silica form. Framework type codes (FTCs)29 and material names of corresponding high-silica/all-silica zeolites are compiled in Table 1.| FTC | Material name(s) | Supercell (a × b × c) |
|---|---|---|
| MOR | Mordenite | 1 × 1 × 3 |
| FAU | Dealuminated Y | 1 × 1 × 1 |
| AFI | SSZ-24 | 2 × 2 × 3 |
| BEA | Zeolite beta | 2 × 2 × 1 |
| EUO | EU-1/ZSM-50 | 2 × 1 × 1 |
| FER | Ferrierite | 2 × 3 × 1 |
| MEI | ZSM-18 | 2 × 2 × 2 |
| MEL | ZSM-11/silicalite-2 | 1 × 1 × 2 |
| MFI | ZSM-5/silicalite-1 | 1 × 1 × 2 |
| MTT | ZSM-23 | 4 × 1 × 2 |
| MTW | ZSM-12 | 1 × 4 × 2 |
| MWW | MCM-22/ITQ-1 | 2 × 2 × 1 |
| TON | ZSM-22/theta-1 | 2 × 2 × 4 |
Prior to the MC simulations, the zeolite structures were optimised using GULP,63 employing the interatomic potential parameters devised by Sanders, Leslie, and Catlow (SLC).64 The SLC parameters have been found to give excellent agreement with experimental lattice parameters, Si–O bond lengths, and Si–O–Si angles for all-silica zeolites.65,66 In all calculations described in the following subsection, supercells were used for those zeolites where the conventional unit cell is small enough to cause a potentially significant interaction of an adsorbed molecule with its image in the next unit cell. While the unit cell of FAU is so large that no cell multiplication was needed, the unit cell of MOR was tripled along the c-axis (1 × 1 × 3). Supercells used for all frameworks considered are listed in Table 1, and SLC-optimised structures in the respective supercells are supplied as ESI† (in CIF format).
Models of organic pollutants
The molecular structures of 21 organic pollutants included in the experimental study by Rossner et al. were obtained from openly available data repositories, primarily the PubChem68 and CheBi69 databases. The molecules were then loaded into the DS Biovia Materials Studio 2019 (MS) software.70 After addition of hydrogen atoms (if required), an initial structure optimisation using the DREIDING force field71 was carried out (MS Forcite module). As an energy minimisation will only deliver a local minimum, it was followed by an MS Forcite Anneal job, also using the DREIDING force field. Such an annealing corresponds to a molecular dynamics run that periodically increases and decreases the simulation temperature, thereby allowing for the sampling of different local minima. Each Anneal job consisted of 25 cycles with a maximum temperature of 3000 K and a minimum temperature of 300 K, using 100![[thin space (1/6-em)]](https://www.rsc.org/images/entities/char_2009.gif) 000 steps per cycle (step size 1 fs) in the NVE ensemble. The structures obtained at the end of each of the 25 cycles were optimised, and the lowest-energy conformer was taken as reference system for the calculation of the zeolite–guest interaction energy, described in the following section. Moreover, this lowest-energy structure was used as input for the MC simulations. The DREIDING-optimised molecular structures are supplied as ESI† (as MDL molfiles and in Materials Studio CAR/MDF format, the latter file formats include the DREIDING atom types assigned to individual atoms).
000 steps per cycle (step size 1 fs) in the NVE ensemble. The structures obtained at the end of each of the 25 cycles were optimised, and the lowest-energy conformer was taken as reference system for the calculation of the zeolite–guest interaction energy, described in the following section. Moreover, this lowest-energy structure was used as input for the MC simulations. The DREIDING-optimised molecular structures are supplied as ESI† (as MDL molfiles and in Materials Studio CAR/MDF format, the latter file formats include the DREIDING atom types assigned to individual atoms).
Monte Carlo simulations
Configurational-bias MC simulations for a loading of one organic molecule per simulation box (unit cell or supercell, as given in Table 1) were performed in order to obtain a set of low-energy configurations. These simulations were carried out in the NVT ensemble for a temperature of 298 K. At the beginning of each simulation, up to 10000000 trial insertion steps were used to place the molecule in the zeolite pores (this procedure failed in some cases for MOR, discussed below). This was followed by an equilibration stage of 2000000 MC steps and a production stage of 3000000 steps from which the configurations were extracted. The probability of different types of MC steps was set to 2:1:1:1 for regrowth:rotation:translation:torsion twisting, and the amplitudes of rotation, translation, and torsion twisting were rescaled during the MC run to give an acceptance probability of approximately 0.5. Prior to the MC simulations, torsional degrees of freedom were defined by specifying the relevant torsion angles in Materials Studio.
Only van der Waals (vdW) interactions between organic pollutants and the pore walls were considered in these calculations. These interactions were modelled using pairwise Lennard-Jones (LJ) potentials, employing Lorentz–Berthelot mixing rules, a cutoff distance of 10 Å, and atomic LJ parameters taken from the DREIDING force field.71 The cutoff of 10 Å is smaller than values commonly used in simulations of gas adsorption isotherms (12.5 or 15 Å are more typical).72 In this regard, it should be emphasised that it is the main aim of the MC simulations to generate low-energy configurations, which are then optimised using a cutoff of 12.5 Å for vdW interactions (see below). With this purpose in mind, it appears reasonable to limit the cutoff distance, as usage of a larger value is unlikely to shift the energetic ordering of different configurations. Moreover, MS Sorption employs a long-range correction with a spline width of 1 Å, alleviating effects arising from the use of a small cutoff distance.
While the zeolite frameworks were treated as rigid, the torsion angles of the adsorbed organics change during the configurational-bias MC simulations. As a consequence, the intramolecular contribution to the total energy varies during the simulation, and this contribution was also calculated using DREIDING parameters for bond stretching, angle bending, torsions, etc. (the relevant DREIDING parameters are supplied in the ESI†). Although the DREIDING force field, being a “generic” multipurpose force field, cannot be expected to be particularly accurate for the adsorption of organic pollutants in zeolites, it has been previously used with considerable success in computational studies of OSDAs interacting with zeolite frameworks.52–55,58 As DREIDING-based calculations were found to be able to predict promising OSDAs for zeolite synthesis, it can be expected that this force field should also be suited to represent the interaction between zeolites and other, comparably complex organic molecules reasonably well.
At least three independent MC simulations were performed for each combination of adsorbent and adsorbate. From each simulation, the 20 configurations with the lowest total energies were extracted and re-optimised (MS Forcite, DREIDING force field), keeping the zeolite framework rigid and using a vdW interaction cutoff distance of 12.5 Å (for selected adsorbent–adsorbate combinations, results obtained with three different cutoff distances of 10, 12.5, and 15 Å are compiled in the ESI,† Table S6). The zeolite–guest interaction energy Ezg was then calculated by subtracting the total energy of the isolated pollutant molecule Eguest from the total energy of the zeolite–guest system Ezeo+guest (because the zeolite framework is treated as rigid, its internal energy is zero): Ezg = Ezeo+guest − Eguest. The value of Ezg obtained for the configuration with the lowest energy was used in the analysis presented below.
In a few instances, the insertion of the guest molecules into the MOR structure using MC simulations failed. This was the case for carbamazepine, diazepam, dilantin, hydrocodone, and pentoxifylline. For these species, the pollutant molecule was inserted manually, and MS Forcite Anneal jobs analogous to those described above were run, starting from different initial configurations (again using a rigid zeolite framework). After a re-optimisation of the structures obtained at the end of each annealing cycle, the system with the lowest energy was selected. Regardless of the sampling procedure (MC or MD annealing), low-energy configurations obtained from independent runs were usually close in energy, giving confidence that a sufficiently large number of configurations had been sampled.
Simulations including point charges
For a subset of 7 pollutants, comparative simulations were performed using the DREIDING force field in conjunction with point charges to model electrostatic interactions. The point charges of adsorbate and framework atoms were calculated using the QEq charge equilibration scheme devised by Rappe and Goddard.73 Then, the simulations proceeded analogously to those described in the preceding sections: After re-optimising the DREIDING + QEq models of the organic pollutants, configurational-bias MC simulations of adsorption were performed for zeolites MOR and FAU. The low-energy snapshots were then optimised prior to calculating Ezg. In the adsorption simulations, Ewald summation was used to compute the electrostatic contribution to the total energy.DFT calculations
In order to substantiate that the DREIDING force field delivers reasonable zeolite–guest interaction energies, dispersion-corrected DFT calculations were carried out for the same subset of 7 pollutants included in the DREIDING + QEq calculations. In each case, the lowest-energy configuration obtained from the DREIDING optimisation was taken as starting point. While the atomic positions of the adsorbate were optimised, the zeolite framework was held fixed (as in the DREIDING calculations). The zeolite–guest interaction energy was computed by taking the DFT energy of the host-guest system and subtracting (1) the energy of the fully optimised, isolated pollutant molecule and (2) the DFT single-point energy of the zeolite structure. This procedure mirrors that of the force field calculations, ensuring comparability between the two methods.The DFT calculations were performed with the CP2K code,74 using the PBE exchange-correlation functional75 in conjunction with the D3 dispersion correction.76 The calculations used a cutoff of 600 Ry, employing Goedecker–Teter–Hutter pseudopotentials devised by Krack77 and molecularly optimised DZVP-MOLOPT-SR basis sets from the work of VandeVondele and Hutter.78
Results
Adsorption of pollutants in MOR
In their experimental work, Rossner et al. reported the concentrations of 25 pollutants in adsorbent-free blank samples, and in water samples equilibrated with 100 mg L−1 of MOR- and FAU-type adsorbents (HSZ-690HOA and HSZ-390HUA, both obtained from the commercial supplier Tosoh USA).30 On the basis of their data, the removal efficiency η of a zeolite adsorbent for a given pollutant can be calculated as η = 100 × (Cblank − Czeo)/Cblank, where Cblank is the concentration in the blank sample and Czeo is the concentration in the sample mixed with zeolite. Mordenite removes more than 90% of 11 pollutants, and between 40 and 90% of four others (atrazine, carbamazepine, naproxen, trimethoprim). It is worth noting that negative values of η are found for acetaminophen and diclofenac. Such negative removal rates are not particularly uncommon, and they have been observed in various studies of real wastewaters.4,6 While the actual origins are unknown for this particular study, negative removal rates are typically attributed to chemical transformations or sampling/measurement issues.Out of the 25 pollutants studied by Rossner et al., the present work investigated 21, omitting the following substances:
• Of the four hormones estradiol, estriol, estrone, and ethynylestradiol, only estrone was considered, as the similar molecular structures should lead to very similar adsorption behaviour (experimentally, all four of them were fully removed by MOR, but not by FAU).
• The iodine-containing contrast agent iopromide was not considered, because the DREIDING parameters for iodine have been validated much less stringently than those for lighter elements.71
The Ezg values obtained for the most favourable configurations of the remaining 21 molecules are compiled in Table 2, together with the experimentally measured removal efficiencies.
| Use | Sum formula | m molar [g mol−1] | MOR | FAU | |||
|---|---|---|---|---|---|---|---|
| η [%] | E zg [kJ mol−1] | η [%] | E zg [kJ mol−1] | ||||
| a DEET = N,N-diethyl-meta-toluamide. b TCEP = Tri(2-chloroethyl)phosphate. | |||||||
| Acetaminophen | Analgesic | C8H9NO2 | 151.17 | −6 | −152 | −12 | −113 |
| Atrazine | Herbicide | C8H14ClN5 | 215.69 | 43 | −209 | 2 | −151 |
| Caffeine | Stimulant | C8H10N4O2 | 194.19 | 12 | −159 | 5 | −127 |
| Carbamazepine | Anticonvulsant | C15H12N2O | 236.27 | 40 | −163 | 11 | −155 |
| DEETa | Insect repellent | C12H17NO | 191.27 | 97 | −202 | 6 | −147 |
| Diazepam | Tranquiliser | C16H13ClN2O | 284.75 | 17 | −11 | 5 | −171 |
| Diclofenac | Analgesic | C14H11Cl2NO2 | 296.15 | −15 | −175 | −2 | −178 |
| Dilantin | Anticonvulsant | C15H12N2O2 | 252.27 | 14 | −182 | 1 | −185 |
| Estrone | Steroid | C18H22O2 | 270.37 | 100 | −264 | 35 | −188 |
| Fluoxetine | Antidepressant | C17H18F3NO | 309.33 | 100 | −251 | 98 | −215 |
| Gemfibrozil | Anti-cholesterol | C15H22O3 | 250.34 | 98 | −256 | 6 | −178 |
| Hydrocodone | Analgesic | C18H21NO3 | 299.37 | 23 | 6 | 26 | −196 |
| Ibuprofen | Analgesic | C13H18O2 | 206.29 | 98 | −228 | 6 | −156 |
| Meprobamate | Tranquiliser | C9H18N2O4 | 218.25 | 97 | −214 | 7 | −152 |
| Naproxen | Analgesic | C14H14O3 | 230.26 | 82 | −233 | 2 | −170 |
| Oxybenzone | UV absorber | C14H12O3 | 228.25 | 99 | −223 | 47 | −172 |
| Pentoxifylline | Blood viscosity control | C13H18N4O3 | 278.31 | 21 | −180 | 3 | −190 |
| Sulfamethoxazole | Antibiotic | C10H11N3O3S | 253.28 | 13 | −225 | 0 | −172 |
| TCEPb | Flame retardant | C6H12Cl3O4P | 285.49 | 21 | −208 | 7 | −168 |
| Triclosan | Bactericide | C12H7Cl3O2 | 289.55 | 99 | −230 | 45 | −168 |
| Trimethoprim | Antibiotic | C14H14O3 | 290.32 | 46 | −194 | 5 | −182 |
Experimentally, MOR removes 8 of the 21 molecules quantitatively (DEET, estrone, fluoxetine, gemfibrozil, ibuprofen, meprobamate, oxybenzone, triclosan). The computed Ezg values for these molecules range from −202 kJ mol−1 to −264 kJ mol−1. A similarly strong interaction is predicted for naproxen and atrazine, which are removed with efficiencies of ∼80% and ∼40%, respectively. Concerning the other two species that are removed with efficiencies of 40 to 50%, an intermediate interaction strength is obtained for trimethoprim (−194 kJ mol−1), whereas the interaction with carbamazepine is rather weak (−163 kJ mol−1). Among the remaining 9 pollutants, which are not removed to any appreciable extent, Ezg values close to zero are calculated for diazepam and hydrocodone. It can be concluded that these molecules do not fit into the channels of MOR, incurring a large energetic penalty if they are “forced” into the channels in the simulations (this also explains why the insertion of these molecules into the pores using an MC approach failed). For acetaminophen, caffeine, diclofenac, dilantin, and pentoxifylline, the Ezg values vary from −152 to −193 kJ mol−1, thus being distinctly less negative than those of the group of 8 molecules that are efficiently removed. Altogether, a relationship between the experimentally measured removal efficiency and the computed interaction strength can be identified, which is visualised in Fig. 1. The only two clear exceptions from the overall trend are sulfamethoxazole and TCEP, where Ezg values of −225 and −208 kJ mol−1, respectively, are contrasted with low removal efficiencies of 13 and 21%. There are various possible origins for this discrepancy, such as diffusional limitations or problems in the representation of the sulfonamide and phosphate ester groups with DREIDING parameters (as visible in Table 1 and Table S1 (ESI†), sulfamethoxazole is the only pollutant containing sulphur, and TCEP is the only pollutant containing phosphorus). This point will be revisited when discussing the results of the DFT calculations.
 | ||
| Fig. 1 Plot of calculated interaction energies Ezg against experimentally measured removal efficiencies.30 FLX = fluoxetine, NPX = naproxen, ATR = atrazine, SMZ = sulfamethoxazole, TMP = trimethoprim, CMP = carbamazepine. Data points for diazepam and hydrocodone in MOR are not shown. | ||
With few exceptions, it is possible to identify adsorbent–adsorbate combinations that result in an efficient removal on the basis of the Ezg values: If Ezg < −200 kJ mol−1, a high removal efficiency can be expected. While there are a few false positive predictions, most prominently for sulfamethoxazole and TCEP, it is worth noting that there are no false negatives, in other words, no situations where a weak interaction is predicted for a case where the experimentally observed removal is essentially quantitative (carbamazepine is a borderline case that will be revisited in the Discussion). This indicates that the simulations could be used as a predictive tool to identify promising zeolite frameworks for the selective adsorption of pollutants.
Adsorption of pollutants in FAU
Experimentally, FAU-type zeolite Y performs significantly worse than MOR, removing only fluoxetine essentially quantitatively, and more than 25% of four other contaminants (estrone, hydrocodone, oxybenzone, triclosan). The results for this system are included in Table 2 and Fig. 1. The overall picture is considerably simpler than for MOR: The Ezg value of fluoxetine (−215 kJ mol−1) is by far the lowest obtained for this zeolite, in line with the correspondence between low Ezg values and high removal efficiencies found above for MOR. This trend is not so evident for the four species that are partially removed, as the interaction energies fall essentially in the same range as those computed for molecules that are not adsorbed to any appreciable extent. This might indicate that guest–guest interactions or other specific interactions play a significant role in determining the overall affinity of FAU towards these pollutants. Altogether, the simulations clearly identify MOR as the more promising adsorbent for the removal of several of the 21 emerging contaminants, and one would certainly prioritise MOR for more detailed investigations if no previous experimental data were available.Assessing force field performance I: inclusion of point charges
The DREIDING calculations reported in the previous sections considered only vdW interactions and (where relevant) hydrogen bonds to model the zeolite–guest interaction. It is clear that this is a significant simplification, as electrostatic interactions will play a non-negligible role for these polar adsorbates. While the inclusion of electrostatics using point charges is fairly straightforward, a procedure to determine these charges needs to be selected. This choice will affect the results in a manner that is not predictable a priori. Moreover, there are no clear indications which charge model is most compatible with the DREIDING force field parameters. As an assessment of different charge models goes beyond the scope of this study, only charges calculated using the QEq equilibration scheme were considered. Calculations of Ezg using this DREIDING + QEq model were performed for seven pollutant molecules (acetaminophen, caffeine, fluoxetine, ibuprofen, sulfamethoxazole, TCEP, triclosan). The resulting Ezg values are tabulated and compared with the vdW-only results in Table S7 and Fig. S1 (ESI†), and plotted against experimental removal efficiencies in Fig. 2. | ||
| Fig. 2 Plot of calculated interaction energies Ezg obtained with DREIDING + QEq simulations (top) and DFT PBE-D3 calculations (bottom) against experimentally measured removal efficiencies.30 A subset of seven pollutants in MOR (green symbols) and FAU (orange symbols) was considered. The dashed horizontal lines, drawn to guide the eye, indicate values of −200 kJ mol−1 (DREIDING + QEq) and −170 kJ mol−1 (DFT). FLX = fluoxetine, SMZ = sulfamethoxazole, TCL = triclosan. | ||
For 9 of the 14 combinations considered, the Ezg values obtained with DREIDING + QEq fall within ±7% of the DREIDING values, in other words, the changes are relatively minor. For acetaminophen, caffeine, and triclosan in FAU, the DREIDING + QEq value is significantly more negative (by 13 to 19%). Interestingly, these three species have few common features (such as identical functional groups) that could provide a straightforward explanation of the relatively large influence of the point charges on Ezg. A distinctly weaker interaction is found for fluoxetine (−10%) and TCEP (−25%) in MOR. Both these molecules contain halogen atoms bonded to terminal sp3-hybridised carbons (one –CF3 group in fluoxetine, three –CH2Cl groups in TCEP). These halogen atoms carry a negative partial charge, leading to repulsive electrostatic interactions with the negatively polarised framework oxygen atoms. In the one-dimensional channels of MOR, the molecules cannot orient in a way that this repulsion is avoided, whereas the large pores of FAU allow a re-orientation, explaining the absence of this effect in the latter zeolite.
A plot of the Ezg (DREIDING + QEq) values against experimental removal efficiencies shows, overall, the same qualitative trend observed for the DREIDING results (Fig. 2): Systems with high removal efficiencies are characterised by Ezg < −200 kJ mol−1. The sulfamethoxazole@MOR case remains an outlier, but the data points for TCEP@MOR and triclosan@FAU agree much better with the overall trend than in the vdW-only case. This indicates that the inclusion of electrostatics may be particularly relevant for these halogen-bearing pollutants. However, it has to be reiterated that the combination of DREIDING parameters and QEq charges has not been thoroughly validated for adsorption studies in zeolites. To resolve this, future work should compare different force fields and charge derivation schemes, and benchmark them against higher-level computations.
Assessing force field performance II: DFT calculations
DFT calculations of the zeolite–guest interaction energy were performed for the same subset of seven pollutants considered in the DREIDING + QEq calculations. First of all, it needs to be emphasised that the DFT results depend on various parameters in the computational setup, especially the choice of exchange-correlation functional and dispersion correction. While the PBE-D3 functional has been successfully used in studies of host–guest interactions between zeolites and organics,79–81 it also has some known deficiencies.82 As a consequence, the Ezg values calculated with this method cannot be considered “accurate” in a quantitative sense, but they can still serve as reference values to gauge whether the force field calculations give reasonable trends.The Ezg(DFT) values are included in Fig. 2 and Table S2 (ESI†). There is a clear systematic difference between DREIDING and DFT interaction energies, with the DFT values being less negative. Interestingly, the relative difference is very similar for most adsorbent–adsorbate combinations: For 10 of the 14 cases, Ezg(DFT) amounts to 87 to 90% of Ezg(DREIDING). The exceptions are acetaminophen@MOR (96%), fluoxetine@FAU (84%), and sulfamethoxazole in both zeolites (81/82%). When plotting Ezg(DFT) as a function of removal efficiency (Fig. 2), the qualitative picture remains essentially unchanged compared to the DREIDING results, but Ezg is shifted to less negative values: Those systems for which near-quantitative removal is observed are characterised by Ezg values < −170 kJ mol−1, whereas Ezg > −160 kJ mol−1 for most systems with low removal efficiency.
The two exceptions are, as in the DREIDING vdW-only calculations, sulfamethoxazole and TCEP in MOR, for which Ezg(DFT) values in the range of −180 kJ mol−1 disagree with the negligible removal efficiencies. The fact that this discrepancy between calculation and experiment persists when using higher-level calculations indicates that it cannot (or, at least, not exclusively) be attributed to shortcomings of the DREIDING force field, such as problems with the sulphur (atom type S_3) and phosphorus (P_3) parameters. While no definitive explanation can be provided here, it has to be noted that both molecules are relatively bulky and non-linear in their isolated form, sulfamethoxazole being V-shaped and TCEP being (roughly) triangular. Even though the computational results show that it is, in principle, possible for them to fit into the one-dimensional channels of MOR, they might, in practice, be unable to diffuse through the channels. As elaborated further in the Discussion section, some experimental findings do indeed point to a role of diffusional limitations for sulfamethoxazole in MOR.
Analysis of low-energy configurations
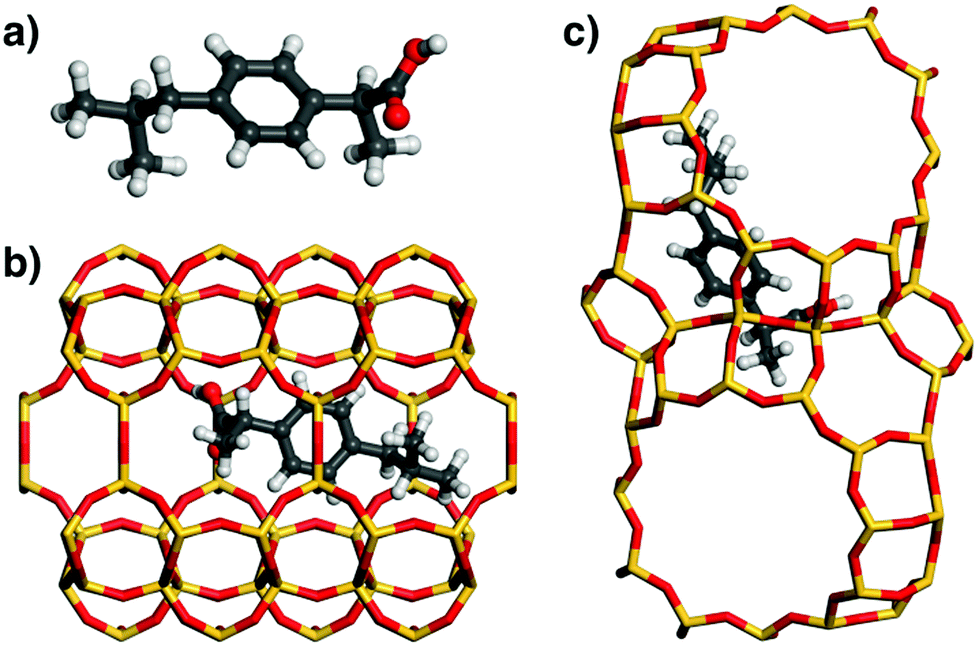
In order to investigate the origins of the differences in affinity among different pollutants, the DREIDING lowest-energy configurations of fluoxetine, ibuprofen, and acetaminophen in MOR and FAU were analysed (Fig. 3, 5, and 6). These three species were selected due to their qualitatively different behaviour: Fluoxetine is strongly adsorbed by both MOR and FAU, ibuprofen interacts strongly with MOR, but not with FAU, and acetaminophen interacts rather weakly with both zeolites. Prior to discussing the configurations of the adsorbed molecules, it is useful to summarise the key features of the zeolites’ pore topology: MOR possesses channels bordered by 12-membered rings (12MR) running along the c-direction, which are connected by eight-membered rings (8MR).29 Because the 8MR channels are only accessible to very small molecules, not to the bulky organics considered in the present work, the pore system can be considered as being one-dimensional, and the eight-membered rings correspond to side pockets of the larger channels. In FAU, large, nearly spherical “supercages” are connected by 12MR windows along the cubic 〈111〉 directions, forming a 3D pore system. | ||
| Fig. 3 (a) DREIDING-optimised structure of fluoxetine. (b) Lowest-energy configuration of fluoxetine in MOR. In the projection, the 12MR channels run from left to right, and the 8MR windows lie in the projection plane. (c) Lowest-energy configuration of fluoxetine in FAU. Two adjacent supercages connected by a 12MR window are shown. | ||
As shown in Fig. 3, the fluoxetine molecule in MOR is oriented along the 12MR channel. Interestingly, the conformation of the adsorbed molecule is very different to the isolated state, with both phenyl rings lying almost in one plane, and a folded-up N-methyl-ethanamine chain. The molecule is oriented in a way that the phenyl rings point towards the 8MR side pockets. In contrast, the conformation of fluoxetine adsorbed in FAU is very similar to that of the free molecule. The central part of the molecule occupies a 12-ring window connecting two supercages, and both phenyl moieties and the N-methyl-ethanamine side chain are located above assemblies of 4- and 6-rings bordering these cages.
While one can already estimate from the visualisation of the low-energy configurations that there are many close contacts between fluoxetine and framework atoms for both zeolites, a more quantitative assessment can be made by looking at the distribution of interatomic distances. For this analysis, histograms of the distance between framework atoms and non-hydrogen atoms of fluoxetine were compiled (hydrogen atoms were not considered because their contribution to vdW interactions is small). The distance distribution visualised in Fig. 4 clearly shows a considerable number of interatomic contacts between ∼3.5 and 5 Å for both frameworks (the larger number of distances between 4 and 5 Å for MOR can be explained with the confinement of fluoxetine to a 1D channel, compared to the relatively open supercage of FAU). As the minima of the LJ pair potentials (derived from DREIDING parameters using Lorentz–Berthelot mixing rules) are in the range of 3.4 to 3.6 Å for contacts between adsorbate C, N, O, and F atoms and framework oxygen atoms, and in the range of 3.9 to 4.1 Å for contacts to framework Si atoms, contacts from ∼3.4 to ∼4.2 Å will make the most important attractive contribution to the total vdW interaction.
 | ||
| Fig. 4 Distance distribution in lowest-energy configurations of fluoxetine, ibuprofen, and acetaminophen in MOR (green columns) and FAU (orange columns). Each column corresponds to the number of framework–guest contacts within an interval of d ± 0.1 Å. For example, a column of height 2 at d = 3.0 Å represents two framework-guest contacts having a length between 2.9 and 3.1 Å. | ||
In the lowest-energy configuration of ibuprofen adsorbed in MOR (Fig. 5), the phenyl ring lies above one of the 8MR side pockets and two of the methyl groups point into other side pockets. In addition, there is a hydrogen bond from the carboxylic acid group to a framework oxygen atom (the DREIDING force field includes an explicit term for hydrogen bonds which was included in the optimisations of low-energy configurations). Such a hydrogen bond is also present in FAU, where the carboxylic acid group is located in a 12MR window. Here, the central phenyl ring lies roughly above one 6MR of the framework, which is favourable in terms of vdW interactions, but the remainder of the ibuprofen molecule cannot arrange in a way that results in many close contacts. The distance distributions (Fig. 4) overall show fewer framework-guest contacts at any given distance than found above for fluoxetine, which is straightforwardly explained with the smaller number of non-hydrogen atoms in the ibuprofen molecule. It is also apparent that the number of contacts in the distance range of strongest attraction (3.4 to 4.2 Å) is significantly larger for MOR than for FAU, explaining why the computed interaction energy is more than −70 kJ mol−1 more negative for the former system.
 | ||
| Fig. 5 (a) DREIDING-optimised structure of ibuprofen. (b) and (c) Lowest-energy configurations of ibuprofen in MOR and FAU. | ||
Similar to ibuprofen, acetaminophen also forms a hydrogen bond from the hydroxyl group to a framework oxygen atom of MOR. However, this smaller and more rigid molecule fills the 12MR channel much less efficiently than fluoxetine or ibuprofen, leading to a displacement towards one side of the channel (Fig. 6). As a consequence, attractive vdW interactions with the framework are weaker. This is corroborated by the distance distribution: While the number of contacts in the range up to 4 Å is actually quite similar to that found for ibuprofen in MOR, there are fewer contacts between 4 and 5 Å, because the atoms at the opposite channel wall lie at distances above 6 Å due to the off-centre displacement. Apparently, these framework-guest contacts of intermediate length (above the sum of vdW radii) make an important contribution to the overall interaction energy. The lowest-energy configuration of acetaminophen in FAU is similar to that of ibuprofen in this zeolite: The phenyl moiety lies above a 6MR, but the rest of the molecule cannot establish many close contacts with the framework.
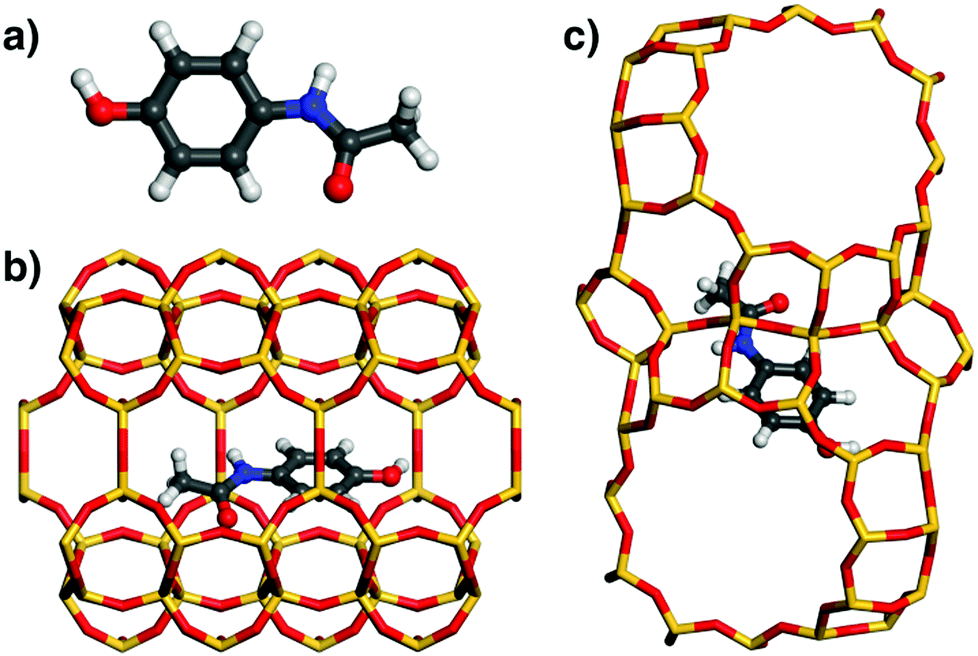 | ||
| Fig. 6 (a) DREIDING-optimised structure of acetaminophen. (b and c) Lowest-energy configurations of acetaminophen in MOR and FAU. | ||
Adsorption of acetaminophen in various zeolites
In order to illustrate how molecular simulations could be employed in a predictive fashion, the adsorption of acetaminophen in 11 other zeolite frameworks was studied. The set of zeolites was selected on the basis of the following two criteria: first, every framework should be available in all-silica or at least high-silica form (the material names of representative zeolites are included in Table 1). Second, the framework should possess at least 10MR windows, as it can be expected that the acetaminophen molecule cannot pass through smaller rings.The resulting values of Ezg are listed in Table 3. First of all, it is noteworthy that no Ezg value below −200 kJ mol−1 is found for any zeolite, whereas it was observed above that high removal efficiencies occur essentially exclusively for adsorbent–adsorbate combinations having an interaction energy of this magnitude. However, values between −195 and −181 kJ mol−1 are obtained for four zeolites having 10MR channel systems, FER, MEL, MFI, and MWW. While it appears plausible that the smaller channel diameter affords a larger number of close contacts between the adsorbed molecule and the framework, leading to stronger vdW interactions, it is also worth noting that there are some zeolites with 10MR channels for which the interaction is distinctly weaker (MTT, TON). Furthermore, the dimensionality of the channel system does not seem to play an important role, as the frameworks in which the interaction is strongest have 1D (FER), 2D (MWW), and 3D (MEL, MFI) channel systems. Taken together, the simulation results indicate that zeolites with 10MR pores should be more promising for the removal of acetaminophen from aqueous solution than the 12MR systems studied by Rossner et al.30 It has to be kept in mind that real-world wastewater treatment applications would usually require the adsorption of a mixture of pollutants. The larger molecules included in the present work would not be able to fit into 10MR channels. As a consequence, either a combination of adsorbents with different channel systems or the use of one zeolite having different types of channels might be required to remove a broad range of organic contaminants.
| FTC | Channel system (only ≥10MR) and dimensionality | E zg (acetam.) [kJ mol−1] |
|---|---|---|
| MOR | 12MR (1D) | −152 |
| FAU | 12MR (3D) | −113 |
| AFI | 12MR (1D) | −146 |
| BEA | 12MR (3D) | −151 |
| EUO | 10MR (1D) | −170 |
| FER | 10MR (1D) | −194 |
| MEI | 12MR (1D) | −146 |
| MEL | 10MR (3D) | −183 |
| MFI | 10MR (3D) | −185 |
| MTT | 10MR (1D) | −165 |
| MTW | 12MR (1D) | −175 |
| MWW | 10MR (2D) | −181 |
| TON | 10MR (1D) | −167 |
Fig. 7a visualises the lowest-energy configuration of acetaminophen in the FER structure. The acetaminophen molecule is located close to the centre of the 10MR channels, pointing along the running direction of the channels, with the phenyl moiety lying directly above a six-ring that is part of the channel wall. A comparison of the distance distribution of framework-guest contacts of FER to that of MOR (Fig. 7b) reveals a much larger number of contacts in the distance range between 3.4 and 4.2 Å, corroborating the better “fit” of the acetaminophen molecule into these narrower channels. While no experimental studies of pharmaceutical adsorption in all-silica FER have been reported, the adsorption of acetaminophen in MFI-type ZSM-5 has been investigated by De Ridder et al.31 They observed negligible uptake of acetaminophen in this system, at variance with the rather strong interaction obtained in the simulations. This discrepancy can possibly be explained with the reduced hydrophobicity of the ZSM-5 adsorbent (Si/Al = 40), which is likely to cause a non-negligible competitive adsorption of water.
 | ||
| Fig. 7 (a) Lowest-energy configurations of acetaminophen in FER. The 10MR channels run from left to right. (b) Distribution of interatomic contacts for FER (blue columns) and comparison to MOR (green columns). | ||
Discussion
As mentioned briefly in the Introduction, the approach employed in the present work makes use of a number of simplifications, which are summarised in the following:• The removal efficiency (in the limit of low coverage) is determined by the enthalpy of transfer from aqueous solution to the adsorbed state in the zeolite pore. An actual simulation of this adsorption process would have to use the hydrated pollutant molecule as reference state. While such simulations are possible (for example, Bai et al. used Gibbs ensemble MC simulations to study the adsorption of glucose into zeolite beta from aqueous solution59), they are very time-consuming, especially for complex molecules. In the present study, interaction energies Ezg were calculated using the isolated (not hydrated) molecule as reference state. Clearly, this is a rather drastic simplification. One cannot even expect that Ezg and the enthalpy of transfer are directly correlated, as the enthalpy of transfer also depends on the interactions between a pollutant molecule and its hydration shell, i.e., the hydration free energy.28
• The range of pKa values, summarised in Table 1 of Rossner et al.,30 shows that some of the pollutants studied are dominantly anionic at near-neutral pH (e.g., diclofenac: pKa = 4.2, ibuprofen: pKa = 4.9). In the simulations, it was assumed that neutral molecules are adsorbed in the zeolites.
• The simulations performed for the complete set of pollutants did not include electrostatic interactions. Results obtained for a subset of molecules indicate that the inclusion of point charges causes only relatively small changes in Ezg for the majority of pollutants, but that it can play an important role for some systems (e.g., halogen-bearing molecules). A reliable use of point charges will require further validation of the charge model.
• While several local minima were sampled during the simulations, only the energy of the lowest-energy configuration was used in the analysis. This is, again, a simplification, as it has to be expected that several low-energy configurations will coexist at room temperature. This concerns both different conformations of the adsorbate and different adsorption sites.
• Although it has been demonstrated experimentally that the adsorption of pharmaceuticals leads to distortions of the zeolite framework,32,35,36,40 completely rigid zeolite models were used in the simulations.
• The adsorbents were idealised as defect-free all-silica zeolites. The adsorbents used in the experimental study had Si/Al ratios of 115 (MOR) and 405 (FAU), corresponding to roughly one framework Al atom per MOR supercell and per two FAU unit cells, respectively. Under the assumption that these Al atoms are highly dispersed, every adsorbed molecule could interact with the associated charge-compensating species (protons or extra-framework cations) if two conditions are met: First, the adsorbate concentration needs to be low (not more than one guest molecule per Al site). Second, the charge-compensating species would need to be located in accessible areas of the pore space. While a low concentration is assumed in the simulations, the second condition means that a computational comparison of different possible Al and proton/cation sites would have to be made prior to the adsorption simulations. Such predictions are far from trivial.83 Furthermore, the adsorption simulations would need to use a force field that adequately describes the interaction of different adsorbate functional groups with the protons and/or cations.
• Finally, the simulations only considered adsorption of individual pollutant molecules, ignoring the potential influence of guest–guest interactions between identical or (even more challenging) different adsorbed pollutants and of the coadsorption of water.
In the light of this long list of inherent simplifications, it might appear surprising that the simulation approach is nevertheless able to correctly identify the large majority of adsorbent–adsorbate combinations for which high removal efficiencies have been found experimentally. The analysis above has shown that the zeolite–guest interaction energy is determined largely by the ability of the guest molecule to maximise the number of favourable vdW contacts with the framework atoms, i.e., the “fit” of the pollutant into the zeolite pores. This fit can be predicted reasonably well using the simple vdW-only picture employed, as has been done previously in computational studies of the stabilisation of zeolite frameworks by OSDAs.52–58 As a consequence, it appears that the interaction energy Ezg could be used in a predictive fashion to identify adsorbents with a high affinity towards a given pollutant. However, it needs to be re-emphasised that the zeolite–guest interaction energy is an artificial quantity that has no directly measurable experimental analogue, and that any simulation approach aiming at a physically accurate description of the actual adsorption process would necessarily have to be much more complex.
While the present work relied exclusively on a comparison of the simulation results to experimental removal efficiencies reported by Rossner et al., it has to be noted that other authors have studied the adsorption of some of these pollutants onto the same zeolites. For example, Martucci et al. investigated the adsorption of carbamazepine in both MOR and FAU.35 Their observation of a predominant adsorption of carbamazepine at the external surface of MOR agrees with the difficulties of inserting this molecule into the MOR channels using MC simulations. With regard to FAU, Martucci et al. observed high carbamazepine removal efficiencies in the mg L−1 and μg L−1 ranges, at variance with the findings of Rossner et al., who studied a lower concentration (∼600 ng L−1). Potentially, this difference could be attributed to attractive guest–guest interactions, which have been demonstrated to be significant for several other pharmaceuticals adsorbed in FAU.33,37 Because the simulations in the present work considered only one molecule per simulation cell, guest–guest interactions were not evaluated. Another discrepancy among experimental works exists for sulfamethoxazole, where Fukahori et al.39 and Blasioli et al.40 reported a high affinity of FAU-type adsorbents towards this pharmaceutical (again, at higher loadings), in disagreement with the negligible removal efficiencies observed by Rossner et al.30 While the present work cannot resolve these discrepancies, they highlight that a thorough validation of any computational approach will also require further experimental characterisation efforts.
If the dimensions of the guest molecule approach the diameter of channels or pore-connecting windows, the diffusion of the guest species through the pores will be impeded. Diffusional limitations have been observed experimentally in some cases, for example for sulfamethoxazole in zeolite MOR.40 The limited ability of sulfamethoxazole to diffuse through the pores of MOR might be one potential explanation for the discrepancy between simulation and experiment, discussed above, but other origins cannot be ruled out. The ability of force-field based MD simulations to predict the qualitatively different diffusion behaviour of two pharmaceuticals in the pores of a zeolite beta adsorbent has been demonstrated by Fatouros et al.60 However, if the diffusion is slow, but non-negligible, the timescale that is accessible with standard MD methods can be too short to capture the diffusion processes, and rare-event simulation methods may be needed.43
Conclusions and outlook
Molecular simulations performed for various organic pollutants in two zeolites reveal that the zeolite–guest interaction energy of the lowest-energy configuration can potentially be used to predict the removal efficiency. Adsorbent–adsorbate combinations for which an essentially quantitative removal was observed in previous experimental work are, in all cases, characterised by a zeolite–guest interaction energy of at least −200 kJ mol−1. Clearly, the importance of this particular “threshold” energy value should not be overestimated, as it will depend on the choice of the computational approach. Additional calculations performed for a subset of pollutants show that the trends are not dramatically affected by the inclusion of electrostatic interactions using point charges, and good agreement with results from dispersion-corrected DFT calculations further corroborates the suitability of the force field method. Rather than aiming at a quantitative prediction of any directly measurable physical quantity, the main aim of the present work is to establish the relative robustness of a simple approach: Despite employing a generic force field without any system-specific parameterisation, and despite the various simplifications mentioned in the Discussion, the simulations can be useful for an initial “screening” of adsorbents that aims to reduce the number of potential adsorbent-adsorbate combinations prior to carrying out experimental work or more detailed computations. In the view of the huge number of pharmaceutical pollutants that are currently found in the environment, and the structural variability of zeolites, such screening strategies have considerable potential to facilitate the development of new adsorbents for wastewater treatment. Looking beyond zeolites, they could also be used to compare the performance of adsorbents from different categories (as long as atomistic models are available). Furthermore, similar modelling approaches can find applications in related fields, e.g., with regard to the use of zeolites as host materials in drug delivery.60,84,85As various simplifications were made in the present work, it is quite clear that the approach could be improved in various ways. Such improvements could include (a) the use of a force field that is more specifically designed for the modelling of pharmaceutical compounds, and that provides a reliable representation of both vdW and electrostatic interactions,86 (b) a calculation of Ezg that takes into account several local minima, e.g., by using a Boltzmann averaging over different configurations, (c) the development of approximate ways to include the transfer from solution to the adsorbed phase, e.g., by taking into account the hydration free energy computed using the same force field, (d) the use of less idealised adsorbent models incorporating framework Al atoms and associated protons/cations (or other heterogeneities), (e) the inclusion of interactions with coadsorbed water molecules and/or among coadsorbed pollutants. A combination of force field methods with electronic structure calculations should be particularly helpful to develop an increasingly accurate atomic-level picture.
Conflicts of interest
There are no conflicts to declare.Acknowledgements
This research was funded by the Deutsche Forschungsgemeinschaft (DFG – German Research Foundation), project number 389577027 (FI 1800/5-1). The author would like to thank Guido Cerri (Sassari) for insightful discussions and for a critical reading of a draft version. The author is grateful to Andreas Lüttge and Rolf S. Arvidson for generous access to, and support of, the Asgard cluster, on which the DFT calculations were run.References
- T. Aus der Beek, F.-A. Weber, A. Bergmann, S. Hickmann, I. Ebert, A. Hein and A. Küster, Environ. Toxicol. Chem., 2016, 35, 823–835 CrossRef CAS PubMed.
- A. J. Ebele, M. Abou-Elwafa Abdallah and S. Harrad, Emerging Contam., 2017, 3, 1–16 CrossRef.
- B. Petrie, R. Barden and B. Kasprzyk-Hordern, Water Res., 2015, 72, 3–27 CrossRef CAS PubMed.
- A. Jelic, M. Gros, A. Ginebreda, R. Cespedes-Sánchez, F. Ventura, M. Petrovic and D. Barcelo, Water Res., 2011, 45, 1165–1176 CrossRef CAS PubMed.
- A. B. A. Boxall, M. A. Rudd, B. W. Brooks, D. J. Caldwell, K. Choi, S. Hickmann, E. Innes, K. Ostapyk, J. P. Staveley, T. Verslycke, G. T. Ankley, K. F. Beazley, S. E. Belanger, J. P. Berninger, P. Carriquiriborde, A. Coors, P. C. DeLeo, S. D. Dyer, J. F. Ericson, F. Gagné, J. P. Giesy, T. Gouin, L. Hallstrom, M. V. Karlsson, D. G. J. Larsson, J. M. Lazorchak, F. Mastrocco, A. McLaughlin, M. E. McMaster, R. D. Meyerhoff, R. Moore, J. L. Parrott, J. R. Snape, R. Murray-Smith, M. R. Servos, P. K. Sibley, J. O. Straub, N. D. Szabo, E. Topp, G. R. Tetreault, V. L. Trudeau and G. Van Der Kraak, Environ. Health Perspect., 2012, 120, 1221–1229 CrossRef.
- P. Verlicchi, M. Al Aukidy and E. Zambello, Sci. Total Environ., 2012, 429, 123–155 CrossRef CAS PubMed.
- Y. Luo, W. Guo, H. H. Ngo, L. D. Nghiem, F. I. Hai, J. Zhang, S. Liang and X. C. Wang, Sci. Total Environ., 2014, 473–474, 619–641 CrossRef CAS PubMed.
- E. Archer, B. Petrie, B. Kasprzyk-Hordern and G. M. Wolfaardt, Chemosphere, 2017, 174, 437–446 CrossRef CAS PubMed.
- Y. Yang, Y. S. Ok, K. Kim, E. E. Kwon and Y. F. Tsang, Sci. Total Environ., 2017, 596–597, 303–320 CrossRef CAS PubMed.
- K.-R. Kim, G. Owens, S.-I. Kwon, K.-H. So, D.-B. Lee and Y. S. Ok, Water, Air, Soil Pollut., 2011, 214, 163–174 CrossRef CAS.
- S. González-Alonso, L. M. Merino, S. Esteban, M. López de Alda, D. Barceló, J. J. Durán, J. López-Martínez, J. Aceña, S. Pérez, N. Mastroianni, A. Silva, M. Catalá and Y. Valcárcel, Environ. Pollut., 2017, 229, 241–254 CrossRef PubMed.
- A. Karkman, T. T. Do, F. Walsh and M. P. J. Virta, Trends Microbiol., 2018, 26, 220–228 CrossRef CAS PubMed.
- M. B. Ahmed, J. L. Zhou, H. H. Ngo and W. Guo, Sci. Total Environ., 2015, 532, 112–126 CrossRef CAS PubMed.
- M. B. Ahmed, J. L. Zhou, H. H. Ngo, W. Guo, N. S. Thomaidis and J. Xu, J. Hazard. Mater., 2017, 323, 274–298 CrossRef CAS PubMed.
- S. D. Richardson and S. Y. Kimura, Environ. Technol. Rev., 2017, 8, 40–56 Search PubMed.
- J. R. De Andrade, M. F. Oliveira, M. G. C. Da Silva and M. G. A. Vieira, Ind. Eng. Chem. Res., 2018, 57, 3103–3127 CrossRef CAS.
- M. Patel, R. Kumar, K. Kishor, T. Mlsna, C. U. Pittman and D. Mohan, Chem. Rev., 2019, 119, 3510–3673 CrossRef CAS PubMed.
- D. P. Grover, J. L. Zhou, P. E. Frickers and J. W. Readman, J. Hazard. Mater., 2011, 185, 1005–1011 CrossRef CAS PubMed.
- L. F. Delgado, P. Charles, K. Glucina and C. Morlay, Sci. Total Environ., 2012, 435–436, 509–525 CrossRef CAS PubMed.
- Y. Guo, B. Chen, D. Liu, W. Huang, Y. Sun and Y. Zhao, Environ. Technol. Rev., 2018, 7, 177–198 CrossRef.
- V. Rakić, N. Rajić, A. Daković and A. Auroux, Microporous Mesoporous Mater., 2013, 166, 185–194 CrossRef.
- E. Rivagli, A. Pastorello, M. Sturini, F. Maraschi, A. Speltini, L. Zampori, M. Setti, L. Malavasi and A. Profumo, J. Environ. Chem. Eng., 2014, 2, 738–744 CrossRef CAS.
- A. V. Dordio, S. Miranda, J. P. Prates Ramalho and A. J. P. Carvalho, J. Hazard. Mater., 2017, 323, 575–583 CrossRef CAS PubMed.
- T. X. Bui and H. Choi, J. Hazard. Mater., 2009, 168, 602–608 CrossRef CAS PubMed.
- T. X. Bui and H. Choi, Chemosphere, 2010, 80, 681–686 CrossRef CAS PubMed.
- H. M. Ötker and I. Akmehmet-Balcıoğlu, J. Hazard. Mater., 2005, 122, 251–258 CrossRef PubMed.
- J. W. P. Lye, N. Saman, S. S. N. Sharuddin, N. S. Othman, S. S. Mohtar, A. M. Md Noor, J. Buhari, S. C. Cheu, H. Kong and H. Mat, Clean: Soil, Air, Water, 2017, 45, 1600260 Search PubMed.
- N. Jiang, R. Shang, S. G. J. Heijman and L. C. Rietveld, Water Res., 2018, 144, 145–161 CrossRef CAS PubMed.
- C. Baerlocher and L. B. McCusker, http://www.iza-structure.org/databases/, 2018.
- A. Rossner, S. A. Snyder and D. R. U. Knappe, Water Res., 2009, 43, 3787–3796 CrossRef CAS PubMed.
- D. J. D. Ridder, J. Q. J. C. Verberk, S. G. J. Heijman, G. L. Amy and J. C. V. Dijk, Sep. Purif. Technol., 2012, 89, 71–77 CrossRef.
- I. Braschi, S. Blasioli, L. Gigli, C. E. Gessa, A. Alberti and A. Martucci, J. Hazard. Mater., 2010, 178, 218–225 CrossRef CAS PubMed.
- I. Braschi, G. Gatti, G. Paul, C. E. Gessa, M. Cossi and L. Marchese, Langmuir, 2010, 26, 9524–9532 CrossRef CAS PubMed.
- S. Fukahori, T. Fujiwara, R. Ito and N. Funamizu, Desalination, 2011, 275, 237–242 CrossRef CAS.
- A. Martucci, L. Pasti, N. Marchetti, A. Cavazzini, F. Dondi and A. Alberti, Microporous Mesoporous Mater., 2012, 148, 174–183 CrossRef CAS.
- A. Martucci, M. A. Cremonini, S. Blasioli, L. Gigli, G. Gatti, L. Marchese and I. Braschi, Microporous Mesoporous Mater., 2013, 170, 274–286 CrossRef CAS.
- I. Braschi, G. Paul, G. Gatti, M. Cossi and L. Marchese, RSC Adv., 2013, 3, 7427–7437 RSC.
- L. Pasti, E. Sarti, A. Cavazzini, N. Marchetti, F. Dondi and A. Martucci, J. Sep. Sci., 2013, 36, 1604–1611 CrossRef CAS PubMed.
- S. Fukahori, T. Fujiwara, N. Funamizu, K. Matsukawa and R. Ito, Water Sci. Technol, 2013, 67, 319–325 CrossRef CAS PubMed.
- S. Blasioli, A. Martucci, G. Paul, L. Gigli, M. Cossi, C. T. Johnston, L. Marchese and I. Braschi, J. Colloid Interface Sci., 2014, 419, 148–159 CrossRef CAS PubMed.
- I. Braschi, A. Martucci, S. Blasioli, L. L. Mzini, C. Ciavatta and M. Cossi, Chemosphere, 2016, 155, 444–452 CrossRef CAS PubMed.
- I. Braschi, S. Blasioli, E. Buscaroli, D. Montecchio and A. Martucci, J. Environ. Sci., 2016, 43, 302–312 CrossRef CAS PubMed.
- B. Smit and T. L. M. Maesen, Chem. Rev., 2008, 108, 4125–4184 CrossRef CAS PubMed.
- V. Van Speybroeck, K. Hemelsoet, L. Joos, M. Waroquier, R. G. Bell and C. R. A. Catlow, Chem. Soc. Rev., 2015, 44, 7044–7111 RSC.
- S. Chempath, R. Q. Snurr and J. J. Low, AIChE J., 2004, 50, 463–469 CrossRef CAS.
- P. Boulet, L. Narasimhan, D. Berg’e-Lefranc, B. Kuchta, O. Schäf and R. Denoyel, J. Mol. Model., 2009, 15, 573–579 CrossRef CAS.
- L. Narasimhan, P. Boulet, B. Kuchta, C. Vagner, O. Schäf and R. Denoyel, Appl. Surf. Sci., 2010, 256, 5470–5474 CrossRef CAS.
- A. Torres-Knoop, J. Heinen, R. Krishna and D. Dubbeldam, Langmuir, 2015, 31, 3771–3778 CrossRef CAS PubMed.
- J. Toda, A. Corma and G. Sastre, J. Phys. Chem. C, 2016, 120, 16668–16680 CrossRef CAS.
- J. Randrianandraina, I. Deroche, L. Bullot, R. Stephan, M. Hanf, G. Chaplais, T. J. Daou, A. Simon-Masseron, J. Patarin and P. Sonnet, J. Phys. Chem. C, 2018, 122, 12731–12741 CrossRef CAS.
- N. Jiang, M. Erdős, O. A. Moultos, R. Shang, T. J. H. Vlugt, S. G. J. Heijman and L. C. Rietveld, Chem. Eng. J., 2020, 389, 123968 CrossRef CAS.
- R. Pophale, F. Daeyaert and M. W. Deem, J. Mater. Chem. A, 2013, 1, 6750–6760 RSC.
- J. E. Schmidt, M. W. Deem and M. E. Davis, Angew. Chem., Int. Ed., 2014, 53, 8372–8374 CrossRef CAS.
- J. E. Schmidt, M. W. Deem, C. Lew and T. M. Davis, Top. Catal., 2015, 58, 410–415 CrossRef CAS.
- T. M. Davis, A. T. Liu, C. M. Lew, D. Xie, A. I. Benin, S. Elomari, S. I. Zones and M. W. Deem, Chem. Mater., 2016, 28, 708–711 CrossRef CAS.
- P. Lu, A. Mayoral, L. Gómez-Hortigüela, Y. Zhang and M. A. Camblor, Chem. Mater., 2019, 31, 5484–5493 CrossRef CAS.
- M. Gálvez-Llompart, A. Cantín, F. Rey and G. Sastre, Z. Kristallogr. – Cryst. Mater., 2019, 234, 451–460 Search PubMed.
- F. Daeyaert and M. W. Deem, ChemPlusChem, 2020, 85, 277–284 CrossRef CAS.
- P. Bai, J. I. Siepmann and M. W. Deem, AIChE J., 2013, 59, 3523–3529 CrossRef CAS.
- D. G. Fatouros, D. Douroumis, V. Nikolakis, S. Ntais, A. M. Moschovi, V. Trivedi, B. Khima, M. Roldo, H. Nazar and P. A. Cox, J. Mater. Chem., 2011, 21, 7789–7794 RSC.
- M. Spanakis, N. Bouropoulos, D. Theodoropoulos, L. Sygellou, S. Ewart, A. M. Moschovi, A. Siokou, I. Niopas, K. Kachrimanis, V. Nikolakis, P. A. Cox, I. S. Vizirianakis and D. G. Fatouros, Nanomedicine, 2014, 10, 197–205 CrossRef CAS PubMed.
- P. de Voogt, M.-L. Janex-Habibi, F. Sacher, L. Puijker and M. Mons, Water Sci. Technol., 2009, 59, 39–46 CrossRef CAS PubMed.
- J. D. Gale and A. L. Rohl, Mol. Simul., 2003, 29, 291–341 CrossRef CAS.
- M. J. Sanders, M. Leslie and C. R. A. Catlow, J. Chem. Soc., Chem. Commun., 1984, 1271–1273 RSC.
- A. F. Combariza, D. A. Gomez and G. Sastre, Chem. Soc. Rev., 2013, 42, 114–127 RSC.
- M. Fischer, F. O. Evers, F. Formalik and A. Olejniczak, Theor. Chem. Acc., 2016, 135, 257 Search PubMed.
- W. H. Baur and R. X. Fischer, in 16th International Zeolite Conference, ed. A. D. Frede, Sorrento, Italy, 2010, p. 457 Search PubMed.
- S. Kim, J. Chen, T. Cheng, A. Gindulyte, J. He, S. He, Q. Li, B. A. Shoemaker, P. A. Thiessen, B. Yu, L. Zaslavsky, J. Zhang and E. E. Bolton, Nucleic Acids Res., 2019, 47, D1102–D1109 CrossRef PubMed.
- J. Hastings, G. Owen, A. Dekker, M. Ennis, N. Kale, V. Muthukrishnan, S. Turner, N. Swainston, P. Mendes and C. Steinbeck, Nucleic Acids Res., 2016, 44, D1214–D1219 CrossRef CAS PubMed.
- BIOVIA Materials Studio 2019, DS Biovia, 2019.
- S. L. Mayo, B. D. Olafson and W. A. Goddard, J. Phys. Chem., 1990, 94, 8897–8909 CrossRef CAS.
- M. J. Lennox, M. Bound, A. Henley and E. Besley, Mol. Simul., 2017, 43, 828–837 CrossRef CAS.
- A. K. Rappe and W. A. Goddard, J. Phys. Chem., 1991, 95, 3358–3363 CrossRef CAS.
- T. D. Kühne, M. Iannuzzi, M. Del Ben, V. V. Rybkin, P. Seewald, F. Stein, T. Laino, R. Z. Khaliullin, O. Schütt, F. Schiffmann, D. Golze, J. Wilhelm, S. Chulkov, M. H. Bani-Hashemian, V. Weber, U. Borstnik, M. Taillefumier, A. S. Jakobovits, A. Lazzaro, H. Pabst, T. Müller, R. Schade, M. Guidon, S. Andermatt, N. Holmberg, G. K. Schenter, A. Hehn, A. Bussy, F. Belleflamme, G. Tabacchi, A. Glöβ, M. Lass, I. Bethune, C. J. Mundy, C. Plessl, M. Watkins, J. VandeVondele, M. Krack and J. Hutter, arXiv, 2020, arXiv:2003.03868.
- J. P. Perdew, K. Burke and M. Ernzerhof, Phys. Rev. Lett., 1996, 77, 3865–3868 CrossRef CAS PubMed.
- S. Grimme, J. Antony, S. Ehrlich and H. Krieg, J. Chem. Phys., 2010, 132, 154104 CrossRef PubMed.
- M. Krack, Theor. Chem. Acc., 2005, 114, 145–152 Search PubMed.
- J. VandeVondele and J. Hutter, J. Chem. Phys., 2007, 127, 114105 CrossRef PubMed.
- F. C. Hendriks, D. Valencia, P. C. A. Bruijnincx and B. M. Weckhuysen, Phys. Chem. Chem. Phys., 2017, 19, 1857–1867 RSC.
- M. Boronat and A. Corma, ACS Catal., 2019, 9, 1539–1548 CrossRef CAS PubMed.
- M. Fischer, J. Phys. Chem. C, 2019, 123, 1852–1865 CrossRef CAS.
- J. Klimeš and D. P. Tew, J. Chem. Phys., 2019, 151, 234108 CrossRef PubMed.
- S. Li, R. Gounder, A. Debellis, I. B. Müller, S. Prasad, A. Moini and W. F. Schneider, J. Phys. Chem. C, 2019, 123, 17454–17458 CrossRef CAS.
- P. Horcajada, C. Márquez-Alvarez, A. Rámila, J. Pérez-Pariente and M. Vallet-Regí, Solid State Sci., 2006, 8, 1459–1465 CrossRef CAS.
- G. Cerri, M. Farina, A. Brundu, A. Daković, P. Giunchedi, E. Gavini and G. Rassu, Microporous Mesoporous Mater., 2016, 223, 58–67 CrossRef CAS.
- R. L. Marchese Robinson, D. Geatches, C. Morris, R. Mackenzie, A. G. P. Maloney, K. J. Roberts, A. Moldovan, E. Chow, K. Pencheva and D. R. M. Vatvani, J. Chem. Inf. Model., 2019, 59, 4778–4792 CrossRef CAS PubMed.
Footnote |
| † Electronic supplementary information (ESI) available: PDF document containing DREIDING atom types and parameters, Ezg values obtained with different cutoffs, and results of DREIDING + QEq and DFT calculations. DREIDING-optimised molecular structures of pollutants (in MDL MOL format and Materials Studio CAR and MDF formats). SLC-optimised structures of zeolite adsorbents (in CIF format). See DOI: 10.1039/d0ma00025f |
| This journal is © The Royal Society of Chemistry 2020 |