DOI:
10.1039/D0MA00048E
(Paper)
Mater. Adv., 2020,
1, 99-107
Characteristics of nanosilver ink (UTDAg) microdroplets and lines on polyimide during inkjet printing at high stage velocity
Received
21st February 2020
, Accepted 23rd March 2020
First published on 25th March 2020
Abstract
The performance of printed electronics strongly depends on printing techniques and printing resolution that enhance their electrical and mechanical properties. In this research paper, a Jetlab 4xl was used to control and dispense microdroplets of highly conductive nanosilver ink (UTDAg) on a polyimide substrate. The waveform effect on the droplet generation is characterized by measuring the size and the speed of the drops. The behavior of ejected drops on the substrate is studied by printing lines at different drop spacing and stage velocity. The jetting parameters that drive the piezoelectric actuator were properly determined and two waveforms (bipolar) were created to generate two different droplet characteristics in terms of speed and size. Then, printing on the fly using commands in a script file (called ‘in script’ hereafter) with burst mode (a single burst) was used to print lines with different droplet spacings of 50 μm, 60 μm, 70 μm, 80 μm, 90 μm and 100 μm and stage velocities of 20 mm s−1, 30 mm s−1, 40 mm s−1, and 50 mm s−1. The spreading behavior of the ejected droplets was investigated as well by printing lines with 250 μm spacing at the different stage velocities mentioned above. The physical characteristics of the printed lines were studied by optical microscopy and surface profilometry. Finally, the resistance of the printed line at 100 μm droplet spacing and 50 mm s−1 stage velocity was measured at curing temperatures of 140 °C and 160 °C.
1 Introduction
In recent years, the printed electronics field has received attention due to the possibility of fabricating low cost, light weight and fast prototype electronic devices on flexible substrates using surface printing approaches. Today, different processes are used to fabricate these electronic devices such as inkjet printing, screen printing, aerosol jetting, flexography, and gravure printing.1 In the inkjet printing technique, various types of inks are deposited and patterned through micrometer jetting devices (nozzles) on to the substrate.2 The most common inkjet printing techniques are continuous (CIJ) and drop on demand (DOD) inkjet printing. The benefit of this technology is to quickly create structures for integrated circuits like patterns, lines, contacts and dots with very small dimensions. To date, common inkjet printers depend on the drop generation process, called drop on demand (DOD) inkjet printing, which is widely used in many applications, including integrated electronic components such as sensors,3 actuators, antennas,4 and solar cells.5 In this technology, the compatibility of the nanoparticle ink and the substrate is a big challenge, especially when a poor adhesive substrate is used. Additionally, controlling the behavior of the droplet is important to get uniform printed patterns. In this mode of printing, the waveform that generates droplets can be driven thermally, piezoelectrically, and electrostatically. Several studies were done before using inkjet printing to print nanosilver ink on a variety of substrates in order to create lines or other electronics devices. Xiong et al.6 used nanosilver ink to print conductive tracks with different dot spacing values on glass, polyimide, hydrophobic paper and FR4 substrates. Changjae et al.7 printed low-resistance lines of nanosilver ink on treated polyimide films. Henrik et al.8 evaluated two types of surface treatments to increase the quality of inkjet printed uniform nanosilver lines on polyimide and polyethene substrates. Chia et al.9 used a drop on demand printer to deposit lines of nanosilver ink on polyimide substrates with a drop spacing from 20 μm to 40 μm.
In inkjet technology, the jetting performance must be precisely controlled to be applicable in several applications.10 Therefore, in printed electronic devices, several engineering constraints must be excellently controlled to enhance their electrical roles such as for narrow, even, smooth and straight lines.11 Furthermore, fabricating high density integrated circuits with small features demands high resolution printing. To print stable lines using inkjet printing, individual drops are printed on a substrate so that they merge. Thus, the bead line must stay stable until it becomes a solid.12 For increasing the current capacity, printed conductive lines must be uniform and narrow width.1 Previous work considered the impact of the ink properties on drop formation instead of the impact of the waveform.13 Also, most of the above studies focused more on the treatment of the substrate to improve the quality of printing, and ignored the process of ink formation from the nozzle and the behavior of the ejected droplet on the substrate. Today, piezoelectrical drop-on-demand inkjet printing is an effective tool for deposition of microdroplets of a variety of liquids onto a surface and provides good control over ink deposition.14 The effect of the waveform on inkjet drop formation should be considered to precisely control the generated droplet from the nozzle in terms of speed, size and uniformity (no satellite or ligament). Also, the spreading behavior of the printed droplet on the surface of the substrate must be well controlled to obtain the best quality printing. Therefore, in this research paper, we focus on the effect of the waveform voltage, which deforms the shape of the piezoelectrical actuator, to generate an ideal droplet of silver nanoink (UTDAg) with maximum speed, ideal size, and uniform shape without satellites and ligaments. Then, the effect of high stage velocity deposition on the quality of printed lines and droplets printed on a polyimide substrate is characterized to print uniform conductive lines with different droplet spacing values and stage velocities.
Therefore, the main objective of this article is to find the optimal waveform voltage that generates an ideal droplet, and study the effect of high stage velocity printing on the spreading behavior of the ejected droplet on a polyimide substrate in order to increase the quality of inkjet printing. First, a Jetlab® 4xl inkjet printer produced by MicroFab Technologies with a nozzle diameter of 60 μm is used to print on the fly in script lines of silver nanoink (UTDAg) with droplet spacing 50 μm, 60 μm, 70 μm, 80 μm, 90 μm and 100 μm and stage velocity 20 mm s−1, 30 mm s−1, 40 mm s−1 and 50 mm s−1 using two different bipolar waveform voltages termed Waveform1 and Waveform2. Waveform1 was designed using a short dwell time and includes eight parameters: rise time 1, dwell time, fall time, echo time, and rise time 2, which were set to 3 μs, 23 μs, 3 μs, 10 μs and 3 μs, respectively, and idle voltage, dwell voltage and echo voltage, which were set to 0 V, 22.0 V and −22 V, respectively. Waveform2 was designed using a long dwell time and includes eight parameters: rise time 1, dwell time, fall time, echo time, and rise time 2, which were set to 5 μs, 33 μs, 8 μs, 40 μs and 35 μs, respectively, and idle voltage, dwell voltage and echo voltage, which were set to 0 V, 24.0 V and −24 V, respectively. Second, to check the spreading behavior of an individual printed droplet on the polyimide substrate, four lines were printed at the same time using the same jetting parameters with droplet spacing 250 μm and stage velocity 20 mm s−1, 30 mm s−1, 40, mm s−1 and 50 mm s−1 respectively. All printed lines were cured in an oven at 140 °C for one hour. Since the lines printed using Waveform2 with droplet spacing 50 μm, 60 μm, 70 μm, 80 μm, 90 μm, and 100 μm and a 50 mm s−1 stage velocity are uniform and have the best quality printing, the profile thickness of these lines was scanned at three different locations to measure the average width and thickness. Also, we measured the areas of individual printed droplets with droplet spacing 250 μm and stage velocity 20 mm s−1, 30 mm s−1, 40, mm s−1 and 50 mm s−1 to investigate how the droplet spreads on the polyimide substrate until it reaches its equilibrium. Finally, the resistances of the printed line using Waveform2 with droplet spacing 100 μm and stage velocity 50 mm s−1 were measured at curing temperatures 140 °C and 160 °C.
2 The effects of waveform voltage on droplet formation
The waveform shape has a large influence on the droplet dispensing process, and controlling the speed and the size of the ejected droplets.14 For best quality printing, droplet formation must be controlled to generate ideal droplets without satellites and ligaments. To achieve this, either we modify ink properties such as the viscosity and surface tension or modify the waveform voltage that drives the jetting device to control inkjet microdrop formation.15–17 Note that a high viscosity ink requires a high voltage to generate the drops from the nozzle. Also, the weight and the velocity of the generated drops are lower for a high viscosity ink. These characteristics dampen the acoustic waves that create satellites with the drops and the drops ejected from the nozzle become more stable.18 The Jetlab® 4xl inkjet printer with a 60 μm jetting device assembly shown in Fig. 1 offers three types of waveform voltages to control the ink formation: bipolar (standard wave), unipolar (multiwave), and sine wave.19 In this work, a bipolar waveform was used to control the droplet formation of silver nanoink (UTDAg). Eight jetting parameters including five time periods “Rise”, “Dwell”, “Fall”, Echo” and “Final rise” and three voltage levels “Idle”, “Dwell” and “Echo” should be determined properly at the effective frequency to design this waveform. As shown in Fig. 2 the bipolar waveform voltage consists of two square wave pulses sequentially positive and negative with a long idle time level. The high difference between the positive and negative voltage was produced as a solution to avoid pushing the voltage to a high value, especially when a high viscosity ink is used that needs a high voltage to generate and eject the droplet. The negative part of the bipolar waveform works as suction to withdraw the residual pressure to suppress generated satellites and ligaments which resulted from the remaining fluid pressure.15,20 The positive part affects the generated pressure waves from the rising and falling sections on droplet formation based on the relationship between the dwell time and dwell efficient. The dwell efficient is a dwell time that increases the velocity of the generated droplet. The dwell time changes the phase pressure waves, and the difference between the dwell time and dwell efficient influences the jetting behavior due to a slight out of phase pressure wave.13 It ought to be noticed that when the voltage increased from zero to the maximum level at the rising time, the piezoelectric actuators expand, creating a negative pressure wave, and when the voltage decreases from a high level to zero at the falling time, the piezoelectric actuators contract, creating a positive pressure wave.21 To understand the relationship between the dwell time and the dwell efficient, three cases should be explained as shown in Fig. 3(a)–(c). In case (a): when the dwell time is shorter than the dwell efficient, a positive pressure wave is generated from the falling section. This wave represents the maximum pressure that reaches the actuator first followed by the minimum pressure generated from the rising section. Note that the generated droplet consists of two parts as shown in Fig. 3(a). The first part represents the main drop, which is affected more by the maximum positive pressure, and probably has a high speed. The second part of the droplet represents the satellite, which is influenced more by the minimum pressure generated from the rising time, and thus it will have a low speed. In this case, merging between the main droplet and satellite cannot happen, so this case is not perfect for printing. In case (b) when the dwell time is equal to the dwell efficient, both generated pressure waves reach the piezoelectrical actuator at the same time so the pressure will maximize and the generated droplet will be uniform and has a high jetting speed. Thus, this case is considered perfect for printing, but it is amplified. In case (c) when the dwell time is longer than the dwell efficient, the negative pressure wave generated from the rising time reaches the actuator first followed by the stronger pressure from the falling time. Therefore, the main drop will be affected more by the minimum pressure wave. Thus, it has a lower jetting speed and the satellite has a faster speed because it is affected more by the maximum pressure. In this case, merging happens between the main droplet and the satellite to form one droplet, so increased dwell time will increase the size of the generated droplet. This case is considered an effective case for printing because it prevents satellites and ligaments from happening.
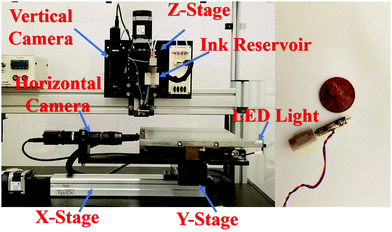 |
| | Fig. 1 Jetlab® 4xl with a 60 μm jetting device assembly. | |
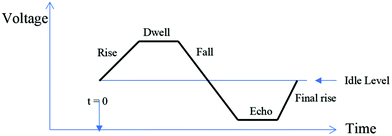 |
| | Fig. 2 Bipolar waveform shape parameters to generate the desired droplet. | |
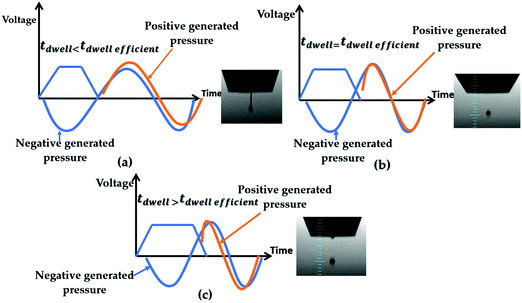 |
| | Fig. 3 Dwell time effect on generated droplets. (a) The dwell time is shorter than the dwell efficient. (b) The dwell time is equal to the dwell efficient. (c) The dwell time is longer than the dwell efficient. | |
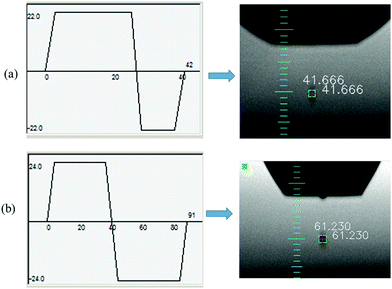 |
| | Fig. 4 Jetting parameters to generate (a) Waveform1 and (b) Waveform2. | |
3 Materials and sample preparation
3.1 Materials
The silver nanoink (UTDAg) produced by UTDots Inc is based on silver nanoparticles. The ink has particle size 10 nm, 25–60% nanosilver concentration and 11 cP viscosity. The bulk resistivity of the silver nanoink is 10 μΩ cm when sintered at 120 °C for 60 minutes. The sintering temperature of the ink is low as compared with other types of ink. The polyimide substrate used in this case is a Kapton sheet delivered by Fortex Engineering Ltd. UK that has dimensions 6′′ W × 6′′ L × 0.005′′ thickness. Isopropyl alcohol was used to clean the surface of the polyimide substrate because it has no effect on the surface properties.22
3.2 Inkjet printer (Jetlab® 4xl)
The Jetlab program is used to control the Jetlab® 4xl print station, which is produced by MicroFab Technologies. The printer has a microjet jetting device which was developed by Microfab as well and operated with three motion stages X, Y and Z. The X–Y stage carries the platform with printable area 210 × 260 mm, the horizontal observation camera, waste bucket and the LED light. The stage Z carries the jetting device, which has an orifice diameter of 60 μm, the vertical or inspection camera and the ink reservoir. Also, it is used to control the height of the print head regarding the substrate. The vertical camera is used to select the desired spot on the substrate for printing, and movement occurs by clicking the joystick off button in the motion tab and using the simulated joystick (which uses a mouse to move the vertical camera in the X and Y directions). The horizontal or observation camera is mounted on the Y axis and placed horizontally on the same line with a jetting device tip and a strobe light to control the drop formation. Thus, strobed illumination is required to freeze the drop image and estimate its velocity as well.19 At the maintenance position, first the reservoir was filled with distilled water and this was ejected by increasing the pressure manually to more than 800 mmHg to make sure that the nozzle is clean and not clogged. Then, we filled the reservoir with silver nanoparticle ink and set up the pressure manually to a positive value of about 24 mmHg to make sure the ink is running out of the nozzle. Finally, the pressure is lowered to a negative value to overcome the pressure and stop running the ink out of the nozzle and start generating and controlling the droplet formation by adjusting the jetting parameters and frequency from the jet setup and the pressure manually. The negative pressure here is used to maintain the ink flushing at the orifice face of the nozzle because without flushing the piezoelectric actuator will not be able to jet the ink due to the low energy.23
Two methods of printing can be used in the Jetlab® 4xl, printing on position and printing on the fly. In printing on position, stopping is necessary at each single spot location before jetting the droplets and multiple droplets can be dispensed onto the desired spot, so the time of printing will be longer. In this work, we used printing on the fly in script, which is controlled by the command “set fly” to control the velocity of the x–y stages, which were utilized for flight passes. The printing code is written by the user and read by the Jetlab program and edited by Notepad or WordPad.
3.3 Printing of conductive lines
Two bipolar waveforms (standard wave) are created to control the generated droplet from a 60 μm nozzle to print lines onto the polyimide substrate with different droplet spacing and different stage velocity. Waveform1 is designed by setting up the jetting parameters as follows: dwell time 23 μs, positive/negative voltage 22 V and total length 42 μs as shown in Fig. 4(a) at frequency 480 Hz and backpressure −18 mmHg. Waveform2 is designed by setting up the jetting parameters including dwell time 33 μs, positive/negative voltage 24 V and total length 91 μs as shown in Fig. 4(b) at frequency 600 Hz and backpressure −14 mmHg. Note that the jetting parameters must be determined at the effective frequency.19 In the Jetlab® 4 printer, to adjust the size and the velocity of the generated droplet, two digital pulses are required. The main pulse was used as a trigger signal for jetting and the second signal (strobe pulse), which was triggered from the main pulse, was used to control the LED light.13 The relative timing between the strobe pulse and the main pulse is different due to the delay between the two signals and since the duration of the second pulse is fixed above 5 μs. This causes the droplet falling from the nozzle to be frozen in the view of the observation camera. The observation camera includes a vertical scale about 41.66 μm between two tick marks to visually estimate the droplet velocity by observing the position of the droplet on the scale. The velocity of the generated droplet from Waveform1 and 2 was estimated to be 1.25 m s−1 and 1.56 m s−1 respectively by using eqn (1) and the size of the generated droplet was measured to be 41.666 μm and 61.23 μm by using the Open CV method developed in previous work based on edge detection of the generated droplet.24 The best strategy to generate a good pulse shape is to focus more on the dwell time and dwell voltage and decreasing the dwell voltage can help to prevent satellites and ligaments. Therefore, on increasing the dwell voltage above 22 V and 24 V for the two waveforms, satellites appear.| |  | (1) |
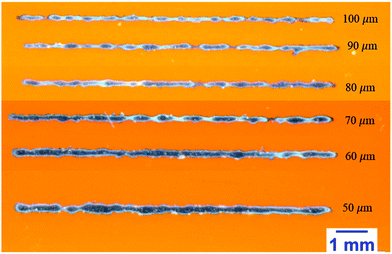 |
| | Fig. 5 Printed lines on polyimide using Waveform1 at stage velocity 20 mm s−1 and drop spacing 50 μm, 60 μm, 70 μm, 80 μm, 90 μm and 100 μm. | |
By using the two waveforms and jetting parameters mentioned above, lines were printed on the polyimide substrate at six different droplet spacings and four different X–Y stage velocities; the data in Table 1 show the droplet spacing size and the frequency of the six lines printed at 20 mm s−1 stage velocity. Note that the frequency utilized by the jet controller is calculated by dividing the stage velocity by the step size. Then, Waveform2 is used to print four lines at 250 μm and different X–Y stage velocities including 20 mm s−1, 30 mm s−1, 40 mm s−1 and 50 mm s−1. Every one of these lines is made single pass and fly in script mode with single burst is used to print all lines. Before the printing process, isopropyl alcohol and air drying were used to clean the substrate.
Table 1 The parameters of the six lines printed on the polyimide substrate at 20 mm s−1 using two waveforms
| Line no |
Droplet spacing size (μm) |
Frequency (Hz) |
| 1 |
50 |
400 |
| 2 |
60 |
333.3 |
| 3 |
70 |
285.7 |
| 4 |
80 |
250 |
| 5 |
90 |
222.2 |
| 6 |
100 |
200 |
4 Results and discussion
A Wild M400 photomicroscope connected to a desktop computer is used to capture the optical micrograph of the printed lines. Fig. 5–7 show optical microscope images of the six lines printed on a polyimide substrate without any surface treatment using Waveform1 at a stage velocity of 20 mm s−1, 30 mm s−1, and 40 mm s−1, and a drop spacing of 50 μm, 60 μm, 70 μm, 80 μm, 90 μm, and 100 μm upward, respectively. All printed lines were cured in the lab oven at 140 °C for one hour and have 10 mm length. In Fig. 5 and 6, the lines printed at stage velocity 20 mm s−1 and 30 mm s−1 and droplet spacing 50 to 100 μm with an increment of 10 μm show more instability. The instability happened because printing lines at low stage velocity makes the droplet contact angle with the substrate larger than the advanced angle. It is known that when the droplet contact angle with the substrate is larger than the advanced angle, printed lines become unstable because the droplet takes more time to spread on the substrate until reaches its equilibrium.25 As shown in Fig. 7, when the stage velocity increased to 40 mm s−1 and the droplet spacing increased, the printed lines become more stable. We conclude that the contact angle is a function of the substrate velocity and printing lines at a stage velocity below the critical stage velocity makes the lines unstable.12 Also, the steady line width is demonstrated to be limited by two conditions, the maximum and minimum droplet spacing. The maximum droplet spacing decreases the printed line width and increases the line stability, while the minimum droplet spacing increases the printed line width and increases the line instability due to bulging.
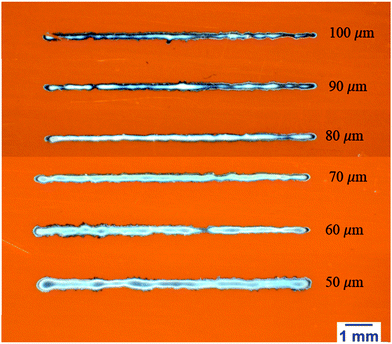 |
| | Fig. 6 Printed lines on polyimide using Waveform1 at stage velocity 30 mm s−1 and drop spacing 50 μm, 60 μm, 70 μm, 80 μm, 90 μm and 100 μm. | |
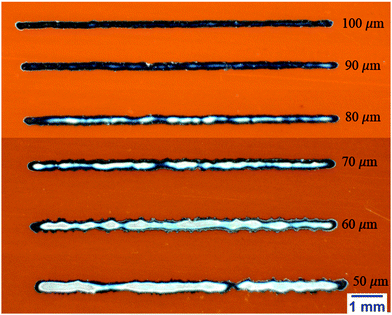 |
| | Fig. 7 Printed lines on polyimide using Waveform1 at stage velocity 40 mm s−1 and drop spacing 50 μm, 60 μm, 70 μm, 80 μm, 90 μm and 100 μm. | |
Fig. 8(a) and (b), Fig. 9(a) and (b), Fig. 10(a) and (b) and Fig. 11(a) and (b) show optical microscope images of six lines printed on a polyimide substrate using Waveform2 at a stage velocity of 20 mm s−1, 30 mm s−1, 40 mm s−1, and 50 mm s−1 and a drop spacing of 50 μm, 60 μm, 70 μm, 80 μm, 90 μm, and 100 μm upward, respectively. Fig. 9(a) and (b) show unstable lines with splashing printed at a stage velocity of 20 mm s−1 and a drop spacing of 50 μm, 60 μm, 70 μm, 80 μm and 90 μm. For the same reason mentioned for Waveform1, the lines printed using Waveform2 and 20 mm s−1 stage velocity become unstable. Furthermore, the splashing instability occurred26 and increased in the lines especially with small droplet spacing because the size of the droplet generated from Waveform2 is larger. Thus, the spread time of the printed droplet on the substrate will be longer until the droplet reaches its equilibrium, and the splashing in the printed line decreased by increasing the droplet spacing to 100 μm. In Fig. 9(a) and (b) and Fig. 10(a) and (b), the printed lines with a drop spacing of 50 μm, 60 μm, 70 μm, and 80 μm and stage velocity 30 mm s−1 and 40 mm s−1 remain unstable and splashing happens although the contact angle decreases, because when the droplet is large, the spreading process of the ejected droplet on the substrate is affected by an oscillation process, which dissipates the droplet energy before it is steady in the final shape. The splashing in the printed lines decreases by increasing the droplet spacing to 90 μm and 100 μm as shown in Fig. 9(a) and (b) and Fig. 10(a) and (b). Increasing the stage velocity to 50 mm s−1 with a drop spacing of 50 μm, 60 μm, 70 μm, 80 μm, 90 μm, and 100 μm makes the printed lines stable and even as shown in Fig. 11(a) and (b) because the contact angle becomes smaller so the spreading process of the printed droplet becomes more stable until it reaches its equilibrium. Increasing the droplet spacing to 80 μm, 90 μm, and 100 μm with 50 mm s−1 stage velocity makes the printed lines sharp and uniform as shown in Fig. 11(b) because the stability and uniformity of the printed line bead can be controlled by two limiting factors: the droplet spacing and the printer stage velocity.12 To validate our claim regarding the spreading behavior of printed droplets on a polyimide substrate at different stage velocities, lines printed using Waveform2 with droplet spacing 250 μm and stage velocity 20 mm s−1, 30 mm s−1, 40 mm s−1 and 50 mm s−1 are shown in Fig. 12. It was observed that at stage velocity 20 mm s−1, the droplets are connected to each other and there is no gap between them, and a gap appeared in the line printed at 30 mm s−1 stage velocity and increased with increasing the stage velocity to 40 mm s−1 and at 50 mm s−1 the printed droplets are almost completely separated. The area of the printed droplets was measured as shown in Fig. 13 and was found to be 43202.87 μm2, 36982.74 μm2, 31141.02 μm2 and 30011.91 μm2 at stage velocity 20 mm s−1, 30 mm s−1, 40 mm s−1 and 50 mm s−1 respectively. A DektakXT profilometer by Bruker was utilized to scan the printed lines as shown in Fig. 11(a) and (b). A typical width direction profile is shown in Fig. 14 for the line in Fig. 11(b), which was printed at stage velocity 50 mm s−1 and spacing 100 μm. The profilometer data were used to compute the average thickness and the width of the line. Both the average thickness and width decrease when the droplet spacing increases with maximum standard deviation 15 nm and 22.1 μm, respectively (Fig. 15). For example, the line at 50 μm droplet spacing shown in Fig. 11(a) has an average width of about 583.6 μm and average thickness 405 nm and both decrease to 353 μm and 220 nm, respectively, at 100 μm droplet spacing. Since the line printed by using Waveform2 with droplet spacing 100 μm and stage velocity 50 mm s−1 represents the best printed line, the printed lines were cured at 140 °C and 160 °C and the resistance was determined to be 7.5 and 4.9 Ohm, respectively. The resistance of the printed lines goes down by increasing the curing temperature, because at high curing temperature the amount of binder material left within the conductive particles of the ink will be less so the contact area between the nanoparticles will increase and the resistance will decrease.
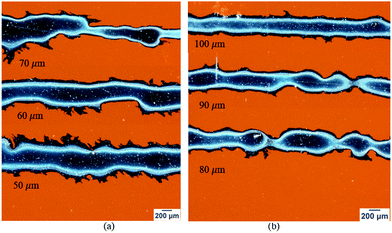 |
| | Fig. 8 Printed lines on the polyimide substrate using Waveform2 at stage velocity 20 mm s−1: (a) drop spacing 50 μm, 60 μm and 70 μm and (b) drop spacing 80 μm, 90 μm and 100 μm. | |
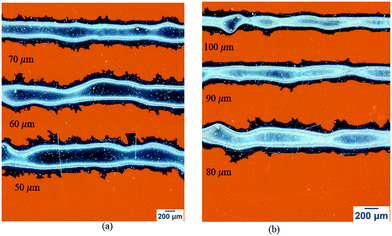 |
| | Fig. 9 Printed lines on the polyimide substrate using Waveform2 at stage velocity 30 mm s−1: (a) drop spacing 50 μm, 60 μm and 70 μm and (b) drop spacing 80 μm, 90 μm and 100 μm. | |
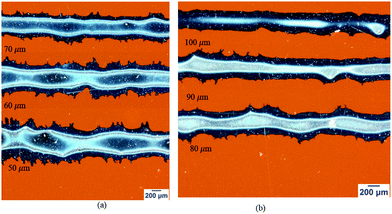 |
| | Fig. 10 Printed lines on the polyimide substrate using Waveform2 at stage velocity 40 mm s−1: (a) drop spacing 50 μm, 60 μm and 70 μm and (b) drop spacing 80 μm, 90 μm and 100 μm. | |
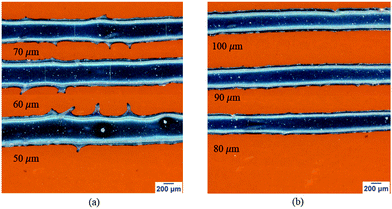 |
| | Fig. 11 Printed lines on the polyimide substrate using Waveform2 at stage velocity 50 mm s−1: (a) drop spacing 50 μm, 60 μm and 70 μm and (b) drop spacing 80 μm, 90 μm and 100 μm. | |
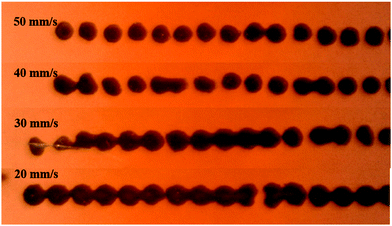 |
| | Fig. 12 Printed lines at drop spacing 250 μm and stage velocity 20 mm s−1, 30 mm s−1, 40 mm s−1 and 50 mm s−1. | |
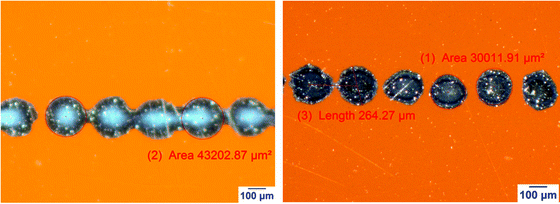 |
| | Fig. 13 Measured area of the printed lines at drop spacing 250 μm and stage velocity (a) 20 mm s−1, and (b) 50 mm s−1. | |
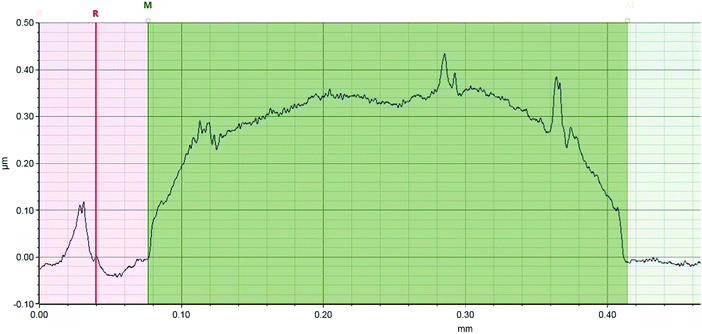 |
| | Fig. 14 Profile of a single layer line printed using Waveform2 with drop spacing 100 μm and 50 mm s−1 stage velocity showing average thickness 220 nm and average width 353 μm. | |
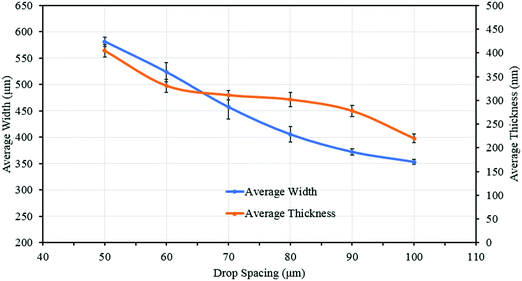 |
| | Fig. 15 The average width and thickness of printed lines using Waveform2 at stage velocity 50 mm s−1 and drop spacing 50 μm, 60 μm, 70 μm, 80 μm, 90 μm and 100 μm, respectively. | |
5 Conclusions
In this research paper, a Jetlab® 4xl print station controlled by the Jetlab program is used to print lines of highly conductive silver nanoparticle ink (UTDAg) on polyimide using two bipolar waveform voltages using different jetting parameters. The waveform voltage has a significant effect on the generated droplets from the nozzle such as on the drop velocity. Using a long dwell time leads to an increase in the size and the velocity of the generated droplets when compared with a short dwell time. The printed lines show more stability when the stage velocity is increased because it leads to lower contact angles of the printed droplets with the substrate and they take less time to spread on the substrate. The average width and thickness of the printed lines decrease with increasing drop spacing. Additionally, the conductivity of the printed lines increases as the curing temperature is increased because the amount of binder material left after curing will be lower at higher curing temperature, resulting in a higher contact area between the nanoparticles.
Conflicts of interest
There are no conflicts to declare.
References
- A. Mahajan, C. Daniel Frisbie and L. F. Francis, Optimization of aerosol jet printing for high-resolution, high-aspect ratio silver lines, ACS Appl. Mater. Interfaces, 2013, 5(11), 4856–4864 CrossRef CAS PubMed.
- F. Hoeng, Inkjet printing of nanocellulose – silver ink onto nanocellulose coated cardboard, RSC Adv., 2017, 7, 15372–15381 RSC.
- M. D. Dankoco, G. Y. Tesfay, E. Benevent and M. Bendahan, Temperature sensor realized by inkjet printing process on flexible substrate, Mater. Sci. Eng., B, 2016, 205, 1–5 CrossRef CAS.
- L. Yang,
et al., RFID Tag and RF Structures on a Paper Substrate Using Inkjet-Printing Technology, IEEE Trans. Microwave Theory Tech., 2007, 55(12), 2894–2901 Search PubMed.
- Y. Jang, I. Tambunan and D. Byun, Non-contact printing of high aspect ratio Ag electrodes for polycrystalline silicone solar cell with electrohydrodynamic jet printing Non-contact printing of high aspect ratio Ag electrodes for polycrystalline silicone solar cell with electrohydrodynamic, Appl. Phys. Lett., 2013, 1–6 Search PubMed.
-
Z. Xiong and C. Liu, Effect of Substrates Surface Condition on the Morphology of Silver Patterns Formed by Inkjet Printing, 18th Eur. Microelectron. Packag. Conf., pp. 1–4.
- C. Kim,
et al., Inkjet-printed lines with well-defined morphologies and low electrical resistance on repellent pore-structured polyimide films, ACS Appl. Mater. Interfaces, 2012, 4(4), 2168–2173 CrossRef CAS PubMed.
- H. Andersson,
et al., Evaluation of Coatings Applied to Flexible Substrates to Enhance Quality of Ink Jet Printed Silver Nano-Particle Structures, IEEE Trans. Compon., Packag., Manuf. Technol., 2012, 2(2), 342–348 CAS.
-
C. Chan, K. Shih and T. Huang, Inkjet Printing of Nano-Silver Conductive Lines on Polyimide Substrates, 2016 11th Int. Microsystems, Packag. Assem. Circuits Technol. Conf., 2016, pp. 115–118.
- K. Kwon, Waveform Design Methods for Piezo Inkjet Dispensers Based on Measured Meniscus Motion, J. Microelectromech. Syst., 2009, 18(5), 1118–1125 Search PubMed.
- D. Soltman and V. Subramanian, Inkjet-Printed Line Morphologies and Temperature Control of the Coffee Ring Effect, Langmuir, 2008, 24(5), 2224–2231 CrossRef CAS PubMed.
- J. Stringer and B. Derby, Formation and Stability of Lines Produced by Inkjet Printing, Langmuir, 2010, 26(6), 10365–10372 CrossRef CAS PubMed.
- K. Kwon and D. Lee, Experimental analysis of waveform effects on satellite and ligament behavior via in situ measurement of the drop-on-demand drop formation curve and the instantaneous jetting speed curve, J. Micromech. Microeng., 2010, 20(11), 115005 CrossRef.
- E. L. Holthoff, M. E. Hankus and P. M. Pellegrino, Investigating a Drop-on-Demand Microdispenser for Standardized Sample Preparation, Proc. SPIE, 2011, 8018, 80181F CrossRef.
- H. Y. Gan, X. Shan, T. Eriksson, B. K. Lok and Y. C. Lam, Reduction of droplet volume by controlling actuating waveforms in inkjet printing for micro-pattern formation, J. Micromech. Microeng., 2009, 19(5), 055010 CrossRef.
- M. H. Tsai, W. S. Hwang, H. H. Chou and P. H. Hsieh, Effects of pulse voltage on inkjet printing of a silver nanopowder suspension, Nanotechnology, 2008, 19(33), 335304 CrossRef CAS PubMed.
- M. Tsai and W. Hwang, Effects of Pulse Voltage on the Droplet Formation of Alcohol and Ethylene Glycol in a Piezoelectric Inkjet Printing Process with Bipolar Pulse, Mater. Trans., 2008, 49(2), 331–338 CrossRef CAS.
- M. Technologies, MicroFab Technote 99-02 Fluid Properties Effects on Ink-Jet Device Performance Introduction, 1999, pp. 3–6.
- Jetlab Control Program Tutorial Guide, Microfab Technologies. INC., April, 2013.
- D. Jang, D. Kim and J. Moon, Influence of Fluid Physical Properties on Ink-Jet Printability, Langmuir, 2009, 14, 2629–2635 CrossRef PubMed.
-
L. Herran, Jet Instability and Droplet Formation for Bio-Printing Applications, PhD Dissertation, 2013.
- P. Lukacs, Investigation of nano-inks’ behaviour on flexible and rigid substrates under various conditions, Circuit World, 2017, 43(1), 2–8 CrossRef.
- Microfab Tech. (2019, 05 30). Retrieved from http://www.microfab.com/a-basic-ink-jet-microdispensing-setup/basicsetup-backpressure-control.
- A. Hamad, M. Salam and A. Mian, Effect of Driving Waveform on Size and Velocity of Generated Droplets of nanosilver Ink (Smartink), Manuf. Lett., 2020, 24, 14–18 CrossRef.
- P. C. Duineveld, The stability of ink-jet printed lines of liquid with zero receding contact angle on a homogeneous substrate, J. Fluid Mech., 2003, 477, 175–200 Search PubMed.
- B. Derby, 3D Printing—Review Additive Manufacture of Ceramics Components by Inkjet Printing, Engineering, 2015, 1(1), 113–123 CrossRef CAS.
|
| This journal is © The Royal Society of Chemistry 2020 |
Click here to see how this site uses Cookies. View our privacy policy here.  Open Access Article
 *
*


