
 Open Access Article
 This Open Access Article is licensed under a Creative Commons Attribution-Non Commercial 3.0 Unported Licence
Novel SERS-based process analysis for label-free segmented flow screenings†
Alexander
Mendl
 *a,
J. Michael
Köhler
b,
Dušan
Bošković
a and
Stefan
Löbbecke
a
*a,
J. Michael
Köhler
b,
Dušan
Bošković
a and
Stefan
Löbbecke
a
aFraunhofer Institute for Chemical Technology, Pfinztal 76327, Germany. E-mail: alexander.mendl@ict.fraunhofer.de
bIlmenau University of Technology, Institute of Chemistry and Biotechnology, Germany, Ilmenau 98684, Germany
First published on 29th May 2020
Abstract
In microfluidic segmented flow processes label-free analytical techniques like surface enhanced Raman spectroscopy (SERS) can reveal the chemical composition of the individual droplet contents. The SERS system developed in this work enables a simple connection to micro segmented flow processes through miniaturization. The concept is based on the parallelization of silver/polyacrylamide composite SERS spots on a carrier plate on which the segments are deposited. The transfer of the segments allows an easy connection to existing flow processes and provides optimal conditions for Raman measurements using miniaturized spectrometers. The preparation of the SERS polymer composite was optimized in terms of the silver content in the polymer matrix to obtain a high SERS signal. The performance and long-term stability of the polymer have been successfully demonstrated. The deamination of adenine with sodium nitrite to hypoxanthine was chosen as a case study to demonstrate the capability of the novel SERS-based process analysis. A sequence of approximately one hundred segments in combination with a gradient of the nitrite concentration (0 to 0.4 mol L−1) was generated at two temperatures. The concentration of adenine and hypoxanthine were determined by using a multivariate calibration model, since the Raman spectra of both substances are overlapping. It was shown that the conversion of adenine is increased with higher nitrite concentration and temperature. A conversion of 35% was obtained at 50 °C and a conversion of 60% at 80 °C, respectively.
Introduction
In the past few years, micro segmented flow techniques have been well established in chemical and biological laboratories. A wide range of operation units and handling systems are available in order to perform experiments in very small volumes down to the picoliter scale. Basic operations like droplet generation, mixing, dosing, sorting, dilution, cultivation and incubation can be applied at that scale.1–6 The whole potential of microfluidic screening can be exploited by combining segmented flow processes with fast and reliable analytic techniques. Thus far, fluorescence and UV/vis spectroscopy are routinely used as they are easy to integrate into miniaturized flow systems and allow fast measurements. However, because of the low structural information provided by these techniques, labelling of the target molecule is generally necessary.Therefore, the development of label-free detection methods for segmented flow processes is of great interest. In certain cases mass spectrometry (MS) has been employed. Here the droplets are directly injected into an electrospray mass spectrometer either through a chip–MS interface7,8 or through a MALDI (matrix-assisted laser desorption/ionization) interface.9 The MS coupling provides structural information and good sensitivity. However, a high technological effort and a profound expertise in coupling MS with Lab on Chip systems are required which make a widespread application in chemical and biological laboratories difficult.
Another analytical technique that provides detailed structural information on the droplet content is Raman spectroscopy since every analyte has its specific Raman fingerprint, which can be used for identification. By employing surface enhanced Raman spectroscopy (SERS) the restrictions of conventional Raman spectroscopy, namely the low detection limit and sensitivity, can be overcome. Here, the Raman signal is enhanced on metal nanostructures e.g. rough metal surfaces or metal nanoparticles.10 Several different techniques have been developed using SERS in microfluidic devices,11,12 but in segmented flow processes typically colloidal nanoparticles are applied as SERS-active substrates.13–15 Good results in terms of sensitivity and throughput have been achieved. The nanoparticles are either prepared in advance or the preparation is already integrated in the chip design. Where batch fabrication requires great care, in situ generation of the nanoparticles is preferable to get reproducible results of the measurements.16 In most approaches, the Raman spectrometer must be coupled with a confocal microscope, equipped with object lenses of high numerical aperture, to gain optical access to the microchannel. This increases the technical effort and limits the flexibility with respect to the location of use. Furthermore, the typically high velocities of the segments allow only a very short time to acquire the Raman signal which can lead to poor signal-to-noise ratios at low concentrations. A longer exposure time would be helpful to overcome these restrictions. However, in order to make label free detection methods available to a broad research community, the technological effort must be significantly reduced. Therefore, the aim of this work is to develop a method for SERS measurements on segments, which allows a simple connection to existing processes and the use of miniaturized hardware.
In this work, we present a novel concept to measure the SERS spectra of microfluidic segments. The method is easy to use with any kind of microfluidic segmented flow process and provides reliable and reproducible measurements using a portable Raman spectrometer setup. A serial–parallel transfer, which in principle was previously applied for other analytical techniques,9 was combined with a silver/polyacrylamide composite (SERS polymer) which is arranged in an array of single SERS spots. Different arrays with SERS active spots have already been developed.17–20 The SERS active material is usually printed on paper or other substrates, but a connection to segmented flow applications has not been reported yet. In the process shown here, a silver containing monomer solution, previously developed by Köhler et al.21 for sensor particles, is applied to a glass substrate. UV light activated curing produces silver particles that continue to grow with the addition of silver salt and reducing agent (here referred to as silver enforcement). The so-formed SERS polymer was tailored in terms of silver content as the SERS enhancement depends highly on the aggregation and the size of the silver particles in the polymer.22,23
As a case study, the deamination of adenine to hypoxanthine was used to demonstrate the performance of the described technique. Adenine is a very important molecule which is involved in many biochemical processes e.g. energy transfer as part of adenosine triphosphate or as an essential component of DNA, RNA and various nucleosides and nucleotides.24 Modification of this molecule by chemical impact can cause a number of diseases. Consequently, the deamination of adenine has been part of many theoretical and practical studies in the past.25–27 Nitrite, for example, is intensively discussed in this context, since it is a component of pickling salt and is thus consumed by humans through their food. In general, deamination of adenine compared to other purine bases is a rather slow process that lasts up to weeks or month. The reaction can be accelerated either by increased temperature or by additional impact of a reducing agent such as sodium nitrite.28,29 Since adenine is highly sensitive to SERS enhancement,30,31 its reaction to hypoxanthine using sodium nitrite was selected as a suitable reaction to evaluate the developed SERS analytical system.
Experimental section and system design
Raman spectroscopic setup
The Raman spectroscopic setup is shown in Fig. 1A. The SERS array incorporating the SERS spots is mounted on a x-/y-stage. A transfer capillary linking the microfluidic setup with the spectroscopic analysis is mounted on a z-stage and passes a droplet detection unit. A light-emitting diode (LED) and an optical sensor are used to detect single droplets in the transfer capillary by means of the different absorption of the two immiscible liquids and reflections on the phase boundary. By starting the trigger of the droplet detection, the array is moved in order to place a SERS spot under the transfer capillary every time a segment passes the light sensor. Hence, every segment is dropped on a distinct SERS spot. After deposition and evaporation of the solvent, the recording of the Raman spectra is started. Since the method presented here provides sufficient time for the measurements and does not require a complex optical setup to focus into the channel, a miniaturized and portable Raman spectrometer from Ocean Optics Inc. (type: Ventana) is used for the measurements.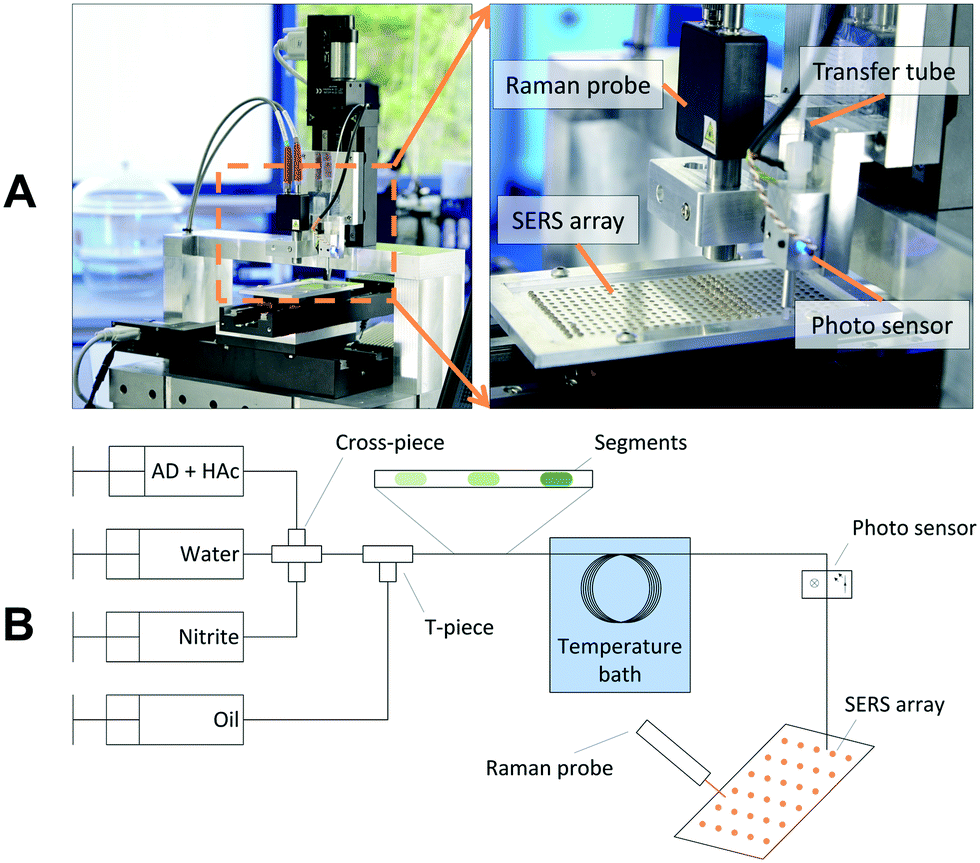 | ||
| Fig. 1 Raman spectroscopic setup. A Photograph of the setup with a detailed view on the SERS array and the detection area. B Scheme of the experimental setup used for the system evaluation. Segments containing different analyte concentrations are generated in sequence. The segments are deposited on the SERS array and analyzed spectroscopically. | ||
The resolution of this specific device was changed from 10 cm−1 to 6 cm−1 which is not mandatory for the measurements. A fiber optic Raman probe is used with a numerical aperture of 0.22 and a working distance of 11 mm. The field of view (FOV) of the Raman probe is 100 μm in diameter. The spectrometer is characterized by its large aperture diameter (f/1.3), which offers a high throughput and sensitivity. It is equipped with a holographic grating and a back thinned CCD detector (1024 pixel), the measuring range of the spectrometer is specified with 160–3200 cm−1. A 785 nm laser with an output power of 500 mW is used as excitation laser. For the measurements the laser power in the focal plane is varied between 8 mW and 15 mW.
If necessary, the recording of the spots can be repeated with different acquisition parameters in order to optimize the results. Finally, the data post processing is started. The total operational time for processing 300 droplets is less than 1.5 h with 1 h being required for solvent evaporation. A detailed description of the operational times of the individual process steps is available in the ESI.†
Preparation of the SERS array
The preparation of the SERS array starts with a glass wafer. The glass surface is coated with a silane layer, which makes the surface hydrophobic. Hydrophilic spots are generated by spatially controlled laser ablation of the hydrophobic layer. Depending on the volume of the segments to be trapped round shaped hydrophilic spots are generated with a diameter range from 1 mm to 2 mm. This allows trapping and handling of segments with a volume from 200 nL to 1500 nL. The distance between adjoining spots is between 1 and 2 mm depending on the spot size. Arrays having a size of 120 × 60 mm2 could have a total number of up to 1300 hydrophilic spots. A further reduction in spot size or spacing would lead to problems in dosing and depositing the segments. However, arrays with a higher number of spots can be realized by increasing the basic dimensions of the glass slide. The array employed in this work has 324 round shaped spots with a diameter of 2 mm. Detailed information on the wafer preparation are available in the ESI.†A polyacrylamide matrix with in situ generated silver nanoparticles is used as SERS active material. At first, a monomer mixture is prepared containing acrylamide, a crosslinker, a photoinitiator and silver nitrate. The polymer was developed and optimized for SERS sensor particles in a previous study.32 In this work, methylenebisacrylamide (BIS) was replaced by N,N′-diallyltartramide (DATD) which acts as a crosslinker, and water was replaced to some extend by diethylene glycol. The detailed polymer composition is specified in the ESI.† By using DATD instead of BIS the polymer shows a better adhesive strength to the glass surface and can be removed after usage by glycol cleavage using sodium periodate.33 Hence, the glass array can be re-used and regenerated with a new SERS polymer. The replacement of water with diethylene glycol hampers the evaporation of solvent during application of the monomer solution, otherwise the water will evaporate during application and the volume of polymer on the hydrophilic spots will not remain constant. 1.3 μL of the composite mixture is deposited onto the SERS array with the analytic system's own dosing system, which takes approximately 5 minutes. Once the mixture is dosed onto the spots, the array is cured under UV light for 10 minutes. During the UV light exposure, the photoinitiator starts the polymerization and induces the reduction of the silver nitrate, which can be observed by a yellow-brown color shift of the spots. After curing, more silver nitrate is added to generate larger silver particle aggregates on the surface of the polymer (silver enforcement).32 At first, 1.3 μL of an aqueous solution of ascorbic acid and subsequently 1.3 μL of an aqueous solution of silver nitrate is dosed to the composite polymer. During the particle growth the color of the polymer turns from brown to grey-black. The polymer is dried in an oven at 80 °C and 15 mbar for 2 h. Roughly 10 arrays can be produced in parallel, this takes about 8 h.
Experimental setup
The Experimental setup for system evaluation is schematically shown in Fig. 1B. The analyte concentration is adjusted using three syringe pumps from Cetoni GmbH (Korbussen, Germany) connected to a cross-piece mixer. In a subsequent T-piece the segmented flow pattern is formed by separating the water phase with perfluorinated oil (Novec7500 + 2% Pico-Surf™). After formation the segments are stored in a tube loop which is heated in a water bath. Subsequently, the aqueous segments are deposited on the array whereas the oil phase is not wetting the SERS polymer and evaporates very quickly. For all experiments, a droplet volume of approximately 800 nL was used. After loading, the SERS array can be analyzed by the Raman probe.A gradient of the nitrite concentration was achieved by variation of the flowrate of the nitrite syringe from 0 to 100%, while the water syringe was varied vice versa (100–0%) to maintain a constant segment volume. To calibrate the concentration inside the segments, nitrite was replaced by a dye solution (Basic Blue 3). The extinction of the dye in the segments was recorded by the integrated photo sensor. Adenine (AD) and acetic acid (HAc) were dosed from an additional syringe with constant flow rate. The applied flowrates, the gradient scheme and the calibration curves are given in the ESI.†
Materials and instruments
For cleaning and activation of the glass wafer piranha solution (1![[thin space (1/6-em)]](https://www.rsc.org/images/entities/char_2009.gif) :9 mixture of 30% hydrogen peroxide and 98% sulfuric acid) was used. The hydrophobic layer was generated with octadecyltrichlorosilane in heptane. A Coherent, Inc. Super Rapid laser was used for ablating the spot pattern on the glass surface. The laser was pulsed with 10 ps with an output power of 10 W at 1064 nm.
:9 mixture of 30% hydrogen peroxide and 98% sulfuric acid) was used. The hydrophobic layer was generated with octadecyltrichlorosilane in heptane. A Coherent, Inc. Super Rapid laser was used for ablating the spot pattern on the glass surface. The laser was pulsed with 10 ps with an output power of 10 W at 1064 nm.
The polymer used for the SERS substrate is composed of acrylamide and N,N′-diallyltartramide. The polymerization was initiated with 2-hydroxy-2-methylpropiophenone. The silver nanoparticles were formed by the reaction of silver nitrate with ascorbic acid. For the test reaction adenine and hypoxanthine were used. All chemicals were purchased from Merck KGaA and used with no further purification; double-distilled water (18 MΩ cm−1) was used for the analyte preparation. UV activation of the polymerization was done with a Dymax™ Bluewave™ 50 light source with an area output of 800 mW cm−2.
Results
Impact of silver concentration on the SERS signal
The SERS signal is highly influenced by the morphology of the silver particles, their distribution and the resulting nanogaps.23,34 Visaveliya et al. described the size and agglomeration of the silver particles as a function of the concentration of silver nitrate and ascorbic acid.32 They further described that the SERS enhancement is affected by the distribution of silver on the polymer surface. Hence, we optimized the silver content in our polymer composite to obtain a strong SERS signal. A stock solution was prepared with a silver content of 10 mM. After polymerization of the monomer mixture 1.3 μL of 200 mM ascorbic acid was dosed to the individual array spots, and subsequently 1.3 μL of silver nitrate of different concentrations ranging from 15 mM to 200 mM was added. The experiments were performed on aluminum slices, the resulting SERS spots are shown in Fig. 2A.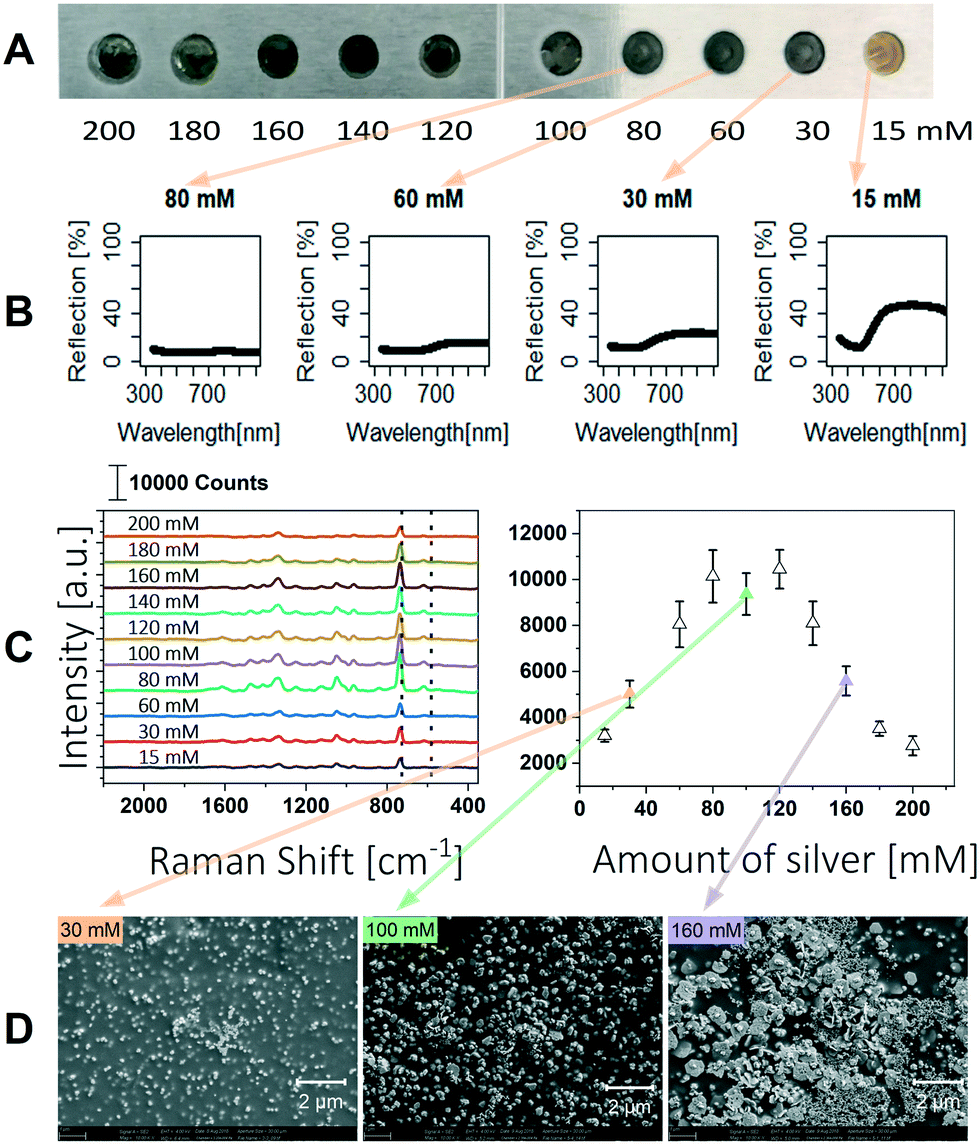 | ||
| Fig. 2 Overview of results on the adjustment of the silver content in the SERS polymer. A Photograph of the SERS polymer containing different silver concentrations (15–200 mM). The spot diameter is 2 mm. B UV/vis reflection spectra are shown for spots with silver concentrations below 100 mM. C Recorded Raman spectra of adenine obtained with the different silver concentrations. 1 μL of 100 μM adenine solution was used for analysis (left) and the Raman intensity of the adenine peak (735 cm−1) recorded as a function of silver content in the SERS composite (right). Error bars show the standard deviation of 12 spots, each measured at 5 positions. D SEM images are shown for 30 mM, 100 mM and 160 mM silver concentration. | ||
With a low silver enforcement of 15 mM the polymer appears yellow to orange and remains transparent. Higher silver concentrations let the polymer appear green to grey and the polymer is consequently less transparent. The polymer composites were characterized by UV/vis reflection spectroscopy. The setup is illustrated in the ESI.† It was shown that reflection of the polymer is decreasing with higher silver content (Fig. 2B) and the surface of the polymer is completely covered at silver nitrate concentrations higher than 80 mM. In this case all light is absorbed or scattered in the polymer.
The SERS performance of the different prepared polymers was tested using 1 μL of 100 μM adenine solution. The Raman spectrum of each spot was measured at 5 different positions and averaged. The intensities of the ring breathing mode of the adenine molecule at 735 cm−1 are shown in Fig. 2C.35 The Raman signal is rising up to a silver concentration of 80 mM, at which the surface of the polymer is completely covered with silver particles. At higher silver concentrations the Raman signal is not further enhanced which is congruent to the results of Visaveliya et al. shown for composite particles.32 A further loading of the surface with silver leads to a decreased SERS enhancement, as can be observed for silver concentrations higher than 120 mM. Additionally, SEM pictures were taken to confirm the loading of the polymer surface with silver particles (Fig. 2D). Up to a silver concentration of 100 mM the loading of particles on the surface increases, which leads to higher signal enhancement. Higher concentrations lead to an increased agglomeration of the particles and thus lower signal enhancement.23 Furthermore, it can be seen that silver particles are also inside the polymer. Because the polymer swells in aqueous media, SERS amplification can also take place here. This 3D arrangement of the particles allows more particles to be available for SERS enhancement. Best SERS enhancement was obtained using silver nitrate concentrations between 80 mM and 120 mM.
Performance of the SERS polymer
The limit of detection (LOD) and the limit of quantification (LOQ) of the SERS array were determined for adenine and hypoxanthine. Serial dilutions of the two analytes were generated and the corresponding intensity of the Raman signal was measured. The LOD is defined as the concentration at which an analyte can be detected with reasonable certainty and the LOQ is defined as the limit at which the difference between two distinct values can be reasonably discerned. They are calculated as follows:36LOD = ![[x with combining tilde]](https://www.rsc.org/images/entities/i_char_0078_0303.gif) blank + 3δblank blank + 3δblank | (1) |
| LOQ = blank + 10δblank | (2) |
blank is the mean intensity and δblank is the standard deviation of the blank measurement. Fig. 3 shows the Raman spectra and the corresponding peak intensities of the ring breathing mode of adenine and hypoxanthine in a concentration range from 5 μM to 1000 μM. Below a concentration of 100 μM a linear relationship between Raman intensity and analyte concentration can be observed. Deviations from linearity above this concentration can be explained by the insufficient number of particles providing SERS enhancement. In analytical chemistry, a calibration is reliable until it exceeds the linear range. Accordingly, the upper limit of determination for the substances tested here is between 100 μm and 500 μM. Below this concentration, a strong linear relationship can be observed between intensity and concentration with a coefficient of determination greater than 0.99. Linear regression was used to determine the LOD and LOQ according to eqn (1) and (2).
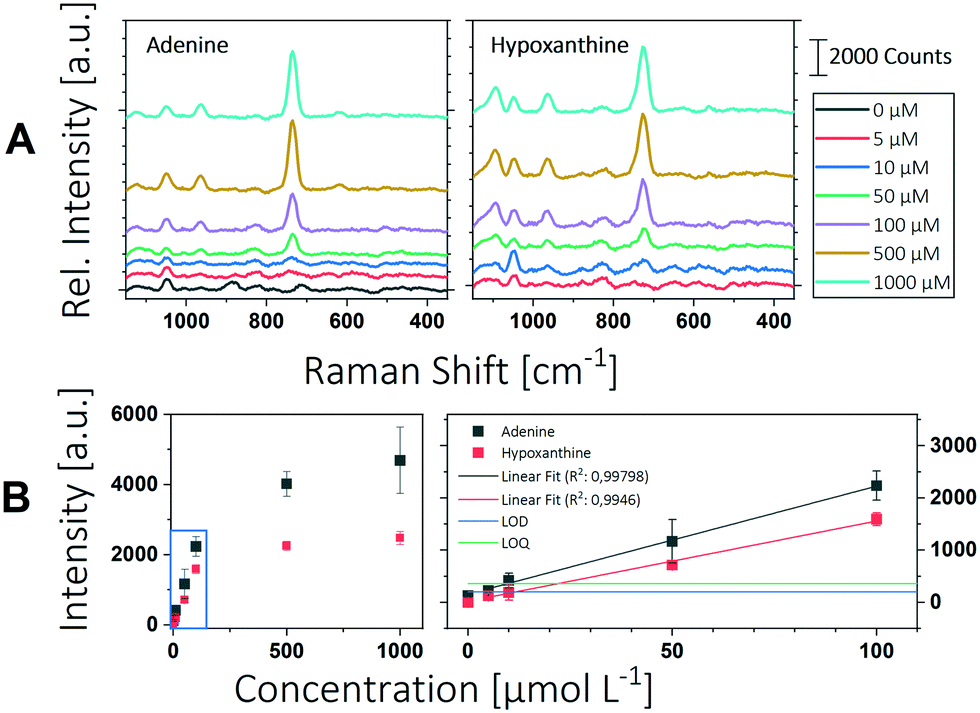 | ||
| Fig. 3 Overview of the determination of the LOD. A The measured Raman spectra of adenine and hypoxanthine at different dilution are shown. B The intensities of the respective peaks are plotted as a function of the analyte concentration. The full range is shown in the left graph; the linear range is marked by the blue box and is shown in the right graph. The LOD is shown as blue line, the LOQ as green line. The error bars show the standard deviation of 3 spots, each measured at 5 positions. | ||
The limit of detection was found to be 1.82 μM for adenine and 11.5 μM for hypoxanthine, which corresponds to 246 pg of adenine and 1.56 ng of hypoxanthine in a microfluidic segment of 1 μL. The LOQ for adenine was calculated to be 9.48 μM and for hypoxanthine 21.7 μM. Dugandžić et al. were able to reach an LOQ for adenine of 0.431 μM with batch synthesized nanoparticles and 0.0593 μM with in situ produced particles.16 This is about a factor 20 or 200 lower than with the system presented here. In both cases, however, a Raman microscope with an optimized optical setup was used, which of course has a significantly higher sensitivity. Consequently, the LOQs achieved here for the miniaturized design can be rated as good. This makes the system particularly suitable for a wide range of applications in the field of micro reaction technology and chemical reaction screening.
Furthermore, the long-term performance of the SERS array was tested using 1 μL of 100 μM adenine solution. Over 180 days new spots of the same array were measured with a freshly prepared analyte solution. The measured intensities of the ring breathing mode of the adenine molecule at 735 cm−1 are shown in the ESI.† During the test period the array was stored in a sealed LDPE bag at room temperature cut off from light. There is no significant decrease in intensity over the test period, which guaranties stable measurements over such long period. Facing the repeatability of the SERS array, the relative standard deviation (RSD) was calculated based on a standard method.37 The spot to spot repeatability was derived from 45 spots and turned out to have a RSD of 22.7%. A RSD of 12.9% was calculated within a single spot, here the RSD of 5 positions within the spot was averaged over 45 spots. However, comparable techniques which also employ self-assembling nanoparticles usually achieve a reproducibility in the range of 10 to 30%.38–40 The reason for the rather scant reproducibility is mainly the non-uniform distribution of nanoparticle clusters generated during the self-assembling process. For comparison, a reproducibility in the range of 5% is reported for conventionally prepared SERS substrates having very uniform size and gap distances of silver nanoclusters.41
Deamination of adenine
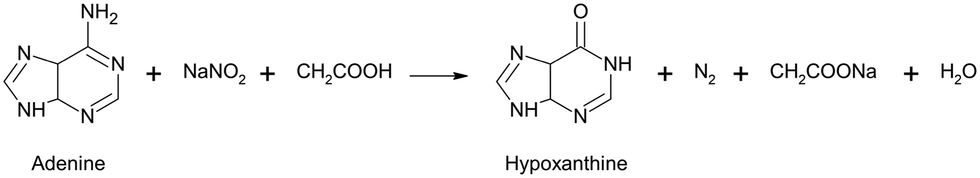
The conversion of adenine to hypoxanthine by deamination is normally very slow, but this process can be accelerated at increased temperature and by the addition of nitrite. Therefore, the investigation of these two impacts was chosen as a test scenario for the evaluation of the developed analytical system. Here, the deamination of adenine to hypoxanthine was performed using sodium nitrite according to the reaction scheme:The conversion of adenine to hypoxanthine induces a lower frequency shift of the ring breathing mode from 735 cm−1 to 721 cm−1 (see ESI†).
Quantification of the adenine and hypoxanthine concentrations was done by multivariate calibration applying a partial least squares regression (PLSR). For this purpose, a sequence of microfluidic segments with different mixtures of pure adenine and hypoxanthine was processed and measured in the setup. For data processing and calibration, the software Unscrambler® (Camo Analytics) was used. Different methods of data processing are shown in the ESI.† Using a baseline correction and a standard normal variate (SNV) algorithm showed the best results. Due to the normalization the calibration is only effected by means of the peak shift. This allows a good calibration even at higher concentrations. The outputs of the principal component analysis are shown in Fig. 4.
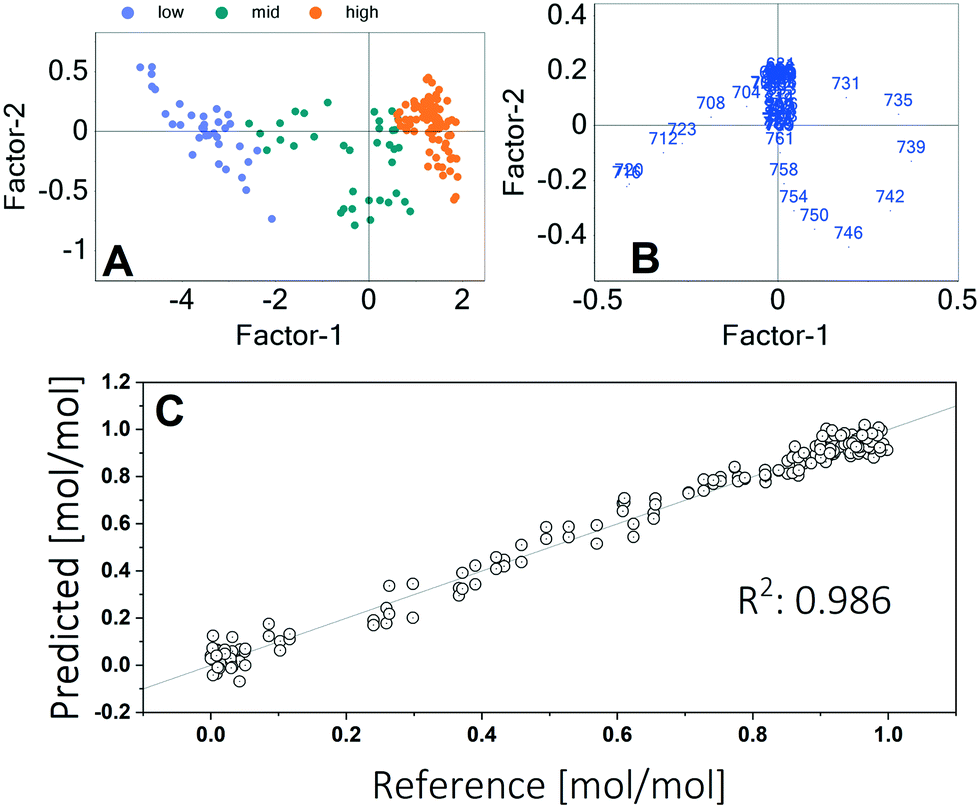 | ||
| Fig. 4 Results of the PLSR. A Score plot with sample grouping according to the adenine concentration B Loadings plot with wavenumbers in cm−1 shown as point labels. C Calibration of the adenine concentration using multivariate calibration (2 factors used). The reference is a straight line with a slope of 1. | ||
The score plot shows that the concentration of adenine is mainly (93%) described by the first factor. The second factor explains further 3% of the variance. The loadings plot indicates that the intensities in the wavelengths range between 700 cm−1 and 760 cm−1 have the highest influence. This is the range of the two peak maxima. A goodness of fit of 0.986 was achieved. The calibration using two factors is shown in Fig. 4C.
For the experiments, segments were generated with a gradient of nitrite concentration between 0 and 0.4 M. Furthermore, the segments contained a constant concentration of adenine (1 mM) and acetic acid (0.7 M). The contents of the individual syringes and their flows are specified in the ESI.† The setup described in the Experimental section was used to generate a sequence of 100 segments having 800 nL volume each. The segments were stored for 2 h in the tube loop. Experiments were conducted at 50 °C and 80 °C. The obtained spectra are shown in Fig. 5A and B.
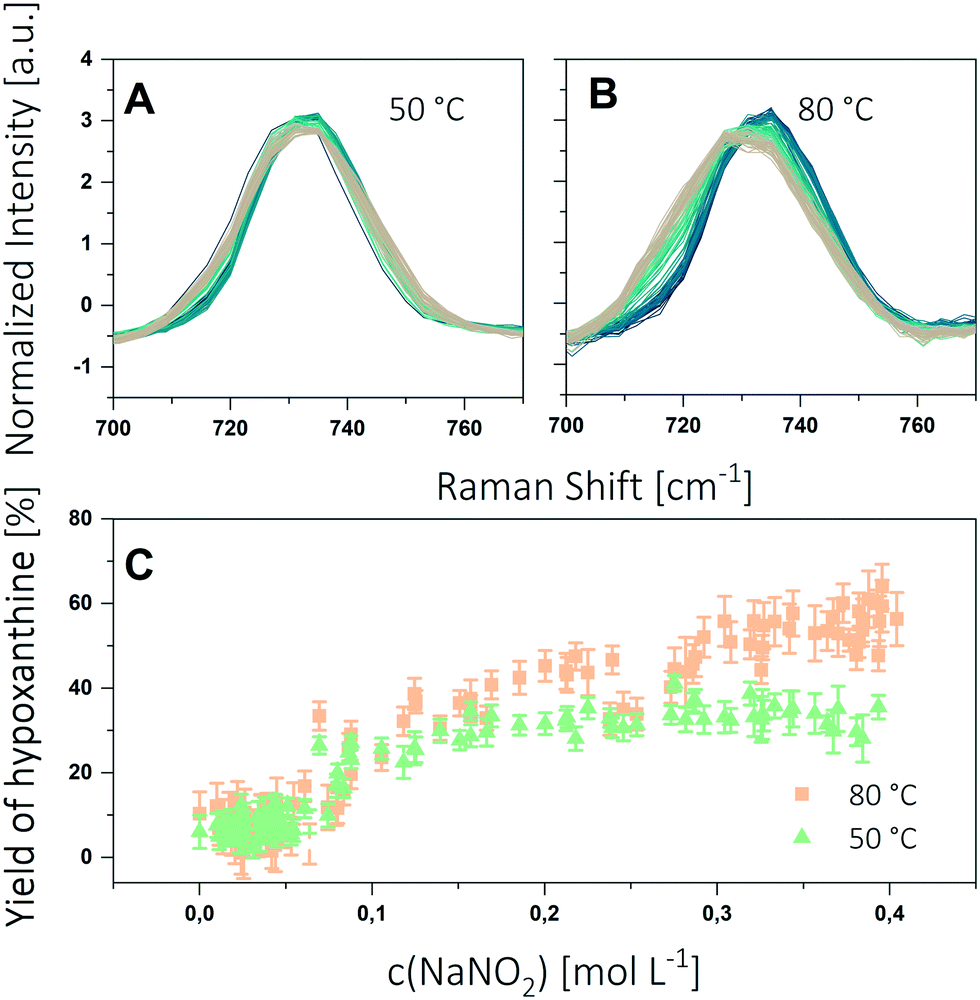 | ||
| Fig. 5 Results of the deamination experiments by means of corrected (baseline, SNV) Raman spectra of the ongoing deamination of adenine obtained from microfluidic segments at 50 °C (A) and 80 °C (B). The colour scale shows the evolution of the Raman peak with increasing nitrite content (blue to brown). C Yield of hypoxanthine at different nitrite concentrations and temperatures (100 segments). The error bars show the standard deviation of 5 repeated measurements of each segment. | ||
The Raman spectra show a widening and a shift of the peak maximum, both being more distinct at 80 °C. The spectra were then evaluated by applying the calibration procedure described above. The yield of hypoxanthine as function of the nitrite concentration is shown in Fig. 5C. Each SERS spot was measured at 5 positions and averaged. As expected, the concentration profiles show clearly the influence of both the nitrite concentration and the temperature on the reaction progress. With increasing nitrite concentration the yield of hypoxanthine reaches a maximum. By increasing the reaction temperature the maximum yield can be raised from 35% at 50 °C to 60% at 80 °C.
Conclusion
The analytical system described here allows the adaption of surface enhanced Raman spectroscopy to microfluidic segmented flow screening applications. Single fluidic segments with volumes in the range of 200 nL to 1500 nL are transferred from a microfluidic device to an array containing SERS-active measuring spots. The SERS array could be easily prepared with the system's own dosing system. Storage of the SERS array is possible over more than 180 days. The silver nanoparticle containing polymer used as SERS substrate was optimized in terms of silver content to achieve best Raman signal enhancement. It was shown that the SERS enhancement increases until the polymer surface is fully covered by silver nanoparticles, further increasing of the silver content has a negative influence on the SERS enhancement. A good reproducibility of Raman signals was achieved whereas the spot to spot deviation is higher (22.7%) than the deviation within the single spots (12.9%).The limit of quantification (LOQ) was found to be 9.48 μM for adenine and 21,7 μM for hypoxanthine. This is higher than what is reported by other groups for SERS applications, but a good result with regard to the use of miniaturized spectrometer equipment. A quantitative determination using the peak intensities with very good accuracy can be performed in case of adenine and hypoxanthine up to 100 μM.
To demonstrate the performance of the microfluidic SERS setup presented here, the deamination of adenine to hypoxanthine was investigated as a test reaction. Multivariate calibration was used to determine adenine and hypoxanthine concentrations in the microfluidic segments. Since the peak shift and not the peak intensity was used as variable, a good calibration with high accuracy could be achieved in this case even for higher concentrations (1 mM). Under the given experimental conditions, a 35% conversion of adenine to hypoxanthine at 50 °C and a 60% conversion at 80 °C were determined at the SERS array. Thus, it was shown that the developed system is suitable for the label-free detection of chemical modifications in micro segmented flow screenings which offers a wide range of applications in biological and chemical screening, e.g. to monitor the consumption of reagents or the detection and quantification of target molecules.
Author contributions
A. M., D. B., S. L. and J. M. K. conceived the idea and conceptualized the study. A. M. performed the experiments and wrote the original draft manuscript. All contributed in the review and editing process and all offered intellectual inputs.Conflicts of interest
There are no conflicts to declare.Acknowledgements
We thank the German Ministry of Education and Research BMBF for funding the project BactoCat (031A161A). We are also grateful to Steffen Schneider for the help during software development and to Nikunjkumar Visaveliya for helpful discussions concerning the SERS polymer.Notes and references
- M. Seo, C. Paquet, Z. Nie, S. Xu and E. Kumacheva, Soft Matter, 2007, 3(8), 986 RSC.
- E. Y. Basova and F. Foret, Analyst, 2015, 140(1), 22 RSC.
- R. L. Hartman, H. R. Sahoo, B. C. Yen and K. F. Jensen, Lab Chip, 2009, 9(13), 1843 RSC.
- K. Martin, T. Henkel, V. Baier, A. Grodrian, T. Schön, M. Roth, J. Michael Köhler and J. Metze, Lab Chip, 2003, 3, 202 RSC.
- J. M. Köhler, T. Henkel, A. Grodrian, T. Kirner, M. Roth, K. Martin and J. Metze, Chem. Eng. J., 2004, 101(1–3), 201 CrossRef.
- A. Funfak, J. Cao, O. S. Wolfbeis, K. Martin and J. M. Köhler, Microchim. Acta, 2008, 164(3–4), 279 Search PubMed.
- R. J. Beulig, R. Warias, J. J. Heiland, S. Ohla, K. Zeitler and D. Belder, Lab Chip, 2017, 17(11), 1996 RSC.
- S. Sun, B. C. Buer, E. N. G. Marsh and R. T. Kennedy, Anal. Methods, 2016, 8(17), 3458 RSC.
- S. K. Küster, S. R. Fagerer and P. E. Verboket, Anal. Chem., 2013, 85(3), 1285 CrossRef PubMed.
- S. Schlücker, Angew. Chem., Int. Ed., 2014, 53(19), 4756 CrossRef PubMed.
- Q. Zhou and T. Kim, Sens. Actuators, B, 2016, 227, 504 CrossRef CAS.
- I. J. Jahn, O. Zukovskaja, X.-S. X.-S. Zheng, K. Weber, T. W. Bocklitz, D. Cialla-May, J. Popp and O. Žukovskaja, Analyst, 2017, 142(7), 1022 RSC.
- K. R. Strehle, D. Cialla, P. Rösch, T. Henkel, M. Köhler and J. Popp, Anal. Chem., 2007, 79(4), 1542 CrossRef CAS PubMed.
- A. März, T. Henkel, D. Cialla, M. Schmitt and J. Popp, Lab Chip, 2011, 11(21), 3584 RSC.
- M. P. Cecchini, J. Hong, C. Lim, J. Choo, T. Albrecht, J. Andrew and J. B. Edel, Anal. Chem., 2011, 83(8), 3076 CrossRef CAS PubMed.
- V. Dugandžić, I. J. Hidi, K. Weber, D. Cialla-May and J. Popp, Anal. Chim. Acta, 2016, 946, 73 CrossRef PubMed.
- L.-L. Qu, D.-W. Li, J.-Q. Xue, W.-L. Zhai, J. S. Fossey and Y.-T. Long, Lab Chip, 2012, 12(5), 876 RSC.
- C. Han, Y. Li, Q. Jia, L. H. Bradley, Y. Gan, Y. Yao, L. Qu, H. Li and Y. Zhao, Microchim. Acta, 2017, 184(8), 2909 CrossRef CAS.
- T. Yang, X. Guo, Y. Wu, H. Wang, S. Fu, Y. Wen and H. Yang, ACS Appl. Mater. Interfaces, 2014, 6(23), 20985 CrossRef CAS PubMed.
- E. P. Hoppmann, W. W. Yu and I. M. White, Methods, 2013, 63(3), 219 CrossRef CAS PubMed.
- J. M. Köhler, A. März, J. Popp, A. Knauer, I. Kraus, J. Faerber and C. Serra, Anal. Chem., 2013, 85(1), 313 CrossRef PubMed , 0003-2700.
- C. Noguez, J. Phys. Chem. C, 2007, 111(10), 3806 CrossRef CAS.
- S.-Y. Ding, E.-M. You, Z.-Q. Tian and M. Moskovits, Chem. Soc. Rev., 2017, 46(13), 4042 RSC.
- S. Neidle, Oxford handbook of nucleic acid structure, Oxford University Press, Oxford, New York, Oxford science publications, 1999 Search PubMed.
- A. Zhang, B. Yang and Z. Li, J. Mol. Struct.: THEOCHEM, 2007, 819(1–3), 95 CrossRef CAS.
- B. Hodgen, S. Rayat and R. Glaser, Org. Lett., 2003, 5(22), 4077 CrossRef CAS PubMed.
- S. Wang and A. Hu, Chem. Phys. Lett., 2016, 653, 207 CrossRef CAS.
- P. Karran and T. Lindahl, Biochemistry, 1980, 19(26), 6005 CrossRef CAS PubMed.
- A. I. Alrawashdeh, M. H. Almatarneh and R. A. Poirier, Can. J. Chem., 2013, 91(7), 518 CrossRef CAS.
- P. C. Pinheiro, S. Fateixa, H. I. S. Nogueira and T. Trindade, Spectrochim. Acta, Part A, 2013, 101, 36 CrossRef CAS PubMed.
- P. Rajapandiyan and J. Yang, J. Raman Spectrosc., 2014, 45(7), 574 CrossRef CAS.
- N. Visaveliya, S. Lenke and J. M. Köhler, ACS Appl. Mater. Interfaces, 2015, 7(20), 10742 CrossRef CAS PubMed.
- P. J. Späth and H. Koblet, Anal. Biochem., 1979, 93, 275 CrossRef.
- Y. Zhang, B. Walkenfort, J. H. Yoon, S. Schlücker and W. Xie, Phys. Chem. Chem. Phys., 2015, 17(33), 21120 RSC.
- G. Socrates, Infrared and Raman characteristic group frequencies, John Wiley & Sons, Ltd, 2004 Search PubMed.
- D. MacDougall and W. B. Crummett, et al. , Anal. Chem., 1980, 52(14), 2242 CrossRef CAS , 0003-2700.
- B. Everitt, The Cambridge dictionary of statistics, Cambridge Univ. Press, Cambridge, 1998 Search PubMed.
- M. Keating, Y. Chen, I. A. Larmour, K. Faulds and D. Graham, Meas. Sci. Technol., 2012, 23(8), 84006 CrossRef.
- A. Kaminska, O. Inya-Agha, R. J. Forster and T. E. Keyes, Phys. Chem. Chem. Phys., 2008, 10(28), 4172 RSC.
- M. Fan, G. F. S. Andrade and A. G. Brolo, Anal. Chim. Acta, 2011, 693(1–2), 7 CrossRef CAS PubMed.
- W. J. Cho, Y. Kim and J. K. Kim, ACS Nano, 2012, 6(1), 249 CrossRef CAS PubMed.
Footnote |
| † Electronic supplementary information (ESI) available. See DOI: 10.1039/d0lc00367k |
| This journal is © The Royal Society of Chemistry 2020 |