Line-narrowed argon fluoride LA-LEAF for trace arsenic analysis
P. D.
Tribbett†
a,
C. A.
Jones
b,
A. G.
Anders
a,
B.
Rougeau
a and
J. A.
Merten
 *a
*a
aDepartment of Chemistry and Physics, Arkansas State University, USA. E-mail: jmerten@astate.edu
bDepartment of Electrical Engineering, Arkansas State University, USA
First published on 5th November 2019
Abstract
A tunable, line-narrowed ArF excimer laser was used in combination with Nd:YAG ablation for LA-LEAF (LA-LIF) determination of As in steel and dried seaweed. Relative to previous work with a standard ArF, the line-narrowing had minimal effect on the selectivity in steel plasmas. Excitation scanning did show that both the signal and limiting background result from a standard fluorescence mechanism. Preliminary work in seaweed found a detection limit of 1.0 ppm and indicated that more laser energy and further narrowing would improve detection limits slightly. Limiting background in seaweed was ArF-derived.
Introduction
Laser Induced Breakdown Spectroscopy (LIBS) enables rapid multi-element quantitation, obviating sample preparation for simplicity and modest limits of detection. Though the technique is capable of rapid screening (see ref. 1–4), it is limited by poor precision, multiplicative matrix effects, and atomic transition crowding that can lead to additive matrix effects and complicate interpretation of LIBS spectra. The athermal excitation of Laser Ablation-Laser Excited Atomic Fluorescence (LA-LEAF also Laser Ablation-Laser Induced Fluorescence, LA-LIF) addresses some of these shortcomings; LEAF has been shown to improve LIBS′ detection limits, though it sacrifices simplicity and multi-element functionality.5–7 The selective re-excitation allows detection after the laser-induced plasma (LIP) has cooled and ions and electrons have recombined, limiting background from continuum and matrix-derived atomic lines. Though tunable CW diode lasers, tunable dye lasers, and tunable optical parametric oscillators (OPOs) are traditionally used for selective plasma re-excitation, these typically require doubling and mixing to reach common UV ground-state transitions. In the absence of laser-accessible atomic absorptions, researchers have recently resorted to laser-induced diatomic molecular fluorescence hyphenation.8Argon fluoride lasers, with their broad gain profiles, allow access to a handful of atomic transitions at the edge of the vacuum UV (∼193.3 nm).9 These lasers are relatively robust and widely used in the semiconductor industry. The 193.76 nm ground state As transition lies within the ArF laser's gain profile. Selwyn first demonstrated ArF-induced fluorescence of As in a microwave etching chamber.10 Hueber et al. subsequently observed ArF-induced As fluorescence in ICPs and flames, reporting poor limits of detection as a result of laser-induced interference.11 Our group provided the first demonstration of As LA-LEAF with measurements in steel and copper, where LODs were at least one order of magnitude lower than typical LIBS As measurements, despite the complex ArF-induced matrix background in steel.9
Although LA-LEAF is not considered a multi-element technique, Cheung et al. have studied a relatively non-selective emission enhancement following ArF re-excitation.12 They suggest that this may result from broadening of atomic energy transitions due to near solid-state number densities within the plume, a mechanism known as Plume Laser Induced Fluorescence (PLIF or sometimes PLEAF, Pulsed Laser-Excited Atomic Fluorescence).13–15 Though potentially beneficial if the analyte is unknown, such decreased selectivity would complicate As detection in a spectrally rich iron matrix.9
The present work applies a line-narrowed ArF excimer to LA-LEAF detection of As in steel, an easily presented sample for which reference materials are available. As there are numerous iron transitions in the excitation and detection windows, steel is a challenging matrix for even atomic fluorescence spectroscopy. We also present here the first LA-LEAF measurements of As in an organic matrix: toasted sushi nori sheets. These were selected for their high As content and ease of presentation to the ablation laser. Detection and quantitation of As is of interest to our lab due to its toxicity and presence in rice at concentrations of 0.08–0.2 ppm (10× higher in the bran).16,17
Experimental
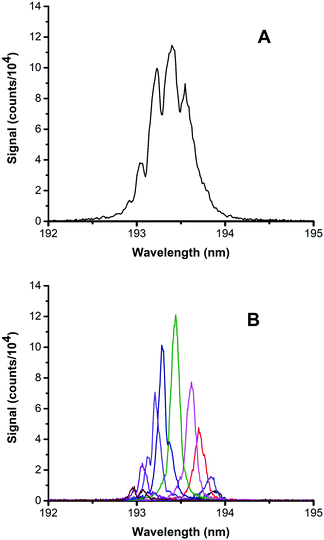
Timing of the setup was controlled using a delay generator (DG645, Stanford Research) triggering at 10 Hz. Samples were ablated with a 355 nm Nd:YAG (Continuum Surelite, 20 mJ, 6 ns). Arsenic fluorescence was induced with absorption of a modified GAM EX5a argon fluoride excimer laser (maximum ∼500 μJ when tuned on-resonance, 8 ns pulses) at the 193.76 nm absorption line.Previous LA-LIF9 and PLIF13,15,18,19 studies employed a standard broadband ArF with a spectral width of approximately 0.5 nm (see Fig. 1A). The unmodified laser spectrum was two orders of magnitude wider than the absorption line, resulting in poor selectivity against matrix species, particularly iron. For the present work, the rear cavity mirror was replaced with a Brewster window, anamorphic prism pair and diffraction grating, narrowing the spectrum to 70 pm (FWHM) and enabling tuning. The modifications decreased the pulse energy to <1 mJ (less at the As line). This narrowed laser profile is shown at several different tunings in Fig. 1B. Aside from gas flow onto the sample, the optical path (including the laser cavity tuning optics outside of the gas chamber) was not flushed resulting in O2 molecular absorption of the ArF emission at some tunings; the region of the As transition appears grossly unaffected.
Absolute ArF energies were measured with a pyroelectric detector (Newport 2936-R). Relative ArF energies for saturation studies were measured with a fused silica pickoff and a Si photodiode/boxcar configuration and were cross-calibrated with the pyroelectric detector. Pulse energy was attenuated with either fused silica cover slips or quartz cuvettes in the optical path because spectrally appropriate neutral density filters were not available and because changing ArF discharge voltage would change timing and spectral profiles. The optical layout was the same as our previous work, with the plasma propagating along the slit and the ArF excimer skimming the sample surface.9 The ArF and its demagnification telescope were mounted on an xyz stage, allowing translation of the excitation beam with respect to the plasma. Relative position was monitored with runout gauges. The ArF beam was 0.45 × 2.1 mm at the plasma.
Detection was at 234.98 nm. Plasma emission was focused onto the aperture of a 0.5 m spectrograph (Andor Shamrock, 2400 mm−1 grating, 250 nm blaze angle) and detected with an ICCD (Andor iStar, Gen. II photocathode). In the steel measurements, the solid angle of collection was increased with a concave mirror opposite the collection optics (the seaweed presentation geometry prevented use of the doubling mirror). The ICCD was triggered by the ArF sync out because of the substantial jitter in the ArF triggering. Detection was tightly gated (8 ns) to minimize thermal background when possible. Cover gas (helium or argon) was applied from 10 mm above the sample surface at a rate of 7 lpm.
During measurements, ten photocathode-gated shots were accumulated on the CCD chip for every spectral acquisition and were read out as a single (combined) spectrum with on-chip vertical binning to minimize the impact of readout noise. Additionally, the CCD chip was cooled to 0 °C to minimize dark charge and resultant noise. Spectra were analysed using Labview programs written in-house. After each acquisition, steel samples were rotated or sanded to avoid ablation debris and minimize cratering. As the first few shots tended to be extremely high and irreproducible, each sample spot was “preconditioned” with ten laser shots before acquiring the 10-shot spectrum used for analysis. Limits of detection (k = 3) were calculated with noise measured across ten blank spectra, each of which consisted of ten photocathode-gated shots accumulated on the ICCD chip (LOD = 3Sblank/m).
NIST low alloy steel disks with As levels of <1 to 520 ppm were used for steel calibration curves. NIST SRM 1768 was used as an approximate blank in the LOD measurements. No certified or “information” values in this sample exceed 30 ppm and the arsenic content is <1 ppm (provided as a noncertified “information value”). For seaweed measurements, toasted nori sheets were purchased from a local supermarket. Though conveniently flat, these sheets were visibly inhomogeneous, with some areas so thin as to be translucent. The sheets were glued to sheets of paper which were then glued to hard disk drive platters. The paper was necessary to avoid interference from hard-disk-derived platinum, which is also excitable by the ArF. Nori samples were translated after each laser shot to present a fresh spot for each ablation event, as single ablations nearly penetrated the sample.
Nori (Pyropia sp., formerly Porphyria sp.) is known to contain 20–30 ppm of As, mostly as nontoxic organoarsenic species.20 The total As concentration in our nori sample was verified with a homemade HG-AAS setup built around a Shimadzu hydride generator. In order to avoid chemical selection against organoarsenic compounds in the digestion and eventual hydride generation, the oven-dried sample was refluxed at 250 °C with an aggressive combination of concentrated nitric and sulfuric acids followed by 30% hydrogen peroxide, as outlined in Šlejkovec et al.21 The samples were diluted to ∼1 ng mL−1 and the analyte was reduced to As+3 with KI before reduction to arsine with sodium borohydride. An external standard calibration was used for quantitation via the 193.76 nm line.
Results and discussion
Effect of inter-laser delay
Our group's previous work with a broadband ArF excimer suggested that steel-sample As/Fe SBR peaked at interlaser delays of 10 and 30 μs under helium and argon, respectively. The trend is unchanged after the line-narrowing (see Fig. 2). Note that a different matrix emission line (232.22 nm) was used in the present work because the matrix line previously used with broadband excitation was not always observed with the modified ArF.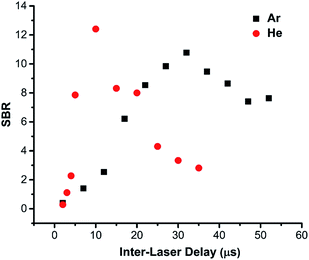 | ||
| Fig. 2 Effect of inter-laser delay on signal to background ratio. The iron line at 232.2 nm was used as background. | ||
Effect of ArF excimer energy
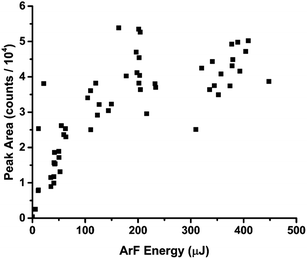
Our group has previously demonstrated saturation of the As absorption in LA-LEAF plasmas at an ArF fluence of ∼1.4 J cm−2. Line-narrowing the excimer decreased the energy, with a maximum of only 500 μJ when tuned to the As transition. This value decreased rapidly with gas fill age. Despite the decreased energy, Fig. 3 indicates that approximately 150 μJ (15 mJ cm−2) from the narrowed laser is sufficient to saturate the transition in steel LIPs due to the improved overlap of the absorption lineshape and the laser spectrum. Because our previous studies with the broadband ArF found no saturation in the iron signal, the excimer laser energy was attenuated to improve SBR in subsequent experiments with the modified laser.Sources of noise and relevant background
The various noise components were measured across 50 blank spectra. ICCD dark noise (i.e. readout noise plus variation in dark charge), noise in plasma thermal emission and noise in the various ArF-induced signals were considered. The combined noises (as standard deviations) in each of four sets of 50 sequential measurements of NIST SRM 1768 (<1 ppm As) under conditions of (1) ablation + ArF (resonant with As), (2) ablation + ArF (slightly detuned from As), (3) ablation only (simple LIBS) and (4) both lasers blocked are given in Table 1. The photocathode gating and readout conditions were kept constant throughout. Given the variation observed in the LIBS measurement and assuming non-correlation (i.e. simple addition of variances), the readout noise is insignificant. When not resonant with As, the ArF-derived signal is approximately equal to the combined readout and thermal emission noise. However, when tuned to the As transition, the ArF-derived noise clearly dominates. Assuming that this was a reasonable blank (i.e. that analyte noise is insignificant), this illustrates the selectivity challenge of this particular matrix/analyte combination.| Measurement | Std. deviation (arb. units) |
|---|---|
| LA-LEAF tuned to As | 2050 |
| LA-LEAF (ArF detuned) | 820 |
| LA (i.e. LIBS) | 580 |
| CCD readout (lasers blocked) | 250 |
Background fluorescence mechanism
The traditional mechanism for LIP plasma fluorescence results from transitions between relatively discrete atomic states. However, Cheung's group has shown “cool” but non-selective emission when reexciting a plasma with an ArF or the fifth harmonic of Nd:YAG.14,19 They suggest that the high number densities present under certain plasma conditions can broaden transitions such that these deep-UV lasers can excite transitions that would not fall under their emission profiles under more rarified conditions.15The narrowed, tuneable ArF excimer allows a probe of this mechanism. Of course, the line-narrowing does decrease ArF energy by more than an order of magnitude, reducing potential for the particle vaporization posited in Cheung's mechanism. Fig. 4 shows LA-LEAF spectra at different ArF tunings. In the figure, the excimer energy was kept constant to within ∼10% during the tuning. A thermal emission (i.e. LIBS) spectrum is included for reference. The As signal disappears rapidly as the laser is tuned away from the As maximum, suggesting that this signal is not the result of Cheung's PLEAF mechanism. Similarly, the background (assumed to be iron fluorescence) disappears rapidly as the laser is (de)tuned. Unfortunately, the background also shows a maximum at the same tuning as As. As a result, the laser modification produced an insignificant improvement in LODs in steel-from 1 ppm and 1.6 ppm (ref. 9) to 0.5 and 0.8 ppm under helium and argon covers, respectively. These do remain below the LOD typical for LIBS determination of As, particularly when one accounts for the low number of shots (10) used in our spectra.9
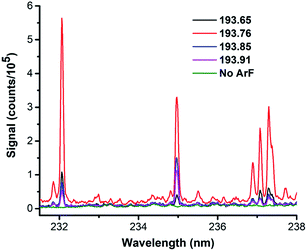 | ||
| Fig. 4 LA-LEAF spectra at various ArF tunings near the As absorption (193.76). ArF energy was kept independent of tuning in these data. Sample contained 35 ppm of As. | ||
Preliminary work in organic matrix
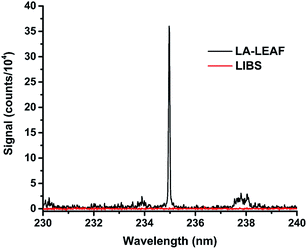
Because there are no convenient standard series for As in organic matrices, a full LA-LIF calibration curve was not feasible for the seaweed measurements (several powdered samples are available from NIST but were not considered because of their low As concentration and/or difficulty of presentation). The HG-AAS assay showed the nori to contain 30 ppm of As (dry weight). This measurement did not include a full assay development and was simply to verify that the literature values were relevant to the store-bought sample used here. This single value agrees with Almela et al., who found 30 ± 1 ppm in toasted nori.20 It should be noted that only the total As is relevant in LA-LEAF measurements; LA-LEAF does not distinguish between organic and inorganic forms. Given the aggressive sample digestion used, the HG-AAS values should represent total As.A LA-LEAF spectrum of nori under helium is shown in Fig. 5. The figure averaged several spectral readouts to better measure the background structure. LIBS (i.e. thermal) signal is minimal, but there is clear ArF-induced background. The spectrum is simpler than that in steel, however. It is not clear if the seaweed background consists of molecular or atomic emission, in contrast to the steel sample, where we believe the background is atomic. Under helium, the As signal peaked at an inter-laser delay of 2 μs with minimal background (data not shown), in contrast to the 10 μs required in steel. The origin of this difference is unclear and would benefit from future absorption imaging measurements.22 Specifically, absorption imaging measurements would help determine if the difference in the optimal inter-laser delay results from differences in the evolution of the plasma morphology, chemical composition, or degree of dynamic quenching.
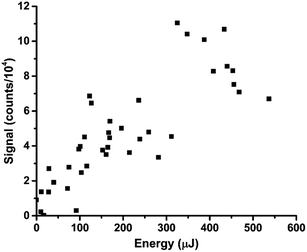
There was no evidence of saturation in nori (see Fig. 6), in contrast to the steel measurements. Note that the saturation curves were taken at the delay giving the best SNR for each matrix, so comparison of the steel and nori saturation data is somewhat complicated, particularly in light of the time-dependent saturation behaviour demonstrated in our work with the stock ArF laser.9 Because of the low precision in the nori measurements (likely because of the poor sample homogeneity even in this relatively easy-to-present sample), only gross departure from linearity would be detectable. Of course, assuming that the ArF-induced background is limiting and is linear with ArF energy, the LOD would only improve with the square root of pulse energy given ArF-derived background noise is shot in character.
Because the As concentration was well above the detection limit in nori, background noise was estimated from an area just to the red of the As emission peak. Noise was calculated from the inter-spectrum variation in integrated signal and gave a detection limit of 1.0 ppm in nori. We are only aware of one LIBS measurement of As in an organic matrix (pressure-treated lumber), where Uhl et al. found a LOD of 2.7 ppm when integrating 20 shots.23 Adjusting for the number of shots (i.e. n1/2), our LOD is a factor of four lower. We do believe that the thinness of the nori may worsen the LOD somewhat, decreasing the maximum quantity of analyte (and matrix) that could be ablated. Additionally, we have previously suggested that the lumber LOD might be slightly skewed by inhomogeneity in the sample-As might be concentrated more at the surface relative to the bulk.
Conclusions
Line narrowing of a stock ArF excimer has enabled minor improvements to the LA-LEAF LOD of As in steel. Scans of the excitation wavelength show that both the analyte and background fluorescence are caused by the usual fluorescence mechanism and not PLIF/PLEAF. This measurement should not be taken as a criticism of PLIF/PLEAF as our experiments were designed to maximize selectivity in the face of a very challenging matrix/analyte system.Additionally, LA-LEAF detection of As in seaweed has been demonstrated for the first time, with a detection limit similar to that in steel. Because the ArF energy was not sufficient to saturate the seaweed's As fluorescence signal, slight improvement should be possible with increased excimer energy. This work does demonstrate that LA-LEAF is capable of detecting As in organic matrices, though the LOD remains modest and calibration is complicated by the usual problems inherent to laser-ablation microsampling of natural and inhomogeneous products.
Since the limiting noise in both the steel and the seaweed matrices was ArF-induced, further narrowing of the excimer emission (currently more than an order of magnitude broader than the expected width of the As absorption) would further improve selectivity and detection limits. These will need to decrease by another order of magnitude if LA-LEAF is to become relevant for As measurements in foodstuffs other than mushrooms and some seafoods, where high concentrations are common. Without improvements to LOD, the technique is likely inappropriate for measurements in rice. Additionally, it is unclear if multishot accumulations are relevant to fragile/friable biological matrices without significant sample preparation or complex sample presentation techniques.
Conflicts of interest
There are no conflicts to declare.Acknowledgements
The authors acknowledge support from the Arkansas Bioscience Institute, the United States Defense Threat Reduction Agency (contract number HDTRA1-16-1-0003), and the Arkansas State University Office of Research and Technology Transfer. The Arkansas Biosciences Institute is a partnership of scientists from Arkansas Children's Hospital, Arkansas State University, the University of Arkansas-Division of Agriculture, the University of Arkansas, Fayetteville, and the University of Arkansas for Medical Sciences. The Arkansas Biosciences Institute is the major research component of the Arkansas Tobacco Settlement Proceeds Act of 2000.References
-
R. Noll, V. Sturm, M. Stepputat, A. Whitehouse, J. Young and P. Evans, in Laser-Induced Breakdown Spectroscopy (LIBS): Fundamentals and Applications, ed. A. Miziolek, V. Palleschi and I. Schechter, Cambridge University Press, Cambridge. 2006, pp. 400–439 Search PubMed
.
- J. Gurell, A. Bengtson, M. Falkenström and B. Hansson, Spectrochim. Acta, Part B, 2012, 74, 46–50 CrossRef
.
- M. Gaft, L. Nagli, Y. Groisman and A. Barishnikov, Appl. Spectrosc., 2014, 68, 1004–1015 CrossRef CAS
.
- D. W. Hahn and N. Omenetto, Appl. Spectrosc., 2012, 66, 347–419 CrossRef CAS
.
- F. Hilbk-Kortenbruck, R. Noll, P. Wintjens, H. Falk and C. Becker, Spectrochim. Acta, Part B, 2001, 56, 933–945 CrossRef
.
- M. Shen, C. M. Li, D. Na, Z. Q. Hao, X. Y. Li, L. B. Guo, Y. F. Lu and X. Y. Zeng, J. Anal. At. Spectrom., 2018, 33, 658–662 RSC
.
- R. Yi, J. Li, X. Yang, R. Zhou, H. Yu, Z. Hao, L. Guo, X. Li, X. Zeng and Y. Lu, Anal. Chem., 2017, 89, 2334–2337 CrossRef CAS
.
- J. Li, Z. Zhu, R. Zhou, N. Zhao, R. Yi, X. Yang, X. Li, L. Guo, X. Zeng and Y. Lu, Anal. Chem., 2017, 89, 8134–8139 CrossRef CAS PubMed
.
- J. A. Merten, C. A. Jones and P. D. Tribbett, J. Anal. At. Spectrom., 2017, 32, 1697–1704 RSC
.
- G. S. Selwyn, Appl. Phys. Lett., 1987, 51, 167–168 CrossRef CAS
.
- D. Hueber, B. W. Smith, S. Madden and J. D. Winefordner, Appl. Spectrosc., 1994, 48, 1213–1217 CrossRef CAS
.
- X. Y. Pu, W. Y. Ma and N. H. Cheung, Appl. Phys. Lett., 2003, 83, 3416–3418 CrossRef CAS
.
- X. Wang, Z. Huang, P.-C. Chu, Y. Cai, K. S. Y. Leung, J. T. S. Lum and N.-H. Cheung, J. Anal. At. Spectrom., 2016, 31, 2363–2374 RSC
.
- B. Y. Cai, X. Mao, H. Hou, V. Zorba, R. E. Russo and N.-H. Cheung, Spectrochim. Acta, Part B, 2015, 110, 51–55 CrossRef CAS
.
- S. K. Ho and N. H. Cheung, Appl. Phys. Lett., 2005, 87, 264104 CrossRef
.
- Y. J. Zavala and J. M. Duxbury, Environ. Sci. Technol., 2008, 42, 3856–3860 CrossRef CAS
.
- G.-X. Sun, P. N. Williams, A.-M. Carey, Y.-G. Zhu, C. Deacon, A. Raab, J. Feldmann, R. M. Islam and A. A. Meharg, Environ. Sci. Technol., 2008, 42, 7542–7546 CrossRef CAS
.
- Y. Cai, Z. Huang, M. H. C. Cheung, V. Motto-Ros, P.-C. Chu, Y. Wang, H. Zhong, R. Yuen, K. S. Y. Leung, J. T. S. Lum, S.-K. Ho and N.-H. Cheung, Anal. Chem., 2016, 88, 10971–10978 CrossRef CAS
.
- S. K. Ho and N. H. Cheung, Anal. Chem., 2005, 77, 193–199 CrossRef CAS
.
- C. Almela, S. Algora, V. Benito, M. J. Clemente, V. Devesa, M. A. Súñer, D. Vélez and R. Montoro, J. Agric. Food Chem., 2002, 50, 918–923 CrossRef CAS
.
- Z. Šlejkovec, J. T. van Elteren and U. D. Woroniecka, Anal. Chim. Acta, 2001, 443, 277–282 CrossRef
.
- J. Merten and B. Johnson, Spectrochim. Acta, Part B, 2018, 149, 124–131 CrossRef CAS
.
- A. Uhl, K. Loebe and L. Kreuchwig, Spectrochim. Acta, Part B, 2001, 56, 795–806 CrossRef
.
Footnote |
| † Current address, Northern Arizona University, Department of Astronomy and Planetary Science. |
| This journal is © The Royal Society of Chemistry 2020 |

