
Solid sampling: advantages and challenges for chemical element determination—a critical review
Raquel C.
Machado
 ,
Daniel F.
Andrade
,
Diego V.
Babos
,
Jeyne P.
Castro
,
Vinicius C.
Costa
,
Marco Aurelio
Sperança
,
José Augusto
Garcia
,
Raimundo R.
Gamela
and
Edenir R.
Pereira-Filho
*
,
Daniel F.
Andrade
,
Diego V.
Babos
,
Jeyne P.
Castro
,
Vinicius C.
Costa
,
Marco Aurelio
Sperança
,
José Augusto
Garcia
,
Raimundo R.
Gamela
and
Edenir R.
Pereira-Filho
*
Group for Applied Instrumental Analysis, Department of Chemistry, Federal University of São Carlos, P.O. Box 676, São Carlos State, 13565-905, Brazil. E-mail: erpf@ufscar.br
First published on 24th October 2019
Abstract
In recent decades, direct solid sample analysis has been reported in the literature as an alternative to traditional methods of sample preparation, becoming well established in the atomic spectrometry field. Therefore, this review discusses recent advances in different techniques such as flame atomic absorption spectrometry, graphite furnace atomic absorption spectrometry, high-resolution continuum source graphite furnace atomic absorption spectrometry, electrothermal vaporization, laser ablation, laser-induced breakdown spectroscopy, X-ray fluorescence spectrometry, glow discharge optical emission and mass spectrometry and arc/spark optical emission spectrometry, which are the most commonly used techniques for solid sample analysis. New possibilities such as nonmetal detection through molecular emission or absorption signals, speciation analysis, portable instrumentation for in situ analysis, and surface elemental mapping for obtaining chemical imaging will be discussed. Aspects associated with advantages and limitations are presented, relating the main instrumental advances to the expansion of the methods developed in this subject, pointing out the potential ability to overcome spectral interference and matrix effects through the development of calibration strategies to achieve the success of solid sampling in several application areas.
1. Introduction
Solid sampling (SS) is the term applied to obtaining information about elemental composition directly from a sample without intense chemical treatment or with minimal preparation.1 In the particular field of chemical element determination, this modality offers several advantages over wet chemistry approaches such as (1) a simple and fast pretreatment of the samples; (2) reduced risks of contamination and analyte loss; (3) greater detectability of the analytes since the samples are not diluted; (4) reduced use of hazardous reagents and waste generation; (5) requirement of a small amount of sample; (6) analysis and results obtained with a high analytical throughput.1,2For this purpose, the traditional analytical techniques specially designed for the direct analysis of solids such as arc/spark optical emission spectrometry,3 glow discharge (GD) with optical emission or mass spectrometry (OES/MS)4 and X-ray fluorescence (XRF)5 meet the needs of this task and represent an important division of the existing methods. On the other hand, due to the development of new analytical instruments and the modification of instrumental components, such as laser ablation (LA) systems, electrothermal vaporization (ETV) systems, boat-type platforms, and flow injection analysis (FIA) systems over recent decades, there are various other techniques that can provide quantitative information directly from a solid sample. Some examples are graphite furnace atomic absorption spectrometry (GFAAS),6 flame atomic absorption spectrometry (FAAS),7 inductively coupled plasma optical emission spectrometry (ICP OES), inductively coupled plasma mass spectrometry (ICP-MS),8 and laser-induced breakdown spectroscopy (LIBS).9 Different methods have been reported for the direct analysis of solid samples using either suspensions or direct sampling of powder, compact materials, and pellets, which depends on the availability of the instrumentation and the requirement needs of the analysis.2
The goal of this review is to highlight papers from different research areas related to direct sampling of solids and introduce the main advantages/challenges of SS for each analytical technique reported in the scientific literature. The online Science Citation Index Expanded (SCI-E) – Clarivate Analytics – Web of Science© (WoS)10 database was searched to develop bibliometric indicators considering the publications indexed using the keyword “solid sampling*” and a total of 626 academic articles are addressed to this search topic in the past thirty years (1990–2019).
As can be seen in Fig. 1A, an expressive number of applications in direct analysis of solid samples began to be described in the literature in the 1990s. This fact is related to the growing acceptance of solid sample analysis that occurred at the end of the 1980s. During this period the potential of the graphite furnace technique for direct solid analysis1 was in consolidation. Later the development of electrothermal vaporization11 and laser ablation devices was highlighted.12 While the introduction of novel sampling devices was followed by fast dissemination, the acceptance of direct SS for each specific application slowly occurred over the past three decades in a hard step-by-step process.
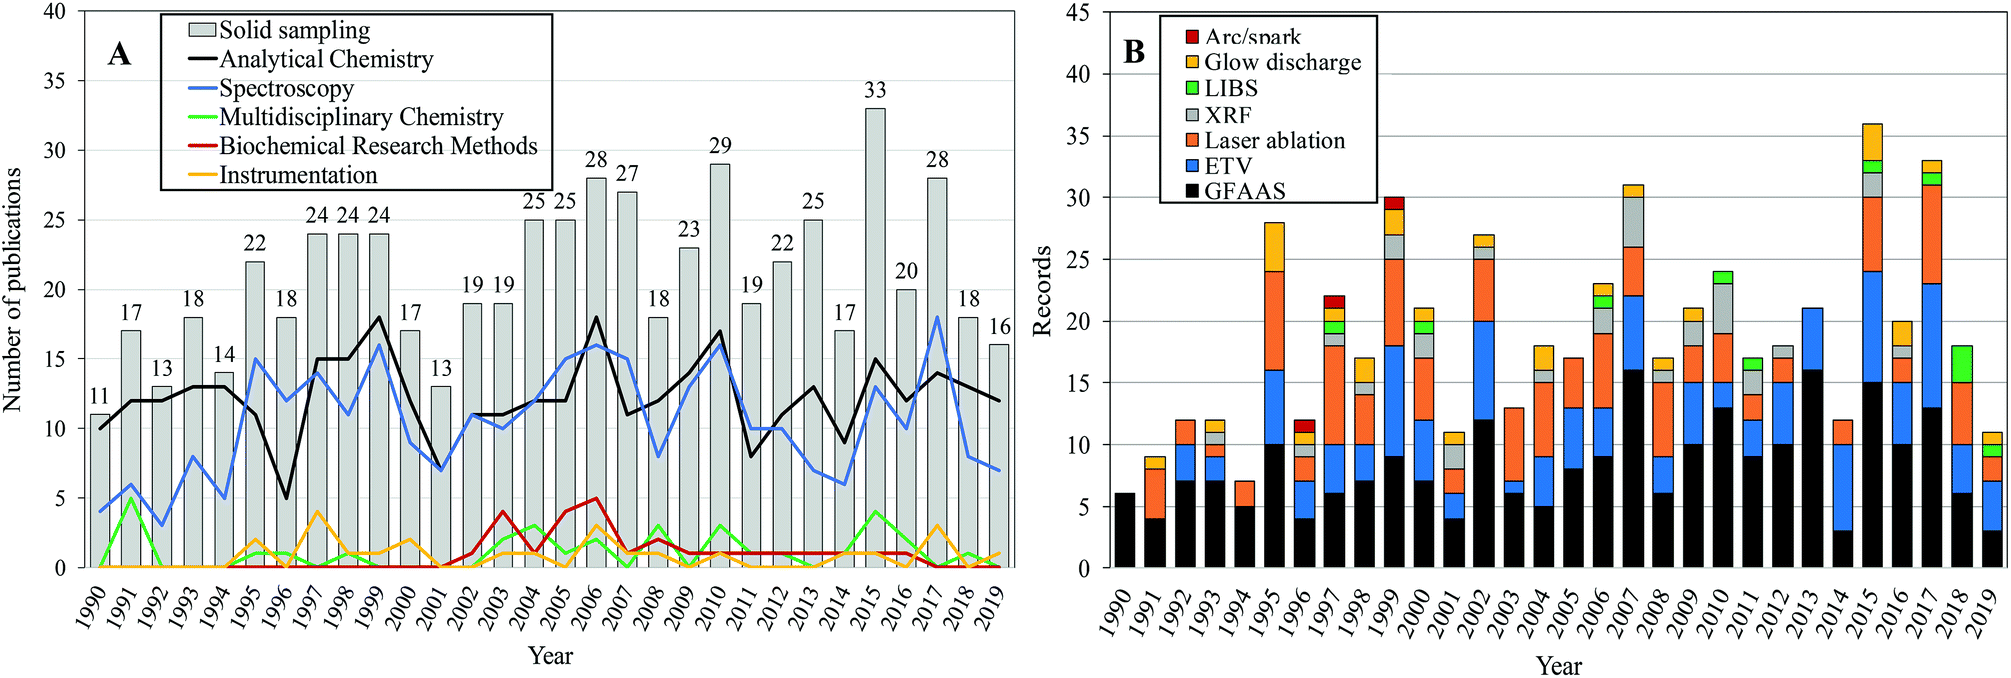 | ||
| Fig. 1 Annual evolution of the number of articles published on (A) the topic “solid sampling” and the top 5 WoS categories and (B) the analytical techniques addressed in publications (1990–2019). | ||
Analytical Chemistry and Spectroscopy were the main WoS categories associated with the total number of publications (Fig. 1A). Analytical Chemistry often leads to the demands of real-world users for chemical assays of several samples of different natures in which a significant fraction of the samples are in the solid state. The work in Analytical Chemistry/Spectrometry has shown a great capacity to develop new concepts, instruments, methods and procedures in recent years.13
GFAAS has always been considered a suitable technique for direct solid and slurry analysis. A significant number of papers (39%) related to SS reported the use of this technique for complex material analysis, a trend that has been maintained until today (Fig. 1B). Research on electrothermal vaporization (20% of total record) and laser ablation (18% of total record) sample introduction has also received increasing interest, followed by research on devices that are less representative for this topic (glow discharge and arc/spark). XRF and LIBS have been consolidated in the most important instruments for direct analysis of solid samples.9,14
The retrieved papers were published in more than 100 different journals. However, approximately 9% of journals have published at least 10 papers in the last thirty years. Consequently, it can be pointed out that these journals are the most sought-after periodicals in relation to scientific studies concerning solid sampling. Table 1 shows the 10 most active journals, and the Journal of Analytical Atomic Spectrometry was the most influential in the ranking for publications involving the direct analysis of solid samples, accounting for 140 publications and 3395 citations.
| Rank | Journal | NA | NC |
|---|---|---|---|
| a Data fusion to Analytical and Bioanalytical Chemistry, Fresenius' Journal of Analytical Chemistry and Fresenius' Zeitschrift für Analytische Chemie. | |||
| 1 | Journal of Analytical Atomic Spectrometry | 140 | 3395 |
| 2 | Spectrochimica Acta Part B: Atomic Spectroscopy | 121 | 3394 |
| 3 | Analytical and Bioanalytical Chemistry | 67 | 1372 |
| 4 | Talanta | 29 | 902 |
| 5 | Microchemical Journal | 20 | 245 |
| 6 | Analytical Chemistry | 16 | 523 |
| 7 | Analytica Chimica Acta | 14 | 419 |
| 8 | Applied Spectroscopy | 13 | 239 |
| 9 | Analytical Sciences | 10 | 98 |
| 10 | Journal of the Brazilian Chemical Society | 10 | 94 |
Overall, the historical survey of SS described by the indexes of publications shows that the development of these analytical procedures does not take a typical path. The remarkable benefits and advances that can be obtained from these methods are provided in the following sections to explain why an increasing number of researchers have chosen the methods with these features in the analysis of solid samples. In addition, as is the case for any procedure, some previous conditions must be considered for the successful application of SS, and these are also highlighted in the present review.
2. Advances in solid sampling: portable analyzers, calibration and strategies to overcome interference
The trends for the development of analytical methods devoted to SS and direct solid sample analysis are associated with the several advantages described previously and are also in concordance with the green analytical chemistry principles.15 Furthermore, the associated technological advances contributed to the development of portable analyzers, known as “hand-held” instruments, for techniques such as XRF, LIBS and laser ablation.16–18These portable analyzers enable the in situ nondestructive analysis of museum artifacts, works of art, cultural heritage in general, and forensic samples in crime scenes, analysis of other samples that cannot be transported to the laboratory and extended applications to determine the elemental distributions that provide additional information about solid samples, clarifying several aspects in specific research, such as the use of bioimaging for biomedical research.16–18
However, despite these advantages, the use of direct solid sample analysis in different analytical techniques also shows some limitations, such as difficulty in obtaining solid calibration standards, the absence of certified reference materials (CRMs) with certified values for small sample masses (of the order of μg), poor precision illustrated by large relative standard deviations (RSDs) due the heterogeneity of samples for masses at the μg level and risks of spectral and nonspectral interference.1,6,19 For some years, these limitations were considered major challenges for the direct analysis of solid samples, but there are many strategies reported in the literature to overcome the problems mentioned.
In GFAAS, ETV-ICP OES and ETV-ICP-MS systems, for example, the use of chemical matrix modifiers and the optimization of temperature programs allow calibration to be carried out using a straightforward approach: aqueous standard solutions. This strategy was used during the last decade for GFAAS, and with the advent of HR-CS GFAAS, the analytical methods developed from it have improved in terms of correction of the matrix effects and detection.6,20 As HR-CS GFAAS instrumentation enables the simultaneous or sequential monitoring of various atomic lines, internal standardization (IS) can also be used as a calibration strategy to correct matrix effects.21,22
Recently, a new calibration strategy, multienergy calibration (MEC), was used for Cl determination with CaCl by high-resolution continuum source graphite furnace molecular absorption spectrometry (HR-CS GFMAS) in milk suspension, minimizing nonspectral interference effects.23 This calibration strategy was firstly developed for liquid samples, with matrix-matching capability to minimize matrix effects and is based on use of several wavelengths for calibration and only two solutions: solution 1, composed of 50% v/v standard solution with a fixed analyte concentration and 50% v/v sample and solution 2, composed of 50% v/v sample and 50% v/v blank solution. The analyte concentration is calculated from the slope, obtained by plotting the intensities recorded from solution 1 and solution 2 on the x-axis and y-axis, and analyte concentration used in the standard solution.24
When ETV-ICP OES and ETV-ICP-MS are used as analytical techniques for elemental determination during solid sample analysis, conventional calibration strategies, such as external calibration with aqueous standard solutions (the most commonly used method in the majority of the studies) or matrix-matching calibration (MMC) with solid standards, and IS are still very useful; for the coupled technique ETV-ICP-MS, it is also possible to carry out the calibration using isotope dilution.19
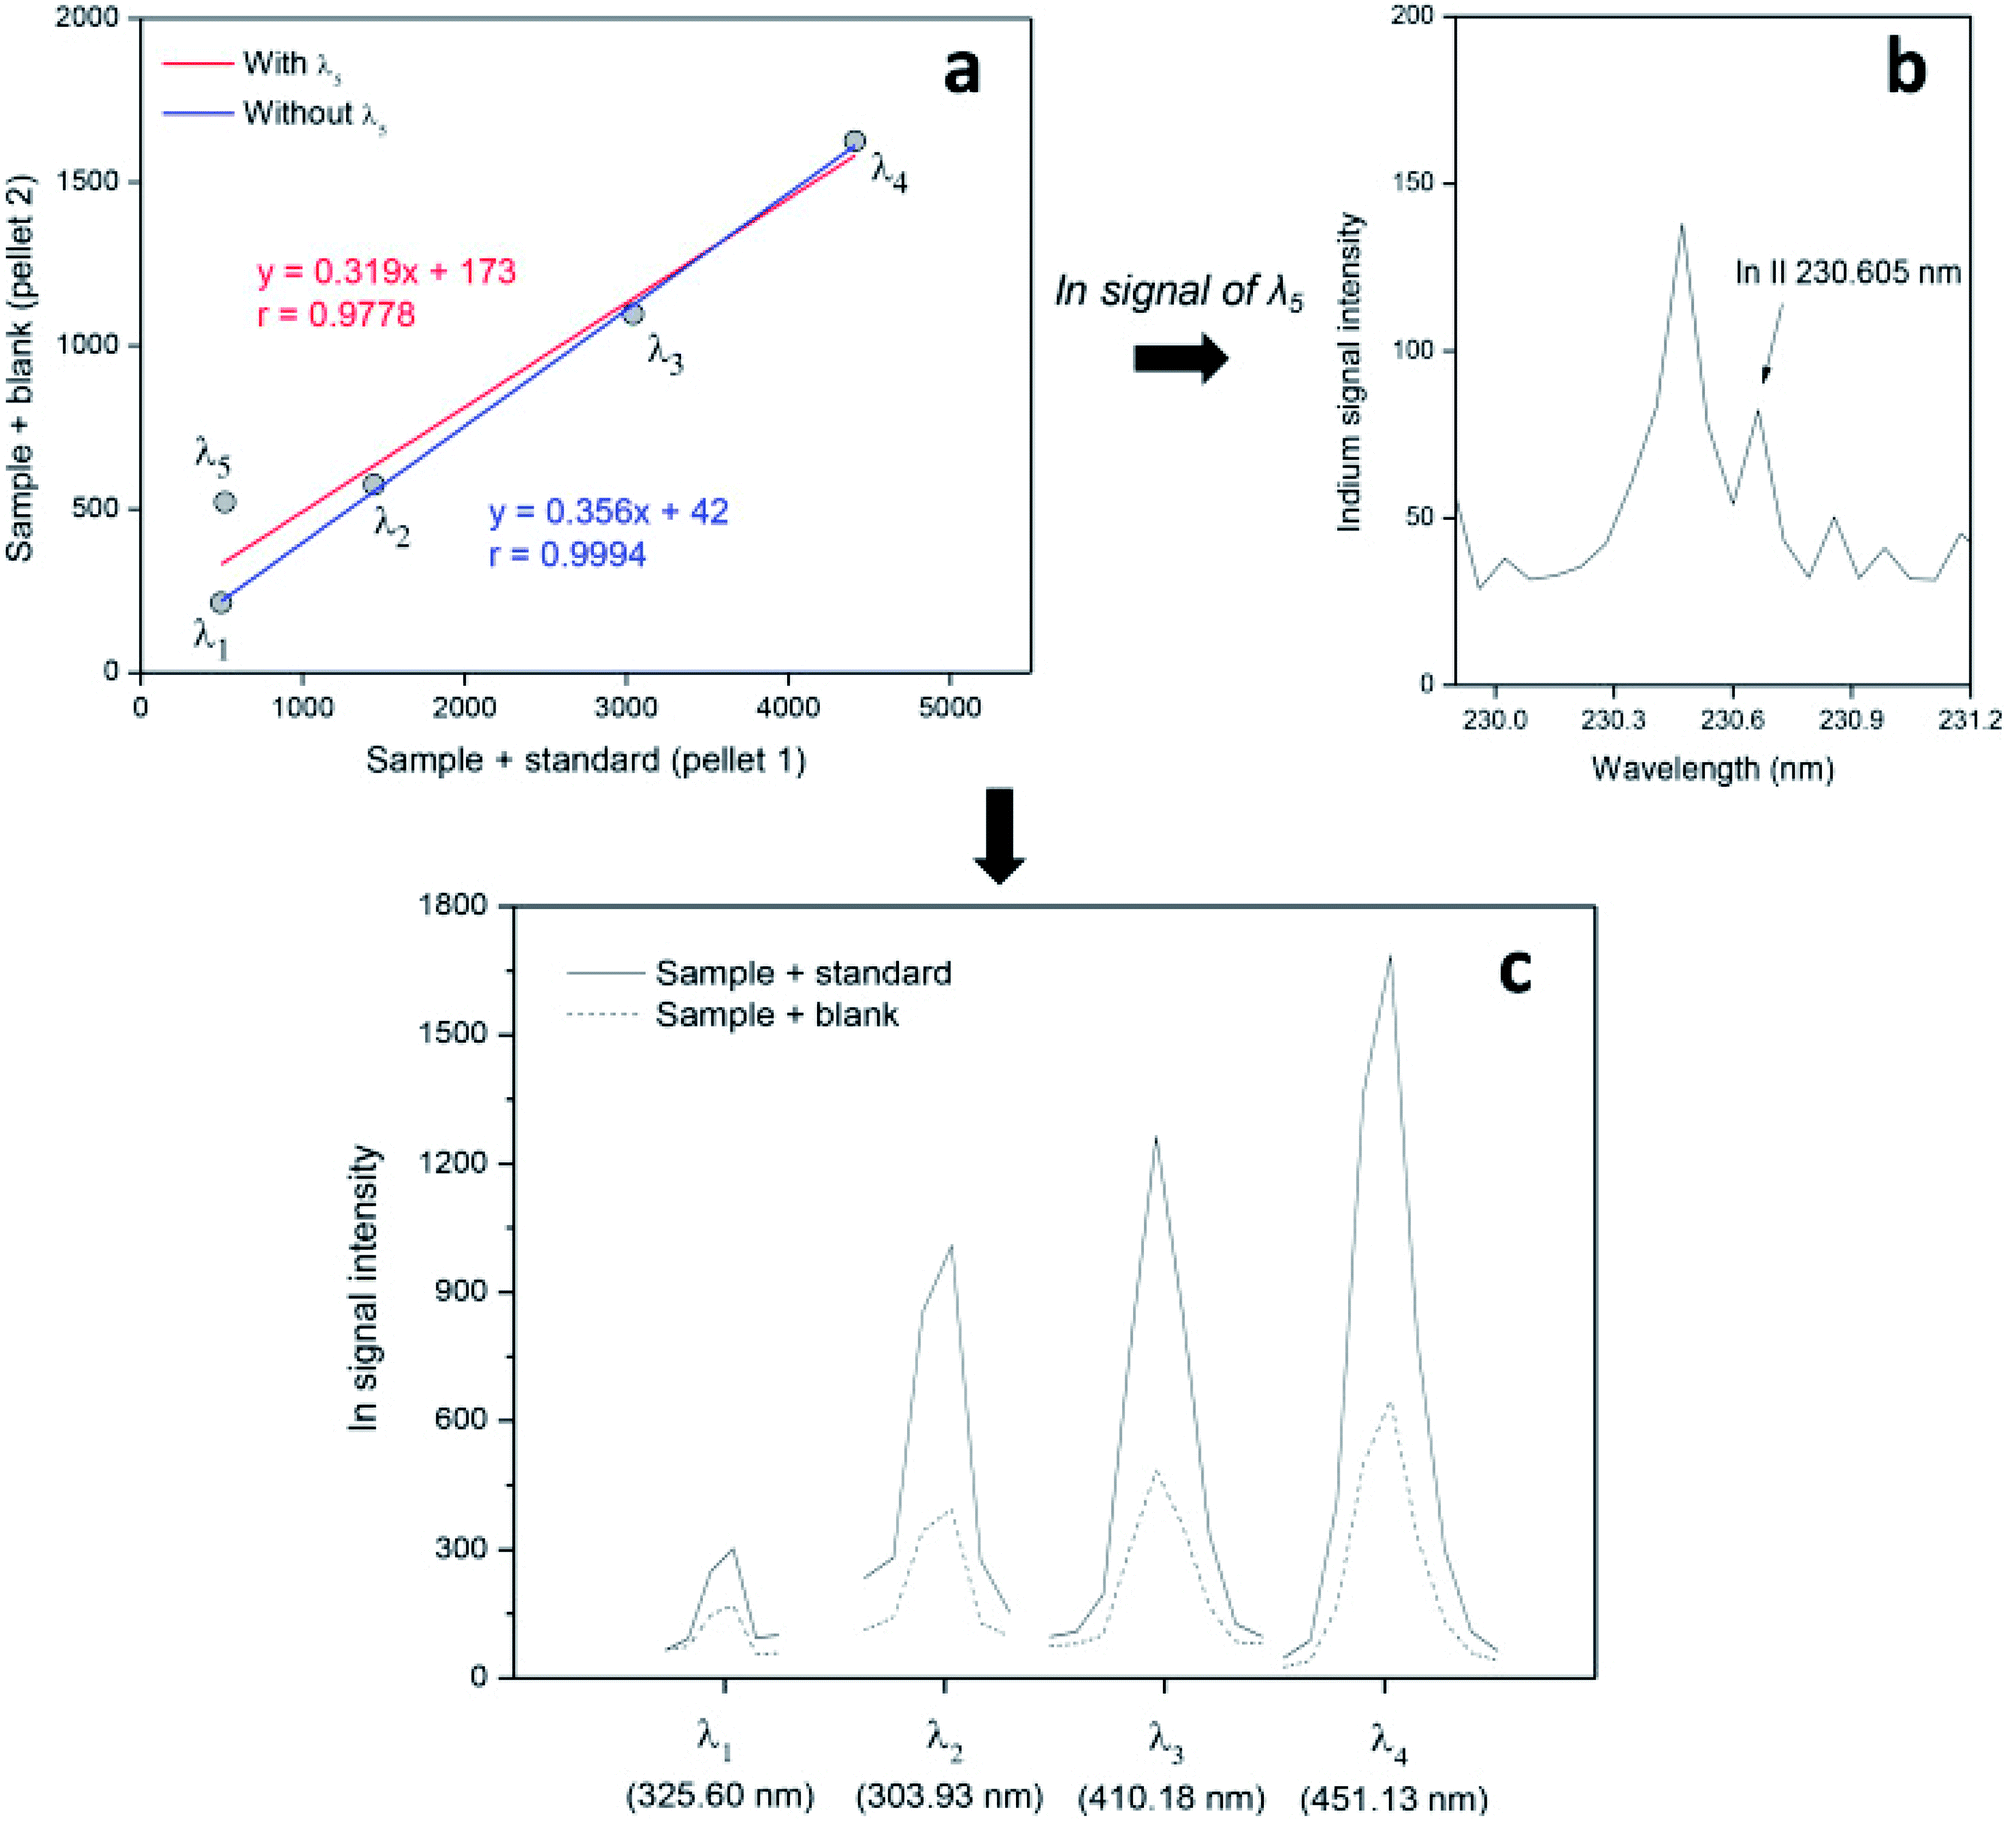
MMC with solid standards and IS are the calibration strategies most commonly used for quantitative analysis with LIBS, XRF and LA-ICP systems (mainly, LA-ICP-MS).25–28 However, to improve the performance of the techniques, increasing their potentialities, new calibration strategies have been investigated. Calibration-free (CF) is a strategy that has been widely reported in the literature for quantitative LIBS analysis of different types of samples.29,30
MEC has also been successfully applied to solid sample analysis by LIBS, with promising results in the determination of Ca, Cu, Fe, Mn and Zn in cattle mineral supplements, Ca, K and Mg determination in dietary supplements and In determination in discarded liquid crystal displays (LCDs) from mobile phones.31–33 In Fig. 2, the emission lines and the multienergy calibration plots used in the determination of Ca (a and b) and Fe (c and d) in cattle mineral supplements by LIBS are shown.31 Another new calibration strategy applied to solid sample analysis by LIBS, one-point gravimetric standard addition (OP GSA), was used for Ca and P determination in mineral supplements, with results comparable to those obtained by MEC, indicating that they are both robust calibration strategies for complex sample analysis.34
 | ||
| Fig. 2 Emission lines and the respective multienergy calibration plots used to determine Ca (a and b) and Fe (c and d) in cattle mineral supplements by LIBS. Reproduced with permission from the Royal Society of Chemistry (https://pubs.rsc.org/en/content/articlelanding/2018/ja/c8ja00109j#!divAbstract).31 | ||
Fig. 3 illustrates a linear model OP GSA curve for Ca and P determination using only two calibration standards.34 For LA-ICP analysis, new approaches using supports with aqueous standard solution for calibration during analyses of samples of different compositions, and using isotope dilution as a powerful calibration strategy, specifically for LA-ICP-MS coupling, have also been reported in the literature.28,35–38
 | ||
| Fig. 3 Linear model for the one-point gravimetric standard addition curve (a) (λ = 213.63 nm) for P and (b) (λ = 396.85 nm) for Ca in mineral supplements for cattle. Adapted with permission from Elsevier (https://www.sciencedirect.com/science/article/pii/S058485471830418X).34 | ||
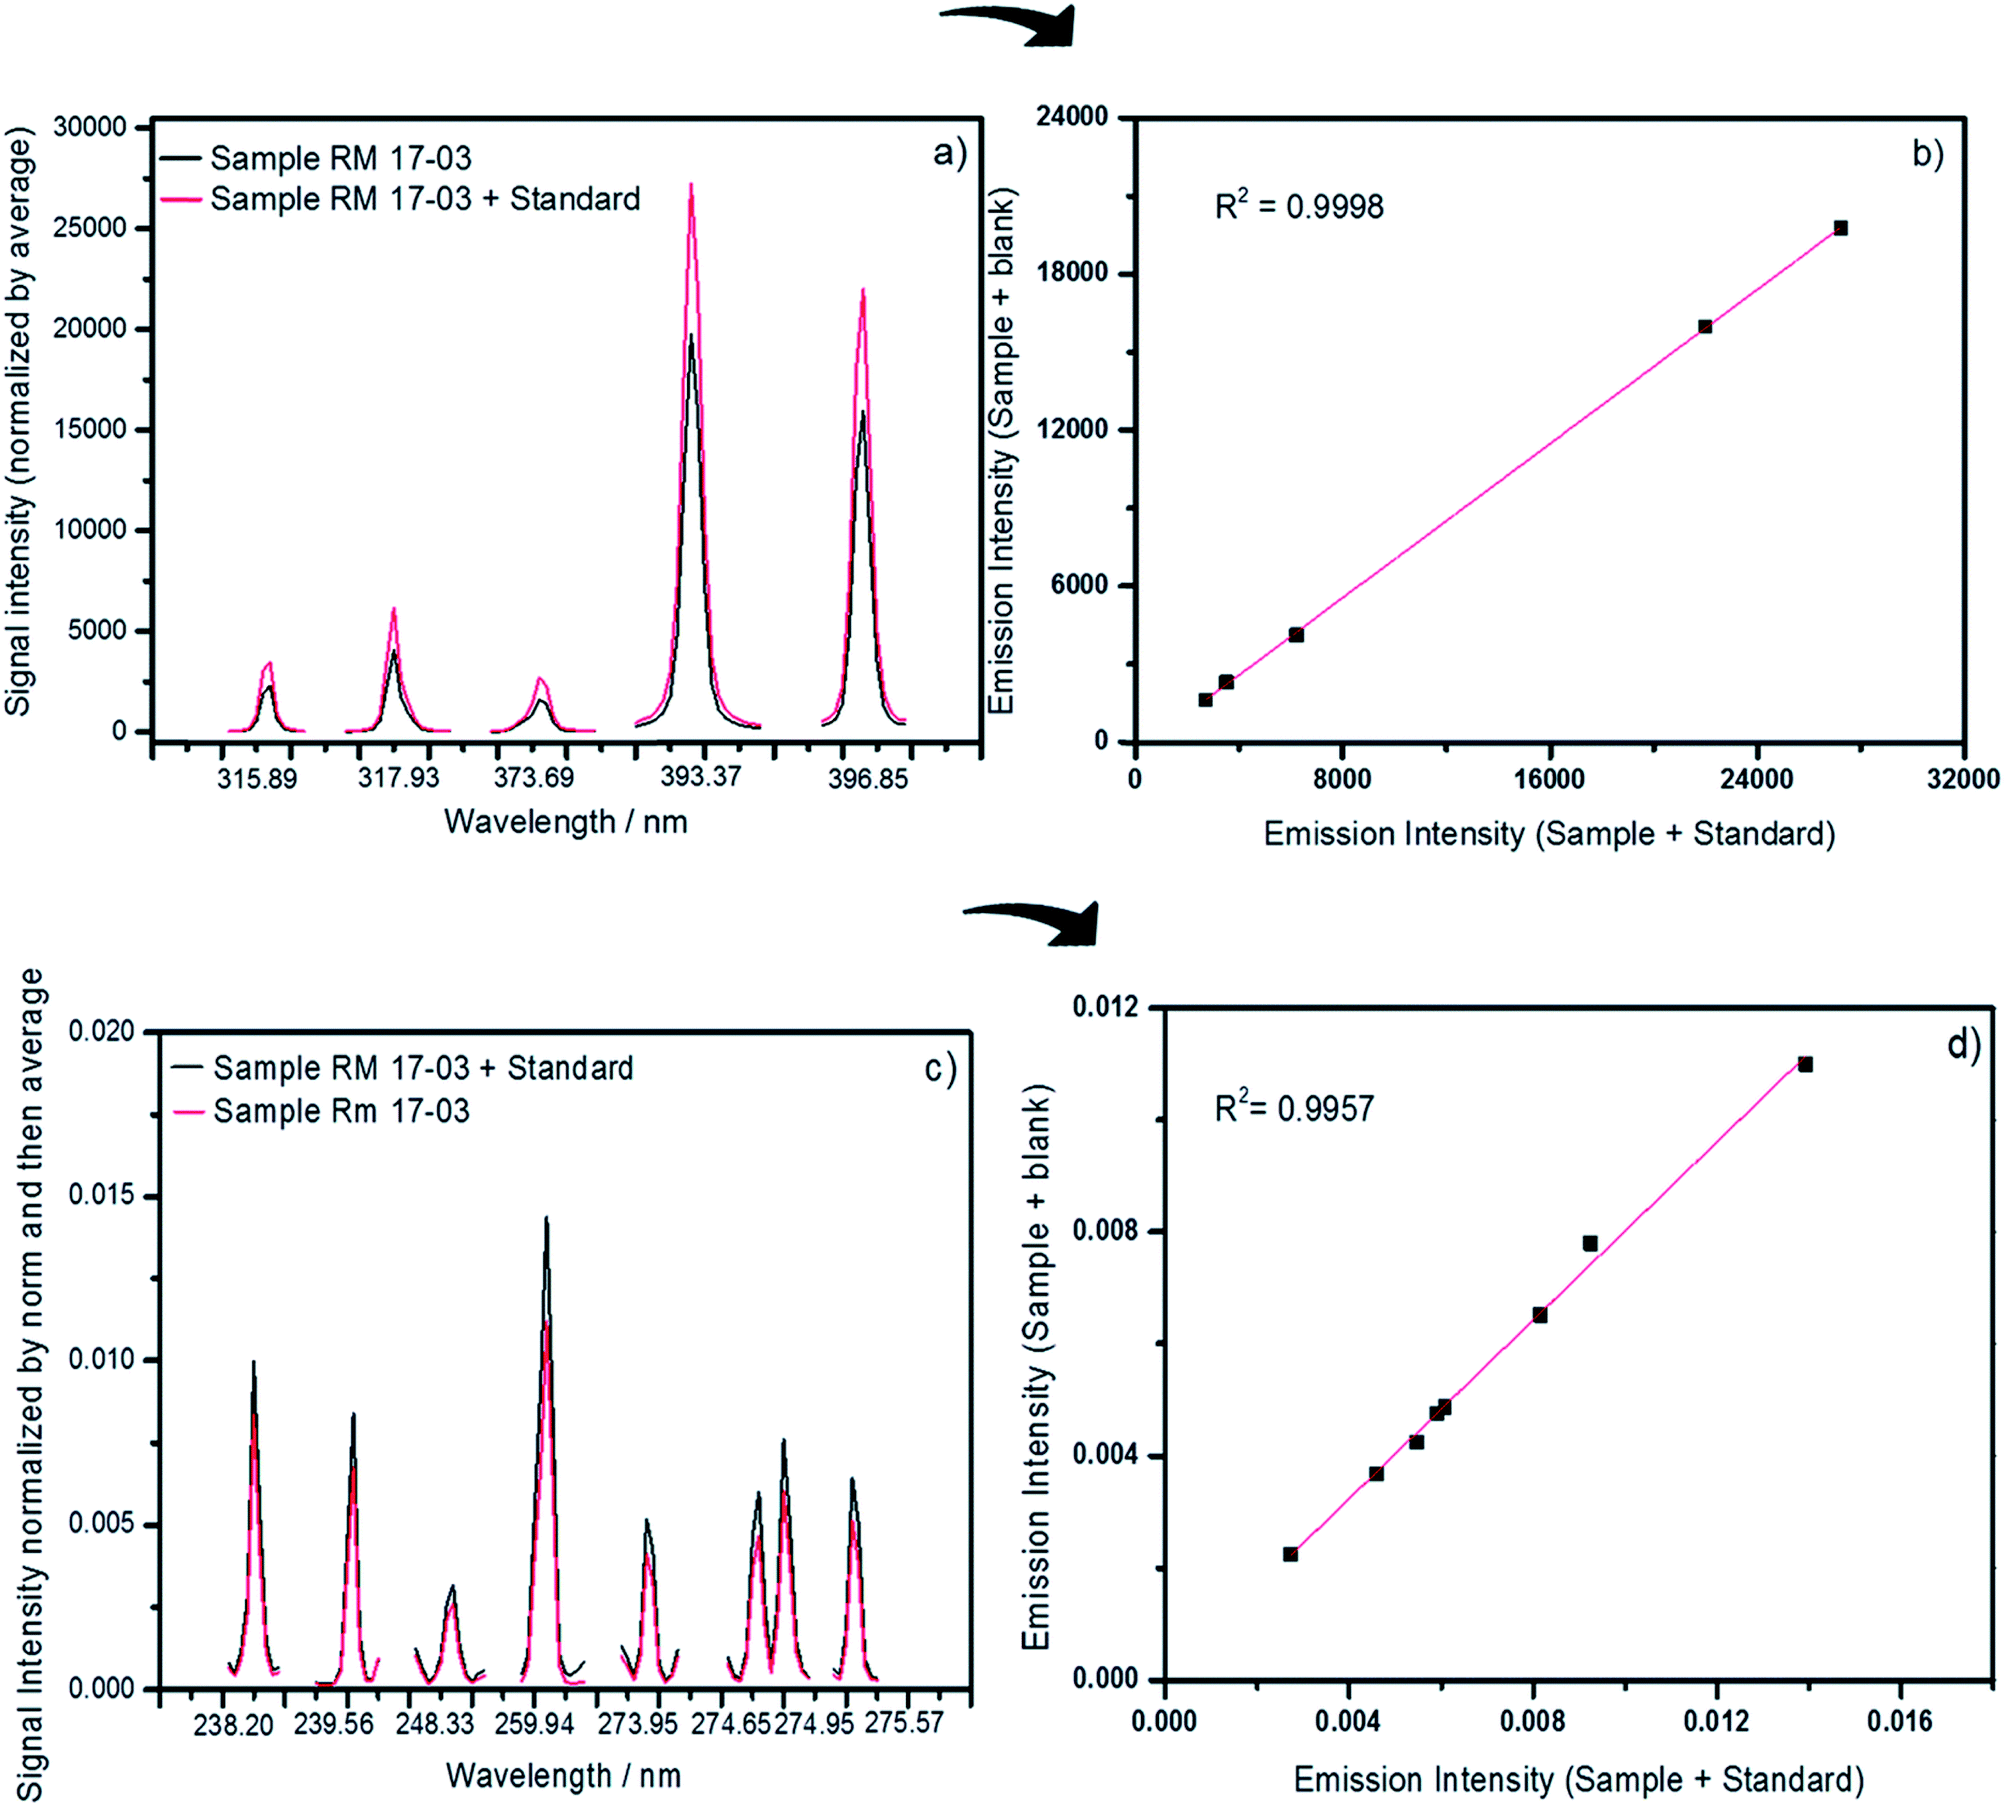
The concern with the calibration aspects of solid sample analysis is directly related to the occurrence of nonspectral interference, specifically matrix effects during the analysis. All the calibration strategies presented here, recent or conventional (with the exception of external calibration, which is indicated only when matrix effects do not exist or are not significant), are important for correcting matrix effects and ensuring that the measurements are more precise and accurate. However, spectral interference can also be a problem for solid sample analysis because it affects the accuracy and impairs the reliability of the results. In this way, a new noninstrumental approach to overcome spectral interference in solid sample analysis has evolved from the MEC strategy, a unique calibration strategy that allows the identification of spectral interference that can be easily eliminated from an outlier point (emission or absorption signals) on the calibration plot.23,24,31,33
In Fig. 4, it is possible to identify the spectral interference on the In signal at 230.60 nm (around 230.5 nm) and see that the linear model (plot) before and after this emission line is ignored, which results in a significant improvement of the correlation for the linear model and the accuracy of the results.33
 | ||
| Fig. 4 Spectral interference in multienergy calibration plots (a and b) and emission lines selected (c) to determine In in LCD samples by LIBS. Reproduced with permission from Elsevier (https://www.sciencedirect.com/science/article/pii/S0003267019302272).33 | ||
Instrumental approaches can also be used to eliminate spectral interference. Since the advent of HR-CS GFAAS instruments, the spectral events that occur in the region surrounding the analyte signal have been observed; that is, spectral overlap caused by diatomic molecules, such as CS, NO, PO and SiO, is detected and can be corrected using the least-squares background correction (LSBC) algorithm in instrument software. As shown in Fig. 5, using LSBC, reference spectra are obtained (Fig. 5b) and subtracted (Fig. 5c) from the sample spectrum (Fig. 5a), leading to methods for solid sample analysis by HR-CS GFAAS that are interference-free.39
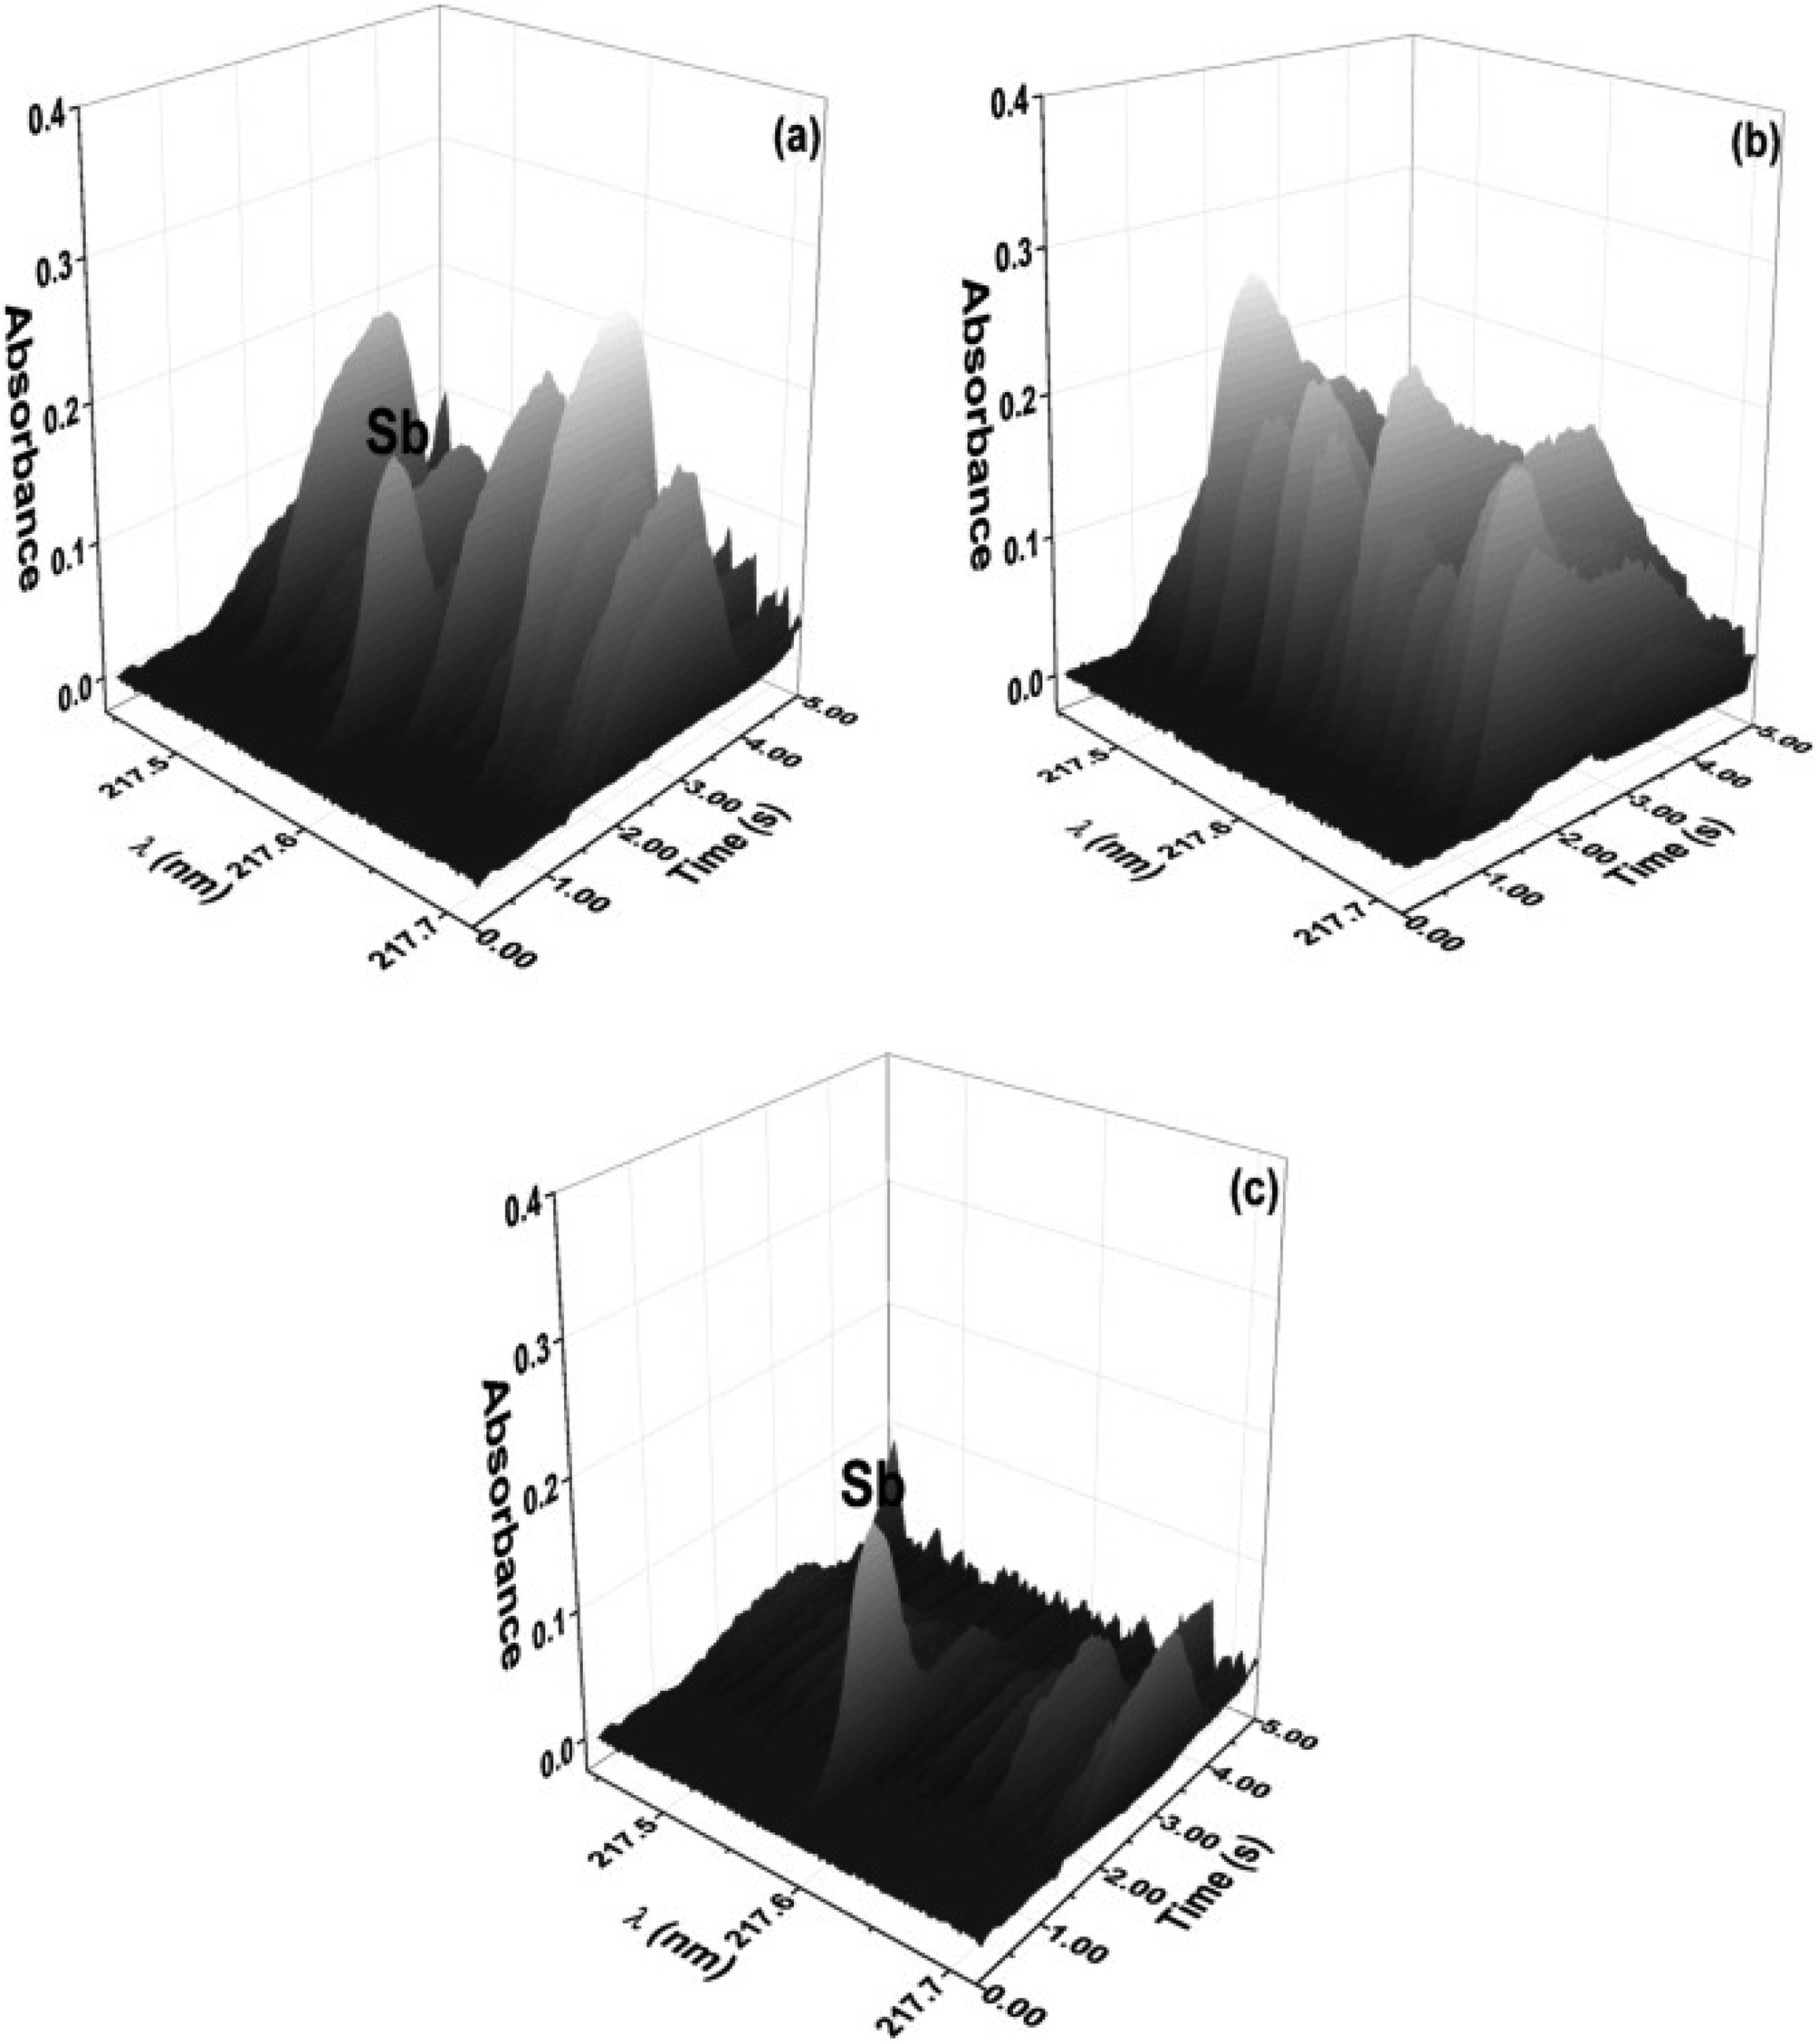 | ||
| Fig. 5 Time-resolved absorbance spectra in the vicinity of the 217.581 nm Sb line for (a) an eye shadow sample (9.1 ± 0.9 mg kg−1) without correction, (b) SiO generated from SiO2, and (c) an eye shadow sample (9.1 ± 0.1 mg kg−1) after correction with LSBC. Reproduced with permission from Elsevier (https://www.sciencedirect.com/science/article/pii/S0039914016306865).39 | ||
Advances in ICP-MS instrumentation led to the development of the ICP-tandem mass spectrometer (ICP-MS/MS), which contains a traditional quadrupole and a collision–reaction cell (CRC) inserted before an additional quadrupole mass filter.40 This system became important for avoiding spectral overlap during ICP-MS/MS analysis, and when coupled to laser ablation (LA-ICP-MS/MS systems), it is considered a powerful tool for solid sample analysis.41 This instrumentation is expensive and requires a higher level of expertise for method development when compared to the prior systems; therefore there are only a few studies that have used the system.
The potentialities of LA-ICP-MS/MS were evaluated for the first time in the following study, in which the authors evaluated the capabilities of this technique for elemental bioimaging (EBI) of trace Zn in prostate cancer and P and Se distributions in mouse brain sections. The use of dry plasma and the presence of gases such as O2 and a O2/H2 mixture in the CRC were strategies to eliminate spectral interference during LA-ICP-MS/MS analysis. Fig. 6 shows the Zn distribution (on mass) in a prostate cancer biopsy sample, and Fig. 7 shows the P and Se distribution (mass shift – 31P → 31P16O; 80Se → 80Se16O) in the mouse brain section, both interference-free.42 Another relevant use of LA-ICP-MS/MS for solid sample analysis is to obtain information from isotopic analysis using geochemical information and geochronological dating (Rb/Sr dating) for Sr isotopic analysis of geologic samples with high Rb/Sr ratios.43
 | ||
| Fig. 6 Zn distribution in a prostate cancer section analyzed by LA-ICP-MS/MS in the presence of O2. Reproduced with permission from the Royal Society of Chemistry (https://pubs.rsc.org/en/content/articlelanding/2016/ja/c5ja00293a#!divAbstract).42 | ||
 | ||
| Fig. 7 (a) 80Se → 80Se16O image and (b) 31P → 31P16O image of a mouse brain obtained with LA-ICP-ICP-MS/MS in the presence of O2/H2. Reproduced with permission from the Royal Society of Chemistry (https://pubs.rsc.org/en/content/articlelanding/2016/ja/c5ja00293a#!divAbstract).42 | ||
The aforementioned scientific advances developed numerous methods for solid sample analysis. Many challenges have been overcome, but as each analytical technique has its own characteristics, some aspects and discussions are specific. In Fig. 8, the different methods and procedures for solid sample analysis are summarized and Table 2 presents the typical analytical characteristics of the techniques used for SS analysis which will be described in the next sections. It is important to highlight that some information, such as limits of detection, can be changed from the use of different instrumental and experimental conditions for GFAAS and HR-CS GFAAS and also different mass analyzers for ICP-MS.
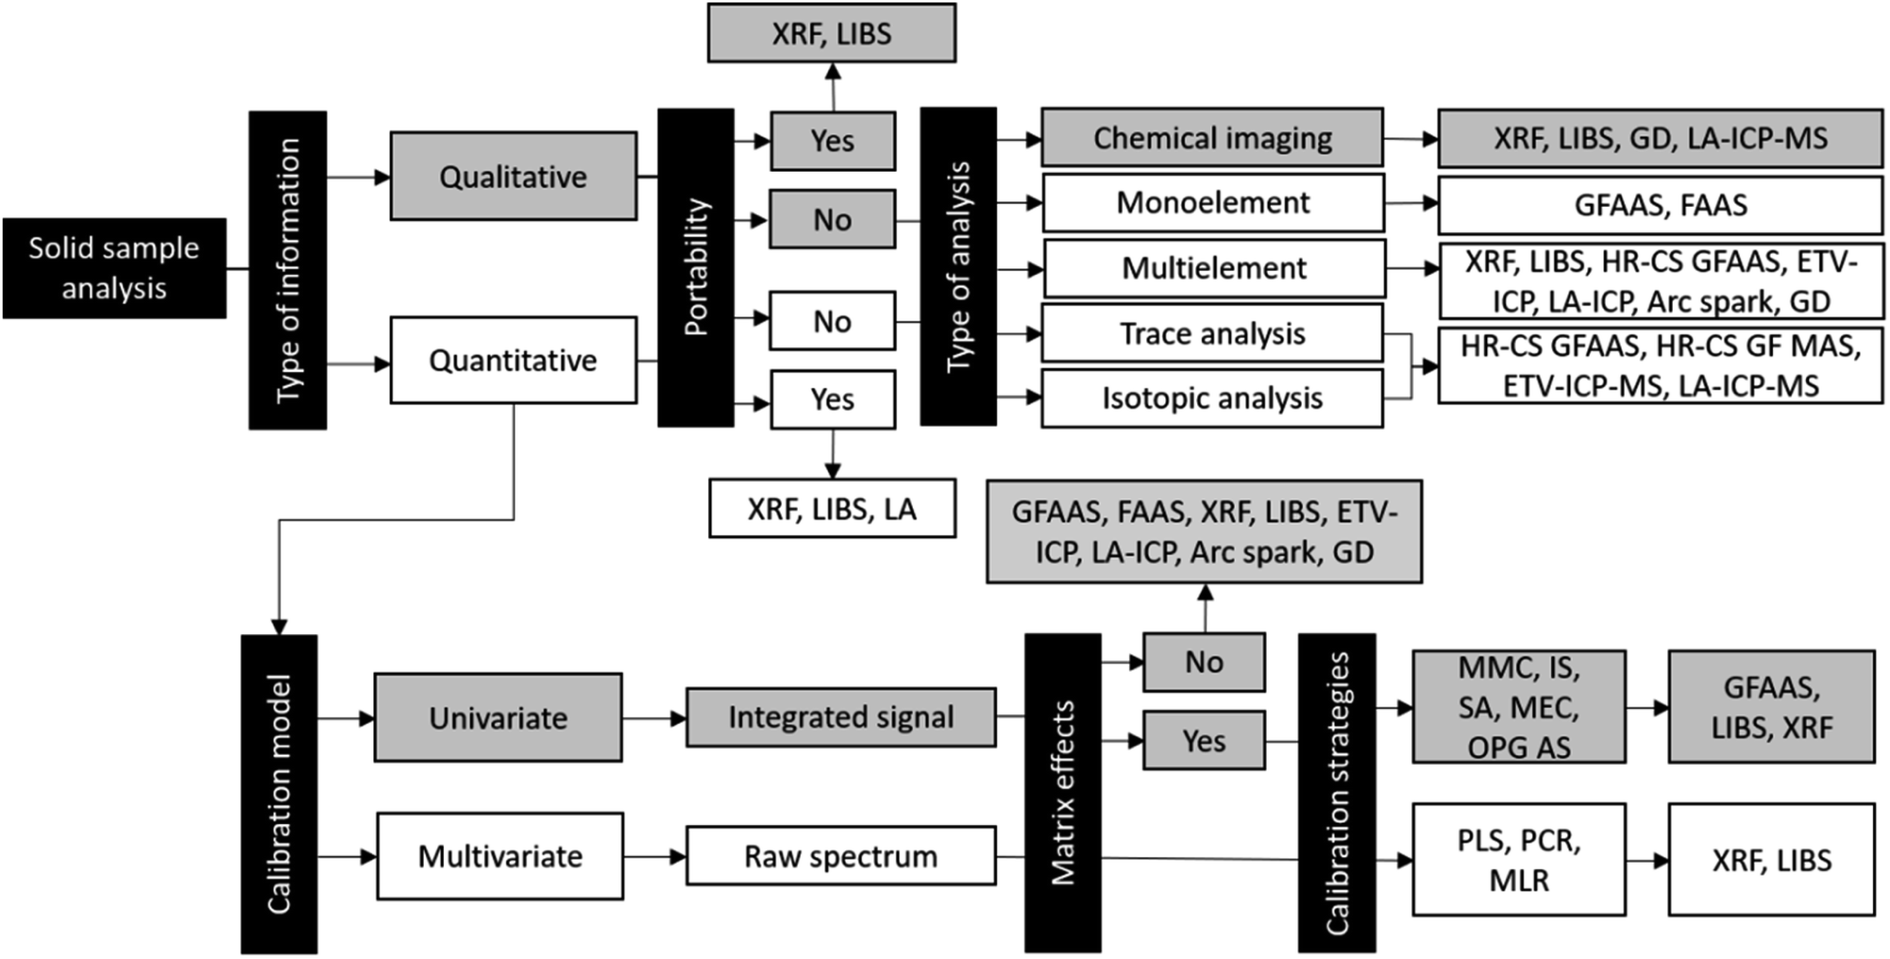 | ||
| Fig. 8 Different methods and procedures for direct solid sample analysis. | ||
| GFAAS/HR-CS GFAAS | ETV-ICP OES/ETV-ICP-MS | LA-ICP-MS | LIBS | XRF | GD-OES/GD-MS | Arc OES/spark OES | |
|---|---|---|---|---|---|---|---|
| Limit of detection | 0.0005–0.005 μg g−1/0.0001–0.001 μg g−1 | 1–10 μg g−1/0.005–0.050 μg g−1 | 0.001–0.010 μg g−1 | >100 μg g−1 | 10–100 μg g−1 | 1–100 μg g−1/0.1–1 μg g−1 | 1–10 μg g−1/10–100 μg g−1 |
| Mass amount | 0.1–5 mg | 0.1–1 mg | 0.0001–0.01 mg | 500 mg | 500 mg | 10–100 mg | 1–10 mg |
| Imaging capability | No | No | Yes | Yes | Yes | Yes | No |
| Isotopic information | No/yes | No/yes | Yes | No | No | No/yes | No |
| Multielemental analysis | No/yes | Yes | Yes | Yes | Yes | Yes | Yes |
| Precision (RSD) | 5–15% | 5–15% | 5–25% | 5–30% | 5–30% | 5–10% | 5–10% |
3. Development of methods for solid sampling using different analytical techniques
In the following topics, the main advances in the analytical techniques most frequently reported in the literature for SS, including instrumental advances, will be presented.3.1 Atomic absorption spectrometry: solid analysis in flame and graphite furnace atomizers
Atomic absorption spectrometry (AAS) is a technique that has interesting characteristics relevant to the development of analytical methods using solid analysis. Among these characteristics, the following are highlighted: (i) simple instrumental arrangement (which confers a lower cost of the equipment compared to other spectrometric techniques); (ii) high selectivity and specificity; (iii) reduced spectral interference caused by overlapping of molecular lines and bands of other elements and molecules since there are significantly fewer absorption lines than emission lines; and (iv) excellent robustness of atomizers (mainly for the graphite furnace) for the elimination of the matrix constituents of the sample. All the advantages mentioned can be explored with success for the analysis of solid samples by AAS.1,44–47 However, one of the main limitations is monoelement determination, which can compromise the analytical throughput if a high quantity of analytes needs to be determined in several sets of samples.1With the development of a high-resolution continuous source atomic absorption spectrometer (HR-CS AAS), the monitoring of the molecular absorption (by molecular absorption spectrometry, HR-CS MAS) also became possible using the same instrument was possible, provided by the use of a double-echelle monochromator, a high-pressure xenon short arc lamp (whose emission occurs in the continuous range from 190 to 900 nm) and a detector consisting of a linear array of sensitive charge-coupled devices (CCDs) in the ultraviolet region.44,48–50 In addition, new possibilities for the analysis of solid, complex and difficult-to-decompose samples have arisen using these techniques. The obtaining of three-dimensional data (absorbance as a function of time and wavelength),21 structured background correction using the LSBC algorithm (widely used in the direct analysis of complex samples),39,44,51 multielemental and simultaneous determination when the absorption lines of the analytes are in the monitored spectral window,21,52 and isotopic analysis via diatomic molecular monitoring53–56 have provided great advances in the analysis of solids by AAS and MAS.
The introduction of solid samples into atomizers can be performed by slurry or by direct sampling of the pulverized sample with a controlled particle size, either in a flame (FAAS) or in a graphite furnace (GFAAS).44 The homogenization of the sample is an important process of preparation for microanalysis of solid samples since small amounts are analyzed (≤10 mg), and it can be achieved by a suitable sifting or/and milling procedure. The analysis of a large amount of sample may impair the release of the analyte from the matrix and/or hinder the vaporization and/or atomization of the analyte; if the analyte is not homogeneously distributed in the matrix, the small amount of sample may not represent the whole sample.45 It is necessary to calculate the homogeneity factor He, proposed by Kurfürst, as can be seen in eqn (1):
| He = SH × m1/2 | (1) |
In the analysis of solid samples, the analyte and matrix are integrally present in the same portion to be analyzed, requiring an efficient matrix elimination procedure in the atomizers so that the matrix does not influence the formation of the atomic/molecular cloud and, consequently, the analytical signal. Efficient matrix removal can be achieved by knowing the atomization mechanism, the physico-chemical properties of the analyte, and some intrinsic characteristics of the sample.57 When atomization occurs in a flame, the use of a flame with reducing or oxidizing character may influence atomization processes. In graphite furnaces, the use of chemical matrix modifiers and pyrolytic graphite platforms may contribute to the efficient elimination of the matrix and stabilization of the analyte during the pyrolysis step.44,57 The proper use of chemical matrix modifiers, such as a solution of magnesium nitrate and Pd (considered universal matrix modifiers),44,57 and the recently used Pd and Au nanoparticles (for the determination of Hg in soil sludges, blood and urine),58,59 contributes to obtaining measurements with suitable precision and sensitivity for the analysis of solid and liquid samples by GFAAS.
In the next paragraphs, we present some interesting SS applications in FAAS. The use of SS in FAAS was initially proposed at the end of the twentieth century, when researchers presented some devices for introducing solid samples into a flame to perform the atomization of the analyte.57,60
Other studies were developed, such as that performed by Flores et al.,7 which used air + acetylene flame (reducing flame) as an atomizer and a T-shaped quartz cell positioned above the burner in the optical path to perform direct SS flame atomic absorption spectrometry (SS FAAS) in bovine liver reference material analysis for Cu determination.
Flores et al.61 analyzed biological samples (particle size ≤ 80 μm) using SS FAAS and MMC to determine Cd with good precision (RSD ≤ 6.7%). SS FAAS and partial least squares (PLS) regression were used by Flores et al.,62 to determine Cd in marine and river sediment samples. In another study, Flores et al.63 directly analyzed coal samples (particle size ≤ 50 μm) in a flame and determined Mn with a RSD < 6.0%.
Costa et al.64 proposed a method of trace determination of Cd (LOD 0.23 μg g−1) in biological samples (bovine and chicken liver), trapping 7 mg of samples in small paper capsules that were introduced into a quartz cell by heating with an air–acetylene flame. It is important to mention that besides these applications, FAAS is not a technique that is commonly used for SS analysis.
Using the slurry analysis as a way to introduce solid samples into atomizers, the GFAAS technique stands out in its number of applications described in the scientific literature due to its arrangement and instrumental advances, such as a continuum source, Zeeman and Smith (different from flame atomizers), and improved background correction. With a suitable heating procedure for the graphite furnace, it is possible to efficiently remove the sample matrix during the pyrolysis step.1
Slurry sampling was a successful strategy for the introduction of many complex and/or difficult-to-decompose samples into flame and furnace graphite atomizers, for example, sediments,65,66 soil,58,66 sludge,58 coal,67 fertilizers and limestone,68 vegetables,69 tuna fish,70 wheat flour,71 infant formula,72 antibiotic tablets,73 human hair,74,75 bones,76 and advanced materials.77
As previously mentioned, the intrinsic characteristics of HR-CS GFAAS make this technique the most commonly used for solid analysis by monitoring atomic absorption. The graphite furnace atomization allows good sensitivity and efficient removal of the sample matrix employing appropriate chemical modifiers (permanent or aqueous solution modifiers).44,78
There are studies that have proposed different ways of introducing solid samples such as discrete analysis on graphite platforms39,51 and the method proposed by Colares et al.,79 who used disposable thermoplastic starch (TPS) platforms prepared with corn starch and sorbitol for the introduction of different solid samples (CRMs) into a graphite furnace. In this study, in the pyrolysis step, the platform and the matrix were eliminated, and the analytes Mo and V, which are refractory, were deposited on the wall of the graphite furnace. In the atomization stage, there is a greater efficiency in the heat transfer from the graphite furnace to the analytes than in the use of permanent pyrolytic graphite platforms, resulting in increased atomization efficiency and analytical sensitivity.79 This approach shows an interesting advance and different possibilities for introducing solids into the atomizer for the determination of refractory analytes and could also be used for other applications and analytes due to the low cost of production of TPS when compared with graphite platforms.
In addition, an interesting strategy of sampling environmental and clinical samples is reported in the literature: the conversion of liquid samples into solid supports to be introduced into the atomizer, such as for the direct analysis of solvent bars used for Ag microextraction from seawater samples,80 carbon nanotubes used for preconcentration of Au from digested geological samples,81 and clinical filter paper containing urine to determine Mo and Ti simultaneously by SS HR-CS GFAAS82 and containing whole blood to determine Pb by SS GFAAS.83 These strategies provide increased analyte stability in the sample when present in the solid support, which makes it possible to increase the storage time of the sample for analysis and to increase the sensitivity of the method because in some cases, the analyte is preconcentrated.
Another possibility is to determine nonmetals by monitoring fine rotations of diatomic molecules by HR-CS MAS48,84–86 and using SS, for instance, in the determination of Cl by the direct analysis of cement87 and several other solid samples (via CaCl molecules),88 F in fish and seafood (CaF),89 P in biological reference materials (PO),90 and S in polymers, steel, petroleum, coke and biological CRMs (monitoring the molecule CS).91 In addition, studies have demonstrated the possibilities of isotopic analysis and its advances in monitoring diatomic molecules in solid samples, as in the study of Nakadi et al.,56 where the authors determined Br (via Ca79Br (600.492 nm), Ca81Br (600.467 nm), and CaBr (600.422 nm)) in poly(vinyl chloride) and tomato leaf samples using isotope dilution for calibration and SS HR-CS GF MAS.
Direct simultaneous determination is another important application of HR-CS GFAAS that has boosted the use of this technique, as in the direct analysis of fluoropolymers and vegetables (Fe and Ni),92,93 plant materials (Mo and Ni, using Co as the internal standard),22 and soils (Co and V);94 the sequential and simultaneous determination of Cd, Cr, Fe and Al (via AlH molecules)95 and the analysis of fuel fly ash (V, Ni and Fe),96 carbon nanotubes (Co, Fe, Ni and Pb)97 and other samples. Simultaneous elementary monitoring has enabled the use of other calibration strategies in HR-CS AAS and HR-CS MAS that have not been widely explored, such as the use of IS,22,98 isotope dilution,56 and recently MEC.23
Although multielement determination and direct analysis by AAS is well established, instrumental advances are being made to enable the monitoring of analytes in a larger spectral window than those currently available. Thus, Geisler et al.99 used a modular simultaneous echelle spectrograph (MOSES), enabling simultaneous monitoring of analytes in the spectral window from 193 nm to 390 nm, and, recently, Labusov et al.100 developed a prototype HR-CS GFAAS spectrometer for simultaneous multielement determination. The spectral instrument consists of two parallel working Paschen–Runge polychromators with resolutions of 10 and 30 pm in the wavelength ranges from 190 to 350 and 350 to 780 nm, respectively, and two assemblies of 14 linear CCD arrays each, which could solidify AAS as a multielement and simultaneous technique for solid analysis.
3.2 Electrothermal vaporization for sample introduction into plasmas (ICP OES and ICP-MS)
For simultaneous multielement determination, ICP OES and ICP-MS are the most commonly used techniques due to their accurate and precise analysis, low limits of detection (LODs), and versatility regarding different types of samples. On the other hand, these techniques require a dissolution step, as sample preparation can be laborious, with high reagent and time consumption (and waste generation), in addition to analyte loss and possible sample contamination. In this context, ETV-ICP OES and ETV-ICP-MS are a direct solid sample introduction system that eliminates or reduces the sample preparation step and can be coupled with ICP OES and ICP-MS to increase its potentialities.1,101The versatility of the coupled ETV-ICP OES and ETV-ICP-MS allows the analysis of small liquid, slurry, and solid samples. In addition, the sample vaporization in the pyrolysis step and the use of chemical modifiers can drastically reduce the interference from the matrix.11,102,103
Usually, the surface for sample introduction is composed of graphite platforms that permit the vaporization of samples and some interesting contributions to the field of furnace design were made, for example, in the study of Goltz and Salin in 1997,104 where an induction heating-electrothermal vaporization furnace was developed for sample introduction in plasma sources. It consisted of a graphite cup inserted in an induction coil (inductively heated vaporizer). With radiofrequency (Rf) power application to the coil, the graphite cup was heated, and the vaporized sample was transported to the plasma. This design permits the use of increased sample sizes, improving LODs and minimizing sample homogeneity concerns. Another contribution for the ETV-ICP OES was developed by Trenin et al.,105 who used an upstream configuration with carrier gas flow directed into a vertical tube, reducing the analyte loss and improving the transport efficiency.
The analyte transport efficiency is another important aspect. Kántor60 described this process based on aerosol science in 1988; it was necessary for rapid self-nucleation of large particles to occur for their efficient transport by the carrier gas, but the particles also had to be small enough to avoid coagulation or deposition in the path. The most notable contribution to this point, made by Shen et al.,106 was the addition of a cooling argon flow at the exit of the ETV-ICP-MS system, promoting the self-nucleation of the analyte vapors before they entered the transport tube. After this advance, Ren and Salin107 modified the design, so the furnace was lined by four holes drilled in one of the graphite contact rings. A gas flow was introduced into these holes, acting as a cooling gas to promote aerosol formation, and another fraction was moved to a gap between the graphite contact and the transport tube, increasing the transport efficiency and reducing the matrix effect. In recent years, the same design but with some additional improvements has been used.107
A challenge in ETV-ICP OES and ETV-ICP-MS is the variability of transport efficiency when the elements present different volatilities or matrices. Grégoire and Sturgeon108 showed that the addition of modifying reagents improves and normalizes the transport efficiency for all elements in addition to reducing the matrix effects, simplifying the calibration process. In this case, the authors showed experiments with and without a modifier in which the transport efficiency increased up to 25% with the addition of Pd/NaCl (modifier/carrier), ensuring a perfect interaction between the modifier and the element.
One of the most common and effective modifiers used for interacting with analytes is palladium and as a permanent modifier, iridium, both allow increased pyrolysis temperatures without analyte losses. Other modifier types are halogenating agents, which are useful when refractory analytes are present, permitting efficient vaporization at decreased temperatures. Chelating agents are other possible modifiers; in addition to permitting the vaporization of the complexed elements at lower temperatures, they make it possible to obtain a selective reaction/vaporization for potential speciation. Carbon-producing reagents are other options that improve plasma energetic conditions and transport efficiency.19,109–111
Despite the advantages mentioned, there are some difficulties in the use of ETV-ICP OES and ETV-ICP-MS such as the limited amount of sample that can be analyzed, causing reduced reproducibility, and difficulty in processing the transient signal, memory and matrix effects.1,112,113 Recently, Kaveh and Beauchemin101 modified a SS-ETV-ICP OES system through a switching tee between the ETV furnace and a sheathing device connecting the nebulization/pre-evaporation system to the ICP torch. The goal was to remove the matrix products during pyrolysis (ashing step) and introduce a vapor containing the analytes into the ICP during vaporization, where the aerosol is heated by infrared energy. This system allows the introduction of more than twice the previous amount of solid sample without extinguishing the plasma, improving the LODs. Another advance to improve sensitivity and LODs in ETV-ICP OES was to use an Ar–N2 mixed plasma gas, in which N2 was added to plasma gas and into the central channel of the plasma to make it more robust. Even after the pyrolysis step for sample decomposition in the ETV furnace, this robust plasma contributes to improving the particle decomposition, resulting in transient signals, larger peak areas and low limits of detection.112
A recent development in ETV-ICP-MS systems was made by Wohlmann et al.114 for direct Hg determination in soil. The system consists of a high-power lamp contained in a glass chamber with solenoid valves that control the flow of Ar gas during pyrolysis and vaporization. This glass tube is positioned just above the sample where the analyte vapor is extracted, reducing the memory effect. With this method, the time of analysis is reduced (60 s per sample), and the risk of contamination and analyte losses are lower than those in techniques with sample extraction.
Since the first electrothermal vaporization device (designed in 1985), there have been many publications featuring different advances to improve the efficiency of this technique. However, in the beginning of the 2000s, the perspective changed with a decline in its use. This decline can be related to the evolution of other techniques, such as ICP-MS with quadrupole-based units equipped with collision/reaction cells. Another possible reason for this observation is the fact that there is only one company that produces this equipment commercially, increasing its cost and inaccessibility. Therefore, the electrothermal vaporization is not considered a “standard” system for sample introduction into the ICP but a second option when the analytical problem cannot be solved easily with other strategies.19
An important aspect of direct solid sample analysis is the calibration being crucial; it is impossible to find one calibration method for all analytes in any kind of sample.102,115 In many cases, the matrix effect cannot be fully eliminated, and new calibration methods are required. MEC and OP GSA are examples of calibration methods that have been used successfully in other techniques for direct solid sample analysis, but there is no paper reporting these calibration approaches for ETV-ICP OES and ETV-ICP-MS systems.23,34
In recent years, different types of samples have been analyzed using ETV-ICP OES. The most developed methods reported good sensitivity, a high sample throughput and overcoming nonspectral interference. Among the analyzed samples, we can highlight alloy,116 high-purity cadmium,117 automotive paint chip,118 soil119 and plastic120 samples. Another differential is the use of Freon gas (CCl2F2 and R-12) to promote the efficient vaporization of the analytes, as reported by Kaczala et al.121 and Santos et al.,122 during pharmaceutical and medicinal plant analysis. Several analytical methods were also developed for ETV-ICP-MS analysis.19,123 Cereal and road dust were analyzed by slurry sampling for the determination of Cr, Fe, Cu, Zn and Se (cereals) and precious metals, such as Pd, Rh, Pt, and Au (road dust).124,125 Rare earth elements (REEs) were determined in graphite samples in the presence of a modifier gas, Freon R-12, to promote the vaporization enhancement for all analytes during analysis.126 In another study, the authors developed a microelectrothermal vaporization method using a rhenium filament and a quartz glass ETV furnace. This new system was coupled to a multicollector MC-ICP-MS for the accurate and precise measurement of 182W/183W isotope ratios in three iron meteorite samples, without a memory effect for W in the ETV furnace.127
3.3 Laser ablation for sample introduction into plasmas (ICP OES and ICP-MS)
Laser ablation has been widely investigated as a powerful analytical technique since 1981, mainly due to the possibility of direct analysis of solids with minimal or no sample preparation without the need for conventional dissolution methods such as acid extraction and decomposition. In addition, only picograms and femtograms of the sample are consumed during the analysis.128,129In addition to being attractive for direct solid analysis, the laser ablation system allows coupling with other analytical techniques. In this sense, there are two primary approaches for detecting the ablated mass: (i) entraining the ablated aerosol into a gas stream with delivery to a secondary source and (ii) measuring the photons emitted by the optically induced plasma at the sample surface.130
With regard to the first approach, the techniques ICP OES and ICP-MS are based on the transport of the ablated aerosol.131,132 In 1981, Thompson et al.133 proposed for the first time and successfully coupled an LA system and an ICP OES, and this system became known by the acronym LA-ICP OES. However, the work of Gray et al.134 made laser ablation better known. In this study, the authors coupled LA and ICP-MS, and this system became known by the acronym LA-ICP-MS. For the second approach, based on measuring optical emission in the plasma, the techniques LIBS and laser-ablation molecular isotopic spectroscopy (LAMIS) are used in combination with laser ablation.135 According to the Web of Science database, approximately 91% of the publications with laser ablation use ICP-MS as a source of ionization and detection. As a result, our focus will now be on advances in LA-ICP-MS.136
The laser ablation sample introduction systems in ICP-MS play an important role in the analytical performance of the technique and are among the most innovative results in the search for alternative solutions to analytical problems.8 This system has several advantages over solution pneumatic nebulization by ICP-MS: (i) less labor-intensive treatment of the sample; (ii) smaller risk of introducing impurities with reagents; (iii) low sample consumption; (iv) minimize the impact of polyatomic interference caused by solvents from the introduction of a much more dry aerosol formed after the ablation; (v) the ability to map and investigate the spatial distribution of elements in a sample with high spatial resolution. In addition, one of the main advantages of LA-ICP-MS is obtaining dry plasma conditions.137 Compared with the conditions obtained by analysis with pneumatic nebulization, these conditions result in an increase in the electronic density. These benefits allow a high sensitivity with LODs on the order of ng g−1. Furthermore, this technique allows multielement analysis in a concentration/content range covering up to 9 orders of magnitude.137,138
The increasing demand for the direct analysis of solid samples by techniques with a high sensitivity led to the improvement of the LA-ICP-MS technique. This system has been established as a powerful tool for direct analysis in attempts to meet demands such as speed, sensitivity, spatial resolution and multielement capacity. Laser sources for LA-ICP-MS have improved since the mid-1980s, and various types of lasers at wavelengths ranging from ultraviolet to infrared were proposed.139,140
Currently, most LA-ICP-MS systems apply solid-state Nd:YAG lasers with nanosecond (ns) pulses of source radiation at 193, 213 and 266 nm. These lasers have been used more frequently than others because they are relatively inexpensive, provide a source of laser pulses of high density, require little maintenance and are easily incorporated into small commercial ablation systems. However, this type of laser seriously hampers the precision and accuracy of LA-ICP-MS analyses and makes MMC a common requirement, which is often problematic for the analysis of natural materials that are rarely found to be homogeneous. In principle, such problems occur due to chemical fractionation.139
The mentioned problems that harm performing measurements in LA-ICP-MS can be minimized with the use of femtosecond (fs) lasers.141 The studies after the first application of femtosecond (fs) laser ablation for LA-ICP-MS analysis, which occurred in 2002,142 concluded that there is an analytical benefit of using fs lasers over ns lasers for trace element and isotopic analysis.
Thus, it has been well reported in the literature that the use of fs lasers improved the precision and accuracy of ICP-MS in many cases. The improved precision using fs laser ablation has been attributed to the smaller particles and a narrower size distribution produced with this method than with others. In addition, the reduced amount of mass does not overload the ICP. The onset of vaporization, ionization, ion cloud, and chemical interference effects are highly dependent on the aerosol (dry, in this case). Accuracy is improved by using fs lasers because of minimized heating of the sample. However, there are other attributes beyond these performance metrics. Common concerns of laser ablation are inhomogeneity of the sample, representative sampling, and sensitivity. However, all of these concerns can be mitigated by using high-repetition rate fs laser ablation. High-repetition rate fs laser ablation sampling has been shown to support bulk sample analysis by scanning rapidly over small sample areas. Despite minimizing the chemical fractionation problem, causing the aerosol to be formed as representative as possible of the sample as a whole, fs lasers are much more expensive than ns lasers, which often limits their application.143
For a long time, a major limitation of fs laser ablation use for LA-ICP-MS analysis has been the complicated use and maintenance of fs laser ablation systems, which were often custom-made. This is no longer an issue with the commercial systems released over the last few years. They appear to be as user-friendly as the mainstream ns laser ablation systems. However, the last remaining important limitation to overcome for the widespread use of fs laser ablation systems is their cost, which is still twice as high on average as that of a newest generation ns excimer laser ablation system.143
Recently, new LA-ICP-MS instrumentation has been proposed with the aim of improving the technique. Bauer et al.144 proposed the use of an ICP-MS instrument equipped with a time-of-flight (TOF) mass analyzer. According to the authors, this system offers a great advantage because of quasi-simultaneous analysis of the entire elemental mass spectrum. It offers high isotope ratio measurement precision and thus suitability for isotope dilution analysis (IDA). In this sense, new advances are necessary to improve the LA-ICP-MS instrumentation in terms of precision, accuracy and cost.
In recent years, LA-ICP-MS has also attracted attention for applications in different areas of study. However, the extensive list in the paper review has demonstrated that this technique has received significant attention over the last 10 years and has been widely used for the analysis of biological samples, mainly for the evaluation of the spatial distribution of chemical elements, also called bioimaging.145–147 Knowledge about elemental evaluation in biological samples such as cells might help improve understanding the fundamental biological functions of metalloproteins, in particular metalloenzymes, or even metallo-metabolites, and might give the basis to distinguish healthy and diseased cells.147 In the past, acquiring information on elemental concentrations in biological cells was a laborious task;148 however, the possibility of bioimaging by LA-ICP-MS to overcome these limitations fit well and helped in understanding various interactions between cells and metals.
Different approaches have been used in performing medical analysis by LA-ICP-MS. Feng et al.149 developed a quantitative imaging strategy to obtain distribution images of Fe, Cu, and Zn in a mouse brain based on isotope dilution LA-ICP-MS. This powerful tool has also been used to develop a better understanding of metal and protein distribution in tissues of people with neurodegenerative, chronic or rare diseases. Cruz-Alonso et al.150 used LA-ICP-MS for quantitative imaging of iron and ferroportin in human brain tissue with Alzheimer's disease. Clases et al.151 used a LA-ICP-MS/MS system to improve the LODs during the monitoring of Gd and P using their oxides (GdO and PO, mass-shift mode) and Zn, Ca, and Fe from natural isotopes (on-mass mode) in skin tissue with nephrogenic systemic fibrosis (NSF) and cancerous brain samples. Another important application for LA-ICP-MS systems occurs in geological areas due to the possibility of SS analysis and the reduction of spectral interference and matrix effects from dry aerosols, ensuring significant improvement in the analytical signals.152 Luo et al.153 developed a method for U–Pb geochronological analysis of wolframite series minerals using LA-ICP-MS. Standish et al.154 evaluated the effect of matrix interference on boron isotope analysis of marine carbonates by MC-LA-ICP-MS with high spatial resolution. Knaf et al.18 used a portable pulsed LA-ICP-MS for non-invasive art and archaeological material analysis and precise determination of Sr–Nd isotope compositions and trace element ratios, with high and effective discrimination of the analyzed materials.
3.4 Laser-induced breakdown spectroscopy
Laser-induced breakdown spectroscopy is a technique whose use is increasing as far as SS is concerned. The technique basically uses a pulsed laser source guided by mirrors and lenses to the sample surface. The laser pulse generates approximately a 10![[thin space (1/6-em)]](https://www.rsc.org/images/entities/char_2009.gif) 000 K plasma, which can ablate a few micrograms of samples, and the atoms, ions and molecules of this portion of the sample are brought to a higher energy level. When cooling starts, these excited species return to the original energy level, emitting photons at specific wavelengths that are monitored via optical fibers to a spectrometer, where they are diffracted and further registered on a detector. This entire process lasts on the order of milliseconds.155–160
000 K plasma, which can ablate a few micrograms of samples, and the atoms, ions and molecules of this portion of the sample are brought to a higher energy level. When cooling starts, these excited species return to the original energy level, emitting photons at specific wavelengths that are monitored via optical fibers to a spectrometer, where they are diffracted and further registered on a detector. This entire process lasts on the order of milliseconds.155–160
There are several parameters that can be optimized to maximize data acquisition and minimize difficulties faced in this technique, such as laser pulse fluence, which is the combination of the laser pulse energy, the diameter of the laser beam (spot size), and the gate delay, that is, the time between the laser incidence and the start of registering the emitted light.155–160
Despite the recent increase in application of LIBS analysis for solid samples, the technique is still facing some drawbacks, such as a high LOD (on the order of μg g−1) and low reproducibility and repeatability. These aforementioned obstacles could be related to the interaction between the sample and the laser pulse and to the matrix effects that are severe in LIBS.161 Various strategies were developed through the years to minimize these effects, such as the use of normalization modes162–164 and some chemometric tools.165,166
Even with these already reported problems, the technique has been widely used for solid sample analysis,167–169 but it can also be used for liquid analysis; there are many other problems for liquid analysis that are related to interactions between the laser pulse and the sample, but they have other implications (e.g., the laser pulse splashing and low-temperature plasma).170
Sample preparation for this technique is important due to the sensitive interactions between laser pulses and matter. Although the technique does not require sample preparation in various cases where the sample itself is already “prepared” (e.g., metallic alloys, polymers, and glass), powdered samples need special attention because the harder the sample surface is, the better the interaction between the laser pulse and matter. Furthermore, the most commonly used sample preparation step is just making a pellet with the powdered material, making the sample hard in a simple manner in the sample preparation process.2
Due to the uniqueness of the technique having only one source of excitation, it brings some advantages regarding solid sample analysis. In contrast to laser ablation, this technique is fully independent of other techniques, and coupling with another technique is not mandatory, although it could be performed because the emission spectra are recorded directly from the plasma generated from the laser. Thus, the LIBS technique can bring all the advantages of multielement analysis (the spectra vary but commonly range from the far UV to the near IR) with no consumption of gases, in contrast to ICP OES, and without some problems related to carrier gases in the case of laser ablation. Moreover, LIBS could be portable, enabling in situ analysis of solid samples, and it is also possible for performing standoff analyses of explosives or in remote locations, i.e., places where it is difficult to reach.171,172 For this purpose, one important application is the use of LIBS analyses during space exploration. Sallé et al.173 studied in situ LIBS analysis of the effects of simulated environments (7 Torr CO2 for Mars and 50 mTorr air for the Moon) on clay and soil samples and evaluated the effects of pressure on emission spectra used for a calibration curve prepared with certified reference samples. The authors concluded that the best linear regression coefficient and the best repeatability were obtained at 7 Torr CO2.
Since LIBS analyzes spots on the order of μm and each point analyzed generates a full emission spectrum, it is possible to map the elemental influence over a heterogeneous sample. Carvalho et al.174 developed a strategy to evaluate the elemental composition of a printed circuit board from a cell phone utilizing hyperspectral imaging. The authors analyzed a whole PCB with an area of 12 cm2 (3 × 4 cm) with a distance of 1 mm between two points; that is, they analyzed 1200 points in total (30 × 40 points), and at each point, the results from 10 laser pulses were recorded to evaluate a depth profile of the sample. With the assistance of computational scripts (MATLAB), all of the information (12000 laser pulses × 12288 emission lines) was treated, and principal component analysis (PCA) was performed on each layer of the printed circuit board. Then, the combination of the score maps and loading values could show how the elements were distributed throughout the sample. This first combination of hyperspectral imaging and LIBS enabled other applications in the same field, such as that reported by Sperança et al.,175 where the authors used the strategy to evaluate the elemental composition of coprolites, that is, fossilized feces from animals from the Permian, Oligo-Miocene and Cretaceous periods. The authors analyzed the coprolites and the rock around them with laser pulses, and after the PCA, the score maps were able to differentiate the rock composition from the coprolite. This information was confirmed through ICP OES analysis and some inferences about nutritional behaviors from the animals that generated the fossils.
As mentioned above, the LIBS technique is, by itself, independent and does not need coupling with another method, although it is possible. Subedi et al.176 connected a LIBS instrument to an ICP-MS for forensic analysis of printing inks. The authors tested a set of different ink types, and they successfully developed a method that is able to differentiate 4 types of ink samples. Bonta and Limbeck177 coupled tandem LA-ICP-MS/LIBS with multivariate analysis to determine metals in polymers, eliminating matrix effects.
In summary, we could report that every LIBS system has a laser ablation capability. The distinguishing point is that if the plasma generated from the laser pulse on the surface of the sample is directly collected by a spectrometer, a LIBS analysis occurred, while if this ablated mass is carried through for another source of excitation, for instance, ICP, a coupled LA-ICP analysis is performed. Finally, if at the same time, the plasma generated from laser pulses is monitored and this portion of the ablated sample is carried to another source of excitation for further analysis, a tandem analysis is possible.
There are technological advances in the instrumental parts of a traditional LIBS setup, such as the spectrometers (echelle) and detectors (intensified charge-coupled device, ICCD), that can solve problems related to spectral interference and high LOD values. Regarding lasers, the use of fs lasers can provide improvements related to the laser–matter interactions, reproducibility and repeatability but at a high cost. Despite that, all these improvements generally have helped the direct solid analysis.168
The promising and growing use of LIBS for SS can be observed from review papers targeting several LIBS applications: food,178 agriculture,27,179,180 biological and medical areas,181 waste electrical and electronic equipment,166 plastics,182 nanoparticle-enhanced LIBS (NELIBS)183,184 and cultural heritage and archaeology.185,186 Furthermore, other recent applications can be highlighted. Li et al.187 and Mal et al.188 used CF-LIBS for titanium and copper alloy sample analysis. Fernández-Bravo et al.189 focused their studies on the molecular emission of LIBS plasma based on the CN. Wang et al.190 proposed developing an analytical method using circular polarized fs-LIBS for brass analysis. Camacho et al.191 evaluated the use of LIBS for spatiotemporal evolution diagnostics in potassium gallosilicate zeolite. The potential application of LIBS for rapid visualization and direct quantitative mapping of drugs in a long-acting injectable implant with simplicity and high spatial resolution was also evaluated for the first time,192 and combining LIBS with Fourier transform infrared spectroscopy (FTIR) for the analysis of coal properties from elemental and molecular information was also examined.193
3.5 X-ray fluorescence spectrometry
X-ray fluorescence (XRF) spectrometry is a versatile and commonly used technique for solid sample analysis due to many advantages, such as (i) direct analysis of the sample with minimal or no sample preparation, (ii) high analytical throughput, (iii) usually little or no reagent consumption required, (iv) little or no residue generated and (v) chemical speciation of some elements using solid analysis. Among the main disadvantages, the high LOD (on the order of μg g−1) and matrix effects are highlighted.194 It is possible to affirm that XRF is one of the most widespread and commonly used techniques in the world, occupying a prominent place, especially in those areas where obtaining a fast profile of metallic and nonmetallic constituents is indispensable. XRF is also widely used in industrial applications that often require rapid analytical routines for quality control of its products.194–196Another important aspect of the technique is the possibility of in situ analyses, allowing, for example, direct determination in works of art to identify materials and their eventual corrosion products for determination of their origin, processing and use, for understanding their processes of deterioration, to define preservation and restoration methods and for authentication.194–197
Conventional XRF spectrometers can normally be divided into two categories: energy dispersive XRF (EDXRF) and wavelength dispersive XRF (WDXRF). The WDXRF spectrometer has some analytical advantages, when compared to the EDXRF spectrometer, such as: (i) better resolution; (ii) low limits of detection (LD); (iii) high accuracy; and (iv) ability to analyze a wide range of elements.198,199
However, EDXRFs are easy to operate and have high sensitivity for small sample quantities. With a relatively simple electronic arrangement, these systems can be portable. These characteristics make the EDXRF technique attractive for the direct analysis of solids, and many research groups have done studies to improve the limits of detection and accuracy of this technique. West et al.26 reported in their review work a study using a geometry with the angle of incidence at 90° and the angle of the detector at almost 0° for an EDXRF laboratory spectrometer. This grazing exit setup was used to improve the LODs for the determination of trace elements in soils. The authors reported that the new geometry significantly improved accuracy, precision and LODs over those of the conventional 45°/45° geometry, although the absence of a detector collimator in the latter system would have been the cause of a significant and unnecessary increase in the spectrum background in that system.26
In addition to the WDXRF and EDXRF systems, there are other X-ray spectrometers that may not be available to the general user community but have important roles in special areas of application. Included in this category are total reflection XRF spectrometers (TXRF) and synchrotron radiation XRF spectrometers (SRXRF). Both systems share a very high sensitivity and the ability to work with low concentrations and a small amount of samples.200,201
TXRF is a geometric variation of EDXRF, where the essential difference is that the TXRF spectrometers use an X-ray tube with a narrow “line focus”, emitting a primary beam as a thin row, whereby the high energy part of its spectrum can be cut off by a low-pass filter. The primary beam strikes a flat glass carrier at a very small angle and is totally reflected at the carrier. The sample must be placed on the carrier in a small amount so that the total reflection is scarcely hindered. The fluorescence radiation of the sample is recorded by using an energy-dispersive detector, usually a Si (Li) detector.202
Wrobel et al.203 demonstrated in a study technical advances in TXRF spectrometry, describing a new instrument that includes software control based on a LabVIEW interface with the Tango control system for the multitechnique X-ray spectrometry IAEA beamline end-station at ELETTRA Sincrotrone, Trieste, Italy. The key components at the core were an ultrahigh vacuum chamber that included a seven-axis motorized manipulator for sample and detector positioning with different types of X-ray detectors plus optical cameras. The chamber allowed reliable positioning of the sample, remote exchange of the sample and the evacuation of the path of the fluorescence beam.203
The SRXRF uses synchrotron radiation (SR) as the source of excitation. SR is ideal for high-precision XRF analyses of heterogeneous and complex materials due to the small spot size, low divergence, high photon flux, and linearly polarized nature of SR. The SRXRF analysis is becoming an advanced and essential analytical technique in life science, environmental, medical, archaeological and cultural heritage, forensic chemistry, industrial, and earth and planetary science applications.26,204
Surowka et al.204 reported new approaches for the correction of matrix effects on the quantitative SRXRF element imaging of human substantia nigra tissue. The authors showed that differences in density with possible variation in thickness after freeze drying of thin samples could significantly influence the quantitative XRF results. The SN tissue samples of various thicknesses were mounted on silicon nitride membranes with the main goal being to derive several semiquantitative and fully quantitative methods to correct the mass thickness effects. These topographic studies on the dried specimens demonstrated that the drying procedure was accompanied by an approximately 80% reduction in the thickness of the sample. A scheme to correct for the mass thickness effects on the XRF intensities from these structures was presented.26,204
Another variant of the EDXRF technique is X-ray microfluorescence (μ-XRF), which makes it possible to carry out chemical mapping of a sample and verify its homogeneity. In some cases, it is also possible to improve the limit of detection. Even with low resolution, μ-XRF has some advantages over other techniques, with the highest analytical sensitivity and the possibility of working without vacuum. The development of X-ray microprobe spectroscopy has allowed several applications for the analysis of biological and inorganic samples, and in recent years, it has been applied in forensic science. In general, microanalysis can be used in several types of samples, such as aerosols, suspended sediments, and waste discharge of firearms.194,205–207
Vanhoof et al.208 reported a study in which MATLAB software was used to simulate X-ray beam paths through a single-bounce ellipsoidal capillary. The goal was to design and manufacture X-ray optics ideal for use in μ-XRF instruments. The ideal capillary design was combined with a 50 W copper-target X-ray tube that had a 300 μm diameter spot and a silicon drift detector (SDD) placed 40 mm from the sample. The 45° angle of the incident beam to the sample surface produced a 176 μm diameter circular spot. This setup was used to prepare an XRF map of a holly leaf using a dwell time of 20 s and a sampling step of 0.3 mm. The high intensity and long working distance of this setup and the ability to design optimized optics were valuable, but the size of the point supplied puts this method in the field of milli-XRF rather than μ-XRF.208
In situ XRF analyses are only possible because the technique allows the manufacture of portable spectrometers. Although the LODs are much higher for the portable XRF technique than for other laboratory-based methods, its portability, ease of use, and high throughput make it a valuable tool, especially for field-based studies. To improve the limits of detection for portable XRF,26,194,208,209 Guimarães et al.210 developed and evaluated a new portable XRF spectrometer based on the use of doubly curved crystal optics. Two models of the developed system (a preproduction and a final production unit) were investigated. Performance parameters, including accuracy, precision and LODs, were characterized in a laboratory environment using consumer goods and cultural product CRMs and standard solutions. The LODs, based on solid matrices, were 1 μg g−1 for As and Pb, 1–2 μg g−1 for Hg and 9–11 μg g−1 dry matter for Cd. The bias for these elements ranged from 10% to 11% for preproduction and from 14% to 16% for the final production model. The authors also analyzed herbal medicine products, ethnic spices and cosmetic products, which showed good agreement between the two instruments for four key elements, and data were confirmed by ICP OES after digestion.210
Guzzonato et al.211 improved the accuracy of a hand-held XRF spectrometer used to monitor brominated flame retardants in waste polymers. The authors developed a thickness-corrected calibration for the portable XRF instrument; the resulting correction was applied to 28 real samples, and the results showed excellent agreement with measurements obtained by LA-ICP-MS (R2 = 0.9926).211
Pessanha et al.212 studied the performance of a portable EDXRF spectrometer using three different filters (Al, Cu and Al + Cu) placed between the X-ray tube and CRMs of different average-Z matrices. The use of filters did not improve LODs in high-Z matrices but reduced interference in the measurement of some elements. With the elimination of noise and correction of the baseline by a discrete wavelet transform method, the authors determined As, Cr, Cu, Pb and Zn concentrations in soil samples and performed a comparison of the calibration curves and LODs for the spectral data and processed data with the DWT, demonstrating that the best modeling results could be obtained using this strategy. Accuracy was improved, and LODs were a factor of 1.5 to 5 lower for processed data than for unprocessed.212
Many other XRF applications described in the review papers focus on different themes: cultural heritage,26,208 metallurgy,213 plants,27,214 speciation215 and geochemistry.216 Moreover, the following studies have recently been published: evaluation of different quantification modes for a simple and reliable determination of Pb, Zn and Cd in soil suspensions by TXRF217 and in soil using a portable X-ray fluorescence (pXRF) instrument; the influence of the organic matter fraction on trace metal analytical signals;218 chromium speciation mapping of near-surface materials (biochar) or within grains through the use of thin-sections using confocal μ-XRF imaging;219 sulfur speciation in a mineral supplement for cattle using a WD-XRF;220 elemental mapping of a biodegradable magnesium implant by μ-XRF;221 method development for analysis and characterization of hydroxyapatite-based materials using XRF and the Compton-to-Rayleigh scattering ratio;222 a screening method for the classification of medieval and postmedieval archaeological ceramics by EDXRF;223 quantification of toxic elements in gallstones collected from patients of different age groups and eating habits by WDXRF;224 and, for first time, plutonium determination using a direct and safe TXRF method for precious, hazardous and radioactive sample analysis.225
3.6 Glow discharge optical emission and mass spectrometry
The discovery and development of new materials have led to special emphasis on improving the performance of analytical techniques for direct solid analysis with good sensitivity and high depth resolution to be used in quality control and for the characterization of these materials.226 In addition to the progress in instrumentation, the developed strategies and methods allowed for an extraordinary growth in the analytical applications of glow discharge (GD), which has been successfully coupled to different techniques such as atomic absorption spectrometry (GD-AAS), fluorescence spectrometry (GD-AFS), optical emission spectrometry (GD-OES) and mass spectrometry (GD-MS) to overcome the traditional challenges in sample preparation.227,228 Due to the importance of the coupled GD-OES/MS, here we will briefly describe the instrumental advances and applications of glow discharge.Glow discharge methods have attracted much analytical interest for use in atomizers and excitation and ionization sources, both for optical emission and mass spectrometry due to their capability to generate atoms and ions directly sputtered from the solid samples in an atomic “layer-by-layer” manner, enabling depth profile analysis of the solid to a great depth.227,229,230 Moreover, other important advantages include ease of use, excellent sensitivity, multielemental capability, high sample throughput, low continuum background, high electronic excitation temperatures and low cost of maintenance.227,231,232
The glow discharge sources for commercial GD-OES instruments are designed after the Grimm source, which is commonly used for flat samples. GD-OES is a fast and reliable tool routinely used for bulk solid analysis and depth profiling of surface coatings and interfaces.230,233 This technique analyzes practically any solid material since the sample must be compatible with vacuum.234 The main applications include characterization of surface oxide films on powder particles,235 chemical profiling of photovoltaic absorbers,236 and surface elemental mapping.237 At present, it is possible to find in the market two different instruments: one using a CCD detector and the other with a polychromator and photomultiplier tubes in a Rowland circle configuration.238,239
GD-MS instruments are advantageous alternatives to GD-OES for solid sample analysis due to their ability to obtain isotopic and molecular information, lower LODs and capability to provide a complete mass spectrum in a very short period of time with certain mass analyzers.227 Slight modifications of the Grimm design allow its implementation for depth profile analysis of flat samples by GD-MS.232,240,241
The traditional mode of operation in glow discharge optical emission spectrometry (GD-OES) and mass spectrometry (GD-MS) is the application of a DC voltage to generate the discharge. The DC-GD instruments are reliable and easy to handle, but for many years, one of the main factors limiting the analytical application of glow discharge has been the requirement of samples to be conductive.115,227,231 Two possibilities are reported in the literature to overcome this problem using DC-GD: the first is to apply some type of matrix modification (i.e., grinding and mixing with a conducting host), which results in loss of sample integrity and can cause contamination. The second method is the use of a metallic secondary cathode diaphragm in front of the flat nonconductive sample surface. Because of the redeposition of a fraction of the sputtered metal atoms from the secondary cathode, a very thin conductive surface is formed on the nonconductive material, which enables atomization of the nonconductive sample.226
However, independent studies using Rf-powered glow discharge coupled to OES and MS for direct solid analysis of materials have been investigated in recent decades. The coupling of Rf-GD to spectrometric detection enables direct analysis of conducting and nonconducting samples.227,242,243 This approach was considered an important innovation over the traditional bulk solid spectrometric techniques such as arc/spark DG or conventional DC-GD. The glow discharge can also be operated in pulsed mode (DC and Rf), wherein each pulse generates a packet of sample atoms. However, there are differences between DC- and Rf-pulsed discharges. In pulsed DC, the amplitude of the applied voltage is constant during each pulse, while in pulsed Rf, the amplitude varies at radiofrequencies during each pulse, e.g., for 13.56 MHz, there would be 13.56 cycles.229,242–244
The pulsed mode (microsecond or millisecond pulses) allows the application of increased instantaneous power, enhancing the extraction and ionization efficiencies.231,232 Pulsed glow discharge offers certain advantages over classical steady-state operation, such as an additional way of controlling the plasma (by selecting the pulse parameters, e.g., pulse and period lengths).231 In the literature, some studies have employed Rf-GD-OES/MS to analyze the profiles of different types of samples, such as nanostructured materials and nanolayers,231 thin and ultrathin solids,232 nanoconductors,241 glass245 and metal coatings.246
In addition, glow discharge was successfully coupled to mass analyzers such as quadrupoles and double-focusing spectrometers for analytical purposes; nevertheless, the sequential nature of such mass analyzers makes them not ideal for depth profiling with high depth resolution. This challenge was overcome using time-of-flight mass spectrometry (TOFMS) capable of fast collection of a complete mass spectrum with one single extraction of a packet of ions with high precision and sensitivity.239–241,245 Therefore, the advances in glow discharge analytical techniques and improved operation procedures have provided impressive applications that have contributed to the present success.
Gamez and Finch247 described in their review paper the recent advances in surface elemental mapping by glow discharge, where its capabilities for solid sample analysis in elemental mapping were presented. Heikkilä et al.235 reported, for the first time, the use of GD-OES for characterization of surface oxide films on powder particles, evaluating the potential depth of the technique. Yu et al.248 evaluated the performance of liquid cathode GC-OES for ore sample analysis and Cu and Pb determination. Gonzalez-Gago et al.249 evaluated the performance of GD-MS to investigate the accurate quantification of metallic impurities in solid samples. Wei et al.250 used DC-GD-MS for elemental determination in bulk conductors or semiconductors using a set of universal relative sensitivity factors (u-RSFs) with promising results without the need for matrix-matched standards.
3.7 Arc/spark optical emission spectrometry
Historically, optical emission from these sources has been used to quantify the composition of samples, and little work has been reported in the literature using either arc or spark sample introduction into ICP-MS instruments, possibly due to the tremendous effort being made in the academic and instrument manufacturing communities in developing glow discharge sample introduction.251,252In arc/spark techniques, a high potential difference is applied between two electrodes in an Ar atmosphere, one of the electrodes being the sample. As a result, a repetitive unidirectional electrical discharge ablates atoms from the metal sample and produces a high temperature. In this way, the atoms released from the sample surface are excited, and the corresponding emission is observed.3,252,253 This classic technique can offer enhanced performance because of recent improvements in instrumentation, such as control of applied current, reduction in electrical noise, improvements in the optical quality of the components and extension of the spectral range to the vacuum UV region.115,254 Each analyte signal is monitored during a brief interval (160 ms only), and therefore, a very fast detection system is required for multielement monitoring (phototubes in a Rowland circle configuration).251,252
Unlike laser ablation, arc/spark sources do not have the capability to enable accurate spatially resolved analyses; they are used only for homogeneous samples (e.g., metals) or samples that have been homogenized (e.g., rock powders). Electrically conductive samples are easily and uniformly introduced into an ICP using an arc/spark source.
However, in geological analysis (nonelectrically conductive rock materials) using an arc/spark with optical emission, sample procedures have been well established.115,251,252 An approach based on fire-assay (Pb or NS) procedures has gained interest in the platinum group element (PGE) industry for the analysis of ores and flotation tailings, which is complicated by low concentrations of PGEs and Au and their heterogeneous distribution within the matrix.254,255
Another approach can be used to mix fire assays with subsequent direct SS that presents many advantages to obtain representative and homogeneous buttons because of the large amount of sample used and the feasibility of preparing matched standards for calibration.115
Spark-OES was used to analyze Pb buttons obtained after fire-assays for the determination of Au, Cu, Pd, Pt, Rh and Ru in four different ore reference materials, with a limit of detection in the tens of ng g−1 for most of these elements115 and for the determination of ultralow carbon and nitrogen contents in steel samples.254 With the advent of other analytical techniques and their potentialities, there are few methods that use spark-OES for solid sample analysis.
4. Conclusion and outlook
In this review, the potentialities of solid sampling in atomic spectrometry are presented. In this review, the reader is exposed to information that makes it clear that the increase in the number of solid sampling papers is associated with the remarkable advantages and benefits of this type of analysis. It is evident that, in recent years, the development of methods for solid sample analysis has grown significantly. This growth was associated with the technological advances that showed significant improvements in the instrumental arrangements, allowing the direct analysis or minimal manipulating the analysis of a wide variety of samples to identify and/or quantify most elements by techniques which was not possible before (e.g., FAAS, ICP OES, and ICP-MS). These advances are directly related to the identification and correction of the spectral background signal, increase in spectral resolution, minimization of RSD (minimum treatment of the sample), elimination of spectral interference, significant improvement in sensitivity and increase in the analytical throughput.In addition to these instrumental advances, different calibration strategies (MEC and OPG SA, for example) were reported for overcoming nonspectral interference, such as matrix effects, which is one of the greatest challenges for solid sample analysis and responsible for compromising the accuracy of the method. Moreover, new possibilities, such as nonmetal monitoring of molecular emission or absorption signals by LIBS and HR-CS GF MAS, chemical speciation analysis, portability for in situ analysis, and surface elemental mapping for chemical imaging (or bioimaging, for applications in biomedical areas, studies of Parkinson's and Alzheimer's diseases and cancer tissue sectioning), expanded the potential for solid sampling.
It is important to point out that despite these advances, one challenge that must be overcome is the acquisition cost of some instrumentation, such as fs-laser ablation instruments (especially if they are coupled to MC-ICP-MS, ICP-MS/MS and ICP-TOF-MS), which are very expensive and require analyst expertise during method development, restricting their use to a few research groups and limiting their application areas.
Another aspect to be considered is that there is only one manufacturer that produces electrothermal vaporization sample introduction system and the HR-CS GFAAS instrument, which minimizes the possibilities of market competition and affects the development of new and more sophisticated equipment, which would increase the application potential for solid sampling.
Conflicts of interest
There are no conflicts of interest to declare.List of acronyms
| AAS | Atomic absorption spectrometry |
| CCD | Charge-coupled device |
| CF | Calibration-free |
| CRC | Collision–reaction cell |
| CRM | Certified reference material |
| DC | Direct current |
| EBI | Elemental bioimaging |
| EDXRF | Energy dispersive X-ray fluorescence |
| ETAAS | Electrothermal atomic absorption spectrometry |
| ETV | Electrothermal vaporization |
| FAAS | Flame atomic absorption spectrometry |
| FIA | Flow injection analysis |
| fs | Femtosecond |
| FTIR | Fourier transform infrared spectroscopy |
| GD | Glow discharge |
| GD-AAS | Glow discharge atomic absorption spectrometry |
| GD-AFS | Glow discharge atomic fluorescence spectrometry |
| GD-MS | Glow discharge mass spectrometry |
| GFAAS | Graphite furnace atomic absorption spectrometry |
| GF-OES | Glow discharge optical emission spectrometry |
| HR-CS AAS | High-resolution continuum source atomic absorption spectrometry |
| HR-CS GFAAS | High-resolution continuum source graphite furnace atomic absorption spectrometry |
| HR-CS GFMAS | High-resolution continuum source graphite furnace molecular absorption spectrometry |
| ICCD | Intensified charge-coupled device |
| ICP OES | Inductively coupled plasma optical emission spectrometry |
| ICP-MS | Inductively coupled plasma mass spectrometry |
| ICP-MS/MS | Inductively coupled plasma tandem mass spectrometry |
| IR | Infrared |
| IS | Internal standardization |
| LA | Laser ablation |
| LAMIS | Laser ablation molecular isotopic spectroscopy |
| LCD | Liquid crystal display |
| LIBS | Laser-induced breakdown spectroscopy |
| LOD | Limit of detection |
| LSBC | Least-squares background correction algorithm |
| MC | Multicollector |
| MEC | Multienergy calibration |
| MMC | Matrix-matching calibration |
| MOSES | Modular simultaneous echelle spectrograph |
| NSF | Nephrogenic systemic fibrosis |
| OP GSA | One-point gravimetric standard addition |
| PCA | Principal component analysis |
| PGE | Platinum group element |
| pXRF | Portable X-ray fluorescence |
| REE | Rare earth element |
| Rf | Radiofrequency |
| RSD | Relative standard deviation |
| SCI-E | Science Citation Index Expanded |
| SDD | Silicon drift detector |
| SN | Substantia nigra |
| SR | Synchrotron radiation |
| SS | Solid sampling |
| TOF | Time of flight |
| TPS | Disposable thermoplastic starch |
| TXRF | Total reflection X-ray fluorescence |
| UV | Ultraviolet |
| WDXRF | Wavelength dispersive X-ray fluorescence |
| WoS | Web of Science |
| XRF | X-ray fluorescence |
Acknowledgements
The authors would like to thank the São Paulo Research Foundation (FAPESP, grants 2016/01513-0, 2016/17304-0 and 2016/17221-8), Conselho Nacional de Desenvolvimento Científico e Tecnológico (CNPq, 401074/2014-5, 305637/2015-0, 150517/2017-0, 160152/2015-1, 141311/2017-7 and 158587/2017-0) and Coordenação de Aperfeiçoamento de Pessoal de Nível Superior – Brasil (CAPES/PNPD) – National Postdoctoral Program, Federal University of São Carlos) – Finance Code 001.References
- U. Kurfürst, Solid Sample Analysis: Direct and Slurry Sampling using GF-AAS and ETV-ICP, Springer, Berlin, 1998 Search PubMed.
- F. J. Krug and F. R. P. Rocha, Métodos de preparo de amostras para análise elementar, EditSBQ – Sociedade Brasileira de Química, São Paulo, 2016 Search PubMed.
- D. Gunther, S. E. Jackson and H. P. Longerich, Spectrochim. Acta, Part B, 1999, 54, 381–409 CrossRef.
- D. C. Duckworth, C. M. Barshick and D. H. Smith, J. Anal. At. Spectrom., 1993, 8, 875–879 RSC.
- B. Beckhoff, B. Kanngießer, N. Langhoff, R. Wedell and H. Wolff, Handbook of practical X-ray fluorescence analysis, Springer, Berlin, 2006 Search PubMed.
- M. Resano, M. Aramendia and M. A. Belarra, J. Anal. At. Spectrom., 2014, 29, 2229–2250 RSC.
- E. M. M. Flores, A. B. Costa, J. S. Barin, V. L. Dressler, J. N. G. Paniz and A. F. Martins, Spectrochim. Acta, Part B, 2001, 56, 1875–1882 CrossRef.
- R. E. Russo, X. Mao, J. J. Gonzalez, V. Zorba and J. Yoo, Talanta, 2002, 57, 425–451 CrossRef CAS.
- D. A. Cremers and L. J. Radziemski, Handbook of laser-induced breakdown spectroscopy, John Wiley, New Jersey, 2006 Search PubMed.
- Clarivate, Web of Science, https://webofknowledge.com, accessed May 2019 Search PubMed.
- M. Resano, F. Vanhaecke and M. T. C. Loos-Vollebregt, J. Anal. At. Spectrom., 2008, 23, 1450–1475 RSC.
- R. E. Russo, Appl. Spectrosc., 1995, 49, 14–28 CrossRef.
- E. A. G. Zagatto and S. M. O. Sá, J. Braz. Chem. Soc., 2003, 14, 153–158 CrossRef CAS.
- E. Margui and R. V. Grieken, X-Ray Fluorescence Spectrometry and Related Techniques, Momentum Press, New York, 2013 Search PubMed.
- C. Bendicho, I. Lavilla, F. Pena-Pereira and V. Romero, J. Anal. At. Spectrom., 2012, 27, 1831–1857 RSC.
- AMCTB No. 89, Anal. Methods, 2019, 11, 2498–2501 RSC.
- J. Rakovský, P. Čermák, O. Musset and P. A. Veis, Spectrochim. Acta, Part B, 2014, 101, 269–287 CrossRef.
- A. C. S. Knaf, J. M. Koornneef and G. R. Davies, J. Anal. At. Spectrom., 2017, 32, 2210–2216 RSC.
- M. Aramendía, M. Resano and F. Vanhaecke, Anal. Chim. Acta, 2009, 648, 23–44 CrossRef.
- B. Welz, M. G. R. Vale, E. R. Pereira, I. N. B. Castilho and M. B. Dessuy, J. Braz. Chem. Soc., 2014, 25, 799–821 CAS.
- M. Resano, L. Rello, M. Flórez and M. A. Belarra, Spectrochim. Acta, Part B, 2011, 66, 321–328 CrossRef CAS.
- D. V. Babos, M. A. Bechlin, A. I. Barros, E. C. Ferreira, J. A. Gomes Neto and S. R. Oliveira, Talanta, 2016, 152, 457–462 CrossRef.
- A. L. Vieira, D. A. Gonçalves, A. Virgilio, E. C. Ferreira, B. T. Jones, G. L. Donati and J. A. Gomes Neto, J. Anal. At. Spectrom., 2019, 34, 972–978 RSC.
- A. Virgilio, D. A. Gonçalves, T. McSweeney, J. A. Gomes Neto, J. A. Nóbrega and G. L. Donati, Anal. Chim. Acta, 2017, 982, 1–6 CrossRef.
- A. S. Augusto, P. L. Barsanelli, F. M. V. Pereira and E. R. Pereira-Filho, Food Res. Int., 2017, 94, 72–78 CrossRef.
- M. West, A. T. Ellis, C. Streli, C. Vanhoof and P. Wobrauschek, J. Anal. At. Spectrom., 2017, 32, 1629–1649 RSC.
- G. G. A. Carvalho, M. B. B. Guerra, A. Adame, C. S. Nomura, P. V. Oliveira, H. W. P. Carvalho, D. Santos Jr, L. C. Nunes and F. J. Krug, J. Anal. At. Spectrom., 2018, 33, 911–1094 RSC.
- G. L. Scheffler, D. Pozebon and V. L. Dressler, J. Anal. At. Spectrom., 2017, 32, 890–919 RSC.
- E. Tognoni, G. Cristoforetti, S. Legnaioli and V. Palleschi, Spectrochim. Acta, Part B, 2009, 65, 1–14 CrossRef.
- R. Jenkins, X-Ray Fluorescence Spectrometry, John Wiley & Sons, New York, 1999 Search PubMed.
- D. V. Babos, A. Virgilio, V. C. Costa, G. L. Donati and E. R. Pereira-Filho, J. Anal. At. Spectrom., 2018, 33, 1753–1762 RSC.
- A. S. Augusto, J. P. Castro, M. A. Sperança and E. R. Pereira-Filho, J. Braz. Chem. Soc., 2019, 30, 804–812 CAS.
- D. F. Andrade, F. M. Fortunato and E. R. Pereira-Filho, Anal. Chim. Acta, 2019, 1061, 42–49 CrossRef CAS.
- D. V. Babos, A. I. Barros, J. A. Nóbrega and E. R. Pereira-Filho, Spectrochim. Acta, Part B, 2019, 155, 90–98 CrossRef CAS.
- M. A. G. Nunes, M. Voss, G. Corazza, E. M. M. Flores and V. L. Dressler, Anal. Chim. Acta, 2016, 905, 51–57 CrossRef CAS.
- M. Voss, M. A. G. Nunes, G. Corazza, E. M. M. Flores, E. I. Müller and V. L. Dressler, Talanta, 2017, 170, 488–495 CrossRef CAS PubMed.
- A. Limbeck, P. Galler, M. Bonta, G. Bauer, W. Nischkauer and F. Vanhaecke, Anal. Bioanal. Chem., 2015, 407, 6593–6617 CrossRef CAS.
- N. Miliszkiewicz, S. Walas and A. Tobiasz, J. Anal. At. Spectrom., 2015, 30, 327–338 RSC.
- A. I. Barros, D. V. Babos, E. C. Ferreira and J. A. Gomes Neto, Talanta, 2016, 161, 547–553 CrossRef CAS.
- L. Balcaen, E. Bolea-Fernandez, M. Resano and F. Vanhaecke, Anal. Chim. Acta, 2015, 894, 7–19 CrossRef CAS.
- E. Bolea-Fernandez, L. Balcaen, M. Resano and F. Vanhaecke, J. Anal. At. Spectrom., 2017, 32, 1660–1679 RSC.
- D. P. Bishop, D. Clases, F. Fryer, E. W. S. Wilkins, D. J. Hare, N. Cole, U. Karstb and P. A. Doble, J. Anal. At. Spectrom., 2016, 31, 197–202 RSC.
- E. Bolea-Fernandez, S. J. M. Van Malderen, L. Balcaen, M. Resano and F. Vanhaecke, J. Anal. At. Spectrom., 2016, 31, 464–472 RSC.
- B. Welz, H. Becker-Ross, S. Florek and U. Heitmann, High-Resolution Continuum Source AAS: The Better Way to Do Atomic Absorption Spectrometry, John Wiley, New Jersey, 2005 Search PubMed.
- C. S. Nomura, C. Soares, D. Silva and P. V. Oliveira, Quim. Nova, 2008, 31, 104–113 CrossRef CAS.
- D. J. Butcher, Appl. Spectrosc. Rev., 2017, 52, 755–773 CrossRef.
- S. L. C. Ferreira, M. A. Bezerra, A. S. Santos, W. N. L. dos Santos, C. G. Novais, O. M. C. de Oliveira, M. L. Oliveira and R. L. Garcia, TrAC, Trends Anal. Chem., 2018, 100, 1–6 CrossRef CAS.
- D. J. Butcher, Molecular absorption spectrometry in flames and furnaces: A review, Anal. Chim. Acta, 2013, 804, 1–15 CrossRef CAS.
- B. Welz, M. G. R. Vale, D. L. G. Borges and U. Heitmann, Anal. Bioanal. Chem., 2007, 389, 2085–2095 CrossRef CAS.
- B. Welz, S. Morés, E. Carasek, M. G. R. Vale, M. Okruss and H. Becker Ross, Appl. Spectrosc. Rev., 2010, 45, 327–354 CrossRef CAS.
- S. S. Fick, F. V. Nakadi, F. Fujiwara, P. Smichowski, M. G. R. Vale, B. Welz and J. B. Andrade, J. Anal. At. Spectrom., 2018, 33, 593–602, 10.1039/c7ja00405b.
- M. Resano, E. García-Ruiz, M. A. Aramendía and M. A. Belarra, J. Anal. At. Spectrom., 2019, 34, 59–80 RSC.
- F. V. Nakadi, M. A. M. S. Veiga, M. Aramendia, E. García-Ruiz and M. Resano, J. Anal. At. Spectrom., 2015, 30, 1531–1540 RSC.
- H. Wiltsche, K. Prattes, M. Zischka and G. Knapp, Spectrochim. Acta, Part B, 2009, 64, 341–346 CrossRef.
- C. Abad, S. Florek, H. Becker-Ross, M. D. Huang, H. J. Heinrich, S. Recknagel, J. Vogl, N. Jakubowski and U. Panne, Spectrochim. Acta, Part B, 2017, 136, 116–122 CrossRef CAS.
- F. V. Nakadi, M. A. M. S. Veiga, M. Aramendia, E. Garcia-Ruiz and M. Resano, J. Anal. At. Spectrom., 2016, 31, 1381–1390 RSC.
- B. Welz and M. Sperling, Atomic Absorption Spectrometry, John Wiley, New Jersey, 1999 Search PubMed.
- L. R. R. Souza, M. B. T. Zanatta, I. A. Silva and M. A. M. S. Veiga, J. Anal. At. Spectrom., 2018, 33, 1477–1485 RSC.
- M. Aramendía, A. Guarda, D. Leite and M. Resano, J. Anal. At. Spectrom., 2017, 32, 2352–2359 RSC.
- T. Kántor, L. Bezúr and E. Pungor, Microchim. Acta, 1981, 75, 289–307 CrossRef.
- E. M. M. Flores, J. N. G. Paniz, A. F. Martins, V. L. Dressler, E. I. Muller and A. B. Costa, Spectrochim. Acta, Part B, 2002, 57, 2187–2193 CrossRef.
- E. M. M. Flores, J. N. G. Paniz, A. P. F. Saidelles, E. I. Muller and A. B. Costa, J. Anal. At. Spectrom., 2003, 18, 769–774 RSC.
- E. M. M. Flores, J. N. G. Paniza, A. P. F. Saidellesa, J. S. Barina, V. L. Dressler, E. I. Muller and A. B. Costa, J. Braz. Chem. Soc., 2004, 15, 199–204 CrossRef CAS.
- A. B. Costa, J. C. P. Mattos, E. I. Muller, J. N. G. Panizb, V. L. Dressler and E. M. M. Flores, Spectrochim. Acta, Part B, 2005, 60, 583–588 CrossRef.
- D. P. Torres, M. A. Vieira, A. S. Ribeiro and A. J. Curtius, J. Braz. Chem. Soc., 2007, 18, 728–732 CrossRef CAS.
- L. Husáková, I. Urbanová, M. Šafránková and T. Šídová, Talanta, 2017, 175, 93–100 CrossRef PubMed.
- L. Bianchin, D. Nadvorny, A. F. Silva, M. G. R. Vale, M. M. Silva, W. N. L. Santos, S. L. C. Ferreira, B. Welz and U. Heitmann, Microchem. J., 2006, 82, 174–182 CrossRef CAS.
- A. R. Borges, E. M. Becker, L. L. François, A. Jesus, M. G. R. Vale, B. Welz, M. B. Dessuy and J. B. Andrade, Spectrochim. Acta, Part B, 2014, 101, 213–219 CrossRef CAS.
- C. R. Rosa, M. Moraes, J. A. Gomes Netoa, J. A. Nóbrega and A. R. A. Nogueira, Food Chem., 2002, 79, 517–523 CrossRef CAS.
- V. M. O. Carioni, R. Chelegão, J. Naozuka and C. S. Nomura, Accredit. Qual. Assur., 2011, 16, 453–458 CrossRef CAS.
- R. G. O. Araujo, N. Oleszczuk, R. T. Rampazzo, P. A. Costa, M. M. Silva, M. G. R. Vale, B. Welz and S. L. C. Ferreira, Talanta, 2008, 77, 400–406 CrossRef CAS PubMed.
- R. R. Gamela, A. T. Duarte, E. G. Barrera, B. Welz, M. B. Dessuy, M. M. Silva and M. G. R. Vale, Anal. Methods, 2017, 9, 2321–2327 RSC.
- C. E. R. Paula, L. F. S. Caldas, D. M. Brum and R. J. Cassella, J. Pharm. Biomed. Anal., 2012, 66, 197–203 CrossRef PubMed.
- K. G. Fernandes, A. A. R. Nogueira, J. A. Gomes Neto and J. A. Nóbrega, Talanta, 2007, 71, 1118–1123 CrossRef CAS PubMed.
- H. S. Ferreira, W. N. L. Santos, R. P. Fiuza, J. A. Nóbrega and S. L. C. Ferreira, Microchem. J., 2007, 87, 128–131 CrossRef CAS.
- L. Husáková, T. Sídová, T. L. Ibrahimová, M. Svízelov and T. Mikysek, J. Anal. At. Spectrom., 2019, 11, 1254–1263 Search PubMed.
- D. G. Filatova, V. V. Eskina, V. B. Baranovskaya, S. A. Vladimirova, A. M. Gaskov, M. N. Rumyantseva and Y. A. Kapov, Spectrochim. Acta, Part B, 2017, 140, 1–4 CrossRef.
- A. B. Volynskii, Chemical Modifiers in Modern Electrothermal Atomic Absorption Spectrometry, J. Anal. Chem., 2003, 58, 905–921 CrossRef CAS.
- L. Colares, E. R. Pereira, J. Merib, J. C. Silva, J. M. Silva, B. Welz, E. Carasek and D. L. G. Borges, J. Anal. At. Spectrom., 2015, 30, 381–388 RSC.
- R. J. González-Álvarez, D. Bellido-Milla, J. J. Pinto and C. Moreno, J. Anal. At. Spectrom., 2018, 33, 1925–1931 RSC.
- R. Dobrowolski, A. Mróz, M. Dąbrowska and P. Olszański, Spectrochim. Acta, Part B, 2017, 132, 13–18 CrossRef CAS.
- L. Rello, A. C. Lapeña, M. Aramendía, M. A. Belarra and M. Resano, Spectrochim. Acta, Part B, 2013, 81, 11–19 CrossRef CAS.
- M. Resano, L. Rello, E. Garcıá-Ruiz and M. A. Belarra, J. Anal. At. Spectrom., 2007, 22, 1250–1259 RSC.
- B. Welz, F. G. Lepri, R. G. O. Araujo, S. L. C. Ferreira, M. D. Huang, M. Okruss and H. Becker-Ross, Anal. Chim. Acta, 2009, 647, 137–148 CrossRef CAS.
- M. Resano, M. R. Flórez and E. García-Ruiz, Anal. Bioanal. Chem., 2014, 406, 2239–2259 CrossRef CAS PubMed.
- C. Abad, S. Florek, H. Becker-Ross, M. D. Huang, A. G. Buzanich, M. Radtke, A. cherLippitz, V. D. Hodoroaba, T. Schmid, H. J. Heinrich, S. Recknagel, N. Jakubowski and U. Panneac, J. Anal. At. Spectrom., 2018, 33, 2034–2042 RSC.
- M. A. Bechlin, E. C. Ferreira and J. A. Gomes Neto, Microchem. J., 2017, 132, 130–135 CrossRef CAS.
- A. Guarda, M. Aramendía, I. Andrés, E. García-Ruiza, P. C. Nascimento and M. Resano, Talanta, 2017, 162, 354–361 CrossRef CAS.
- N. Ozbek and S. Akman, Anal. Lett., 2018, 51, 2778–2791 CrossRef.
- M. Resano, J. Brice and M. A. Belarra, J. Anal. At. Spectrom., 2009, 24, 1343–1354 RSC.
- M. Resano and M. R. Florez, J. Anal. At. Spectrom., 2012, 27, 401–412 RSC.
- B. M. Soares, R. F. Santos, R. C. Bolzan, E. I. Muller, E. G. Primel and F. A. Duarte, Talanta, 2016, 160, 454–460 CrossRef CAS.
- M. Pozzatti, F. V. Nakadi, M. V. R. Goreti and B. Welz, Microchem. J., 2017, 133, 162–167 CrossRef CAS.
- D. V. Babos, A. I. Barros, C. Ferreira and J. A. Gomes Neto, Spectrochim. Acta, Part B, 2017, 130, 39–44 CrossRef CAS.
- W. Boschetti, M. Orlando, M. Dullius, M. B. Dessuy, M. G. R. Vale, B. Welz and J. B. Andrade, J. Anal. At. Spectrom., 2016, 31, 1269–1277 RSC.
- A. C. Valdivia, E. V. Alonso, M. M. L. Guerrero, J. Gonzalez-Rodriguez, J. M. C. Pavón and A. G. Torres, Talanta, 2018, 179, 1–8 CrossRef PubMed.
- M. Resano, E. Bolea-Fernández, E. Mozas, M. Flórez, P. Grinberg and R. Sturgeon, J. Anal. At. Spectrom., 2013, 28, 657 RSC.
- Z. Ajtony, N. Laczai, G. Dravecz, N. Szoboszlai, Á. Marosi, B. Marlok, C. Streli and L. Bencs, Food Chem., 2016, 213, 799–805 CrossRef CAS PubMed.
- S. Geisler, M. Okruss, H. Becker-Ross, M. D. Huang, N. Esser and S. Florek, Spectrochim. Acta, Part B, 2015, 107, 11–16 CrossRef CAS.
- V. A. Labusov, S. S. Boldova, D. O. Selunin, Z. V. Semenov, P. V. Vashchenko and S. A. Babin, J. Anal. At. Spectrom., 2019, 34, 1005–1010 RSC.
- F. Kaveh and D. Beauchemin, J. Anal. At. Spectrom., 2014, 29, 1371–1377 RSC.
- A. M. Esteban and B. Slowikowski, Crit. Rev. Anal. Chem., 2003, 33, 43–55 CrossRef.
- M. A. Belarra, M. Resano, F. Vanhaecke and L. Moens, TrAC, Trends Anal. Chem., 2002, 21, 828–839 CrossRef CAS.
- D. M. Goltz and E. D. Salin, J. Anal. At. Spectrom., 1997, 12, 1175–1180 RSC.
- A. Trenin, M. Gafurov, A. K. Gilmutdinov and G. Hermann, Spectrochim. Acta, Part B, 2007, 62, 231–241 CrossRef.
- W. L. Shen, J. A. Caruso, F. L. Fricke and R. D. Satzger, J. Anal. At. Spectrom., 1990, 5, 451–455 RSC.
- J. M. Ren and E. D. Salin, J. Anal. At. Spectrom., 1993, 8, 59–63 RSC.
- D. C. Grégoire and R. E. Sturgeon, Spectrochim. Acta, Part B, 1999, 54, 773–786 CrossRef.
- M. Resano, E. Garcia-Ruiz, L. Moens and F. Vanhaecke, J. Anal. At. Spectrom., 2005, 20, 81–87 RSC.
- B. Hu, S. Li, G. Xiang, M. He and Z. Jiang, Appl. Spectrosc. Rev., 2007, 42, 203–234 CrossRef CAS.
- E. H. Evans, M. Horstwood, J. Pisonero and C. M. M. Smith, J. Anal. At. Spectrom., 2013, 28, 779–800 RSC.
- G. L. Scheffler, D. Pozebon and D. Beauchemin, J. Anal. At. Spectrom., 2019, 34, 891–898 RSC.
- G. L. Donati, R. S. Amais and C. B. Williams, J. Anal. At. Spectrom., 2017, 32, 1283–1296 RSC.
- W. Wohlmann, V. M. Neves, G. M. Heidrich, J. S. Silva, A. B. Costa, J. N. G. Paniza and V. L. Dressler, Spectrochim. Acta, Part B, 2018, 149, 222–228 CrossRef CAS.
- M. Resano, E. García-Ruiz, M. A. Belarra, F. Vanhaecke and K. S. Mcintosh, TrAC, Trends Anal. Chem., 2007, 26, 385–395 CrossRef CAS.
- G. L. Scheffler, Y. Makonnen, D. Pozebon and D. Beauchemin, J. Anal. At. Spectrom., 2017, 32, 2041–2045 RSC.
- N. S. Medvedev, O. V. Lundovskaya and A. I. Saprykin, Microchem. J., 2019, 145, 751–755 CrossRef CAS.
- L. Huang and D. Beauchemin, J. Anal. At. Spectrom., 2017, 32, 1601 RSC.
- F. Kaveh, C. J. Oates and D. Beauchemin, Geochem.: Explor., Environ., Anal., 2014, 14, 305–313 CrossRef CAS.
- N. Kojima, Y. Mizoguchi, K. Tanabe, Y. Iida, B. Hashimoto, H. Uchihara, Y. Ohshita and Y. Okamoto, Polym. Test., 2017, 59, 262–267 CrossRef CAS.
- S. Kaczala, A. B. Costa, E. L. Posselt, J. S. Barin, E. M. M. Flores and V. L. Dressler, J. Braz. Chem. Soc., 2015, 26, 475–483 CAS.
- C. M. M. Santos, M. A. G. Nunes, A. B. Costa, D. Pozebon, F. A. Duarte and V. L. Dressler, Anal. Methods, 2017, 9, 3497–3504 RSC.
- A. Limbeck, M. Bonta and W. Nischkauer, J. Anal. At. Spectrom., 2017, 32, 212–232 RSC.
- S. Y. Huang, S. J. Jiang and A. C. Sahayam, Spectrochim. Acta, Part B, 2014, 101, 46–50 CrossRef CAS.
- W. H. Hsu, S. J. Jiang and A. C. Sahayam, Anal. Chim. Acta, 2013, 794, 15–19, DOI:10.1016/j.aca.2013.08.001.
- P. A. Mello, M. F. Pedrotti, S. M. Cruz, E. I. Muller, V. L. Dressler and E. M. M. Flores, J. Anal. At. Spectrom., 2015, 30, 2048–2055 RSC.
- S. Okabayashi, S. Sakata and T. Hirata, Anal. Chim. Acta, 2015, 853, 469–476 CrossRef CAS.
- D. Günther and B. Hattendorf, TrAC, Trends Anal. Chem., 2005, 24, 255–265 CrossRef.
- J. C. Miller, Laser Ablation: Principles and Applications, Springer-Verlag Berlin Heidelberg, 1994, p. 197 Search PubMed.
- R. E. Russo, X. Mao and O. V. Borisov, TrAC, Trends Anal. Chem., 1998, 17, 461–469 CrossRef CAS.
- K. K. K. Lam and W. T. Chan, J. Anal. At. Spectrom., 1997, 12, 7–12 RSC.
- D. Günther, I. Horn and B. Hattendorf, Fresenius. J. Anal. Chem., 2000, 368, 4–14 CrossRef PubMed.
- M. Thompson, J. E. Goulter and F. Sieper, Analyst, 1981, 106, 32–39 RSC.
- A. L. Gray, Analyst, 1985, 110, 551–556 RSC.
- A. A. Bol'shakov, X. Mao, J. J. González and R. E. Russo, J. Anal. At. Spectrom., 2016, 31, 119–134 RSC.
- S. E. Black, Laser Ablation: Effects and Applications, Nova Science Pub Inc, 2011, p. 289 Search PubMed.
- B. Hattendorf, C. Latkoczy and D. Günther, Anal. Chem., 2003, 75, 341–347 CrossRef.
- L. Dussubieux, M. Golitko and B. Gratuze, Recent Advances in Laser Ablation ICP-MS for Archaeology, Springer-Verlag Berlin Heidelberg, 2016, p. 361 Search PubMed.
- N. S. Mokgalaka and J. L. Gardea-Torresdey, Appl. Spectrosc. Rev., 2006, 41, 131–150 CrossRef CAS.
- C. Phipps, Laser Ablation and Its Applications, Springer, 2006, p.597 Search PubMed.
- B. Fernández, F. Claverie, C. Pécheyran and O. F. X. Donard, TrAC, Trends Anal. Chem., 2007, 26, 951–966 CrossRef.
- R. E. Russo, X. Mao, J. J. Gonzalez and S. S. Mao, J. Anal. At. Spectrom., 2002, 17, 1072–1075 RSC.
- F. Poitrasson and F. d'Abzac, J. Anal. At. Spectrom., 2017, 32, 1075–1091 RSC.
- O. B. Bauer, O. Hachmöller, O. Borovinskaya, M. Sperling, H. Schurek, G. Ciarimbolid and U. Karst, J. Anal. At. Spectrom., 2019, 34, 694–701 RSC.
- D. Pozebon, G. L. Scheffler, V. L. Dressler and M. A. G. Nunes, J. Anal. At. Spectrom., 2014, 29, 2204–2228 RSC.
- J. S. Becker, A. Matusch and B. Wu, Anal. Chim. Acta, 2014, 835, 1–18 CrossRef CAS PubMed.
- L. Mueller, H. Traub, N. Jakubowski, D. Drescher, V. I. Baranov and J. Kneipp, Anal. Bioanal. Chem., 2014, 406, 6963–6977 CrossRef CAS.
- A. M. Alkilany and C. J. Murphy, J. Nanopart. Res., 2010, 12, 2313–2333 CrossRef CAS.
- L. Feng, J. Wang, H. Li, X. Luo and J. Li, Anal. Chim. Acta, 2017, 984, 66–75 CrossRef CAS.
- M. C. Alonso, B. Fernandez, A. Navarro, S. Junceda, A. Astudillo and R. Pereiro, Talanta, 2019, 197, 413–421 CrossRef PubMed.
- D. Clases, S. Fingerhut, A. Jeibmann, M. Sperling, P. Doble and U. Karst, J. Trace Elem. Med. Biol., 2019, 51, 212–218 CrossRef CAS PubMed.
- X. Liao, Z. Hu, T. Luo, W. Zhang, Y. Liu, K. Zong, L. Zhou and J. Zhang, J. Anal. At. Spectrom., 2019, 34, 1126–1134 RSC.
- T. Luo, X. Deng, J. Li, Z. Hu, W. Zhang, Y. Liu and J. Zhang, J. Anal. At. Spectrom., 2019, 34, 1439–1446 RSC.
- C. D. Standish, T. B. Chalk, T. L. Babila, J. A. Milton, M. R. Palmer and G. L. Foster, Rapid Commun. Mass Spectrom., 2019, 33, 959–968 CrossRef CAS.
- C. Pasquini, J. Cortez, L. M. C. Silva and F. B. Gonzaga, J. Braz. Chem. Soc., 2007, 18, 463–512 CrossRef CAS.
- F. J. Fortes, J. Moros, P. Lucena, L. M. Cabalín and J. J. Laserna, Anal. Chem., 2013, 85, 640–669 CrossRef CAS PubMed.
- G. Galbács, Anal. Bioanal. Chem., 2015, 407, 7537–7562 CrossRef PubMed.
- R. Noll, Laser-induced breakdown spectroscopy: fundamentals and applications, Springer, Berlin, Heidelberg, 2012 Search PubMed.
- J. P. Singh and S. N. Thakur, Laser-Induced Breakdown Spectroscopy, Elsevier, Hungary, 2007 Search PubMed.
- A. W. Miziolek, V. Palleschi and I. Schechter, Laser-induced breakdown spectroscopy: fundamentals and applications, Cambridge, UK, 2006 Search PubMed.
- J. D. Winefordner, I. B. Gornushkin, T. Correll, E. Gibb, B. W. Smith and N. Omenetto, J. Anal. At. Spectrom., 2004, 19, 1061–1083 RSC.
- J. P. Castro and E. R. Pereira-Filho, J. Anal. At. Spectrom., 2016, 31, 2005–2014 RSC.
- E. Tognoni and G. Cristoforetti, Opt. Laser Technol., 2016, 79, 164–172 CrossRef CAS.
- J. Guezenoc, A. Gallet-Budynek and B. Bousquet, Spectrochim. Acta, Part B, 2019, 160, 105688 CrossRef CAS.
- J. E. Haddad, L. Canioni and B. Bousquet, Spectrochim. Acta, Part B, 2014, 101, 171–182 CrossRef.
- V. C. Costa, J. P. Castro, D. F. Andrade, D. V. Babos, J. A. Garcia, M. A. Sperança, T. A. Catelani and E. R. Pereira-Filho, TrAC, Trends Anal. Chem., 2018, 108, 65–73 CrossRef CAS.
- D. Cremers and R. C. Chinni, Appl. Spectrosc., 2009, 44, 457–506 CrossRef CAS.
- V. C. Costa, A. S. Augusto, J. P. Castro, R. C. Machado, D. F. Andrade, D. V. Babos, M. A. Sperança, R. R. Gamela and E. R. Pereira-Filho, Quim. Nova, 2019, 42, 527–545 CAS.
- D. A. Rusak, B. C. Castle, B. W. Smith and J. D. Winefordner, Crit. Rev. Anal. Chem., 2006, 27(4), 257–290 CrossRef.
- V. Lazic and S. Jovićević, Spectrochim. Acta, Part B, 2014, 101, 288–311 CrossRef CAS.
- J. Cuñat, F. J. Fortes, L. M. Cabalín, F. Carrasco, M. D. Simón and J. J. Laserna, Appl. Spectrosc., 2008, 62, 1250–1255 CrossRef PubMed.
- C. A. Munson, J. L. Gottfried, E. G. Snyder, F. C. De Lucia Jr, B. Gullett and A. W. Miziolek, Appl. Opt., 2008, 47, G48–G57 CrossRef CAS.
- B. Sallé, D. A. Cremers, S. Maurice and R. C. Wiens, Spectrochim. Acta, Part B, 2005, 60, 479–490 CrossRef.
- R. R. V. Carvalho, J. A. O. Coelho, J. M. Santos, F. W. B. Aquino, R. L. Carneiro and E. R. Pereira-Filho, Talanta, 2015, 134, 278–283 CrossRef CAS PubMed.
- M. A. Sperança, F. W. B. Aquino, M. A. Fernandes, A. Lopez-Castillo, R. L. Carneiro and E. R. Pereira-Filho, Geostand. Geoanal. Res., 2017, 41, 273–282 CrossRef.
- K. Subedi, T. Trejos and J. Almirall, Spectrochim. Acta, Part B, 2015, 103–104, 76–83 CrossRef CAS.
- M. Bonta and A. Limbeck, J. Anal. At. Spectrom., 2018, 33, 1591–1792 RSC.
- B. Sezer, G. Bilge and I. H. Boyaci, TrAC, Trends Anal. Chem., 2017, 97, 345–353 CrossRef CAS.
- D. Santos Jr, L. C. Nunes, G. G. A. Carvalho, M. S. Gomes, P. F. Souza, F. O. Leme, L. G. C. Santos and F. J. Krug, Spectrochim. Acta, Part B, 2012, 71–72, 3–13 CrossRef.
- J. Peng, F. Liu, F. Zhou, K. Song, C. Zhang, L. Ye and Y. He, TrAC, Trends Anal. Chem., 2016, 85, 260–272 CrossRef CAS.
- B. Busser, S. Moncayo, J. L. Coll, L. Sancey and V. Motto-Ros, Coord. Chem. Rev., 2018, 358, 70–79 CrossRef CAS.
- K. Liu, D. Tian, C. Li, Y. Li, G. Yang and Y. Ding, TrAC, Trends Anal. Chem., 2019, 110, 327–334 CrossRef CAS.
- M. Dell'Aglio, R. Alrifai and A. Giacomo, Spectrochim. Acta, Part B, 2018, 148, 105–112 CrossRef.
- C. Koral, A. Giacomo, X. Mao, V. Zorba and R. E. Russo, Spectrochim. Acta, Part B, 2016, 125, 11–17 CrossRef CAS.
- V. Spizzichino and R. Fantoni, Spectrochim. Acta, Part B, 2014, 99, 201–209 CrossRef CAS.
- A. Botto, B. Campanella, S. Legnaioli, M. Lezzerini, G. Lorenzetti, S. Pagnotta, F. Poggialinib and V. Palleschi, J. Anal. At. Spectrom., 2019, 34, 81–103 RSC.
- T. Li, Z. Hou, Y. Fu, J. Yu, W. Gu and Z. Wang, Anal. Chim. Acta, 2019, 1058, 39–47 CrossRef CAS PubMed.
- E. Mal, R. Junjuri, M. Kumar Gundawar and A. Khare, J. Anal. At. Spectrom., 2019, 34, 319–330 RSC.
- Á. Fernández-Bravo, T. Delgado, P. Lucena and J. J. Laserna, Spectrochim. Acta, Part B, 2013, 89, 77–83 CrossRef.
- Q. Wang, A. Chen, W. Xu, S. Li, Y. Jianga and M. JinWang, J. Anal. At. Spectrom., 2019, 34, 1242–1246 RSC.
- J. J. Camacho, J. Vrabel, S. Manzoor, L. V. Pérez-Arribas and J. O. Caceres, J. Anal. At. Spectrom., 2019, 34, 1247–1255 RSC.
- L. Zou, M. J. Stenslik, M. B. Giles, J. D. Ormes, M. Marsales, C. Santos, B. Kassim, J. P. Smith, J. J. Gonzalez and X. Bu, J. Anal. At. Spectrom., 2019, 34, 1351–1354 RSC.
- H. Qin, Z. Lu, S. Yao, Z. Li and J. Lu, J. Anal. At. Spectrom., 2019, 34, 347–355 RSC.
- E. S. Santos, E. M. Gama, R. S. França, A. S. Souza and R. P. Matos, Enciclopédia Biosf., 2013, vol. 9, pp. 3413–3432 Search PubMed.
- N. Nagata, M. Izabel, M. S. Bueno and P. G. Peralta-Zamora, Quim. Nova, 2001, 24, 531–539 CrossRef CAS.
- B. Beckhoff, Handbook of practical X-ray fluorescence analysis, Springer, Berlin, Heidelberg, 2006 Search PubMed.
- R. E. Van Grieken and A. A. Markowicz, Handbook of X-Ray Spectrometry, Marcel Dekker. Inc., New York, 2002 Search PubMed.
- U. Kramar, Encycl. Spectrosc. Spectrom., 2017, vol. 9, pp. 695–706 Search PubMed.
- S. B. Török, J. Lábár, M. Schmeling and R. E. Van Grieken, Anal. Chem., 1998, 70, 495–518 CrossRef.
- E. Marguí, I. Queralt and M. Hidalgo, TrAC, Trends Anal. Chem., 2008, 28, 362–372 CrossRef.
- R. Fernández-Ruiz, M. Redrejo and E. K. J. Friedrich, Spectrochim. Acta, Part B, 2018, 149, 107–111 CrossRef.
- R. Klockenkämper and A. Von Bohlen, J. Anal. At. Spectrom., 1999, 14, 571–576 RSC.
- P. M. Wrobel, M. Bogovac, H. Sghaier, J. J. Leani, A. Migliori, R. Padilla-Alvarez, M. Czyzyck, J. Osan, R. B. Kaiser and A. G. Karydas, Nucl. Instrum. Methods Phys. Res., 2016, 833, 105–109 CrossRef CAS.
- A. D. Surowka, P. Wrobel, M. M. Marzec, D. Adamek and M. Szczerbowska-Boruchowska, Spectrochim. Acta, Part B, 2016, 123, 47–58 CrossRef CAS.
- K. Janssens, W. Nolf, G. V. Snickt, L. V. B. Vekemans, R. Terzano and F. E. Brenker, TrAC, Trends Anal. Chem., 2010, 29, 464–478 CrossRef CAS.
- M. Haschke, Laboratory Micro-X-Ray Fluorescence Spectroscopy: Instrumentation and Applications, Springer International Publishing, Switzerland, 2014 Search PubMed.
- S. Majumdar, J. R. Peralta-Videa, H. Castilho-Michel, J. Hong, C. M. Rico and J. L. Gardea-Torresdey, Anal. Chim. Acta, 2012, 755, 1–16 CrossRef CAS PubMed.
- C. Vanhoof, J. R. Bacon, A. T. Ellis, L. Vincze and P. Wobrauschek, J. Anal. At. Spectrom., 2018, 33, 1413–1431 RSC.
- P. J. Potts and M. West, Portable X-ray Fluorescence Spectrometry: Capabilities for In Situ Analysis, Royal Society of Chemistry, Cambridge, 2008 Search PubMed.
- D. Guimarães, M. L. Praamsma and P. J. Parsons, Spectrochim. Acta, Part B, 2016, 122, 192–202 CrossRef.
- A. Guzzonato, F. Puype and S. J. Harrad, Chemosphere, 2016, 159, 89–95 CrossRef CAS PubMed.
- S. Pessanha, A. Samouco, R. Adão, M. L. Carvalho, J. P. Santos and P. Amaro, X-Ray Spectrom., 2017, 46, 102–106 CrossRef CAS.
- P. Y. Sharanov and N. V. Alov, J. Anal. Chem., 2018, 73, 868–876 CrossRef.
- P. M. Kopittke, T. Punshon, D. J. Paterson, R. V. Tappero, P. Wang, F. P. C. Blamey, A. Ent and E. L. Kopittke, Plant Physiol., 2018, 178, 507–523 CrossRef CAS.
- D. F. Anagnostopoulos, Spectrochim. Acta, Part B, 2018, 148, 83–91 CrossRef CAS.
- B. A. Lemière, J. Geochem. Explor., 2018, 188, 350–363 CrossRef.
- F. Bilo, L. Borgese, G. Pardini, E. Marguí, A. Zacco, R. Dalipi, S. Federici, M. Bettinelli, M. Volante, E. Bontempi and L. E. Depero, J. Anal. At. Spectrom., 2019, 34, 930–939 RSC.
- R. Ravansari and L. D. Lemke, Geoderma, 2018, 319, 175–184 CrossRef CAS.
- P. Liu, C. J. Ptacek, D. W. Blowes, Y. Z. Finfrock, M. Steinepreis and F. Budimir, Anal. Chem., 2019, 91, 5142–5149 CrossRef CAS PubMed.
- D. V. Babos, V. C. Costa and E. R. Pereira-Filho, Microchem. J., 2019, 147, 628–634 CrossRef CAS.
- H. Helmholz, J. Anal. At. Spectrom., 2019, 34, 356–365 RSC.
- S. Pessanha, S. Silva, L. Martins, J. P. Santos and J. M. Silveira, J. Anal. At. Spectrom., 2019, 34, 854–859 RSC.
- E. Calparsoro, M. Maguregui, H. Morillas, G. Arana and J. G. Iñañez, Ceram. Int., 2019, 45, 10672–10683 CrossRef CAS.
- B. B. S. Jaswal, P. K. Rai, T. Singh, V. Zorba and V. K. Singh, X-Ray Spectrom., 2019, 48, 178–187 CrossRef CAS.
- S. Dhara, K. Sanyal, S. Paul and N. L. Misra, J. Anal. At. Spectrom., 2019, 34, 366–374 RSC.
- J. Pisonero, J. M. Costa, R. Pereiro, N. Bordel and A. Sanz-Medel, Anal. Bioanal. Chem., 2004, 379, 17–29 CrossRef CAS PubMed.
- R. Pereiro, A. Solà-Vázquez, L. Lobo, J. Pisonero, N. Bordel, J. M. Costa and A. Sanz-Medel, Spectrochim. Acta, Part B, 2011, 66, 399–412 CrossRef CAS.
- A. Bogaerts and R. Gijbels, Spectrochim. Acta, Part B, 1998, 53, 1–42 CrossRef.
- A. Bengtson and T. Nelis, Anal. Bioanal. Chem., 2006, 385, 568–585 CrossRef CAS.
- Z. Weiss, Spectrochim. Acta, Part B, 2006, 61, 121–133 CrossRef.
- B. Fernández, R. Pereiro and A. Sanz-Medel, Anal. Chim. Acta, 2010, 679, 7–16 CrossRef PubMed.
- J. Pisonero, B. Fernández, R. Pereiro, N. Bordel and A. Sanz-Medel, TrAC, Trends Anal. Chem., 2006, 25, 11–18 CrossRef CAS.
- Z. Weiss, J. Anal. At. Spectrom., 2015, 30, 1038–1049 RSC.
- R. Payling, D. G. Jones and A. Bengtson, Glow discharge optical emission spectrometry, John Wiley, New York, 1997 Search PubMed.
- I. Heikkilä, C. Eggertson, M. Randelius, S. Caddeo-Johansson and D. Chasoglou, Met. Powder Rep., 2016, 71, 261–264 CrossRef.
- D. Mercier, M. Bouttemy, J. Vigneron, P. Chapon and A. Etcheberry, Appl. Surf. Sci., 2015, 347, 799–807 CrossRef CAS.
- G. Gamez, M. Voronov, S. J. Ray, V. Hoffmann, G. M. Hieftje and J. Michler, Spectrochim. Acta, Part B, 2012, 70, 1–9 CrossRef CAS.
- V. Hoffmann, M. Kasik, P. K. Robinson and C. Venzago, Anal. Bioanal. Chem., 2005, 381, 173–188 CrossRef CAS.
- L. Lobo, B. Fernández and R. Pereiro, J. Anal. At. Spectrom., 2017, 32, 920–930 RSC.
- L. Lobo, R. Pereiro and B. Fernández, Encycl. Anal. Sci. 2019, pp. 1–8 Search PubMed.
- C. D. Quarles, J. Castro and R. K. Marcus, Encycl. Spectrosc. Spectrom., 2017, vol. 70, pp. 30–36 Search PubMed.
- M. R. Winchester and R. Payling, Spectrochim. Acta, Part B, 2004, 59, 607–666 CrossRef.
- L. Wilken, V. Hoffmann and K. Wetzig, Spectrochim. Acta, Part B, 2007, 62, 1085–1122 CrossRef.
- B. Fernández, R. Pereiro and A. Sanz-Medel, Anal. Chim. Acta, 2010, 679, 7–16 CrossRef PubMed.
- M. Bouza, B. Fernández, C. González-Gago, N. Bordel, R. Pereiro and A. Sanz-Medel, Anal. Chim. Acta, 2012, 756, 30–36 CrossRef CAS PubMed.
- P. Sánchez, B. Fernández, A. Menéndez, J. Orejas, R. Pereiro and A. Sanz-Medel, Anal. Chim. Acta, 2010, 684, 47–53 CrossRef.
- G. Gamez and K. Finch, Spectrochim. Acta, Part B, 2018, 148, 129–136 CrossRef CAS.
- J. Yu, S. Yanga, Q. Lua, D. Sunc, J. Zhenga, X. Zhanga, X. Wanga and W. Yang, Talanta, 2017, 164, 216–221 CrossRef CAS PubMed.
- C. Gonzalez-Gago, P. Smid, T. Hofmann, C. Venzago, V. Hoffmann, W. Gruner, J. Pfeifer, S. Richter and H. Kipphardt, J. Anal. At. Spectrom., 2019, 34, 1109–1125 RSC.
- X. Wei, Z. Qin, P. Xiong, L. Wang, H. Zhang, D. Deng and J. Liao, Spectrochim. Acta, Part B, 2019, 154, 43–49 CrossRef CAS.
- D. Gunther, S. E. Jackson and H. P. Longerich, Spectrochim. Acta, Part B, 1999, 54, 381–409 CrossRef.
- M. Resano, E. García-Ruiz, K. S. McIntosh, J. Hinrichs, I. Deconinck and F. Vanhaecke, J. Anal. At. Spectrom., 2006, 21, 899–909 RSC.
- Z. Zhou, K. Zhou, X. Hou and H. Luo, Appl. Spectrosc. Rev., 2005, 40, 165–185 CrossRef CAS.
- M. Hemmerlin, L. Paulard and G. Schotter, J. Anal. At. Spectrom., 2003, 18, 282–286 RSC.
- R. R. Barefoot, J. Anal. At. Spectrom., 1998, 13, 1077–1084 RSC.
| This journal is © The Royal Society of Chemistry 2020 |