
A highly active Pt/In2O3 catalyst for CO2 hydrogenation to methanol with enhanced stability†
Kaihang
Sun
ab,
Ning
Rui
ab,
Zhitao
Zhang
ab,
Zeyu
Sun
ab,
Qingfeng
Ge
c and
Chang-Jun
Liu
 *ab
*ab
aTianjin Co-Innovation Center of Chemical Science & Engineering, Tianjin University, Tianjin 300072, China. E-mail: ughg_cjl@yahoo.com
bSchool of Chemical Engineering and Technology, Tianjin University, Tianjin 300072, China
cDepartment of Chemistry and Biochemistry, Southern Illinois University, Carbondale, Illinois 62901, USA
First published on 26th June 2020
Abstract
Supported Pt catalysts have been extensively investigated for CO2 hydrogenation with methane and CO as the principal products. In this work, a Pt/In2O3 catalyst prepared with decomposition precipitation was tested for CO2 hydrogenation to methanol. The Pt/In2O3 catalyst exhibited a highly improved activity towards CO2 hydrogenation, with methanol selectivity of ca. 100% at temperatures below 225 °C, 74% at 275 °C and 54% at 300 °C, respectively, compared to the pure In2O3 catalyst. This represents the highest methanol selectivity reported on Pt catalysts for CO2 hydrogenation. The stability of the Pt/In2O3 catalyst at elevated temperatures has also been higher than that of the pure In2O3 catalyst, indicated by the methanol formation rate decreasing only to 95% of the initial rate after 5 h in the reaction stream and remaining largely constant thereafter. In contrast, the pure In2O3 catalyst loses 20% of the initial methanol formation rate after 9 h in the reaction stream. The characterization of the catalysts confirms that the Pt nanoparticles are well dispersed on In2O3 with a particle size below 3 nm. The strong metal–support interaction (SMSI) between Pt and In2O3 improves the stability of the catalyst and prevents the over-reduction of In2O3. The synergy between the supported Pt nanoparticles and In2O3 balances the hydrogen activation and the density of the surface oxygen vacancies in In2O3, resulting in the high activity for CO2 hydrogenation and enhanced stability of the Pt/In2O3 catalyst.
Introduction
With the development of renewable energy, CO2 capture and utilization1–4 have the potential to alleviate the elevated CO2 level. Hydrogenation of CO2 to methanol5 has been considered as key to the so-called “methanol economy”.6 Meanwhile, this process can also be considered as a means of hydrogen storage and/or energy storage.7 Extensive and continual efforts have been made over the past decades to develop a highly active catalyst with high methanol selectivity. The investigated catalysts include those based on Cu/ZnO,8–10 ZnO–ZrO2,11 GaNi alloy,12 bimetallic PdZn13 and others. Our group predicted via density functional theoretical (DFT) studies, and then confirmed experimentally, that In2O3 with oxygen vacancies exhibited a high activity for CO2 activation and further high selectivity for hydrogenation to methanol.14–18 Since then, In2O3-based catalysts have attracted increasing attention as novel catalysts for CO2 hydrogenation to methanol. Further studies include novel preparation and characterization of In2O3,19–21 combination of In2O3 with other oxides, such as ZrO2,22–25 and the addition of metals, including copper,26,27 cobalt,28 palladium,18,29 rhodium,30 and nickel,31 to further improve the catalytic activity for CO2 activation and hydrogenation. It has also been demonstrated that the strong hydrogenation ability of the metal catalysts enhances the hydrogenation of the In2O3-supported metal catalysts.18,26–33 Among the metals considered, platinum is an important one for its extensive applications in hydrogenation and photo-catalytic conversion.33 Although a Pt/In2O3 film catalyst has been shown to exhibit an enhanced activity for CO2 hydrogenation to methanol, the reaction was performed under atmospheric pressure plasma conditions.32 The In2O3-supported Pt catalyst has not been examined for thermal catalytic methanol synthesis from CO2 and hydrogen.The supported Pt catalysts normally exhibit a high activity for CO2 hydrogenation to methane and CO. The metal dispersion,34–36 the acidity of the support,35 the effect of the promoter37 and oxygen vacancies,36 the metal–support interaction,34,35,38,39 and the degree of Pt reduction40,41 have been shown to affect the activity and selectivity. CO2 hydrogenation to methanol has been investigated as well.42,43 But the most selective products remain to be methane and CO over the Pt catalysts.34–36 A Pt catalyst with high methanol selectivity from CO2 hydrogenation is desired.
Although In2O3-based catalysts are active and selective for methanol synthesis from CO2 and H2, the over-reduction of In2O3 under the reaction conditions causes deactivation and a decrease in selectivity because In2O3 can be reduced readily in the presence of hydrogen and CO.19,44,45 Over-reduced In2O3 catalyses preferably the competing reverse water gas shift (RWGS) reaction, resulting in CO instead of methanol, especially at elevated reaction temperatures. CO is more potent at reducing In2O3 than H2. Its production during the reaction exacerbates the problem, leading to further reduction of the activity and selectivity.19
In this work, we prepared the Pt/In2O3 catalysts using the decomposition precipitation method. The resulting catalyst shows an improved activity over In2O3 alone. High methanol selectivity was achieved on the Pt/In2O3 catalyst with a methanol selectivity of ca. 100% at temperatures below 225 °C. The methanol selectivity was maintained at 74% at 275 °C and 54% at 300 °C. Inhibition of the over-reduction of In2O3 was achieved due to the strong metal–support interaction (SMSI) between Pt and In2O3, resulting in the enhanced stability.
Experimental
Catalyst preparation
In2O3 was prepared using the precipitation method. In(NO3)3·4H2O (HWRK Chem, 99.99%) and Na2CO3·10H2O (Tianjin Kermel Chemical Reagent, 99%) are the precursor and precipitant, respectively. Firstly, a desired amount of the precursor was dissolved in 100 mL of deionized water (0.15 mol L−1), followed by vigorous stirring at 70 °C until fully dissolved. Then 0.2 mol L−1 of Na2CO3 was added to the solution dropwise at the same temperature until the pH value reached 7. The mixture was aged at 80 °C for 2 h after being stirred for an additional 0.5 h. The precipitate was then washed with deionized water several times. The resulting solid was dried at 80 °C for 12 h prior to calcination in static air at 450 °C for 3 h.The Pt/In2O3 catalyst was prepared using the deposition–precipitation method. Platinum nitrate hydrate (Aladdin Chemicals, Shanghai, 18.02 wt% of metal platinum basis) was first dissolved in 50 mL of deionized water. The as-prepared In2O3 was then added into the solution, and the resulting mixture was stirred vigorously for 1 h at room temperature. This was followed by adding an excess amount of urea (0.2 g) into the mixture under continuous stirring at 80 °C for 3 h while the precipitate formed. The precipitate was washed and filtered with 500 mL of deionized water. Prior to calcination in static air at 450 °C for 3 h, the precipitate was freeze-dried overnight.
Characterization
The catalyst samples were characterized using X-Ray fluorescence (XRF) spectroscopy on a JEOL Supermini200 system, equipped with a palladium X-ray source (Pd anode, 50 kV and 200 W). 77 K N2 adsorption/desorption isotherms of the samples were measured on an AUTOSORB-1-C instrument (Quantachrome). The specific surface area (SBET) was calculated using the Brunauer–Emmett–Teller (BET) model.The crystal structure of the catalyst was determined by powder X-ray diffraction (PXRD), using a Rigaku D/max 2500v/pc diffractometer with Cu Kα radiation (40 kV, 200 mA) at a scanning rate of 1° min−1 within the 2![[thin space (1/6-em)]](https://www.rsc.org/images/entities/char_2009.gif) θ range of 10°–90°. The phase identification was performed by comparing with the Joint Committee on Powder Diffraction Standards (JCPDS).
θ range of 10°–90°. The phase identification was performed by comparing with the Joint Committee on Powder Diffraction Standards (JCPDS).
Transmission electron microscopy (TEM) images were collected on a JEOL JEM-2100F system equipped with an energy-dispersive X-ray spectrometer (EDX) operated at 200 kV. The sample powder was suspended in ethanol and dispersed ultrasonically for 10 min. A drop of the suspension was deposited on a copper grid coated with carbon.
Temperature-programmed reduction of hydrogen (H2-TPR) was conducted on a Micromeritics Autochem II 2920 chemisorption analyzer. About 200 mg of the sample was placed into a U-shaped quartz tube. The tube with the sample was purged by flowing helium for 1 h at 200 °C to remove the absorbed impurities. After cooling to −50 °C with liquid nitrogen under flowing helium, the sample was heated to 350 °C at a rate of 10 °C min−1 under a gaseous mixture of 10% H2 in N2 as the reductant. The effluent gas was analysed with a TCD. The TCD signal was normalized to the weight of the sample for subsequent analysis.
Temperature-programmed desorption of carbon dioxide (CO2-TPD) was conducted on the Micromeritics Autochem II 2920 chemisorption analyzer equipped with a Hiden HPR-20 mass spectrometer (MS). About 100 mg of the sample was placed in a U-shaped quartz tube and reduced with 10% H2/Ar for 1 h at 200 °C and then cooled to 50 °C under flowing helium, followed by CO2 adsorption at the same temperature for 1 h. The tube with the sample was purged with flowing helium for 1 h to remove physically adsorbed CO2. It was then heated to 500 °C at a rate of 10 °C min−1 under flowing helium. The effluent gas was analysed using the TCD and mass spectrometer (the signal of m/z = 44 was collected from the TCD outlet). The signal was also normalized to the weight of the sample for subsequent analysis.
Raman spectra were acquired using an inVia Reflex Renishaw Raman Spectroscopy System in the range of 200–800 nm, with a 532 nm laser as the excitation source. The laser power was set at 7 mW and the integration time was 5 s. The Raman signals were normalized to the weight of the sample for the subsequent analysis.
The UV–vis absorption spectra of the samples were recorded with a UV-2600 UV–vis spectrophotometer (Shimadzu Corporation) to investigate the formation of surface oxygen vacancies.
Catalytic activity test
The catalytic activity for CO2 hydrogenation to methanol over the Pt/In2O3 catalyst and the pure In2O3 catalyst was tested in a vertical fixed bed reactor. 0.2 g of catalyst was diluted with 1.0 g of SiC before being loaded into the reactor. Prior to the test, the reactor with the catalyst was purged with N2 (30 ml min−1) for 0.5 h at room temperature. The Pt/In2O3 catalyst was pre-reduced under flowing hydrogen (H2/N2 = 1/9, molar ratio, 30 ml min−1) at 200 °C for 1 h. The reactant mixture (H2/CO2/N2 = 76/19/5, molar ratio) was then introduced into the reactor until the pressure reached 5 MPa. The catalytic activity was measured from 200 °C to 300 °C at a constant flow rate of 70 ml min−1. The gaseous hourly space velocity (GHSV) was adjusted to 21000 cm3 h−1 gcat−1. The effluent was analysed with an online gas chromatograph (Agilent 7890A) equipped with two columns, one connected to a flame ionized detector (FID) and the other to the thermal conductivity detector (TCD). The valves and lines between the reactor outlet and the GC inlet were maintained at 110 °C to prevent the condensation of methanol.
The CO2 conversion (XCO2), methanol selectivity (Smethanol), and methanol formation rate were calculated according to the following equations:

where F is the molar flow rate, M the molar mass of methanol and W the weight of the catalyst.
Results and discussion
Catalytic activity tests
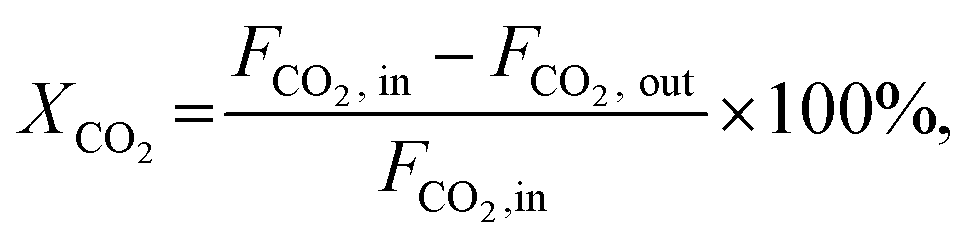
Fig. 1a shows CO2 conversion and methanol selectivity on the pure In2O3 and Pt/In2O3 catalysts. Obviously, the conversion of CO2 increases when the reaction temperature is increased. The methanol selectivity is close to 100% at reaction temperatures below 225 °C. It decreases when the temperature is increased further as the competing RWGS reaction is endothermic. On the other hand, the selectivity toward methanol is still higher than 70% at 275 °C and 50% at 300 °C. These results indicate that the Pt/In2O3 catalyst remains highly selective for methanol synthesis from CO2 hydrogenation. Furthermore, as shown in Fig. 1b, the Pt/In2O3 catalyst shows a significantly higher methanol formation rate than the pure In2O3 catalyst at the same temperature. The CO2 conversion reaches 17.3% at 300 °C for the Pt/In2O3 catalyst with a methanol formation rate of 0.542 gmethanol h−1 gcat−1, significantly higher than 0.335 gmethanol h−1 gcat−1 on the pure In2O3 catalyst with a CO2 conversion of 9.4%. These results clearly demonstrate that the Pt loading (1.07 wt% according to the results of XRF) on In2O3 significantly increases the CO2 conversion and the methanol formation rate. The comparison of typically reported catalysts for CO2 hydrogenation to methanol is shown in Table S1.† The Pt/In2O3 catalyst shows a higher activity than most of the reported catalysts. Compared to the supported Ni and Rh catalysts in Table S1,† the Pt/In2O3 catalyst shows better CO2 conversion with higher selectivity towards methanol at lower temperatures of 250 °C and 275 °C. | ||
| Fig. 1 Catalytic activity tests of the Pt/In2O3 and pure In2O3 catalysts. (a) CO2 conversion and methanol selectivity, (b) methanol formation rate as a function of reaction temperature, (c) apparent activation energy of CO2 conversion and (d) methanol formation rate versus time of the catalyst in the reaction stream (TOS). | ||
The methanol selectivity of the Pt/In2O3 catalyst at 300 °C is slightly lower than that of the pure In2O3 catalyst at the same temperature, due largely to the agglomeration of the Pt nanoparticles at elevated temperatures. The average size of the Pt nanoparticles increases from 1.47 nm to 2.42 nm after reaction at 300 °C and 5 MPa. The large-sized Pt nanoparticles facilitate RWGS reaction according to the literature.29 We speculate that hydrogenation of CO2 over Pt nanoparticles prefers to undergo the RWGS + CO-hydrogenation pathway. Weakening the binding of CO on the Pt nanoparticles leads to higher selectivity to CO.38 Thus, the methanol selectivity of the Pt/In2O3 catalyst is lower than that over the pure In2O3 catalyst at 300 °C.
The apparent activation energy of the pure In2O3 and the Pt/In2O3 catalysts was calculated based on the Arrhenius equation at a CO2 conversion of less than 15% to minimize the effect of mass and heat transfer. As shown in Fig. 1c, the activation energy of CO2 conversion over the Pt/In2O3 catalyst is 73.78 kJ mol−1, much lower than that over the pure In2O3 catalyst (103.16 kJ mol−1). This indicates that the Pt loading on In2O3 significantly reduces the activation barrier for CO2 conversion. The apparent activation energy for methanol and CO production was calculated and is shown in Fig. S1.† For methanol production, the activation energies on the Pt/In2O3 and pure In2O3 catalysts are 64.08 kJ mol−1 and 91.83 kJ mol−1, respectively. This indicates that the supported Pt nanoparticles reduce the activation energy of methanol production significantly from that on the pure In2O3 catalyst. In contrast, the activation energies for CO production are 102.18 kJ mol−1 and 96.48 kJ mol−1 on the Pt/In2O3 and pure In2O3 catalysts, respectively. These results demonstrate that supported Pt over In2O3 promotes methanol production, while it suppresses the RWGS reaction.
Tsoukalou et al.19 reported that In2O3 was not stable over the course of the CO2 hydrogenation reaction and could not maintain its initial activity with a 200 min test. They concluded that the formation of In0 as a result of partial reduction of In2O3 caused deactivation,19 which typically occurs at elevated temperatures. The present results show that the stability of the pure In2O3 catalyst can be significantly improved in the presence of well-dispersed Pt nanoparticles. As shown in Fig. 1d, the methanol formation rate on the Pt/In2O3 catalyst only decreased slightly from its initial value and was stabilized at 95% of the initial rate after a 5 h reaction at 300 °C and 5 MPa. In contrast, the pure In2O3 catalyst needs 9 h to become stable under the same reaction conditions with a much more significant reduction (20%) in the methanol formation rate.
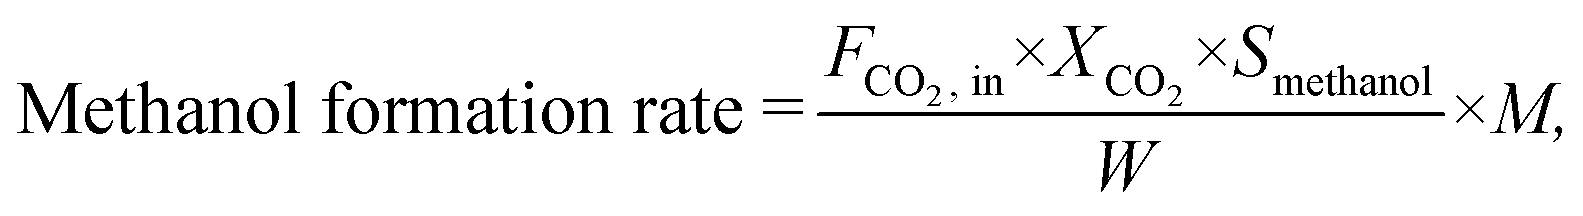
X-ray diffraction and TEM analysis
Based on the results of N2 adsorption, the specific surface areas of the Pt/In2O3 and pure In2O3 catalysts were determined to be 63.8 m2 g−1 and 65.8 m2 g−1, respectively. The XRD patterns of the Pt/In2O3 and pure In2O3 catalysts are shown in Fig. 2. The Pt/In2O3 catalyst before hydrogen reduction was named “Pt/In2O3-BT”. The samples after reaction at 300 °C and 5 MPa were labelled as “Pt/In2O3-AR” and “In2O3-AR”. The diffraction peaks at 21.5°, 30.7°, 35.5°, 45.7°, 51.0° and 60.7° were assigned to the diffraction from the (211), (222), (400), (431), (440) and (622) planes of the Ia![[3 with combining macron]](https://www.rsc.org/images/entities/char_0033_0304.gif) (206) space group according to PDF#06-0416. No characteristic diffraction peaks of the Pt species could be observed in the XRD patterns, indicating that Pt is highly dispersed on In2O3 with sizes below 3 nm. Fig. 2 also indicates that the crystal structure of the Pt/In2O3 catalyst remains intact after hydrogen reduction and reaction.
(206) space group according to PDF#06-0416. No characteristic diffraction peaks of the Pt species could be observed in the XRD patterns, indicating that Pt is highly dispersed on In2O3 with sizes below 3 nm. Fig. 2 also indicates that the crystal structure of the Pt/In2O3 catalyst remains intact after hydrogen reduction and reaction.
 | ||
| Fig. 2 XRD patterns of the Pt/In2O3 and pure In2O3 catalysts. | ||
Figs. 3a and b show the TEM images of the Pt/In2O3 catalyst. As shown in Fig. 3c, the well-dispersed Pt nanoparticles, with an average diameter of 1.47 nm, on In2O3 can be clearly observed. The lattice spacing of the Pt particle on In2O3 is 0.2272 nm, which can be attributed to the (111) planes. As shown in Figs. 3d and e, the Pt nanoparticles exposing the (111) facet with a lattice spacing of 0.2310 nm can also be observed after reaction at 300 °C and 5 MPa. The increase can be attributed to the diffusion of Pt nanoparticles towards the bulk region of In2O3.29 The average diameter increases to 2.42 nm but is still below 3 nm as shown in Fig. 3f. The samples annealed at high temperature (>700 K) appear to undergo a classical SMSI transition, as has been observed for Pt and TiO2.46 Therefore, a thin In2O3 overlayer covering the Pt nanoparticles indicates that the SMSI between Pt and In2O3 exists before and after the reaction.47–49
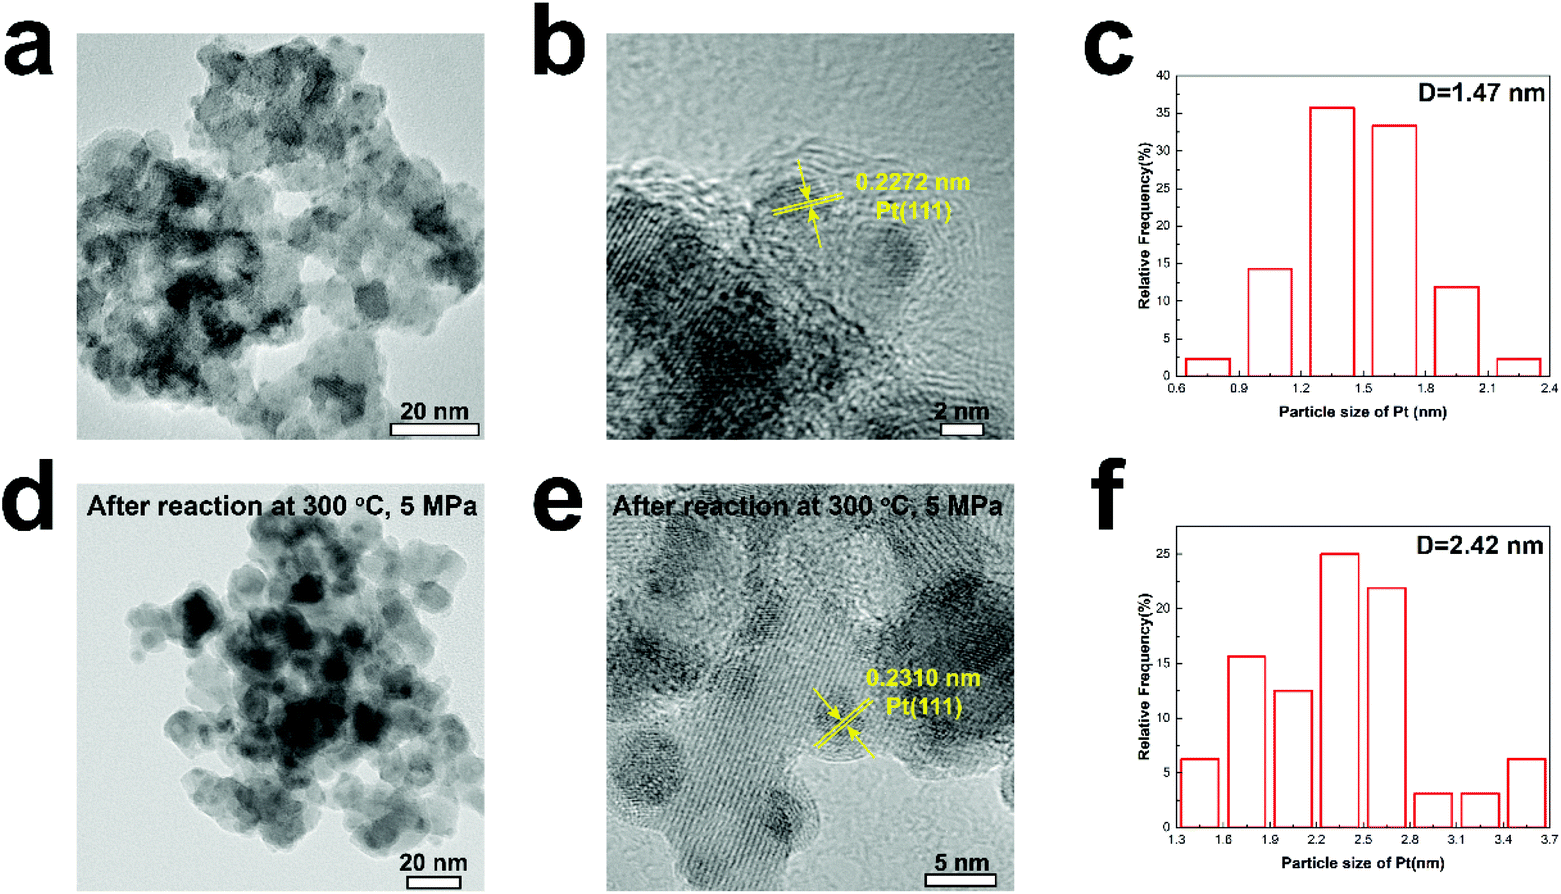 | ||
| Fig. 3 (a) and (b) TEM images of the Pt/In2O3 catalyst, (c) particle size distribution for the Pt/In2O3 catalyst, (d) and (e) TEM images of Pt/In2O3 after reaction, and (f) particle size distribution for Pt/In2O3 after reaction. | ||
Figs. 4a and b show the TEM images of the pure In2O3 catalyst before the reaction and Figs. 4c and d show those after the reaction. The In2O3 particles can be clearly identified with lattice fringes attributable to the (222) and (211) planes, suggesting that the catalyst exists in the form of In2O3 and retains good crystallinity, consistent with the XRD results.
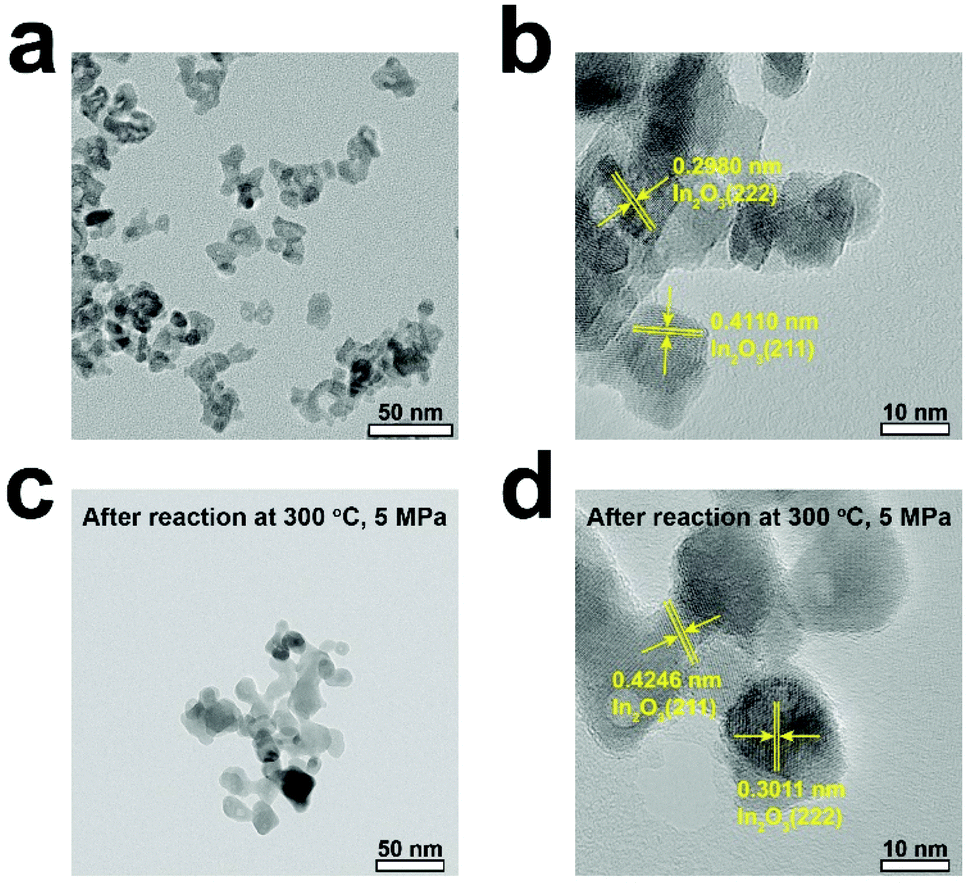 | ||
| Fig. 4 TEM images of (a and b) the fresh In2O3 catalyst and (c and d) the pure In2O3 catalyst after reaction. | ||
Raman spectroscopy
Raman spectroscopy has been believed to provide direct spectroscopic evidence of the oxygen vacancies in In2O3.50,51 In the present study, the catalysts were analysed using room temperature-visible Raman scattering to probe the oxygen vacancies in In2O3. The Raman spectra are shown in Fig. 5a. The peak at 131 cm−1 is assigned to the In-O vibration of the InO6 structural units.52 The peak at 307 cm−1 is usually interpreted as the bending vibration δ(InO6) of octahedra.53 The two peaks at 497 cm−1 and 629 cm−1 are attributed to the stretching vibration of the same ν(InO6) octahedra.50 The scattering feature at 367 cm−1 can be attributed to the stretching vibration of In-O-In (ν (In-O-In)) and it reflects the presence of oxygen vacancies in the In2O3.15,50,51,54,55 The intensities of the 367 cm−1 peak of Pt/In2O3 and In2O3-R (In2O3 after hydrogen reduction) increase significantly compared to those of the fresh samples, consistent with the expectation that hydrogen reduction creates more oxygen vacancies.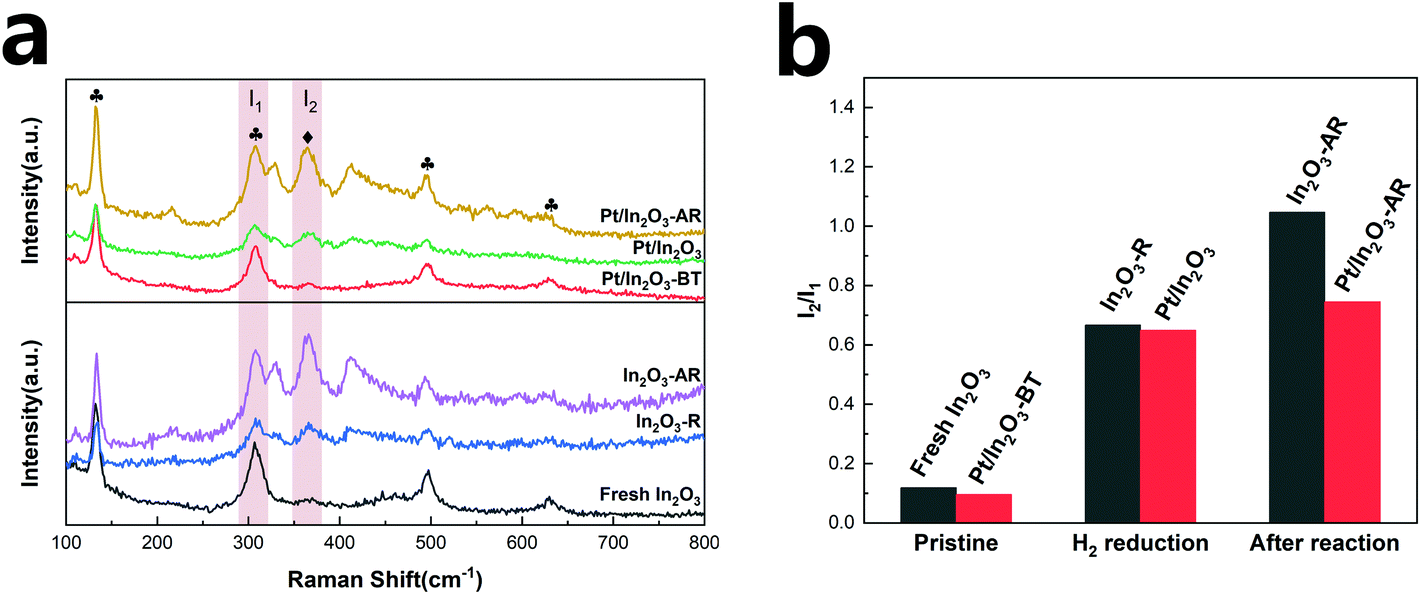 | ||
Fig. 5 (a) Visible Raman spectra of the Pt/In2O3 and pure In2O3 catalysts, (b) comparison of the relative amount of the oxygen vacancies according to the I2/I1 ratio.  : InO6 octahedron, : InO6 octahedron,  : the stretching vibrations of In-O-In. In2O3-R represents the In2O3 catalyst after hydrogen reduction (H2/N2 = 1/9, molar ratio, at 200 °C for 1 h). : the stretching vibrations of In-O-In. In2O3-R represents the In2O3 catalyst after hydrogen reduction (H2/N2 = 1/9, molar ratio, at 200 °C for 1 h). | ||
In order to quantify the oxygen vacancies, we integrated the peaks at 307 cm−1 (I1) and 367 cm−1 (I2) and used the I2/I1 ratio to characterize the amount of the oxygen vacancies on In2O3.56 As shown in Fig. 5b, the oxygen vacancies in the Pt/In2O3-BT sample are 81% of those of the pure In2O3 catalyst, likely due to the presence of the PtOx species covering some oxygen vacancies. However, the amount of the oxygen vacancies on the Pt/In2O3 catalyst increases to 92% of the In2O3-R sample after hydrogen reduction. This suggests that the well-dispersed Pt nanoparticles have a favourable effect on the formation of the oxygen vacancies over In2O3.
More importantly, the amount of the oxygen vacancies on the pure In2O3 and the Pt/In2O3 catalysts varies quite differently after the reaction at 300 °C and 5 MPa. In2O3-AR has many more oxygen vacancies than Pt/In2O3-AR. However, the catalytic activity and stability of the pure In2O3 catalyst are worse than those of the Pt/In2O3 catalyst. These results demonstrate that the additional oxygen vacancies created at high temperature in In2O3 had a negative effect on the reaction, causing In2O3 over-reduction and destabilization of the catalyst. This is, in general, consistent with Tsoukalou et al.,19 who showed that the over-reduction of In2O3 results in the formation of metallic indium, which is inactive for hydrogen activation.
Hydrogen temperature programmed reduction
H2-TPR was used to characterize the reduction behaviour of the catalyst and the formation of oxygen vacancies. As shown in Fig. 6a, the reduction peak at 133 °C of pure In2O3 can be assigned to the reduction of the surface, corresponding to the formation of the surface oxygen vacancies.15,18,54 The reduction peaks appear at much lower temperatures of 11 °C and 41 °C for the Pt/In2O3-BT sample. These peaks can be assigned to the reduction of the PtOx species with the assistance of the Pt nanoparticles.29 The formation of PtOx also indicates the existence of the SMSI between Pt and In2O3, which in turn promotes dispersion of the Pt nanoparticles.47,57,58 Furthermore, the active H adatoms spilled over from the Pt nanoparticles to In2O3 can also cause the reduction of the In2O3 surface,18,29,59 making the In2O3 surface reduction peak disappear. The normalized intensity of the reduction peak of the Pt/In2O3-BT sample is much higher than that of In2O3. This also confirms that the well-dispersed Pt nanoparticles promote the formation of the surface oxygen vacancies of In2O3 during hydrogen reduction. This is in line with the results of the Raman analyses discussed above.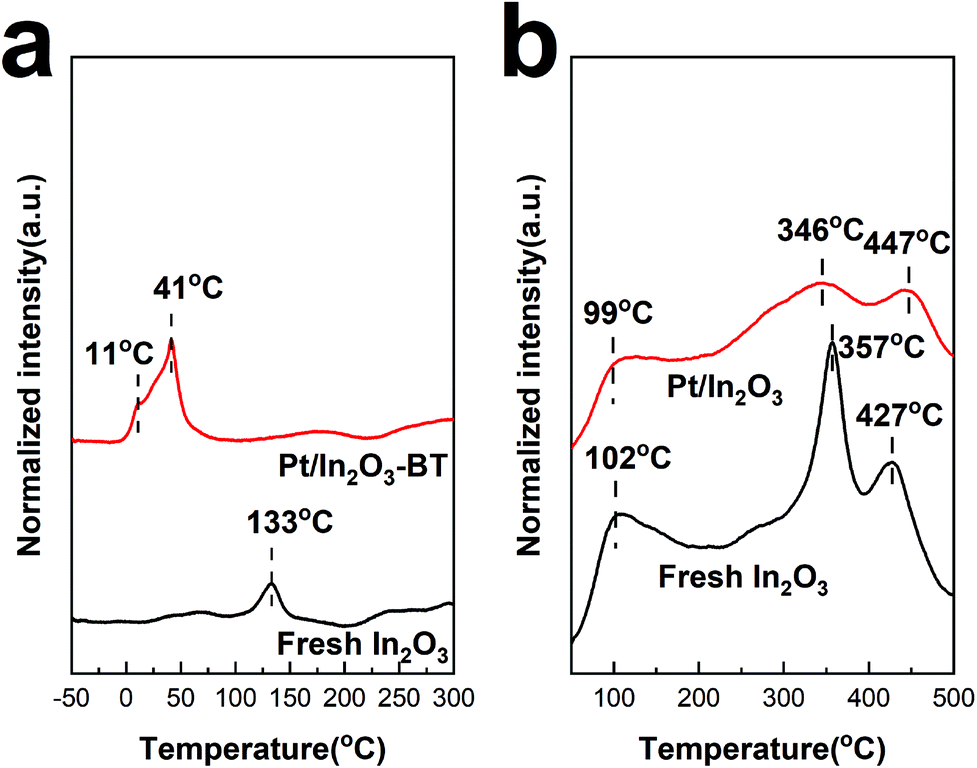 | ||
| Fig. 6 (a) H2-TPR profiles and (b) CO2-TPD profiles of the Pt/In2O3 and pure In2O3 catalysts. | ||
CO2 temperature programmed desorption
Generally, the surface oxygen vacancies on In2O3 promote CO2 adsorption and activation.15 Therefore, CO2 can be used as a probe molecule to characterize the surface oxygen vacancies on In2O3 through CO2-TPD.60 The profiles of CO2-TPD in Fig. 6b confirm that less CO2 is adsorbed on the Pt/In2O3 catalyst than on the pure In2O3 catalyst. The peak located at ca. 100 °C for these two samples is assigned to the physically adsorbed CO2. It is noteworthy that the normalized intensity of the desorption peak at 357 °C for fresh In2O3 is much stronger than that for the Pt/In2O3 catalyst. This peak can be attributed to CO2 adsorption in the hydrogen-induced surface oxygen vacancies.18 The peaks at 447 °C for the Pt/In2O3 catalyst and 427 °C for the pure In2O3 catalyst belong to CO2 adsorption in the thermally induced oxygen vacancies.14,15,18 These results confirm that the total amount of the surface oxygen vacancies on the Pt/In2O3 catalyst is smaller than that of the pure In2O3 catalyst after hydrogen reduction, which is consistent with the results of the Raman spectra above.UV-vis absorption spectra
Fig. 7a shows the UV-vis absorption spectra of the Pt/In2O3 catalyst. Fresh In2O3 shows a strong UV absorption because of its semiconducting nature. The band gap can be determined from absorption spectra using the Tauc relationship. Based on the plot of (αhν)2 versus the photoenergy, hν, in Fig. 7b, the band gap of the Pt/In2O3-BT sample is determined to be 2.8 eV. The band gap is reduced to 2.57 eV for the Pt/In2O3 catalyst. This result indicates that the creation of the oxygen vacancies shifts the onset of light absorption from the UV to the visible region. It is also consistent with the Raman analyses discussed above: oxygen vacancies can be created over the Pt/In2O3 catalyst after hydrogen reduction. According to the literature,50,51 the increase in visible light absorption can be attributed to the electronic transition from the In2O3 valence band to the newly created oxygen vacancy level. The sensitivity of visible light absorption to the oxygen vacancies in In2O3 also makes Pt/In2O3 potentially useful in exploiting visible light for photocatalysts.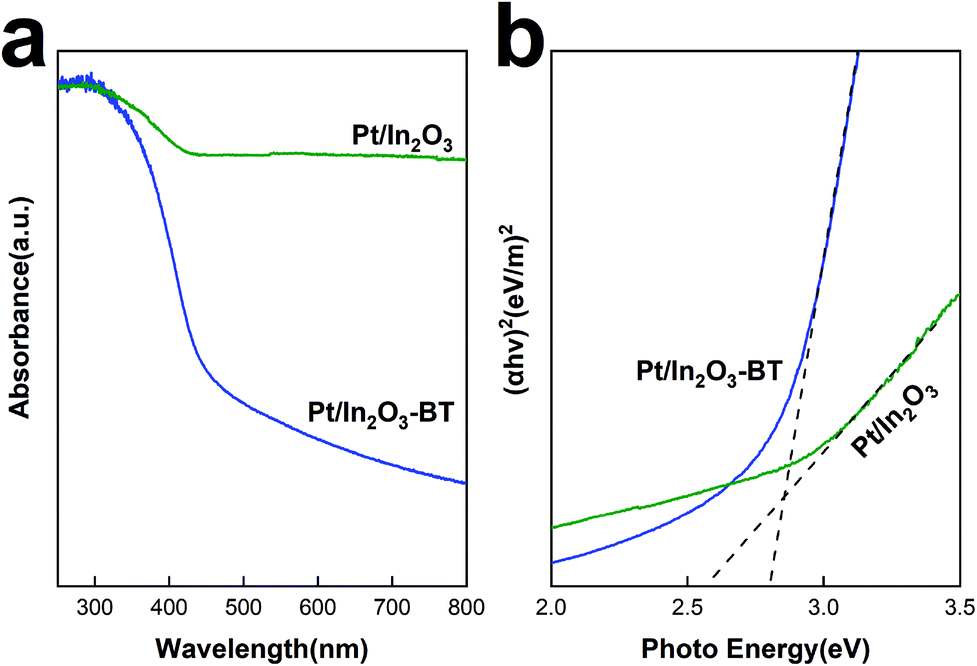 | ||
| Fig. 7 (a) UV–vis absorption spectra and (b) Tauc plot of the Pt/In2O3 catalyst. | ||
Conclusions
In this work, we prepared a novel Pt/In2O3 catalyst using the deposition–precipitation method. The catalyst was tested for methanol synthesis from CO2 and hydrogen and the methanol selectivities of ca. 100% at temperatures below 225 °C, 74% at 275 °C and 54% at 300 °C on the Pt/In2O3 catalyst have been achieved. These results represent a significant improvement from the pure In2O3 catalyst and are the highest methanol selectivity reported on Pt catalysts. For example, the Pt/In2O3 catalyst shows a CO2 conversion above 17% with a methanol formation rate of 0.542 gmethanol h−1 gcat−1 at 300 °C and 5 MPa, while the CO2 conversion is only 9.4% and the methanol formation rate is 0.335 gmethanol h−1 gcat−1 for In2O3. In addition to the improved activity, the stability of the Pt/In2O3 catalyst is also outstanding. The methanol formation rate on the Pt/In2O3 catalyst after 5 h in the reaction stream only decreases to 95% of the initial rate and remains constant thereafter. This is significantly higher than 80% of the initial rate on the pure In2O3 catalyst reached after 9 h in the reaction stream. The textural characterization (by BET, XRD and TEM) of the catalysts indicates that the Pt nanoparticles are well-dispersed with an average particle size of 1.47 nm. More importantly, TEM and H2-TPR showed that there were SMSIs between Pt and In2O3, resulting in the improved surface stability. In addition, the results of Raman spectra confirm that the SMSI between Pt and In2O3 inhibits the over-reduction of In2O3. Consequently, the Pt/In2O3 catalyst showed a much higher catalytic activity and better stability than the pure In2O3 catalyst.Conflicts of interest
There are no conflicts to declare.Acknowledgements
This work was supported by the National Key Research and Development Program of China (2016YFB0600902).Notes and references
- M.-Y. Wang, N. Wang, X.-F. Liu, C. Qiao and L.-N. He, Green Chem., 2018, 20, 1564–1570 RSC.
- M. Lu, J. Zhang, Y. Yao, J. Sun, Y. Wang and H. Lin, Green Chem., 2018, 20, 4292–4298 RSC.
- Z. Zhang, X.-Y. Zhou, J.-G. Wu, L. Song and D.-G. Yu, Green Chem., 2020, 22, 28–32 RSC.
- J. Zhang, Q. Qian, Y. Wang, B. B. Asare Bediako, M. Cui, G. Yang and B. Han, Green Chem., 2019, 21, 233–237 RSC.
- J. Albo, M. Alvarez-Guerra, P. Castaño and A. Irabien, Green Chem., 2015, 17, 2304–2324 RSC.
- G. A. Olah, Angew. Chem., Int. Ed., 2005, 44, 2636–2639 CrossRef CAS PubMed.
- K. Räuchle, L. Plass, H.-J. Wernicke and M. Bertau, Energy Technol., 2016, 4, 193–200 CrossRef.
- X. Dong, F. Li, N. Zhao, F. Xiao, J. Wang and Y. Tan, Appl. Catal., B, 2016, 191, 8–17 CrossRef CAS.
- H. Ban, C. Li, K. Asami and K. Fujimoto, Catal. Commun., 2014, 54, 50–54 CrossRef CAS.
- S. Chen, J. Zhang, P. Wang, X. Wang, F. Song, Y. Bai, M. Zhang, Y. Wu, H. Xie and Y. Tan, ChemCatChem, 2019, 11, 1448–1457 CrossRef CAS.
- J. Wang, G. Li, Z. Li, C. Tang, Z. Feng, H. An, H. Liu, T. Liu and C. Li, Sci. Adv., 2017, 3 CAS.
- F. Studt, I. Sharafutdinov, F. Abild-Pedersen, C. F. Elkjær, J. S. Hummelshøj, S. Dahl, I. Chorkendorff and J. K. Nørskov, Nat. Chem., 2014, 6, 320 CrossRef CAS PubMed.
- F. Liao, X.-P. Wu, J. Zheng, M. M.-J. Li, A. Kroner, Z. Zeng, X. Hong, Y. Yuan, X.-Q. Gong and S. C. E. Tsang, Green Chem., 2017, 19, 270–280 RSC.
- J. Ye, C. Liu and Q. Ge, J. Phys. Chem. C, 2012, 116, 7817–7825 CrossRef CAS.
- J. Ye, C. Liu, D. Mei and Q. Ge, ACS Catal., 2013, 3, 1296–1306 CrossRef CAS.
- J. Ye, C.-j. Liu, D. Mei and Q. Ge, J. Catal., 2014, 317, 44–53 CrossRef CAS.
- K. Sun, Z. Fan, J. Ye, J. Yan, Q. Ge, Y. Li, W. He, W. Yang and C.-j. Liu, J. CO2 Util., 2015, 12, 1–6 CrossRef CAS.
- N. Rui, Z. Wang, K. Sun, J. Ye, Q. Ge and C.-j. Liu, Appl. Catal., B, 2017, 218, 488–497 CrossRef CAS.
- A. Tsoukalou, P. M. Abdala, D. Stoian, X. Huang, M. G. Willinger, A. Fedorov and C. R. Muller, J. Am. Chem. Soc., 2019, 141, 13497–13505 CrossRef CAS PubMed.
- M. S. Frei, M. Capdevila-Cortada, R. García-Muelas, C. Mondelli, N. López, J. A. Stewart, D. C. Ferré and J. Pérez-Ramírez, J. Catal., 2018, 361, 313–321 CrossRef CAS.
- M. Zhang, W. Wang and Y. Chen, Appl. Surf. Sci., 2018, 434, 1344–1352 CrossRef CAS.
- M. S. Frei, C. Mondelli, A. Cesarini, F. Krumeich, R. Hauert, J. A. Stewart, D. C. Ferré and J. Pérez-Ramírez, ACS Catal., 2020, 10, 1133–1145 CrossRef CAS.
- T.-y. Chen, C. Cao, T.-b. Chen, X. Ding, H. Huang, L. Shen, X. Cao, M. Zhu, J. Xu, J. Gao and Y.-F. Han, ACS Catal., 2019, 9, 8785–8797 CrossRef CAS.
- M. Zhang, M. Dou and Y. Yu, Appl. Surf. Sci., 2018, 433, 780–789 CrossRef CAS.
- M. Zhang, M. Dou and Y. Yu, Phys. Chem. Chem. Phys., 2017, 19, 28917–28927 RSC.
- Z. Shi, Q. Tan, C. Tian, Y. Pan, X. Sun, J. Zhang and D. Wu, J. Catal., 2019, 379, 78–89 CrossRef CAS.
- Z. Shi, Q. Tan and D. Wu, AIChE J., 2018, 65, 1047–1058 CrossRef.
- A. Bavykina, I. Yarulina, A. J. Al Abdulghani, L. Gevers, M. N. Hedhili, X. Miao, A. R. Galilea, A. Pustovarenko, A. Dikhtiarenko, A. Cadiau, A. Aguilar-Tapia, J.-L. Hazemann, S. M. Kozlov, S. Oud-Chikh, L. Cavallo and J. Gascon, ACS Catal., 2019, 9, 6910–6918 CrossRef CAS.
- M. S. Frei, C. Mondelli, R. García-Muelas, K. S. Kley, B. Puértolas, N. López, O. V. Safonova, J. A. Stewart, D. C. Ferré and J. Pérez-Ramírez, Nat. Commun., 2019, 10, 3377 CrossRef PubMed.
- J. Wang, K. Sun, X. Jia and C.-j. Liu, Catal. Today, 2020 DOI:10.1016/j.cattod.2020.05.020.
- X. Jia, K. Sun, J. Wang, C. Shen and C.-j. Liu, J. Energy Chem., 2020, 50, 409–415 CrossRef.
- Y.-L. Men, Y. Liu, Q. Wang, Z.-H. Luo, S. Shao, Y.-B. Li and Y.-X. Pan, Chem. Eng. Sci., 2019, 200, 167–175 CrossRef CAS.
- Y. Wang, J. Zhao, Y. Li and C. Wang, Appl. Catal., B, 2018, 226, 544–553 CrossRef CAS.
- E. S. Gutterød, A. Lazzarini, T. Fjermestad, G. Kaur, M. Manzoli, S. Bordiga, S. Svelle, K. P. Lillerud, E. Skúlason, S. Øien-Ødegaard, A. Nova and U. Olsbye, J. Am. Chem. Soc., 2020, 142, 999–1009 CrossRef PubMed.
- S. B. T. Tran, H. Choi, S. Oh and J. Y. Park, Catal. Lett., 2019, 149, 2823–2835 CrossRef CAS.
- B. Ouyang, S. Xiong, Y. Zhang, B. Liu and J. Li, Appl. Catal., A, 2017, 543, 189–195 CrossRef CAS.
- Z. Wang, L. Huang, B. Su, J. Xu, Z. Ding and S. Wang, Chem. – Eur. J., 2020, 26, 517–523 CrossRef CAS PubMed.
- S. Kattel, B. Yan, J. G. Chen and P. Liu, J. Catal., 2016, 343, 115–126 CrossRef CAS.
- A. Sápi, G. Halasi, J. Kiss, D. G. Dobó, K. L. Juhász, V. J. Kolcsár, Z. Ferencz, G. Vári, V. Matolin, A. Erdőhelyi, Á. Kukovecz and Z. Kónya, J. Phys. Chem. C, 2018, 122, 5553–5565 CrossRef.
- K.-P. Yu, W.-Y. Yu, M.-C. Kuo, Y.-C. Liou and S.-H. Chien, Appl. Catal., B, 2008, 84, 112–118 CrossRef CAS.
- E. S. Gutterød, S. Øien-Ødegaard, K. Bossers, A.-E. Nieuwelink, M. Manzoli, L. Braglia, A. Lazzarini, E. Borfecchia, S. Ahmadigoltapeh, B. Bouchevreau, B. T. Lønstad-Bleken, R. Henry, C. Lamberti, S. Bordiga, B. M. Weckhuysen, K. P. Lillerud and U. Olsbye, Ind. Eng. Chem. Res., 2017, 56, 13206–13218 CrossRef.
- S. Dang, H. Yang, P. Gao, H. Wang, X. Li, W. Wei and Y. Sun, Catal. Today, 2019, 330, 61–75 CrossRef CAS.
- T. Toyao, S. Kayamori, Z. Maeno, S. M. A. H. Siddiki and K.-i. Shimizu, ACS Catal., 2019, 9, 8187–8196 CrossRef CAS.
- T. Bielz, H. Lorenz, P. Amann, B. Klötzer and S. Penner, J. Phys. Chem. C, 2011, 115, 6622–6628 CrossRef CAS.
- T. Bielz, H. Lorenz, W. Jochum, R. Kaindl, F. Klauser, B. Klötzer and S. Penner, J. Phys. Chem. C, 2010, 114, 9022–9029 CrossRef CAS.
- D. R. Mullins and K. Z. Zhang, Surf. Sci., 2002, 513, 163–173 CrossRef CAS.
- Z. Yan, Z. Xu, J. Yu and M. Jaroniec, Appl. Catal., B, 2016, 199, 458–465 CrossRef CAS.
- G. D. Gesesse, C. Wang, B. K. Chang, S.-H. Tai, P. Beaunier, R. Wojcieszak, H. Remita, C. Colbeau-Justin and M. N. Ghazzal, Nanoscale, 2020, 12, 7011–7023 RSC.
- H. Iida and A. Igarashi, Appl. Catal., A, 2006, 298, 152–160 CrossRef CAS.
- J. Gan, X. Lu, J. Wu, S. Xie, T. Zhai, M. Yu, Z. Zhang, Y. Mao, S. C. I. Wang, Y. Shen and Y. Tong, Sci., Rep., 2013, 3, 1021 CrossRef PubMed.
- F. Lei, Y. Sun, K. Liu, S. Gao, L. Liang, B. Pan and Y. Xie, J. Am. Chem. Soc., 2014, 136, 6826–6829 CrossRef CAS PubMed.
- H. Zhu, X. Wang, F. Yang and X. Yang, Cryst. Growth Des., 2008, 8, 950–956 CrossRef CAS.
- M. Kaur, N. Jain, K. Sharma, S. Bhattacharya, M. Roy, A. K. Tyagi, S. K. Gupta and J. V. Yakhmi, Sens. Actuators, B, 2008, 133, 456–461 CrossRef CAS.
- O. Martin, A. J. Martín, C. Mondelli, S. Mitchell, T. F. Segawa, R. Hauert, C. Drouilly, D. Curulla-Ferré and J. Pérez-Ramírez, Angew. Chem., Int. Ed., 2016, 55, 6261–6265 CrossRef CAS PubMed.
- L. Wang, M. Ghoussoub, H. Wang, Y. Shao, W. Sun, A. A. Tountas, T. E. Wood, H. Li, J. Y. Y. Loh, Y. Dong, M. Xia, Y. Li, S. Wang, J. Jia, C. Qiu, C. Qian, N. P. Kherani, L. He, X. Zhang and G. A. Ozin, Joule, 2018, 2, 1369–1381 CrossRef CAS.
- W. Wang, Z. Qu, L. Song and Q. Fu, J. Energy Chem., 2020, 47, 18–28 CrossRef.
- S. M. Lee, H. Eom and S. S. Kim, Environ. Technol., 2019, 1–11 Search PubMed.
- Z. Yang, J. Li, H. Zhang, Y. Yang, M. Gong and Y. Chen, Catal. Sci. Technol., 2015, 5, 2358–2365 RSC.
- R. Prins, Chem. Rev., 2012, 112, 2714–2738 CrossRef CAS PubMed.
- X. Jiang, X. Nie, Y. Gong, C. M. Moran, J. Wang, J. Zhu, H. Chang, X. Guo, K. S. Walton and C. Song, J. Catal., 2020, 383, 283–296 CrossRef CAS.
Footnote |
| † Electronic supplementary information (ESI) available. See DOI: 10.1039/d0gc01597k |
| This journal is © The Royal Society of Chemistry 2020 |