Vanillin enhances the passive transport rate and absorption of drugs with moderate oral bioavailability in vitro and in vivo by affecting the membrane structure†
Wen'ge
Huang
 a,
Yingzhuo
Yang
b,
Wen
Wen
a,
Yu
Luo
c,
Jiasi
Wu
c,
Li
Xiang
c,
Yinfan
Hu
c,
Shijun
Xu
a,
Simin
Chen
*c and
Ping
Wang
a,
Yingzhuo
Yang
b,
Wen
Wen
a,
Yu
Luo
c,
Jiasi
Wu
c,
Li
Xiang
c,
Yinfan
Hu
c,
Shijun
Xu
a,
Simin
Chen
*c and
Ping
Wang
 *a
*a
aInstitute of Material Medical Integration and Transformation for Brain Disorders, Chengdu University of Traditional Chinese Medicine, Chengdu, 611137, Sichuan, China. E-mail: viviansector@163.com
bDepartment of Nuclear Medicine, Sichuan Cancer Hospital, Chengdu, 610011, Sichuan, China
cCollege of Pharmacy, Chengdu University of Traditional Chinese Medicine, Chengdu, 611137, Sichuan, China. E-mail: mingming2199@aliyun.com
First published on 17th December 2019
Abstract
Vanillin is a popular flavoring agent in the food, tobacco, and perfume industries. In this paper, we investigated the effect of vanillin on the transport rates of drugs with different levels of permeability (acyclovir, hydrochlorothiazide, propranolol and carbamazepine) through a Caco-2 cell bidirectional transport experiment. We also explored the underlying mechanism using an in silico technique and fluorescence anisotropy measurements. The influence of vanillin on the pharmacokinetics of drugs whose transport rates were affected by vanillin in vitro was then studied in vivo. Results showed that vanillin (100 μM) increased the cumulative amount of passively transported drugs (2.1-fold of hydrochlorothiazide, 1.49-fold of propranolol, 1.35-fold of acyclovir, and 1.34-fold of carbamazepine) in vitro. Molecular dynamics simulations revealed that vanillin disordered the structure of the lipid bilayer and reduced the energy barrier of drugs across the center of the membrane. The anisotropy of TMA-DPH also decreased in Caco-2 cells after treatment with vanillin (25 and 100 μM) and indicated an increase in membrane fluidity, which was dose-dependent. An oral bioavailability study indicated that vanillin (100 mg kg−1) significantly enhanced the Cmax and AUC0–6 of hydrochlorothiazide by 1.42-fold and 1.28-fold, respectively, and slightly elevated the Cmax of propranolol. In conclusion, vanillin can significantly increase the absorption of drugs with moderate oral bioavailability in vitro and in vivo by loosening the membrane. Thus, the concurrent consumption of drugs with food containing vanillin may result in increased drug plasma concentration and pose potential health risks.
1. Introduction
To enhance or alter the taste of natural food products, flavoring agents are used extensively in food processing. In pursuit of pleasing tastes and aromas, global demands for flavorings were huge, such as for essential oils which reached US$24 billion in 2011 and has continued to increase by 10% annually.1 Researchers have found that flavorings such as citral, gingerol and caryophyllene may affect drug permeability in vitro, which is considered a factor in oral bioavailability.2Vanillin, a phenolic aldehyde,3 is a popular flavoring agent extracted from the vanilla bean or pod (vanilla planifolia).4 The worldwide demand for vanillin reached 12![[thin space (1/6-em)]](https://www.rsc.org/images/entities/char_2009.gif) 000 tons in 2001 and grew to 16
000 tons in 2001 and grew to 16![[thin space (1/6-em)]](https://www.rsc.org/images/entities/char_2009.gif) 000 tons in 2015;5 more than 75% of ice cream and chocolate confections use vanillin as a flavoring agent.6 In addition to sensory effects, this agent can also be used in dietetic therapy given its antidepressant,7 antioxidant, and antitumor properties.8 In addition, vanillin has been found to enhance K+ transport in red blood cells.9 Yet the mechanism underlying the effect of vanillin on increasing the intestinal permeability of drugs remains unknown. In light of the wide use of vanillin as a food additive, it is important to understand how this flavoring agent may affect the rate of gastrointestinal tract absorption when patients take drugs with different physicochemical properties and foods containing vanillin at the same time.
000 tons in 2015;5 more than 75% of ice cream and chocolate confections use vanillin as a flavoring agent.6 In addition to sensory effects, this agent can also be used in dietetic therapy given its antidepressant,7 antioxidant, and antitumor properties.8 In addition, vanillin has been found to enhance K+ transport in red blood cells.9 Yet the mechanism underlying the effect of vanillin on increasing the intestinal permeability of drugs remains unknown. In light of the wide use of vanillin as a food additive, it is important to understand how this flavoring agent may affect the rate of gastrointestinal tract absorption when patients take drugs with different physicochemical properties and foods containing vanillin at the same time.
In this study, we conducted a Caco-2 cell bidirectional transport experiment to examine the effect of vanillin on the passive (acyclovir, hydrochlorothiazide, propranolol, and carbamazepine, whose hydrophilicity declined sequentially) and active (vinblastine, a substrate of P-glycoprotein, which can be excreted by cells) transport of marker drugs. Several molecular dynamics (MD) simulations were also performed to study the mechanism underlying the effect of vanillin on the membrane structure and the free energy of marker drugs passing through the membrane. Then we used the cell probe TMA-DPH to measure the effect of vanillin on the membrane fluidity of Caco-2 cells. Finally, we studied the effect of vanillin on the oral bioavailability of HTZ and PRO, the transport rates of which were significantly increased by vanillin in vitro.
2. Materials and methods
2.1 Materials
Acyclovir (ACV > 99%), carbamazepine (CBZ > 99%), hydrochlorothiazide (HTZ > 99%) and propranolol hydrochloride (PRO > 99%) were purchased from Meilunbio (Dalian, China). Vinblastine (VIN > 98%), vanillin (>98%), 2-naphthoxyacetic acid (>98%), and hydroxybenzoic acid (>98%) were obtained from ALFA (Chengdu, China). TMA-DPH was provided by MedChemExpress (Monmouth Junction, USA). DMSO was purchased from Sigma-Aldrich (Saint Louis, MO, USA). Hank's balanced salt solution (HBSS) and minimum Eagle's medium (MEM) were obtained from Hyclone (Logan, UT, USA). Non-essential amino acids, penicillin, streptomycin, and sodium pyruvate were purchased from Invitrogen (Carlsbad, CA, USA). Fetal bovine serum (FBS) was purchased from Tianhang Biotechnology (Zhejiang, China). A 12-well Transwell® plates were purchased from Corning (USA). All other solvents were of analytical grade and aqueous solutions were prepared using double-distilled water.2.2 Animals
Male Sprague-Dawley (SD) rats (5 weeks, 180–200 g body weight) were provided by the Department of Experimental Animals at Chongqing Medical University (approval number: SCXK [Chongqing] 2018-003, Chongqing, China). Animal experiments in this study conformed to the Guidelines for the Care and Use of Laboratory Animals and were approved by the Animal Ethics Committee of Chengdu University. All animals were kept at room temperature (21–24 °C) under a 12 h/12 h light/dark cycle and were given free access to food and water.2.3 Cell culture
The human colon adenocarcinoma cell line Caco-2 was obtained from the Center of Cellular Resources, Chinese Academy of Sciences (Shanghai, China) and maintained at 37 °C under a humidified atmosphere of 5% CO2. Cells were cultured in MEM supplemented with 20% FBS, 1% non-essential amino acids, 1% penicillin–streptomycin and 1% sodium pyruvate. Once the cells reached the desired confluence (70%–80%), they were detached from the flasks seeded onto a polycarbonate Transwell® (pore size: 0.4 μm; filter area: 1.12 cm2) in 12-well plates at a density of 2–5 × 10⁵ cells per cm2. The culture medium was changed every two days during the first week. The culture medium was then changed every day thereafter until the transepithelial electrical resistance (TEER) reached 200 Ω cm−2 for transport studies; this process required 18–21 days under the given culture conditions.2.4 Transport studies
The transport of marker drugs was examined in the presence or absence of vanillin (100 μM, 25 μM, 5 μM or 2.5 μM); DMSO in MEM was used as the control. Prior to the experiments, monolayers were washed twice with 37 °C HBSS and then incubated at 37 °C for 30 min, after which TEER was measured (eqn (1)) to assess the monolayer integrity.| TEER = (Rmonolayer − Rblank) × A | (1) |
In eqn (1), Rmonolayer and Rblank denote the resistance of the cell monolayer and filter membrane, respectively; A is the surface area of the membrane.
If TEER > 200 Ω, then all marker drugs stocked in DMSO were diluted in HBSS (50 μM) and added to the donor compartment. Fresh HBSS was added to the receiver compartment. Transport was investigated in both directions, from apical (AP) to basolateral (BL) and vice versa. The Transwell® plate was kept in a shaking incubator (55 rpm). Samples were collected from the receiving compartment at 15, 30, 60, 90, 120, 150, and 180 min (0.5 mL from BL or 0.4 mL from AP) and then analyzed via high-performance liquid chromatography (HPLC); the same volume of HBSS was added to the receiver compartment at each time point. The apparent permeability coefficients (Papp) and efflux ratio (ER) of marker drugs were calculated using eqn (2) and (3):
 | (2) |
| ER = Papp(BL-AP)/Papp(AP-BL) | (3) |
2.5 HPLC analysis of marker drugs
Marker drugs were quantified using a HPLC system with a 1260 Bin pump and 1260 DAD VL+UV detector. Acetonitrile (200 μL) with 1% formic acid was added to samples (200 μL) obtained from the receiver compartment, and then the mixture was centrifuged for 10 min at 13![[thin space (1/6-em)]](https://www.rsc.org/images/entities/char_2009.gif) 000 rpm.
000 rpm.
Chromatography conditions were as follows: aqueous solution with 0.1% formic acid as solvent A and acetonitrile as solvent B at a flow rate of 1.0 mL min−1 and a C18 column (1.8 μm, 3.0 × 150 mm; Agilent Technologies, Santa Clara, CA USA). A step-gradient elution was initiated at 60![[thin space (1/6-em)]](https://www.rsc.org/images/entities/char_2009.gif) :
:![[thin space (1/6-em)]](https://www.rsc.org/images/entities/char_2009.gif) 40 (A
40 (A![[thin space (1/6-em)]](https://www.rsc.org/images/entities/char_2009.gif) :
:![[thin space (1/6-em)]](https://www.rsc.org/images/entities/char_2009.gif) B, v/v), and the gradient was reduced to 40
B, v/v), and the gradient was reduced to 40![[thin space (1/6-em)]](https://www.rsc.org/images/entities/char_2009.gif) :
:![[thin space (1/6-em)]](https://www.rsc.org/images/entities/char_2009.gif) 60 (A
60 (A![[thin space (1/6-em)]](https://www.rsc.org/images/entities/char_2009.gif) :
:![[thin space (1/6-em)]](https://www.rsc.org/images/entities/char_2009.gif) B, v/v) for 15 min followed by 5 min equilibration. Next, 20 μL of samples were injected and detected at 275 nm. The linear regression equation for marker drugs is shown in ESI Table1;† the validity of the method has been demonstrated in a previous literature study.10
B, v/v) for 15 min followed by 5 min equilibration. Next, 20 μL of samples were injected and detected at 275 nm. The linear regression equation for marker drugs is shown in ESI Table1;† the validity of the method has been demonstrated in a previous literature study.10
2.6 MD simulation analysis of vanillin on the membrane structure
To investigate the interaction between vanillin and the membrane structure, coarse-grained (CG) MD simulations were performed in GROMACS 2016.3.11 Lipids used a Martini2.2 force field and the CG force fields of vanillin were obtained from a standard script on the Martini website (http://md.chem.rug.nl/).12Fig. 1 shows the structural formula and CG mapping method of vanillin.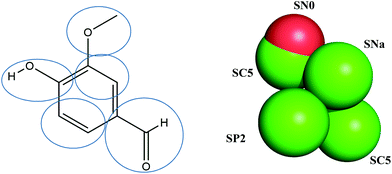 | ||
| Fig. 1 Atom-bead mapping scheme of vanillin. The letters are Martini bead types of coarse-grain (CG) sites. | ||
A 64 Å × 64 Å × 120 Å dipalmitoyl-sn-glycero-3-phosphocholine (DPPC) bilayer was constructed using the Martini membrane builder tool in CHARMM-GUI (http://www.charmm-gui.org).13–15 DPPC was firstly equilibrated using the steepest descent method for 10 ns at 323 K to obtain the best initial structure. To understand the effect of vanillin on the membrane structure, different concentrations of vanillin (5%, 10%, 15%, 20%, and 30%) were randomly placed in the upper and lower regions of DPPC using the Packmol package and the effects of the periodic boundary conditions were removed.16 The system temperature was set at 323 K using the Berendsen temperature coupling with a time constant of 1.0 ps. Pressure was controlled using the Berendsen barostat and semi-isotropic pressure coupling with a compressibility of 3 × 10⁻⁴ per bar and a time constant of 2.0 ps. Electrostatics and van der Waals had the same cut-off length of 1.2 nm. The total simulation time was 300 ns and the time step was 10 fs.
2.7 Effect of vanillin on the membrane fluidity of Caco-2 cells
The membrane fluidity of Caco-2 cells was measured by using the cell probe TMA-DPH. Fluorescence measurements were performed on an F97Pro fluorimeter with a polarizer (Lengguang Technology, China). Caco-2 cells were exposed to vanillin (100 μM and 25 μM) for 0, 30, 60, 90, and 120 minutes; HBSS was used as the control. Before the experiment, the Caco-2 cells were washed twice with HBSS and were detached using trypsin–EDTA. Then the cells at a concentration of 2 × 10⁵ cells per ml were labeled with TMA-DPH by adding 2 mL of 10 μM TMA-DPH stock solution to 2 mL of cell suspension and incubated for 20 min at 37 °C to complete combining. Finally, the liquid was aspirated, and 4 mL of HBSS was added to Caco-2 cell suspensions. The fluorescence anisotropy values of TMA-DPH that were used to detect the change of lipid fluidity were measured with a fluorimeter by a previously reported method17 and calculated using the following equation:where r is the fluorescence anisotropy value, IVH and IVV are the fluorescence intensity measured by setting the excitation polarizer to vertical orientation and the emission polarizer to vertical and horizontal orientation, respectively. The G value was calculated using IHV/IHH.
2.8 MD simulation analysis of vanillin on marker drug transport
We further investigated the effect of moderate vanillin concentration (20%) on the transport of marker drugs by obtaining free energy profiles. The CG force field of marker drugs was obtained in the same way as that of vanillin; mapping methods are depicted in Fig. 2. The potential of mean constraint force (PMF) free energy of marker drugs passing through the DPPC with vanillin was measured using an umbrella sampling script (10 ns per umbrella simulation).18 Because the structure of DPPC was symmetric, the PMF of marker drugs was calculated for one monolayer and applied to another leaflet. The weighted histogram analysis method (WHAM) was employed to generate free energy profiles.19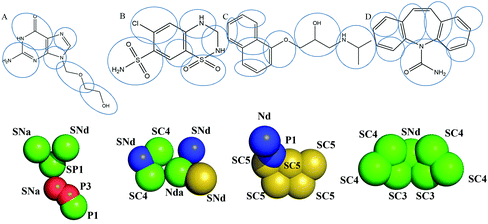 | ||
| Fig. 2 Atom-to-bead mapping scheme of marker drugs. A. Acyclovir; B. hydrochlorothiazide; C. propranolol; D. carbamazepine. The letters are Martini bead types of coarse-grain (CG) sites. | ||
2.9 Effect of vanillin on the oral bioavailability of HTZ
2.10 Statistical analysis
Data for transport experiments are reported as the mean ± SD of three independent experiments. Linear and non-linear regressions were analyzed in Microsoft Excel 2016® (USA). p values less than 0.05 were considered statistically significant.2.11 PK parameter calculation and statistical analysis
Non-compartmental PK analysis was performed in Thermo Kinetica (Version 5.0; Thermo Electron Corporation, Waltham, MA) to assess plasma concentrations versus time data. The time to reach maximum plasma concentrations (Tmax) and maximum plasma concentrations (Cmax) were determined on the basis of the observed values. The area under the plasma concentration–time curve, from 0 h to 6 h (AUC0–6) and from 0 h to infinity (AUC0–∞), was calculated by the linear trapezoidal rule. The mean residence time (MRT) was also calculated. Statistical analysis of PK parameters was performed using a one-way analysis of variance followed by Tukey's tests for multiple comparisons. p values less than 0.05 were considered statistically significant.3. Results
3.1 Transport experiments
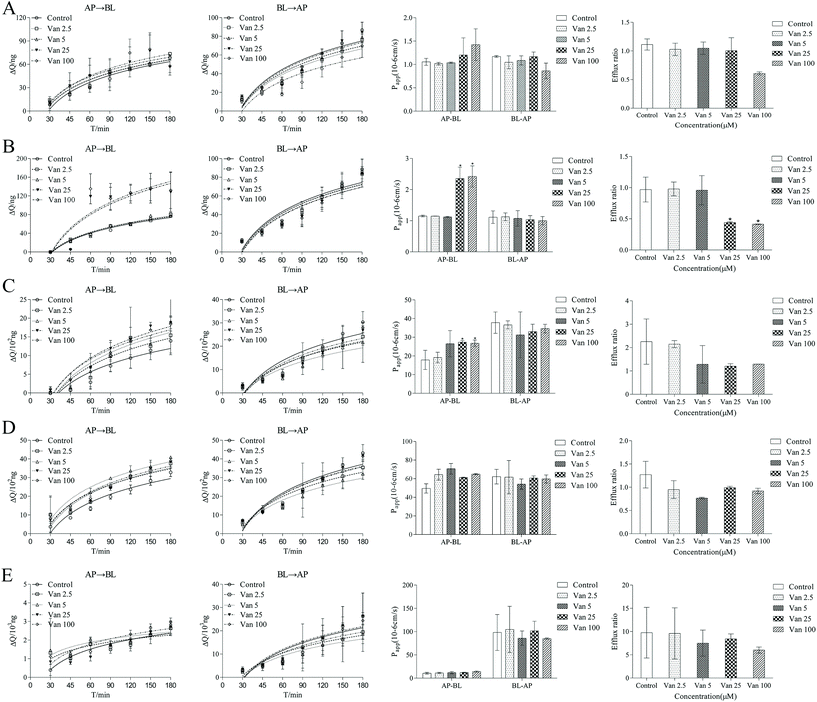
The effects of vanillin (2.5–100 μM) on the transport of five marker drugs across Caco-2 monolayers were investigated using bidirectional transport experiments; the representative chromatogram of marker drugs is shown in ESI Fig. 8.† As shown in Fig. 3, after 30–180 min, the cumulative transport amounts of HTZ, PRO, and CBZ from AP-BL increased in the presence of vanillin, whereas the cumulative transport amounts of ACV and VIN from AP-BL remained unchanged. The cumulative transport amounts of five marker drugs from BL-AP decreased slightly in the presence of vanillin.Fig. 3 also shows that at 120 min, compared with the control group, vanillin (100 μM) markedly increased the Papp values of HTZ and PRO from AP-BL by 2.10- and 1.49-fold, respectively. Vanillin (100 μM) slightly increased the Papp values of CBZ and ACV from AP-BL by 1.34- and 1.35-fold, respectively. However, vanillin (100 μM) did not significantly change the Papp values of the above four passive transport drugs from BL-AP; the Papp values of VIN from AP-BL and BL-AP changed negligibly. Furthermore, vanillin reduced the efflux ratio of all four passive transport drugs but did not change the efflux ratio of VIN. These results suggest that vanillin could significantly enhance the passive transport of hydrophobic drugs (HTZ and PRO), which were dose-dependent but did not inhibit the function of P-gp. We also performed MD simulations on the stability of vanillin-(P-gp) complexes and the molecular docking between vanillin and P-gp for studying the interactions between vanillin and P-gp. These contents are given in the ESI† and provide information to researchers who are interested in simulations.
3.2 Influence of vanillin concentration on the membrane flexibility
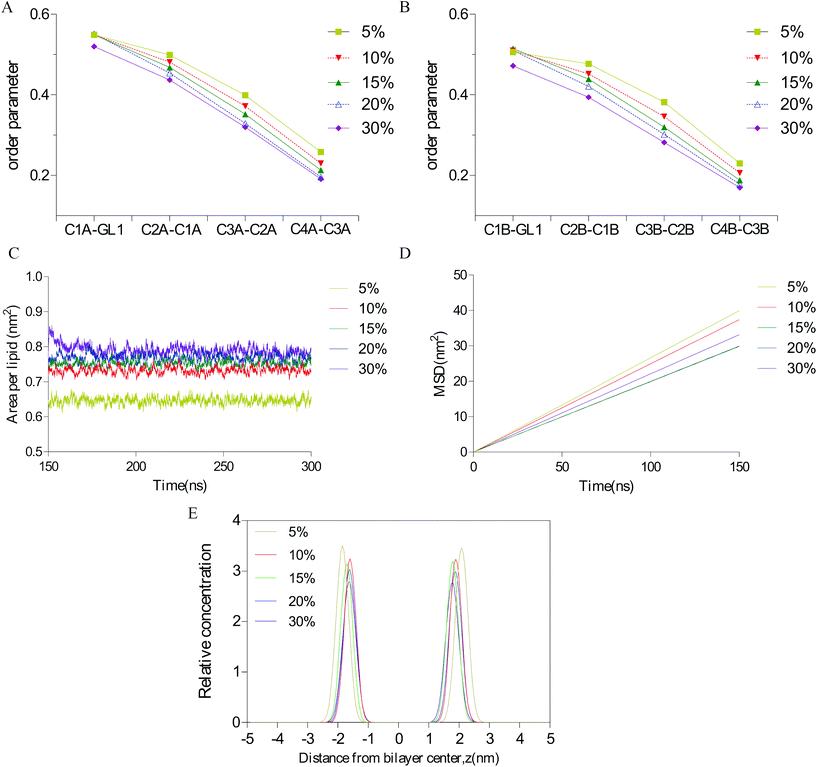
To elucidate the interaction of different concentrations of vanillin molecules with the lipid bilayer, several parameters that could reflect membrane flexibility were calculated: bilayer thickness, area per lipid (APL), lateral diffusion (MSD), and the order of alkyl chains. As indicated in Fig. 4, when the vanillin concentration increased, the APL increased and the bilayer thickness, MSD, and the order parameter of lipids decreased. These findings indicate that as the concentration of vanillin increased, the membrane loosened and lipid molecules became flexible.3.3 Influence of vanillin concentration on the membrane fluidity
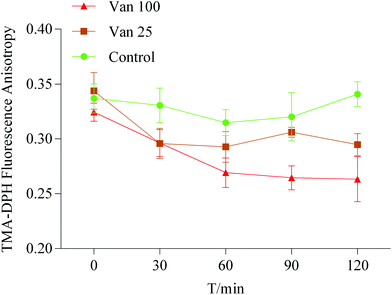
The effect of vanillin on the membrane fluidity was further analyzed by the fluorescence anisotropy of TMA-DPH. If the TMA-DPH fluorescence anisotropy decreases, it may suggest that there is an increase in membrane fluidity. The anisotropy of TMA-DPH in the control group at zero time point was 0.337 ± 0.013. After treatment with vanillin at different concentrations (25 μM or 100 μM), compared to the control, the r value of TMA-DPH significantly decreased (Fig. 5). This result indicated that vanillin could increase the membrane fluidity and make lipid molecules flexible similar to that in MD simulations, which were dose-dependent.3.4 Influence of vanillin on the passive transport of marker drugs
The PMF free energy of four marker drugs transporting into the membrane (ESI Fig. 4†) was computed using umbrella sampling to understand the effect of vanillin on the passive transport of marker drugs (Fig. 6). The findings revealed that, in the system without vanillin, PMF values of four marker drugs proceeded as ACV > HTZ > PRO > CAR, consistent with their permeability. Clear differences emerged among the free energy of four marker drugs, and they presented three patterns. The free energy of ACV, a highly hydrophilic drug, exhibited a positive inverted ‘V’ shape in all positions, indicating a strong energy barrier when ACV passed through the membrane and showing that ACV is a low-permeability drug. The free energy of HTZ and PRO exhibited a ‘W’ shape, suggesting a moderate energy barrier when HTZ and PRO passed through the center of the membrane. Furthermore, the free energy of CBZ assumed a negative ‘U’ shape in all positions, indicating no energy barrier when CBZ passed through the center of the membrane and revealing that the transport of CBZ could be spontaneous (Fig. 6D). Moreover, when vanillin molecules were added to the system, the PMF values of PRO, HTZ, ACV, and CBZ declined by 109.06%, 48.50%, 52.76%, and 19.46% in the center of the membrane, respectively. These results, which were consistent with bidirectional transport experiments, imply that vanillin has the potential to enhance the passive transport rates of hydrophobic drugs (HTZ and PRO) by reducing the energy barrier as they pass through the center of the membrane.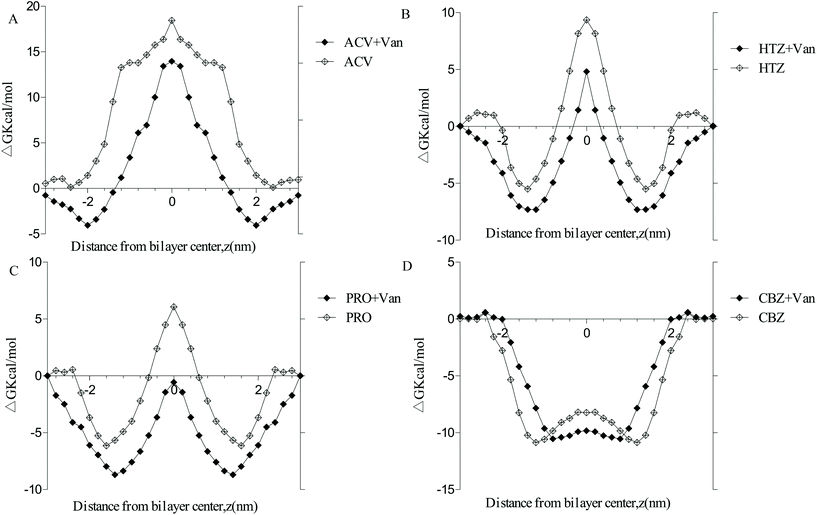 | ||
| Fig. 6 Free energy profiles of marker drugs across the DPPC lipid bilayer membrane with or without vanillin molecules. A. Acyclovir; B. hydrochlorothiazide; C. propranolol; D. carbamazepine. | ||
3.5 Oral bioavailability
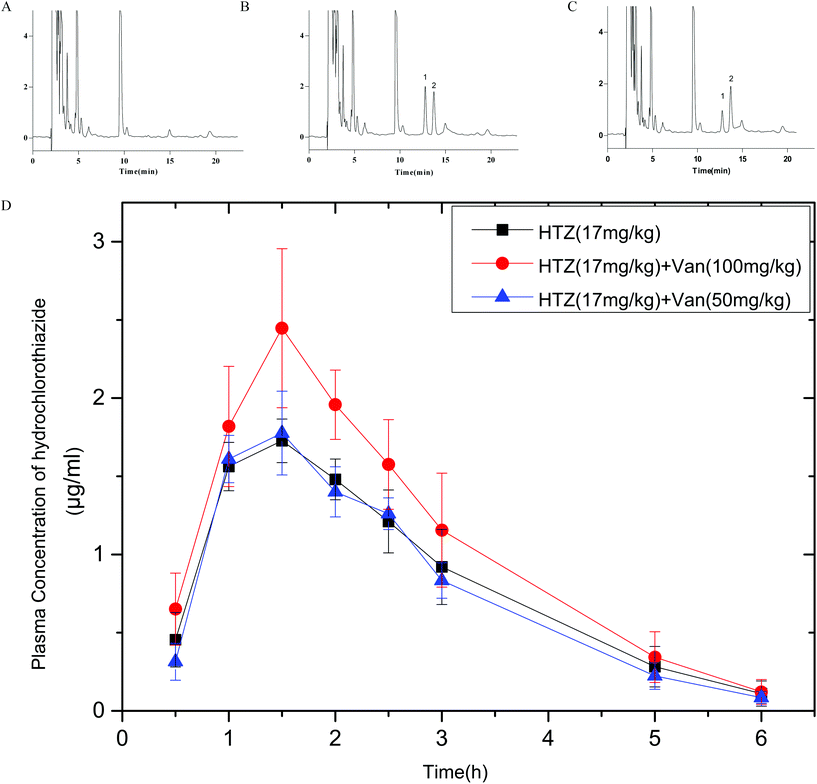
Fig. 7 shows the plasma concentrations versus time curves of HTZ after the oral administration of HTZ alone or prior administration with vanillin. PK parameters are listed in Table 1. Vanillin (100 mg kg−1) significantly enhanced the Cmax and AUC0–6 of HTZ by 1.42-fold and 1.28-fold, respectively. No obvious difference appeared in Tmax and MRT between the control group and HTZ-Van groups. These results show that vanillin could increase the oral absorption of HTZ. Vanillin (100 mg kg−1) also slightly enhanced the Cmax of PRO, but the result was not significant (p > 0.05). Data on PRO are not provided in this article.| Parameter | HTZ (17 mg kg−1) mean ± SD | HTZ + Van (50 mg kg−1) mean ± SD | HTZ + Van (100 mg kg−1) mean ± SD |
|---|---|---|---|
| AUC0–6: area under the plasma concentration–time curve from 0 h to 6 h; AUC0–∞: area under the plasma concentration–time curve from 0 h to infinity; Cmax: peak plasma concentration; Tmax: time to reach peak plasma concentration; MRT: mean residence time; *P < 0.05 meant compared to the control group. Data are shown as the mean ± SD. | |||
| AUC0–6 (ng mL−1 h−1) | 4.69 ± 0.63 | 4.43 ± 0.41 | 6.04 ± 0.74* |
| AUC0–∞ (ng mL−1 h−1) | 4.89 ± 0.81 | 4.57 ± 0.47 | 6.25 ± 0.88* |
| C max (μg ml−1) | 1.75 ± 0.11 | 1.81 ± 0.2 | 2.49 ± 0.45* |
| T max (h) | 1.42 ± 0.2 | 1.33 ± 0.26 | 1.67 ± 0.41 |
| MRT (h) | 2.32 ± 0.18 | 2.27 ± 0.1 | 2.29 ± 0.23 |
4. Discussion
The dominant mechanism responsible for intracellular drug transport is passive diffusion. The diffusion rate depends largely on drug lipophilicity (log![[thin space (1/6-em)]](https://www.rsc.org/images/entities/char_2009.gif) P).23 Typically, the higher the lipophilicity of a drug, the greater its diffusion rate. Moreover, the increased fluidity of the membrane was shown to enhance the absorption of some drugs.24 Paeoniflorin and menthol have been found to increase membrane fluidity, thereby enhancing puerarin transport and increasing the therapeutic efficacy of puerarin in the case of stroke.25 Ethanol and metformin can also increase membrane fluidity by reducing the membrane order,26 whereas the concomitant intake of ethanol increases the absorption of lipophilic compounds such as dipyridamole, griseofulvin, and indoprofen.27 In MD simulations, vanillin molecules accumulated on the surface of the membrane acutely disordered the lipid bilayer and were concentration-dependent. Another common way to study membrane fluidity is to use a TMA-DPH probe which can anchor at the surface of the membrane and further validate the MD results. The fluorescence anisotropy of TMA-DPH is inversely related to the membrane flexibility. The study showed a significant decrease (8–15%) of the anisotropy of TMA-DPH in Caco-2 cells treated with vanillin after one hour. These data show that, similar to the MD simulations, vanillin molecules gathered at the surface of the lipid bilayer can make the membrane more flexible. This highly loosened membrane increased the fluidity of the lipid bilayer and further enhanced the diffusion rate of drugs. Sharma et al. and Hannemann et al. suggested that vanillin may possess anti-mycobacterial activity through disrupting the integrity of the membrane and could thus enhance red blood cell membrane permeability.9,28 Furthermore, increased membrane fluidity may reduce the free energy of drugs across the lipid bilayer. Bennion et al. have shown that the free energy of compounds that passed through the membrane is closely related to the compound permeability, with low free energy values corresponding to high permeability.29 The free energy of four marker drugs (ACV, HTZ, PRO, and CBZ) exhibited a pronounced reduction in the membrane disordered by vanillin molecules, which indicated that vanillin may increase the passive transport of marker drugs through disordering the lipid bilayer. The present study also revealed that vanillin treatment led to an increase in the passive transport of drugs (ACV, HTZ, PRO, and CBZ) by 134.8%, 210%, 149.8%, and 133.6% in Caco-2 cells, respectively. In oral bioavailability studies, the PK parameters (Cmax and AUC) of HTZ in the presence of vanillin were notably increased by 1.42- and 1.28-fold whereas the absorption of PRO in the presence of vanillin was not obviously improved (as noted earlier, PRO data are not reported in this article). This discrepancy could be due to the difference between the oral bioavailability of PRO (absorbed fraction in humans = 90%) and HTZ (absorbed fraction in humans = 55%).30
P).23 Typically, the higher the lipophilicity of a drug, the greater its diffusion rate. Moreover, the increased fluidity of the membrane was shown to enhance the absorption of some drugs.24 Paeoniflorin and menthol have been found to increase membrane fluidity, thereby enhancing puerarin transport and increasing the therapeutic efficacy of puerarin in the case of stroke.25 Ethanol and metformin can also increase membrane fluidity by reducing the membrane order,26 whereas the concomitant intake of ethanol increases the absorption of lipophilic compounds such as dipyridamole, griseofulvin, and indoprofen.27 In MD simulations, vanillin molecules accumulated on the surface of the membrane acutely disordered the lipid bilayer and were concentration-dependent. Another common way to study membrane fluidity is to use a TMA-DPH probe which can anchor at the surface of the membrane and further validate the MD results. The fluorescence anisotropy of TMA-DPH is inversely related to the membrane flexibility. The study showed a significant decrease (8–15%) of the anisotropy of TMA-DPH in Caco-2 cells treated with vanillin after one hour. These data show that, similar to the MD simulations, vanillin molecules gathered at the surface of the lipid bilayer can make the membrane more flexible. This highly loosened membrane increased the fluidity of the lipid bilayer and further enhanced the diffusion rate of drugs. Sharma et al. and Hannemann et al. suggested that vanillin may possess anti-mycobacterial activity through disrupting the integrity of the membrane and could thus enhance red blood cell membrane permeability.9,28 Furthermore, increased membrane fluidity may reduce the free energy of drugs across the lipid bilayer. Bennion et al. have shown that the free energy of compounds that passed through the membrane is closely related to the compound permeability, with low free energy values corresponding to high permeability.29 The free energy of four marker drugs (ACV, HTZ, PRO, and CBZ) exhibited a pronounced reduction in the membrane disordered by vanillin molecules, which indicated that vanillin may increase the passive transport of marker drugs through disordering the lipid bilayer. The present study also revealed that vanillin treatment led to an increase in the passive transport of drugs (ACV, HTZ, PRO, and CBZ) by 134.8%, 210%, 149.8%, and 133.6% in Caco-2 cells, respectively. In oral bioavailability studies, the PK parameters (Cmax and AUC) of HTZ in the presence of vanillin were notably increased by 1.42- and 1.28-fold whereas the absorption of PRO in the presence of vanillin was not obviously improved (as noted earlier, PRO data are not reported in this article). This discrepancy could be due to the difference between the oral bioavailability of PRO (absorbed fraction in humans = 90%) and HTZ (absorbed fraction in humans = 55%).30
Food–drug interactions are an important factor affecting pharmacokinetics and pharmacodynamics.31 Brown stated that tyraminet, a constituent of cheese and raw sausage, can interact with tranylcypromine and cause hypertension.32 Nutrient molecules can increase drug absorption by inhibiting the efflux function of transporters in the intestine or increasing the solubility of drugs.33 Extracts of soybean, dokudami, Welsh onion, and bitter melon were found to inhibit the function of P-gp and may increase drug absorption.34 A high-caloric standard meal can also increase the solubility of hydrophobic substances and elicit an increase in the oral bioavailability of lapatinib by 325%.35
However, only a few researchers have studied interactions between food additives and drugs. The intestinal membrane system serves as a barrier function, selectively absorbing luminal contents including water, ions, nutrients, and drugs.36 The structure of the intestinal membrane plays an important role in the absorption of drugs. In our work, food additives that can disorder the membrane could potentially influence drug absorption. Synthetic surfactant food additives, such as sucrose monoester fatty acids, can induce actin disbandment and separation of the membrane structure in Caco-2 cells, which evokes an increase in the paracellular uptake of food allergens.37Cinnamomum cassia essential oils used as flavoring agents in food can also perturb membrane fluidity by accumulating in the hydrophobic core of the cell membrane.38 Glucose, as a major sweetener in food, results in intercellular leakage by disturbing the membrane of Caco-2 cells.39
Vanillin is widely used in the food, tobacco, and even perfume industries.40–42 The present study suggests that vanillin significantly increased the absorption of drugs with moderate bioavailability (HTZ) in vivo and in vitro. For drugs with similar physiochemical properties to HTZ, such as tripotolide and acetaminophen, concurrent consumption with food containing vanillin would likely result in increased drug plasma concentration and an increased risk of side effects (e.g., hepatotoxicity).43 Further studies are needed to evaluate the influence of daily vanillin intake on drug safety and efficacy in patients, particularly for long-term administration of drugs.
5. Conclusion
Vanillin can significantly increase the oral absorption of moderate-permeability drugs (e.g., HTZ) in vivo and in vitro by enhancing the fluidity of the lipid bilayer and reducing the energy barrier of drugs passing through the membrane. Thus, vanillin may increase the plasma concentrations of concomitantly ingested drugs with similar physical properties to HTZ and lead to potential risks, such as hepatotoxicity and low blood pressure.Abbreviations
| ACV | Acyclovir |
| HTZ | Hydrochlorothiazide |
| PRO | Propranolol |
| CBZ | Carbamazepine |
| VIN | Vinblastine |
| VAN | Vanillin |
| HBSS | Hank's balanced salt solution |
| MEM | Minimum Eagle's medium |
| FBS | Fetal bovine serum |
| TEER | Transepithelial electrical resistance |
| ER | Efflux ratio |
| PMF | Potential of mean constraint force |
| MD | Molecular dynamics |
| CG | Coarse-grained |
| DPPC | Dipalmitoyl-sn-glycero-3-phosphocholine |
| TMDs | Transmembrane domains |
| APL | Area per lipid |
| MSD | Lateral diffusion |
Conflicts of interest
There are no conflicts to declare.Acknowledgements
We thank Wen Wen, Jiasi Wu and Shijun Xu for assistance with animal experiments; Yingzhuo Yang, Li Xiang and Yinfan Hu for assistance with cell experiments; Ping Wang and Simin Chen for research design; Yu Luo for performing data analysis.References
- R. Govindasamy, S. Arumugam and J. E. Simon, An assessment of the essential oil and aromatic plant industry with a focus on Africa, ACS Symp. Ser., 2013, 1127, 289–321 CrossRef CAS.
- W. Zhang and L. Y. Lim, Effects of spice constituents on P-glycoprotein-mediated transport and CYP3A4-mediated metabolism in vitro, Drug Metab. Dispos., 2018, 36, 1283–1290 CrossRef PubMed.
- F. Shakee, N. Haq, N. A. Siddiqui, F. K. Alanazi and I. A. Alsarra, Solubility and thermodynamic behavior of vanillin in propane-1,2-diol+water cosolvent mixtures at different temperatures, Food Chem., 2015, 188, 57–61 CrossRef PubMed.
- A. R. Brochado, C. Matos, B. L. Møller, J. Hansen, U. H. Mortensen and K. R. Patil, Improved vanillin production in baker's yeast through, Microb. Cell Fact., 2010, 9, 84 CrossRef PubMed.
- J. Ni, F. Tao, H. Du and P. Xu, Mimicking a natural pathway for de novo biosynthesis: natural vanillin production from accessible carbon sources, Sci. Rep., 2015, 5, 13670 CrossRef PubMed.
- M. J. W. Dignum, J. Kerler and R. Verpoorte, Vanilla production: technological, chemical, AND biosynthetic aspects, Food Rev. Int., 2001, 17, 119–120 CrossRef.
- A. Shoeb, M. Chowta, G. Pallempati, A. Rai and A. Singh, Evaluation of antidepressant activity of vanillin in mice, Indian J. Pharmacol., 2013, 45, 141–144 CrossRef PubMed.
- L. S. Pedroso, G. M. Fávero, L. E. D. Camargo, R. M. Mainardes and N. M. Khalil, Effect of the o-methyl catechols apocynin, curcumin and vanillin on the cytotoxicity activity of tamoxifen, J. Enzyme Inhib. Med. Chem., 2013, 28, 734–740 CrossRef CAS PubMed.
- A. Hannemann, U. M. Cytlak, O. T. Gbotosho, D. C. Rees, S. Tewari and J. S. Gibson, Effects of o-vanillin on K+ transport of red blood cells from patients with sickle cell disease, Blood Cells, Mol., Dis., 2014, 53, 21–26 CrossRef CAS PubMed.
- J. M. Kratz, M. R. Teixeira, L. S. Koester and C. M. O. Simões, An HPLC-UV method for the measurement of permeability of marker drugs in the Caco-2 cell assay, Braz. J. Med. Biol. Res., 2011, 44, 531–537 CrossRef CAS PubMed.
- H. J. C. Berendsen, D. van der Spoel and R. van Drunen, GROMACS: A message-passing parallel molecular dynamics implementation, Comput. Phys. Commun., 1995, 91, 43–56 CrossRef CAS.
- S. J. Marrink, H. J. Risselada, S. Yefimov, D. P. Tieleman and A. H. De Vries, The MARTINI force field: coarse grained model for biomolecular simulations, J. Phys. Chem., 2007, 111, 7812–7824 CrossRef CAS PubMed.
- S. Jo, T. Kim, V. G. Iyer and W. Im, CHARMM-GUI: A web-based graphical user interface for CHARMM[J], J. Comput. Chem., 2008, 29, 1859–1865 CrossRef CAS PubMed.
- Y. Qi, H. I. Ingólfsson, X. Cheng, J. Lee, S. J. Marrink and W. Im, CHARMM-GUI Martini Maker for Coarse-Grained Simulations with the Martini Force Field, J. Chem. Theory Comput., 2015, 11, 4486–4489 CrossRef CAS PubMed.
- P. C. Hsu, B. M. H. Bruininks, D. Jefferies, P. C. T. de Souza, J. Lee, D. S. Patel, S. J. Marrink, Y. Qi, S. Khalid and W. Im, CHARMM-GUI Martini Maker for modeling and simulation of complex bacterial membranes with lipopolysaccharides, J. Comput. Chem., 2017, 38, 2354–2363 CrossRef CAS PubMed.
- L. Martínez, R. Andrade, E. G. Birgin and J. M. Martínez, Packmol: A package for building initial configurations for molecular dynamics simulations, J. Comput. Chem., 2009, 30, 2157–2164 CrossRef PubMed.
- W. Seel, A. Flegler, M. Zunabovic-Pichler and A. Lipski, Increased Isoprenoid Quinone Concentration Modulates Membrane Fluidity in Listeria monocytogenes at Low Growth Temperatures, J. Bacteriol., 2018, 13, e00148–e00118 Search PubMed.
- S.-J. Marrink and H. J. C. Berendsen, Simulation of water transport through a lipid membrane, J. Phys. Chem., 1994, 98, 4155–4168 CrossRef CAS.
- S. Kumar, J. M. Rosenberg, D. Bouzida and R. Swendsen, The weighted histogram analysis method for free-energy calculations on biomolecules, J. Comput. Chem., 1992, 13, 1011–1021 CrossRef CAS.
- D. Shang, X. Wang, X. Zhao, F. Huang, G. Tian, W. Lu and T. Zhou, Simultaneous determination of nitrendipine and hydrochlorothiazide in spontaneously hypertensive rat plasma using HPLC with on-line solid-phase extraction, J. Chromatogr. B: Anal. Technol. Biomed. Life Sci., 2011, 15, 3459–3464 CrossRef PubMed.
- A. Al Asmari, H. Al Shahrani, N. Al Masri, A. Al Faraidi, I. Elfaki and M. Arshaduddin, Vanillin abrogates ethanol induced gastric injury in rats via modulation of gastric secretion, oxidative stress and inflammation, Toxicol. Rep., 2015, 12, 105–113 Search PubMed.
- X. Zhang, F. M. Han, P. Du and Y. Chen, Pharmacokinetics of puerarin and hydrochlorothiazide from maijunan tablets in rats, Yaoxue Xuebao, 2009, 44, 1056–1060 CAS.
- K. Sugano, M. Kansy, P. Artursson, A. Avdeef, S. Bendels, L. Di, G. F. Ecker, B. Faller, H. Fischer, G. Gerebtzoff, H. Lennernaes and F. Senner, Coexistence of passive and carrier-mediated processes in drug transport, Nat. Rev. Drug Discovery, 2010, 9, 597–614 CrossRef CAS PubMed.
- G. Friedlander, C. L. Grimellec and C. Amiel, Increase in membrane fluidity modulates sodium-coupled uptakes and cyclic AMP synthesis by renal proximal tubular cells in primary culture, Biochim. Biophys. Acta, 1990, 1022, 1–7 CrossRef CAS.
- B. Yang, S. Du, Y. Lu, S. Jia, M. Zhao, J. Bai, P. Li and H. Wu, Influence of paeoniflorin and menthol on puerarin transport across MDCK and MDCK-MDR1 cells as blood-brain barrier in vitro model, J. Pharm. Pharmacol., 2018, 70, 349–360 CrossRef CAS PubMed.
- S. Rifici, G. D'Angelo, C. Crupi, C. Branca, V. C. Nibali, C. Corsaroa and U. Wanderlingh, Influence of Alcohols on the Lateral Diffusion in Phospholipid Membranes, J. Phys. Chem. B, 2016, 120, 1285–1290 CrossRef CAS PubMed.
- J. H. Fagerberg, E. Sjögren and C. A. S. Bergström, Concomitant intake of alcohol may increase the absorption of poorly soluble drugs, Eur. J. Pharm. Sci., 2015, 67, 12–20 CrossRef CAS PubMed.
- S. Sharma, R. Pal, S. Hameed and Z. Fatima, Antimycobacterial mechanism of vanillin involves disruption of cell-surface integrity, virulence attributes, and iron homeostasis, Int. J. Mycobact., 2016, 5, 460–468 CrossRef PubMed.
- B. J. Bennion, N. A. Be, M. W. McNerney, V. Lao, E. M. Carlson, C. A. Valdez, M. A. Malfatti, H. A. Enright, T. H. Nguyen, F. C. Lightstone and T. S. Carpenter, Predicting a Drug's Membrane Permeability: A Computational Model Validated With in Vitro Permeability Assay Data, J. Phys. Chem. B, 2017, 121, 5228–5237 CrossRef CAS PubMed.
- C. A. Bergström, M. Strafford, L. Lazorova, A. Avdeef, K. Luthman and P. Artursson, Absorption classification of oral drugs based on molecular surface properties, J. Med. Chem., 2003, 46, 558–570 CrossRef PubMed.
- J. P. O'Sheaa, R. Holm, C. M. O'Driscolla and B. T. Griffina, Food for thought: formulating away the food effect – a PEARRL review, J. Pharm. Pharmacol., 2018, 71, 510–535 CrossRef PubMed.
- C. Brown, G. Taniguchi and K. Yip, The monoamine oxidase inhibitor-tyramine interaction, J. Clin. Pharmacol., 1989, 29, 529–532 CrossRef CAS PubMed.
- M. Koziolek, S. Alcaro, P. Augustijns, A. W. Basit, M. Grimm, B. Hens, C. L. Hoad, P. Jedamzik, C. M. Madla, M. Maliepaard, L. Marciani, A. Maruca, N. Parrott, P. Pávek, C. J. H. Porter, C. Reppas, D. van Riet-Nales, J. Rubbens, M. Statelova, N. L. Trevaskis, K. Valentová, M. Vertzoni, D. V. Čepo and M. Corsetti, The mechanisms of pharmacokinetic food-drug interactions - A perspective from the UNGAP group, Eur. J. Pharm. Sci., 2019, 134, 31–59 CrossRef CAS PubMed.
- T. Konishi, H. Satsu, Y. Hatsugai, K. Aizawa, T. Inakuma, S. Nagata, S. H. Sakuda, H. Nagasawa and M. Shimizu, Inhibitory effect of a bitter melon extract on the P-glycoprotein activity in intestinal Caco-2 cells, Br. J. Pharmacol., 2004, 143, 379–387 CrossRef CAS PubMed.
- K. M. Koch, N. J. Reddy, R. B. Cohen, N. L. Lewis, B. Whitehead, K. Mackay, A. Stead, A. P. Beelen and L. D. Lewis, Effects of food on the relative bioavailability of lapatinib in cancer patients, J. Clin. Oncol., 2009, 27, 1191–1196 CrossRef CAS PubMed.
- O. Martínez-Augustin, B. Rivero-Gutiérrez, C. Mascaraque and F. Sánchez de Medina, Food derived bioactive peptides and intestinal barrier function, Int. J. Mol. Sci., 2014, 15, 22857–22873 CrossRef PubMed.
- Y. Mine and J. W. Zhang, Surfactants enhance the tight-junction permeability of food allergens in human intestinal epithelial Caco-2 cells, Int. Arch. Allergy Immunol., 2003, 130, 135–142 CrossRef CAS PubMed.
- N. T. Trinh, E. Dumas, M. L. Thanh, P. Degraeve, C. B. Amara, A. Gharsallaoui and N. Oulahal, Effect of a Vietnamese Cinnamomum cassia essential oil and its major component trans-cinnamaldehyde on the cell viability, membrane integrity, membrane fluidity, and proton motive force of Listeria innocua, Can. J. Microbiol., 2015, 61, 263–271 CrossRef CAS PubMed.
- A. Nusrat, J. R. Turner and J. L. Madara, Molecular physiology and pathophysiology of tight junctions. IV. Regulation of tight junctions by extracellular stimuli: nutrients, cytokines, and immune cells, Am. J. Physiol.: Gastrointest. Liver Physiol., 2000, 279, G851–G857 CrossRef CAS PubMed.
- J. M. Li, Y. C. Lee, C. C. Li, H. Y. Lo, F. Y. Chen, Y. S. Chen, C. Y. Hsiang and T. Y. Ho, Vanillin-Ameliorated Development of Azoxymethane/Dextran Sodium Sulfate-Induced Murine Colorectal Cancer: The Involvement of Proteasome/Nuclear Factor-κB/Mitogen-Activated Protein Kinase Pathways, J. Agric. Food Chem., 2018, 66, 5563–5573 CrossRef CAS PubMed.
- Z. T. Bitzer, R. Goel, S. M. Reilly, R. J. Elias, A. Silakov, J. Foulds, J. Muscat and J. P. Richie Jr., Effect of flavoring chemicals on free radical formation in electronic cigarette aerosols, Free Radicals Biol. Med., 2018, 120, 72–79 CrossRef CAS PubMed.
- S. Minematsu, G. S. Xuan and X. Z. Wu, Determination of vanillin in vanilla perfumes and air by capillary electrophoresis, J. Environ. Sci., 2013, 25, S8–S14 CrossRef.
- C. La Vecchia and E. Negri, A review of epidemiological data on epilepsy, phenobarbital, and risk of liver cancer, Eur. J. Cancer Prev., 2014, 23, 1–7 CrossRef PubMed.
Footnote |
| † Electronic supplementary information (ESI) available. See DOI: 10.1039/c9fo02846c |
| This journal is © The Royal Society of Chemistry 2020 |


