Dietary fiber isolated from sweet potato residues promotes a healthy gut microbiome profile†
Man
Liu‡
 ab,
Xuezhi
Li‡
b,
Shengmin
Zhou
c,
Thomas T. Y.
Wang
d,
Sihan
Zhou
b,
Kunlong
Yang
b,
Yongxin
Li
b,
Jun
Tian
 *ab and
Jing
Wang
 *a
*a
aBeijing Advanced Innovation Center for Food Nutrition and Human Health, Beijing Technology and Business University, Beijing 10048, China. E-mail: tj-085@163.com; wangjing@th.btbu.edu.cn
bCollege of Life Science, Jiangsu Normal University, Xuzhou, Jiangsu Province 221116, China. Tel: +(86)-010-6898-5334
cWilmar (Shanghai) Biotechnology Research & Development Center Co., Ltd., Shanghai, 200137, China
dDiet, Genomics and Immunology Lab, Beltsville Human Nutrition Research Center, ARS, USDA, Beltsville, MD 20705, USA
First published on 19th December 2019
Abstract
This study investigated the impact of dietary fiber from sweet potato residue (SPDF) on the diversity of the gut microbiota. An in vitro batch culture system simulating the human gut was used to understand the prebiotic role of SPDF. The results showed that SPDF mediated a significant increase in the concentrations of Bifidobacterium and Lactobacillus, whereas induced a significant decrease of Enterobacillus, Clostridium perfringens and Bacteroides. The prebiotic index and Bifidobacterium/Enterobacillus value were also significantly increased in SPDF groups compared to those of the control group, suggesting that SPDF had prebiotic effects. Furthermore, to investigate the effects of SPDF on the intestinal microecosystem, diets containing different concentrations of SPDF were used to feed Wistar rats for 4 weeks. 16S rRNA gene sequencing, short chain fatty acid quantification and physiochemical property analysis in the rat feces were then conducted. The results showed that SPDF significantly increased the Bacteroidetes to Firmicutes ratio at the phylum level and the amount of Akkermansia was also increased at the genus level, which was confirmed by qRT-PCR. The production of propionate and butyrate in the rat feces of both 3% and 15% SPDF groups was higher than that in the control group, which was further confirmed by the decrease of pH. Additionally, SPDF supplementation in this study resulted in a higher villus height to fossa depth ratio, which indicated improved digestion and absorption in the GI tract. Our findings support the utilization of SPDF from sweet potato residue in the development of potentially prebiotic food products for improving intestinal health.
Introduction
Sweet potato is the fourth principal food crop in developing countries, following rice, wheat and maize. The total world production in 2017 was 113 million tonnes, with China being the largest producer and having the highest yields of 72 million tonnes (FAOSTAT, http://www.fao.org/faostat/en/#data/QC). As a crop, sweet potato possesses a number of advantages, such as significant amounts of calories and protein, incredible drought resistance, low input/output ratios, and minimum use of herbicides, insecticides and fungicides, which give it great potential in combating the food shortage and malnutrition that might occur as a result of population growth and pressure on land utilization.1,2 Owing to its various agronomic advantages over other root crops, sweet potato has long been used as a major source of starch. It was estimated that sweet potato contributed 33% of the starch for industry use in China.3 Sweet potato residue is a by-product of industrial starch processing, and is rich in fiber.4 However, most of such residues are treated as agro-wastes or animal feed, resulting in lower economic benefits and heavy environmental burden.One of the valuable characteristic components of sweet potato residue is dietary fiber, which can account for as much as 27.4% of the content.5 Dietary fiber can be classified into insoluble fiber and soluble fiber based on its solubility in water. It has been reported that insoluble fiber possesses bulking properties, while soluble dietary fibers could promote or suppress the growth of distinct bacterial groups in the competitive environment of the intestine and colon.6
The human gastrointestinal tract contains about 1014 microbes belonging to 500–1500 different species, and is dominated by just four main phyla, namely Firmicules, Bacteroidetes, Actinobacteria and Proteobacteria.7,8 Healthy gut microbiota is essential for human health and well-being, providing the host with a physical barrier to foreign pathogens by competitive exclusion.9 However, dysregulation of the intestinal mucosal homeostasis is correlated with a number of diseases, such as obesity, inflammatory bowel diseases (IBD) and some immune system disorders.9 The balance of the gut microbiota is determined by the host genetics and other environmental factors, among which diet is of particular importance. Previous reports have suggested that soluble dietary fiber might selectively stimulate the growth of Bifidobacterium bifidum and can be fermented and utilized by various other bacteria, including Escherichia and Clostridium, indicating that the intestinal microbiota might metabolize the soluble dietary fiber and influence the growth and activity of the dynamic bacterial populations thriving in the human colon.10
The objective of this work was to investigate the effects of sweet potato dietary fiber (SPDF) on the gut microbiota. SPDF was extracted in our lab and an in vitro batch culture fermentation model was employed to investigate the growth of the main phyla affected by dietary fiber. An in vivo study using a Wistar rat model was also performed to further evaluate the effect of SPDF on the gut microbiota. 16S rRNA sequencing was employed to elucidate the ecological diversity of fecal microbiota by SPDF. Furthermore, the concentrations of short-chain fatty acids (SCFA) were determined and the ability of dietary fiber to modulate the function of the small intestine was also assessed.
Materials and methods
Chemicals
α-Amylase (CAS 9001-19-8 3000 U mL−1), protease (CAS 9014-01-1 50 mg mL−1) and amyloglucosidase (CAS 9000-92-4 3300 U mL−1) solutions were purchased from Beijing Solarbio Science & Technology, Co. Ltd. BBL medium, Rogosa agar modified (pH 6.2) medium, modified EMB medium, modified Bacteroides bile esculin agar and TSC were purchased from Xuzhou Lekang Co., Ltd. Other analytical reagents were of analytical grade.Sweet potato dietary fiber (SPDF) extraction
One cultivar (Sushu8) of fresh sweet potato was purchased from a local market. Soluble SPDF was extracted based on previously reported methods with minor modifications.11 Sweet potato residue was dispersed in MES-TRIS buffer (1![[thin space (1/6-em)]](https://www.rsc.org/images/entities/char_2009.gif) :
:![[thin space (1/6-em)]](https://www.rsc.org/images/entities/char_2009.gif) 40, w/v) by continuous stirring for 1 h. Then, α-amylase (3000 U mL−1, 1 g per 50 μL), protease (50 mg mL−1, 1 g per 100 μL) and amyloglucosidase solutions (3300 U mL−1, 1 g per 100 μL) were added to achieve gelatinization, depolymerize proteins and hydrolyze starch fragments to glucose, respectively. The filtered liquor was precipitated four times with volumes of 95% ethyl alcohol pre-heated at 60 °C. The precipitate was centrifuged, dissolved in distilled water, and freeze-dried to obtain the SPDF.
40, w/v) by continuous stirring for 1 h. Then, α-amylase (3000 U mL−1, 1 g per 50 μL), protease (50 mg mL−1, 1 g per 100 μL) and amyloglucosidase solutions (3300 U mL−1, 1 g per 100 μL) were added to achieve gelatinization, depolymerize proteins and hydrolyze starch fragments to glucose, respectively. The filtered liquor was precipitated four times with volumes of 95% ethyl alcohol pre-heated at 60 °C. The precipitate was centrifuged, dissolved in distilled water, and freeze-dried to obtain the SPDF.
Molecular weight assay
Based on a previous study,12 five micrograms of SPDF was dissolved in 1 mL of 0.1 M NaNO3 solution and then placed in a 45 °C water bath for 10 min. The SPDF solution was centrifuged at 14![[thin space (1/6-em)]](https://www.rsc.org/images/entities/char_2009.gif) 000g for 10 min and 100 μL of the supernatant was taken out for analysis. The molecular weight of SPDF was determined using a high performance liquid chromatography (HPLC) system (Waters, USA) equipped with an refractive index (RI): Optilab T-rEX (Wyatt Technology, CA, USA) detector. The columns include Ohpak SB-805 HQ (300 × 8 mm), Ohpak SB-804 HQ (300 × 8 mm), and Ohpak SB-803 HQ (300 × 8 mm). The mobile phase was 0.1 M NaNO3 solution in isocratic elution mode. The flow rate was 0.4 mL min−1 and the column oven temperature was set at 45 °C. Dextrose samples of molecular weights 0.35, 3, 21, 130, 600, 820, and 3755 kDa were used for the standard curve.
000g for 10 min and 100 μL of the supernatant was taken out for analysis. The molecular weight of SPDF was determined using a high performance liquid chromatography (HPLC) system (Waters, USA) equipped with an refractive index (RI): Optilab T-rEX (Wyatt Technology, CA, USA) detector. The columns include Ohpak SB-805 HQ (300 × 8 mm), Ohpak SB-804 HQ (300 × 8 mm), and Ohpak SB-803 HQ (300 × 8 mm). The mobile phase was 0.1 M NaNO3 solution in isocratic elution mode. The flow rate was 0.4 mL min−1 and the column oven temperature was set at 45 °C. Dextrose samples of molecular weights 0.35, 3, 21, 130, 600, 820, and 3755 kDa were used for the standard curve.
Monosaccharide composition analysis
Based on a previous study,12 monosaccharide composition analysis of SPDF was performed by ion chromatographic (IC) analysis of acid hydrolysate of the sugars. Briefly, 4 mol L−1 of trifluoroacetic acid (TFA) was added to 5 mg of SPDF samples to hydrolyze at 121 °C for 2 h. After the temperature decreased to room temperature, methanol was added to the solution and nitrogen was purged to remove excess TFA. The methanol washing step was repeated 3 times. Afterward, distilled water was added to re-dissolve the dry sample. The monosaccharide stock solutions (10.0 mg mL−1) including fucose, arabinose, galactose, glucose, xylose, mannose, fructose, ribose, glucuronic acid (Glu A) and galacturonic acid (Gal A) were serial diluted to 30, 25, 20, 15, 10, 5 and 1 mg mL−1 for analyzing the monosaccharide composition of the samples. All the solutions were filtered using a 0.22 μm microporous membrane and then stored at 4 °C prior to use.The monosaccharide compositions were analyzed using an ICS5000 model (Thermo Fisher Scientific, USA) equipped with an electrochemical detector. A Dionex™ Carbo PAC™ PA20 column was used at 40 °C. A gradient of distilled water (A), 100 mM sodium hydroxide solution (B), and 100 mM sodium hydroxide/200 mM sodium acetate solution (C) flowing at 0.50 mL min−1 was employed. The linear gradient was as follows: 97.5% A and 2.5% B from 0 to 25 min, then 77.5% A, 2.5% B and 20% C from 25 to 40 min, and to 97.5% A, 2.5% B in the next 10 min, and kept isocratic at 97.5% A, 2.5% B for another 10 min.
Simulated in vitro intestinal digestion
All steps were carried out at 37 °C under continuous agitation on a magnetic stirrer according to a previously published method with some modifications.13 Twelve g of the SPDF sample were resuspended in 200 mL of phosphate buffer saline (PBS, pH 7.4), 195 μL of α-amylase solution was added and the mixture was incubated for 30 min. The pH was adjusted to 2.0 with HCl. A gastric step was simulated by adding 0.54 g of pepsin and incubating for 30 min. After neutralization with NaOH to pH 6.8, a final incubation of 90 min was conducted after the addition of 25 mL of 0.5 M Na2CO3 solution containing 0.11 g of porcine pancreatin and 0.7 g of bile salt. The digested mixture was immediately transferred into 100 kDa dialysis bags (Viskase, Illinois, USA) to remove small molecules.In vitro batch culture fermentation
The effects of SPDF on the rat intestinal microbiota were investigated using a previously reported method.14 Rat fecal slurries were prepared by mixing fecal samples with PBS to yield 10% (w/v) suspensions. 3, 9, or 15 g of SPDF samples were mixed with 10 mL fecal slurries to yield a final concentration of 3%, 9% and 15% (w/v), respectively. The samples were then inoculated with 10 mL of fecal slurry (10%, w/v) under an anaerobic atmosphere of 10% H2, 10% CO2 and 80% N2 at 37 °C (Xuzhou Special Gas Plant, Jiangsu Province, China). All experiments were repeated in triplicate.Bacterial enumeration
Culture solution samples for bacterial enumeration were collected at 0, 6, 12, and 24 h from an in vitro batch culture system. The growth stimulation or inhibition effects were determined by monitoring growth on differential and selective media e.g. BBL medium for the Bifidobacterium genus, Rogosa agar modified (pH 6.2) medium for Lactobacillus, modified EMB medium for Enterobacillus, modified Bacteroides bile esculin agar for Bacteroides, and TSN medium for Clostridium perfringens. One hundred μL of the culture samples taken from the in vitro bath culture fermentation system (10-fold serial dilution) were inoculated on selective medium-containing plates. The plates were incubated under anaerobic conditions for 48 h at 37 °C. After incubation, the plates were examined and the specific bacterial number was expressed as log (CFU mL−1).15 The prebiotic index (PI) was calculated as PI = (Bif/Total) − (Bac/Total) + (Lac/Total) − (Clos/Total), where Bif is Bifidobacterial numbers at sample time, Bac is Bacteroides numbers at sample time, Lac is Lactobacilli numbers at sample time, Clos is Clostridia numbers at sample time and total is total bacterial numbers at sample time.16Identification of the isolated bacteria
Polymerase chain reaction (PCR) was used to amplify the 16S rRNA gene of the isolated bacteria. Total DNA was isolated using a Genomic DNA purification kit (Tiangen Biotech Co., Ltd, Beijing, China). PCR amplification was carried out using 16S rDNA bacterial primers 27F (AGAGTTTGA TCCTGGCTCAG) and 1492R (TACGGCTACCTTGTTACGACTT). The nucleotide sequence was compared with published bacterial 16S rDNA sequences through a standard nucleotide–nucleotide BLAST (http://www.ncbi.nlm.nih.gov/blast) homology search. The GenBank accession numbers for the sequence are shown in Table S1.†Animal feeding
Eighteen male Wistar rats (200 ± 20 g) were purchased from Beijing Vital River Laboratory Animal Technology Co., Ltd. All animal procedures were performed in accordance with the Guidelines for Care and Use of Laboratory Animals of Jiangsu Normal University and approved by the Animal Ethics Committee of Jiangsu Normal University. The rats were housed in stainless steel cages in a temperature-controlled room maintained on a 12 h light/12 h dark cycle. Each group was fed with the indicated diet ad libitum and allowed free access to water.After acclimation with a standard diet for 1 week, Wistar rats were assigned into three groups (n = 6 in each) and fed a standard diet or standard diets supplemented with different concentrations of SPDF: (a) standard diet, (b) standard diet containing 3% SPDF, and (c) standard diet containing 15% SPDF. The feeds were prepared by Shanghai SLAC Laboratory Animal Co. Ltd (Shanghai, China). The rats remained on their assigned diets for 28 days. The body weight and food intake were recorded daily.
Sample collection and storage
Rat feces were collected individually at day 0 and day 28 after feeding with different diets commenced. Immediately after collection, samples were stored at −80 °C until analyses. At the end of the experiment, the animals were anesthetized with diethyl ether and blood was collected from the retro-orbital sinus in heparin sodium solution rinsed tubes. The abdomen was opened through a midline incision and various tissues, e.g. the liver, kidney, spleen, thymus, small intestine, duodenum, and colon, were excised and weighed. The colon content was taken out for pH and water content analysis immediately. The remaining colon content and isolated tissues were snap frozen in liquid nitrogen and stored at −80 °C for future analyses.DNA extraction, PCR amplification and illumina MiSeq sequencing
The fecal bacterial DNA from each sample was extracted using a QIAamp DNA Stool Mini Kit (Qiagen, Hilden, Germany) according to the manufacturer's instructions. The final DNA concentration and purity were determined with a NanoDrop 2000 UV-vis spectrophotometer (Thermo Scientific, Wilmington, USA), and DNA quality was checked by 1% agarose gel electrophoresis. The V3–V4 hypervariable regions of the bacterial 16S rRNA gene were amplified with primers 338F (5′-ACTCCTACGGGAGGCAGCAG-3′) and 806R (5′-GGACTACHVGGGTWTCTAAT-3′) using a thermocycler PCR system (GeneAmp 9700, ABI, USA). The PCR was conducted using the following program: 3 min of denaturation at 95 °C, 27 cycles of 30 s at 95 °C, 30 s of annealing at 55 °C, and 45 s of elongation at 72 °C, and a final extension at 72 °C for 10 min. The PCR was performed in triplicate: 20 μL mixture containing 4 μL of 5× FastPfu Buffer, 2 μL of 2.5 mM dNTPs, 0.8 μL of each primer (5 μM), 0.4 μL of FastPfu polymerase and 10 ng of template DNA. The resulting PCR products were extracted from a 2% agarose gel and further purified using an AxyPrep DNA Gel Extraction Kit (Axygen Biosciences, Union City, CA, USA) and quantified using QuantiFluor™-ST (Promega, USA) according to the manufacturer's protocol. Purified amplicons were pooled in an equimolar and paired-end sequence (2 × 300) on an Illumina MiSeq platform (Illumina, San Diego, USA) according to the standard protocols by Majorbio Bio-Pharm Technology Co. Ltd (Shanghai, China).Processing of sequencing data
Raw fastq files were quality-filtered using Trimmomatic and merged using FLASH with the following criteria: (i) the reads were truncated at any site receiving an average quality score <20 over a 50 bp sliding window. (ii) Sequences whose overlap was longer than 10 bp were merged according to their overlap with mismatch no more than 2 bp. (iii) Sequences of each sample were separated according to barcodes (exactly matching) and primers (allowing 2 nucleotide mismatching) and reads containing ambiguous bases were removed.Operational taxonomic units (OTUs) were clustered with a 97% similarity cutoff using UPARSE (version 7.1 http://drive5.com/uparse/) with a novel ‘greedy’ algorithm that performs chimera filtering and OTU clustering simultaneously. The taxonomy of each 16S rRNA gene sequence was analyzed using the RDP Classifier algorithm (http://rdp.cme.msu.edu/) against the Silva (SSU123) 16S rRNA database using a confidence threshold of 70%.
Relative quantitative PCR analysis of microbial DNA
Real-time PCR was carried out on an ABI StepOnePlus™ Real-Time PCR System (Applied Biosystems, Foster City, California, USA) using a Plus SYBR real-time PCR mixture (BioTeke Co., Ltd, Peking, China). The following amplification parameters were used for PCR: 94 °C for 2 min, and 40 cycles of amplification at 95 °C for 15 s and 60 °C for 30 s. A melting curve (95 °C for 15 s, 60 °C for 1 min, and 95 °C for 15 s) was obtained. The primer sequences representing major bacterial phylum genes were (1) Firmicutes: Fwd (5′–3′): GGAGYATGTGGTTTAATTCGAAGCA, Rev (5′–3′): AGCTGACGACAACCATGCAC; (2) Bacteroidetes: Fwd (5′–3′): GGARCATGTGGTTTAATTCGATGAT, Rev (5′–3′): AGCTGACGACAACCATGCAG;16 (3) Akkermansia: Fwd (5′–3′): CAGCACGTGAAGGTGGGGAC, Rev (5′–3′): CCTTGCGGTTGGCTTCAG; (4) universal bacterial primers: 515Fwd (5′–3′): GTGCCAGCM GCCGCGGTAA, 806Rev (5′–3′): GGACTACHVGGGTWTCTAAT.17 All data were expressed relatively as ratios of 16S rRNA (Firmicutes; Bacteroidetes; and Akkermansia) levels to bacterial 16S rRNA levels.18 The relative gene expression level was calculated as 2−ΔCт, where ΔCт was determined using the software provided by Applied Biosystems Inc.Quantification of the SCFA content in the fermented fecal samples
The SCFA content in the samples were determined according to a previously published study.19 Briefly, 1 g of the sample was thawed and suspended in 10 mL of water and shaken for 1 min on a vortex mixer. The extraction was performed using the sonication method, followed by centrifugation for 10 min at 7500g. Then, 1 mL of the supernatant was transferred to a new flask, 100 μL of diluted H2SO4 (50 mM) was added, and deionized water was used to make up to a volume of 10 mL. The solution was filtered with a 0.22 μm filter for the ion chromatography system. On the day of analysis, the stock solutions of individual fatty acids were adequately diluted to give serial concentrations of 40.0, 30.0, 20.0, 10.0, 5.0, 2.5, and 1.0 mg kg−1, respectively. The linearity of response for standard acids was tested using a Metrohm ion chromatograph (850 Professional IC, Metrohm, Herisau, Switzerland) system, which was fitted with a Metrosep Organic Acids polymer-based cation exchanger column (250 mm × 7.8 mm i.d., 9 μm particle size) and a conductivity detector (model 819, Metrohm, Herisau, Switzerland). A single mobile phase consisting of 0.5 mM H2SO4 was used. An isocratic elution was performed. The flow rate was 0.5 mL min−1 and a loop injector of 20 μL was used. The column oven temperature was set at 45 °C. A LiCl solution of 50 mM was used as a suppressor regenerant. The chromatograms were analyzed using MagIC Net software (Metrohm, Herisau, Switzerland).Determination of colon content pH and water content
About 100 mg of the colon content were weighed out and mixed with 1.5 mL deionized water. The samples were centrifuged at 13![[thin space (1/6-em)]](https://www.rsc.org/images/entities/char_2009.gif) 000g for 5 min, and the supernatant was taken out for pH measurement using a pH meter (FE28, Mettler-Toledo, Switzerland). For the colon content determination, 5 g of the colon content were freeze-dried to get dry pellets. The water content was calculated as: water content% = (mweight − mdry)/mweight × 100%.
000g for 5 min, and the supernatant was taken out for pH measurement using a pH meter (FE28, Mettler-Toledo, Switzerland). For the colon content determination, 5 g of the colon content were freeze-dried to get dry pellets. The water content was calculated as: water content% = (mweight − mdry)/mweight × 100%.
Analysis of the villus height and crypt depth in the small intestine
The small intestine was fixed in 4% paraformaldehyde overnight at 4 °C. The fixed samples were embedded in paraffin and sectioned at 5 μm. All the sections were deparaffinized, and hydrated through a graded series of xylene, ethanol, and deionized water for hematoxylin and eosin (HE) staining. The villus length and crypt depth in the intestinal tissue were analyzed using Image pro-plus 6.0 (Eclipse Ts2R, Nikon, Japan).20 The ratio of the villus length to crypt depth was calculated and expressed as V/F.Statistical analysis
All data were expressed as the mean ± SD using SPSS version 18.0 (SPSS Inc., Chicago, Illinois). Student's t-test (two-samples assuming equal or unequal variances, depending on a data set) was used for the statistical analyses of the results. The body weight gains within the groups were analyzed by the paired t test before and after the feeding trial. Statistical analyses were performed using 1-way analysis of variance (ANOVA) and Tukey's test. P < 0.05 indicates statistically significant difference.Results
Molecular weight and monosaccharide composition of SPDF
Table 1 showed that SPDF was composed of two main fractions, and the elution times were 53.60 min (peak 1) and 61.48 min (peak 2). The molecular weight of peak 1 and 2 was 238.52 kDa and 24.70 kDa, respectively.| Molecular weight | |||
|---|---|---|---|
| Peak number | RT (min) | M w (kDa) | RI |
| Peak 1 | 53.60 | 238.52 | 1.00 |
| Peak 2 | 61.48 | 24.70 | 0.66 |
| Sugar composition | |||
|---|---|---|---|
| RT (min) | Relative peak area (%) | Mass percent (%) | |
| Fucose | 3.51 | 0.13 | 0.265 |
| Arabinose | 7.83 | 4.29 | 8.233 |
| Galactose | 9.99 | 19.14 | 27.980 |
| Glucose | 11.42 | 32.37 | 45.426 |
| Xylose | 13.56 | 0.16 | 0.237 |
| Mannose | 14.15 | 1.06 | 2.017 |
| Fructose | 16.13 | 0.10 | 0.425 |
| Ribose | n.a. | n.a. | n.a. |
| GalA | 35.28 | 3.73 | 15.137 |
| GlcA | 38.26 | 0.12 | 0.282 |
SPDF contained nine monosaccharides. The percent of fucose, arabinose, galactose, glucose, xylose, mannose, fructose, GalA and GalcA was 0.265%, 8.233%, 27.980%, 45.426%, 0.237%, 2.017%, 0.425%, 15.137% and 0.282%, respectively (Table 1).
Prebiotic activity of SPDF
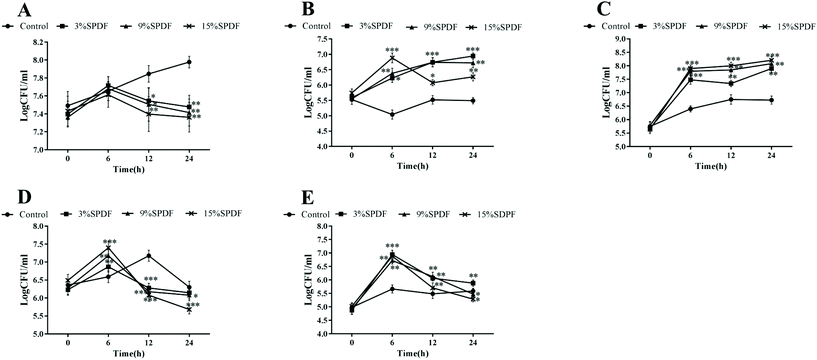
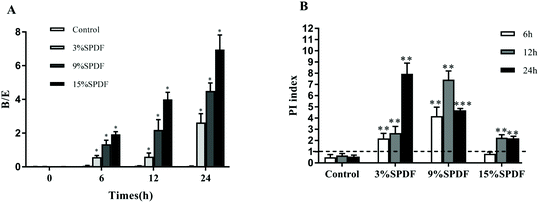
A mixed-culture fermentation with rat fecal inoculate was used to elucidate the effects of SPDF on the diversity of the intestinal microbiota. The amplified 16S rDNA sequences of the five microorganisms were compared directly with the BLAST database. A high level of similarity of 16S rDNA nucleotide sequences (97.61–99.80% of matches) was observed for the isolated strains as shown in Table S1.† Our results showed that digested SPDF mediated significant increases in concentrations of Bifidobacterium and Lactobacillus genera in a dose and time dependent manner (Fig. 1). The numbers of Enterobacillus, Clostridium perfringens and Bacteroides kept increasing from 0 to 6 h and then decreased from 6 to 24 h in the SPDF groups. Compared to the negative groups, the numbers of Enterobacillus and Clostridium perfringens were significantly decreased at 12 and 24 h in a dose dependent manner, while the number of Bacteroides was significantly increased at 6 and 12 h in 3%, 9% and 15% groups (Fig. 1). Furthermore, the prebiotic index and Bifidobacterium/Enterobacillus (B/E) value were also significantly increased in a dose dependent manner, indicating beneficial prebiotic effects of SPDF (Fig. 2).Effects of SPDF on food intake, body weight gain and organ weights
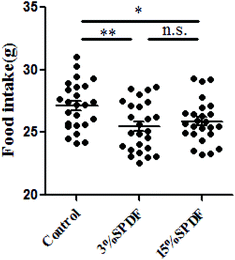
Rats in the 3% and 15% SPDF groups consumed less food than the control group (Fig. 3). There was no significant difference between food intake in the 15%SPDF and 3%SPDF groups. Rats fed with 3% SPDF showed a relatively slow increase in their body weight gains in the 28-day study period. However, this difference was not statistically significant (Fig. S1†). There were no differences in the absolute or relative organ weights for the liver, kidney, spleen and thymus (Table S2†).Effects of SPDF on the ecological diversity of fecal microbiota
16S rRNA gene sequencing was performed to investigate the effect of SPDF on the gut microbiota. A total of 39![[thin space (1/6-em)]](https://www.rsc.org/images/entities/char_2009.gif) 690 reads with an average read length of 436 bp were obtained (Table S3†). There were no significant differences in the numbers of OTUs between the treatment and control groups. There were no differences in α-diversity values (Chao1, Shannon index, and Simpson index) in the fecal samples of rats fed 3% or 15% SPDF. The current results indicated that the amount of SPDF did not change the gut microbiota species diversity at 97% identity.
690 reads with an average read length of 436 bp were obtained (Table S3†). There were no significant differences in the numbers of OTUs between the treatment and control groups. There were no differences in α-diversity values (Chao1, Shannon index, and Simpson index) in the fecal samples of rats fed 3% or 15% SPDF. The current results indicated that the amount of SPDF did not change the gut microbiota species diversity at 97% identity.
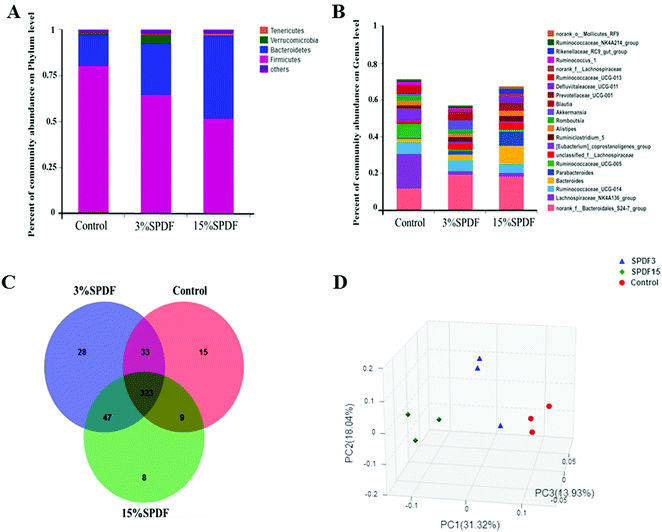
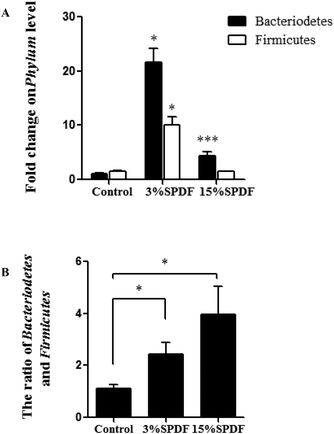
The bacterial composition was compared in the feces of rats fed with 0, 3% or 15% SPDF. Total bacterial abundance was assigned to five different phyla Firmicutes, Bacteroidetes, Verrucomicrobia, Tenericutes, and others (Fig. 4A). Firmicutes and Bacteroidetes were the predominant phyla. During the SPDF intervention period, there was a significant increase in the number of Bacteroidetes bacteria, but a significant decrease in the overall number of Firmicutes (P < 0.05). At the genus level, the relative abundance of norank_o_Mollicutes_RF9, Ruminococcaceae_NK4A214_group, Rikenellaceae_RC9_gut_group, Ruminococcus_1, norank_f_Lachnospiraceae, Ruminococcaceae_UCG-013, Defluviitaleaceae_UCG-011, Prevotellaceae_UCG-001, Blautia, Akkermansia, Romboutsia, Alistipes, Ruminiclostridium_5, [Eubacterium]_coprostanoligenes_group, unclassified_f_Lachnospiraceae, Ruminococcaceae_UCG-005, Parabacteroides, Bacteroides, Ruminococcaceae_UCG-014, Lachnospiraceae_NK4A136_group, and norank_f_Bacteroidales_S24-7_group was altered by the SPDF supplementation (Fig. 4B). A Venn diagram showed the number of corporate or particular OTUs in different groups. Combined with OTU representatives of species, the gut microbiota of different dose groups were obtained. The composition of the gut microbiota was different among the three groups, and the 3% SPDF group rats had the most abundant intestinal flora (Fig. 4C). Principal Coordinates Analysis (PCoA) showed that the effects of SPDF, both in 3% and 15% groups, were significant, compared to the controls (Fig. 4D). Additionally, the amount of Firmicutes and Bacteroidetes at the phylum level (Fig. 5) and the increase of Akkermansia at the genus level were confirmed by q-PCR (Fig. 6). We observed a significant increase in the number of the Bacteriodetes phylum between the control and other study groups. In addition, a significant increase in the number of Firmicutes was observed in the 3% SPDF group but not in the 15% SPDF group. However, the ratio of Bacteriodetes to Firmicutes increased comparing the SPDF groups to the control group in a dose-dependent manner. Finally, the quantities of Akkermansia were significantly increased in the 3% and 15% SPDF groups compared to that of the control group.
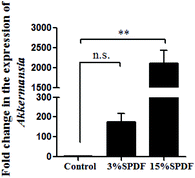 | ||
| Fig. 6 Variation of Akksermansia abundance after 4-weeks feeding (n = 6) determined by qRT-PCR (n = 6). | ||
Colon SCFA content
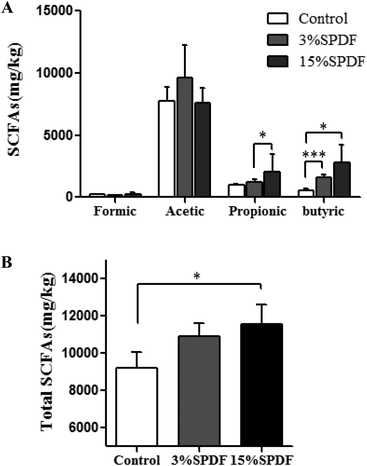
The concentrations of SCFA including formic acid, acetic acid, propionic acid and butyric acid were measured in the feces (Fig. 7 and Table S4†). A significant increase of the total SCFA concentration was observed in the feces of the 15% SPDF group relative to the control, while no changes were observed in the 3% SPDF group. The production of propionate in the 3% SPDF group was increased compared to that of the control group. The concentrations of butyrate in the 3% and 15% SPDF groups were both significantly higher, whereas those of formic acid and acetic acid remained unchanged.Water content and pH of the colon content
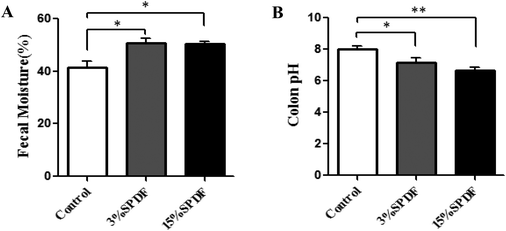
Water contents of the colon content for the rats fed 3% and 15% SPDF were significantly increased (p < 0.05) compared to that of the control group (Fig. 8A). The pH levels in the 3% and 15% SPDF groups were significantly lower (p < 0.05) than that in the control groups (Fig. 8B).Small intestinal villus height and fossa depth
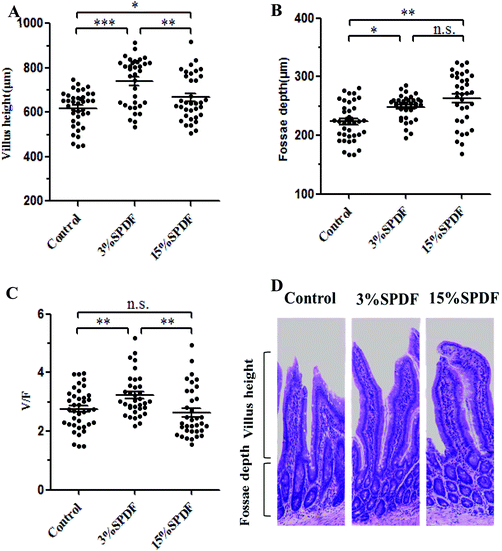
After 4 weeks of supplementation, the villus heights of the rats in the 3% and 15% SPDF groups were significantly higher than those of the control rats (p < 0.05, Fig. 9A and D). The crypt depth of the rats in the treatment groups were increased compared to that of the control group (Fig. 9B and D). However, only 3% SPDF significantly increased the V/F value, whereas there were no differences between the 15% SPDF and control groups (Fig. 9C).Discussion
The importance of the human gut microbiota has been well established in the recent decade, and diet is one of the most important factors.21 The microbiota in the intestine and colon depend on the dietary components passing through from the upper GI tract for their energy harvest and growth, in which dietary fibers are one of the main components.22,23 Dietary fibers could promote or suppress the growth of distinct bacterial groups in the competitive environment of the intestine and colon.24,25 This study investigated sweet potato, as a cheap and abundant source of dietary fibers, for its effect in altering the diversity and composition of the gut microbiota.For the in vitro study, a batch culture system was used as it is convenient, inexpensive and suitable for screening experiments, compared to the mucosal-simulator of the human intestinal microbial ecosystem (M-SHIME) and a three-stage chemostat or gut model.14,26 Additionally, a B/E and PI equation was originally developed on the basis of the in vitro fermentation data.16 In the current study, all of the 3%, 9% and 15% SPDF treated groups had a higher B/E score than the control groups and 15% SPDF showed the greatest B/E value. For the PI score, the 9% and 15% groups obtained the highest PI scores after 12 h of fermentation and then decreased at 24 h. Specifically, 3% SPDF demonstrated an increase of the prebiotic effects from the beginning of the fermentation to the end. SPDF achieved its greatest prebiotic effects at 24 h of fermentation at the 3% dosage.
In the GI tract, Bacteroidetes and the Firmicutes are the dominant phyla, which generally account for over 90% of the gut microbiota in both rats and humans. Ruminococcus, Lactobacillus and Prevotella are the major families or genera in Bacteroidetes and Firmicutes.27–30 In this study, SPDF supplementation concentration-dependently reduced the Firmicutes to Bacteroidetes ratio. Previous studies have established the correlation of an increase in the Firmicutes to Bacteroidetes ratio to higher energy harvesting from diet and the pathology of obesity,31–33 whereas the SPDF induced decrease of such a ratio may indicate beneficial effects. Lactobacillus is involved in simple sugar degradation.34–36Bifidobacteria, Enterobacteriaceae, and Akkermansia have also been reported to be involved in energy metabolism and balance.37–41Bifidobacteria is a probiotic known to reinforce the immune system and ease digestive concerns. An increase in Bifidobacteria, as observed in this study after SPDF supplementation, may help boost the immune system and promote health. Akkermansia is a dominant human bacterium that prefers a nutrient-rich environment, such as the intestine and the colon, and usually resides in the mucus layer. Akkermansia can represent 3–5% of the microbiota in a healthy gut environment, and its abundance has been shown to inversely correlate with the body weight and risk of type 1 diabetes in mice and humans.42 An increase in Akkermansia abundance induced by SPDF can improve the gut barrier and metabolic parameters, and therefore, exert health-promoting effects. Ruminococcus and Prevotella were shown to be involved in polysaccharide metabolism, especially fiber,43,44 and our study confirmed their roles in the GI tract.
In addition to the microbiota abundance and composition changes, this study examined other chemical and physiological changes induced by SPDF. SCFAs are the end-products from fermentation of dietary fiber in the colon. Butyric acids and propionic acids are important for maintaining normal bowel functions and the integrity of the colonic mucosa.45 They act as signaling molecules between the gut microbiota and the host, exhibiting multiple beneficial effects on host health. For example, butyrate can inhibit the development of colorectal cancer through regulating the immune system, inflammation response, oxidative status, cell differentiation or apoptosis or inhibiting histone deacetylase and promoting intestinal health.46 Acetate and propionate might stimulate free fatty acid receptor 2 (FFA2/GPR 43) in the adipose tissue of mice, thereby reducing lipolytic activity and adipogenesis.47 In the current study, a significant increase of propionate and butyrate in the feces of rats fed SPDF suggested that SPDF might provide more effective application prospects for the therapy of obesity, colorectal cancer, or other nutritional and metabolic diseases.
An increased ratio of the villus height to crypt depth (V/F) indicates mucosal integrity, which improves the digestion and absorption function.7 SPDF supplementation in the standard diet in this study resulted in a higher V/F ratio, which indicates improved digestion and absorption in the GI tract.
In summary, this study investigated the dietary fibers from the sweet potato residue, a previously little utilized industrial by-product and showed its effects in promoting the abundance of beneficial gut microbiota species and short chain fatty acids, and at the same time, improving the balance of gut bacteria and intestinal physiology. SPDF showed great prebiotic effects and positive modulations of the microbiota composition and metabolic activity at a low dose, and 3% SPDF might be the optimum prebiotic dose. Our findings demostrated a health-promoting role of SPDF and supported further research and utilization of SPDF as a functional food.
Conflicts of interest
There are no conflicts of interest to declare.Acknowledgements
This research was supported by the National Natural Science Foundation of China (31972171 and 31671944), Six Talent Peaks Project of Jiangsu Province (SWYY-026), Qing Lan Project of Jiangsu Province, Natural Science Foundation of Jiangsu (BK20181006), Natural Science Foundation by Xuzhou City (KC17053 and KC18141), the PAPD of Jiangsu Higher Education Institutions, a grant from the Beijing Advanced Innovation Center for Food Nutrition and Human Health, and a grant from the Sanyuan Medicine Group.References
- J. A. Woolfe, Sweet potato: untapped food resource, Cambridge Univ. Press, Cambridge u.a., 1992 Search PubMed.
- M. Zhang, M. Liu, S. Pan, C. Pan, Y. Li and J. Tian, Perillaldehyde Controls Postharvest Black Rot Caused by Ceratocystis fimbriata in Sweet Potatoes, Front. Microbiol., 2018, 9, 1102 CrossRef PubMed.
- L. S. Collado, L. B. Mabesa, C. G. Oates and H. Corke, Bihon-type noodles from heat-moisture treated sweet potato starch, J. Food Sci., 2001, 66(4), 604–609 CrossRef CAS.
- H. Lu, Y. Gui, L. Zheng and X. Liu, Morphological, crystalline, thermal and physicochemical properties of cellulose nanocrystals obtained from sweet potato residue, Food Res. Int., 2013, 50, 121–128 CrossRef CAS.
- X. Mei, T. H. Mu and J. J. Han, Composition and physicochemical properties of dietary fiber extracted from residues of 10 varieties of sweet potato by a sieving method, J. Agric. Food Chem., 2010, 58, 7305–7310 CrossRef PubMed.
- G. Besten, K. Eunen, A. K. Groen, K. Venema, D. Reijngoud and B. M. Bakker, The role of short-chain fatty acids in the interplay between diet, gut microbiota and host energy metabolism, J. Lipid Res., 2013, 54(9), 2325–2340 CrossRef PubMed.
- W. Cheng, J. Lu, B. Li, W. Lin, Z. Zhang, X. Wei, C. Sun, M. Chi, W. Bi, B. Yang, A. Jiang and J. Yuan, Effect of functional oligosaccharides and ordinary dietary fiber on intestinal microbiota diversity, Front. Microbiol., 2017, 8, 1750 CrossRef PubMed.
- A. N. Payne, A. Zihler, C. Chassard and C. Lacroix, Advances and perspectives in in vitro human gut fermentation modeling, Trends Biotechnol., 2012, 30(1), 17–25 CrossRef CAS PubMed.
- I. Sekirov, S. L. Russell, L. M. Antunes and B. Finlay, Gut microbiota in health and disease, Physiol. Rev., 2010, 90, 859–904 CrossRef CAS PubMed.
- C. D. Filippo, D. Cavalieri, M. D. Paola, M. Ramazzotti, J. B. Poullet, S. Massart, S. Collini, G. Pieraccini and P. Lionetti, Impact of diet in shaping gut microbiota revealed by a comparative study in children from Europe and rural Africa, Proc. Natl. Acad. Sci. U. S. A., 2010, 107(33), 14691–14696 CrossRef PubMed.
- Y. Niu, N. Li, Q. Xia, Y. Hou and G. Xu, Comparisons of three modifications on structural, rheological and functional properties of soluble dietary fibers from tomato peels, LWT–Food Sci. Technol., 2018, 88, 56–63 CrossRef CAS.
- L. Chen, W. Xu, S. Lin and P. C. K. Cheung, Cell wall structure of mushroom sclerotium (Pleurotus tuber regium): Part 1. Fractionation and characterization of soluble cell wall polysaccharides, Food Hydrocolloids, 2014, 36, 189–195 CrossRef CAS.
- V. Lebet, E. Arrigoni and R. Amadò, Digestion procedure using mammalian enzymes to obtain substrate for in vitro fermentation studies, LWT–Food Sci. Technol., 1998, 31, 509–515 CrossRef CAS.
- X. Zhang, Y. Yang, Z. Wu and P. Weng, The modulatory effect of anthocyanins from purple sweet potato on human intestinal microbiota in vitro, J. Agric. Food Chem., 2016, 64, 2582–2590 CrossRef CAS PubMed.
- Z. Li, P. H. Summanen, T. Komoriya and S. M. Finegold, In vitro study of the prebiotic xylooligosaccharide (XOS) on the growth of Bifidobacterium spp and Lactobacillus spp., Int. J. Food Sci. Nutr., 2015, 66(8), 919–922 CrossRef CAS PubMed.
- R. Palframan, G. R. Gibson and R. A. Rastall, Development of a quantitative tool for the comparison of the prebiotic effect of dietary oligosaccharides, Lett. Appl. Microbiol., 2003, 37, 281–284 CrossRef CAS PubMed.
- K. Williams, J. Milner, M. D. Boudreau, K. Gokulan, C. E. Cerniglia and S. Khare, Effects of subchronic exposure of silver nanoparticles on intestinal microbiota and gut-associated immune responses in the ileum of Sprague-Dawley rats, Nanotoxicology, 2015, 9(3), 279–289 CrossRef CAS PubMed.
- A. Hussain, M. K. Yadav, S. Bose, J. H. Wang, D. Lim, Y. K. Song, S. G. Ko and H. Kim, Daesiho-Tang is an effective herbal formulation in attenuation of obesity in mice through alteration of gene expression and modulation of intestinal microbiota, PLoS One, 2016, 11(11), e0165483 CrossRef PubMed.
- S. Zhou, Y. Wang, J. J. Jacoby, Y. Jiang, Y. Zhang and L. L. Yu, Effects of medium and long chain triacylglycerols on lipid metabolism and gut microbiota composition in C57BL/6J mice, J. Agric. Food Chem., 2017, 65, 6599–6607 CrossRef CAS PubMed.
- M. Liu, G. Huang, T. Wang, X. Sun and L. Yu, 3-MCPD 1-palmitate induced tubular cell apoptosis in vivo via JNK/p53 pathways, Toxicol. Sci., 2016, 152(1), 181–192 CrossRef PubMed.
- A. Hossain, A. Saeed and A. Yearul, Diet, Microbiome, and Human Health, in Health Benefits of Fermented Foods and Beverages, ed. J. P. Tamang, Taylor & Francis Publications, Boca Raton, FL, 2015, vol. 197 Search PubMed.
- C. Dominianni, R. Sinha, J. J. Goedert, Z. H. Pei, L. Y. Yang, R. B. Hayes and J. Y. Ahn, Sex, body mass index, and dietary fiber intake influence the human gut microbiome, PLoS One, 2015, 10(4), e0124599 CrossRef PubMed.
- K. M. Tuohy, L. Conterno, M. Gasperotti and R. Viola, Up-regulating the human intestinal microbiome using whole plant foods, polyphenols, and/or fiber, J. Agric. Food Chem., 2012, 60(36), 8776–8782 CrossRef CAS PubMed.
- H. Chen, X. B. Mao, L. Q. Che, B. Yu, J. He and J. Yu, Impact of fiber types on gut microbiota, gut environment and gut function in fattening pigs, Anim. Feed Sci. Technol., 2014, 195, 101–111 CrossRef CAS.
- A. P. Clavijo-Gutierrez, Response of human gut microbiota to diet supplementation with soy or soluble corn fiber, Purdue University, 2013 Search PubMed.
- R. M. Alqurashi, S. N. Alarifi, G. E. Walton, A. F. Costabile, I. R. Rowland and D. M. Commane, In vitro approaches to assess the effects of acai (Euterpe oleracea) digestion on polyphenol availability and the subsequent impact on the faecal microbiota, Food Chem., 2017, 234, 190–198 CrossRef CAS PubMed.
- P. B. Eckburg, E. M. Bik, C. N. Bernstein, E. Purdom, L. Dethlefsen, M. Sargent and D. A. Relman, Diversity of the human intestinal microbial flora, Science, 2005, 308(5728), 1635–1638 CrossRef PubMed.
- D. N. Frank, A. L. S. Amand, R. A. Feldman, E. C. Boedeker, N. Harpaz and N. R. Pace, Molecular-phylogenetic characterization of microbial community imbalances in human inflammatory bowel diseases, Proc. Natl. Acad. Sci. U. S. A., 2007, 104(34), 13780–13785 CrossRef CAS PubMed.
- R. E. Ley, F. Backhed, P. Turnbaugh, C. A. Lozupone, R. D. Knight and J. I. Gordon, Obesity alters gut microbial ecology, Proc. Natl. Acad. Sci. U. S. A., 2005, 102(31), 11070–11075 CrossRef CAS PubMed.
- R. E. Ley, D. A. Peterson and J. I. Gordon, Ecological and evolutionary forces shaping microbial diversity in the human intestine, Cell, 2006, 124(4), 837–848 CrossRef CAS PubMed.
- P. J. Turnbaugh, R. E. Ley, M. A. Mahowald, V. Magrini, E. R. Mardis and J. I. Gordon, An obesity-associated gut microbiome with increased capacity for energy harvest, Nature, 2006, 444(7122), 1027–1031 CrossRef PubMed.
- P. J. Turnbaugh, V. K. Ridaura, J. J. Faith, F. E. Rey, R. Knight and J. I. Gordon, The Effect of Diet on the Human Gut Microbiome: A Metagenomic Analysis in Humanized Gnotobiotic Mice, Sci. Transl. Med., 2009, 1(6), 10 Search PubMed.
- P. J. Turnbaugh, M. Hamady, T. Yatsunenko, B. L. Cantarel, A. Duncan, R. E. Ley, M. L. Sogin, W. J. Jones, B. A. Roe, J. P. Affourtit, M. Egholm, B. Henrissat, A. C. Heath, R. Knight and J. I. Gordon, A core gut microbiome in obese and lean twins, Nature, 2009, 457(7228), 480–U487 CrossRef CAS PubMed.
- F. Guarner and J. R. Malagelada, Gut flora in health and disease, Lancet, 2003, 361(9356), 512–519 CrossRef.
- H. W. Zeng, J. Liu, M. Jackson, L. Yan and G. Combs, Fatty liver accompanies an increase of Lactobacillus acidophilus in the hind gut of C57/BL mice fed a high-fat diet, J. Nutr., 2013, 143, 627–631 CrossRef CAS PubMed.
- X. Zhao, X. W. Liu, N. Xie, X. H. Wang, Y. Cui, J. W. Yang and F. G. Lu, Lactobacillus, species shift in distal esophagus of high-fat-diet-fed rats, World J. Gastroenterol., 2011, 17(26), 3151–3157 Search PubMed.
- J. Amar, R. Burcelin, J. B. Ruidavets, P. D. Cani, J. Fauvel, M. C. Alessi, B. Chamontin and J. Ferrieres, Energy intake is associated with endotoxemia in apparently healthy men, Am. J. Clin. Nutr., 2008, 87(5), 1219–1223 CrossRef CAS PubMed.
- F. Backhed, H. Ding, T. Wang, L. V. Hooper, G. Y. Koh, A. Nagy and J. I. Gordon, The gut microbiota as an environmental factor that regulates fat storage, Proc. Natl. Acad. Sci. U. S. A., 2004, 101(44), 15718–15723 CrossRef PubMed.
- K. Sonoyama, R. Fujiwara, N. Takemura, T. Ogasawara, J. Watanabe, H. Ito and T. Morita, Response of Gut Microbiota to Fasting and Hibernation in Syrian Hamsters, Appl. Environ. Microbiol., 2009, 75(20), 6451–6456 CrossRef CAS PubMed.
- P. J. Turnbaugh, F. Baeckhed, L. Fulton and J. I. Gordon, Diet-induced obesity is linked to marked but reversible alterations in the mouse distal gut microbiome, Cell Host Microbe, 2008, 3(4), 213–223 CrossRef CAS PubMed.
- P. J. Turnbaugh and J. I. Gordon, The core gut microbiome, energy balance and obesity, J. Physiol., 2009, 587(17), 4153–4158 CrossRef CAS PubMed.
- A. Everard, C. Belzer, L. Geurts, J. P. Ouwerkerk, C. Druart, L. B. Bindels, Y. Guiot, M. Derrien, G. G. Muccioli, N. M. Delzenne, W. M. deVos and P. D. Cani, Cross-talk between Akkermansia muciniphila and intestinal epithelium controls diet-induced obesity, Proc. Natl. Acad. Sci. U. S. A., 2013, 110(22), 9066–9071 CrossRef CAS PubMed.
- A. W. Walker, J. Ince, S. H. Duncan, L. M. Webster, G. Holtrop, X. L. Ze and H. J. Flint, Dominant and diet-responsive groups of bacteria within the human colonic microbiota, ISME J., 2011, 5(2), 220–230 CrossRef CAS PubMed.
- G. D. Wu, J. Chen, C. Hoffmann, K. Bittinger, Y. Y. Chen, S. A. Keilbaugh and J. D. Lewis, Linking Long-Term Dietary Patterns with Gut Microbial Enterotypes, Science, 2011, 334(6052), 105–108 CrossRef CAS PubMed.
- G. D. Brinkworth, M. Noakes, P. M. Clifton and A. R. Bird, Comparative effects of very low-carbohydrate, high-fat and high-carbohydrate, low-fat weight-loss diets on bowel habit and faecal short-chain fatty acids and bacterial populations, Br. J. Nutr., 2009, 101(10), 1493–1502 CrossRef CAS PubMed.
- G. Wang, Y. Yu, Y. Z. Wang, J. J. Wang, R. Guan, Y. Sun, F. Shi, J. Gao and X. L. Fu, Role of SCFAs in gut microbiome and glycolysis for colorectal cancer therapy, J. Cell. Physiol., 2019, 1–27 Search PubMed.
- C. T. Pekmez, L. O. Dragsted and L. K. Brahe, Gut microbiota alterations and dietary modulation in childhood malnutrition-The role of short chain fatty acids, Clin. Nutr., 2019, 38(2), 615–630 CrossRef PubMed.
Footnotes |
| † Electronic supplementary information (ESI) available. See DOI: 10.1039/c9fo01009b |
| ‡ These authors contributed equally to this work. |
| This journal is © The Royal Society of Chemistry 2020 |

