9t18:1 and 11t18:1 activate the MAPK pathway to regulate the expression of PLA2 and cause inflammation in HUVECs
Sheng-Ben
Hu†
a,
Qian
Zou†
a,
Xin
Lv
b,
Ruo-Lin
Zhou
a,
Xian
Niu
a,
Chen
Weng
a,
Fang
Chen
a,
Ya-Wei
Fan
a,
Ze-Yuan
Deng
 a and
Jing
Li
 *a
*a
aState Key Lab of Food Science and Technology, Institute for Advanced Study, Nanchang University, Nanchang, Jiangxi 330047, China
bOil Crops Research Institute of the Chinese Academy of Agricultural Sciences, China
First published on 2nd December 2019
Abstract
trans fatty acids (TFAs) have been reported to promote vascular diseases mainly by promoting apoptosis and inflammation of vascular endothelial cells. However, it has been reported in recent years that elaidic acid (9t18:1) and vaccenic acid (11t18:1) may have different effects on vascular health. This study investigated the effects of 9t18:1 and 11t18:1 on human umbilical vein endothelial cell (HUVEC) function and the possible mechanism of inflammation by analyzing the changes in the phospholipid composition and the relationship between phospholipase A2 (PLA2) and MAPK pathway. Here we found that the effect of 11t18:1 on cell viability, membrane damage and cellular inflammation was significantly lower than that of 9t18:1 (p < 0.05). And 9t18:1 and 11t18:1 had different effects on phospholipid composition. Both 9t18:1 and 11t18:1 significantly increased the protein expression of PLA2. Moreover, the MAPK pathway regulated the expression of PLA2, inflammatory cytokines and cyclooxygenase-2 (COX-2) and the secretion of prostaglandin E2 (PGE2) in HUVECs induced by 9t18:1 and 11t18:1. In conclusion, 9t18:1 and 11t18:1 activated the MAPK pathway which regulated the expression of PLA2 to cause inflammation in HUVECs.
Introduction
The effects of trans fatty acids (TFAs) on health have received widespread attention over the past decades. TFAs derived from industrial hydrogenated oils, known as industrial derived TFAs (I-TFAs), have been shown to promote the expression levels of inflammatory cytokines, induce damage to endothelial cells, reduce insulin sensitivity, and delay the development in infants.1,2 In addition, many clinical studies have shown that I-TFAs share a close relationship with vascular injury and cardiovascular disease (CVD).3,4 However, in addition to being found in industrial hydrogenated oils, TFAs are also derived from ruminant foods (e.g. milk, beef and mutton) and are known as ruminant TFAs (R-TFAs). Compared with I-TFAs, some studies showed no correlation between R-TFAs and CVD, and even showed a negative correlation between them.5,6The cell membrane is an important barrier to cell life activity and external material exchange. Phospholipids, as the essential components of biofilms, are widely involved in basic life activities such as substance and energy metabolism, and information transmission. It has been reported that under the stimulation of various factors, membrane phospholipids are degraded by phospholipase to form lysophospholipids, arachidonic acid (AA) and various active substances, which play an important role in vascular injury. In addition, Harvey et al.7 found that I-TFAs bound to phospholipids on endothelial cell membranes would trigger endothelial cell inflammatory response. Compared with phospholipids containing cis fatty acids, phospholipids containing TFAs were more likely to bind cholesterol and increase the activity of cell membrane cholesterol receptors.8 I-TFAs also inhibited the synthesis of polyunsaturated fatty acids (PUFA) in the phospholipids of arterial cells which is a risk factor for atherosclerosis.9 In addition, various mechanisms through which TFAs increase CVD risk are proposed, with the most prominent ones being: influencing serum lipid levels, promoting systemic inflammation, and impairing endothelial function.10
The synthesis and metabolism of phospholipids on the cell membrane are mainly regulated by synthetases, acyltransferases and phospholipases. Phospholipases are classified into phospholipase A (PLA), phospholipase C (PLC) and phospholipase D (PLD). According to the different hydrolysis sites, PLA is divided into phospholipase A1 (PLA1) and phospholipase A2 (PLA2), which hydrolyze the acyl bonds on sn-1 and sn-2 in phospholipids, respectively. In mammals, there are three common types of PLA2: secretory phospholipase A2 (sPLA2), cytoplasmic phospholipase A2 (cPLA2) and calcium-independent phospholipase A2 (iPLA2). PLA2 hydrolyzes phospholipids and liberates free fatty acids, mostly AA and lysophospholipids, which induce vasoconstriction and cause endothelial dysfunction.11
Mitogen-activated protein kinase (MAPK) is a class of serine–threonine protein kinases widely distributed in mammals and is involved in gene induction, cell apoptosis, proliferation and differentiation as well as cellular stress and inflammatory responses.12 There are three major classes of MAPK in mammals: extracellular signal-regulated kinase (ERK), c-jun N-terminal kinase (JNK) and p38. Studies have shown that ERK, JNK and p38 play important roles in vascular injury, and they may regulate the expression of genes including TNF-α, IL-2, IL-6, E-selectin, ICAM-1, VCAM-1, MCP-1 and COX-2. During glioma conditioning effect, ERK activates PLA2, upregulates cyclooxygenase-2 (COX-2) and increases prostaglandin E2 (PGE2) production in endothelial cells.13 Lee et al.14 suggest that TNF-α inducing cytosolic PLA2 expression in human lung epithelial cells is regulated by JNK and p38.
Phospholipidomics is a branch of lipidomics that analyzes the phospholipids in biological samples and can be used to determine all the changes in phospholipids in an organism under certain conditions to screen for potential phospholipid biomarkers. Therefore, the present study aims to investigate the effects of vaccenic acid (11t18:1, the most abundant TFA in R-TFAs) and elaidic acid (9t18:1, the most abundant TFA in I-TFAs) on human umbilical vein endothelial cell (HUVEC) function and the possible mechanism of inflammation by analyzing the changes in the phospholipid composition and the interaction between phospholipase and the MAPK pathway.
Materials and methods
Chemicals and reagents
HUVECs and F-12K medium were purchased from Procell Life Science & Technology Co., Ltd (China). Fatty acids and 3-(4,5-dimethylthiazol-2-yl)-2,5-diphenyltetrazolium (MTT) were purchased from Sigma (USA). Fetal bovine serum (FBS) was obtained from Biolnd (Israel). Trypsin, penicillin, streptomycin and the Oil Red O staining kit were purchased from Solarbio Science & Technology Co., Ltd (China). The lactate dehydrogenase assay kit was purchased from Nanjing Jiancheng Bioengineering Institute (China). anti-sPLA2, anti-iPLA2, anti-COX-2, anti-p-cPLA2, anti-cPLA2, anti-ICAM-1, anti-VCAM-1, anti-IL-6, anti-p38, anti-p-p38, anti-SAPK/JNK, anti-p-SAPK/JNK, anti-ERK, anti-p-ERK, and anti-β-actin were purchased from Cell Signaling Technology (USA). The PGE2 ELISA kit was purchased from Shanghai Enzyme-linked Biotechnology Co., Ltd (China).Cell culture and fatty acid treatment
HUVECs were cultured with F-12K medium containing 10% FBS, 1% penicillin, and 10% streptomycin at 37 °C in a humidified atmosphere of 5% CO2. The medium was replaced every 2 days and the cells were passaged at 80% confluence using a solution containing 0.125% trypsin and 0.02% EDTA. The fatty acid was dissolved in a 0.1 M sodium hydroxide solution, and finally a stock solution having a fatty acid concentration of 2 mM was prepared. The control group was a sodium hydroxide solution in which the concentration was the same as that in the fatty acid group.Cell viability assay
HUVECs in the logarithm period were seeded at a density of 1 × 10⁵ cells per mL into 96-well microculture plates after centrifugation and were cultured at 37 °C in humidified air with 5% CO2. HUVECs were, respectively, treated with 25, 50, 100, 200 and 400 μM 9t18:1, 11t18:1, 9c18:1 (oleic acid) and 11c18:1 (cis vaccenic acid) for 24 h. And then 200 μL MTT solution (0.5 mg mL−1) was added to each well and incubated for 4 h. The reactions were stopped by adding 150 μL of dimethyl sulfoxide to dissolve the formazan crystals, and the absorbance at 490 nm was measured using a microplate reader (Thermo Fisher, Shanghai) after gentle shaking for 10 min. At the concentration of 100 μM, TFAs (9t18:1 and 11t18:1) significantly decreased HUVEC viability (77.60% and 77.35%, respectively) compared to the control group (p < 0.05). A 23% reduction in cell activity was enough to show the effect of trans fatty acids and guaranteed a certain cell survival rate. Therefore, we chose the concentration of 100 μM for further studies.HUVEC membrane integrity, fluidity and permeability analysis
The cells were divided into five groups: control group (treated with 0.1 M PBS), 9t18:1 group (treated with 100 μM 9t18:1 for 24 h), 11t18:1 group (treated with 100 μM 11t18:1 for 24 h), 9c18:1 group (treated with 100 μM 9c18:1 for 24 h), and 11c18:1 group (treated with 100 μM 11c18:1 for 24 h).HUVECs were washed twice with PBS and then stained with AO-EB working solution and placed at room temperature for 2–5 min to detect membrane integrity using a fluorescence microscope. The membrane fluidity was measured by using 1,6-diphenyl-1,3,5-hexatriene (DPH) as a fluorescent probe. Briefly, the washed cells were incubated with 2 μM DPH and then shaken in the dark at 30 °C for 40 min. After incubation, the unincorporated DPH was removed by washing with PBS and the fluorescence anisotropy was measured by using a spectrofluorometer. The cell permeability was measured using the lactate dehydrogenase (LDH) assay kit. Briefly, the cells were lysed with a lysate and the supernatant was collected by centrifugation, and then the intracellular LDH content was determined by colorimetry.
Fatty acid analysis
The cells were seeded in a Petri dish at a density of 5 × 10⁶ mL−1. After 24 hours of culture, the original medium was discarded, and the cells were treated with 100 μM fatty acids (9t18:1, 11t18:1, 9c18:1 and 11c18:1) for 24 h, and each experiment was repeated three times. After incubation for 24 hours, the culture solution was removed and the cells were washed twice with PBS. The cells were then scraped off with PBS and centrifuged to remove the supernatant, leaving a cell pellet to determine the total fatty acid composition. Briefly, cell lipids were extracted using chloroform/methanol (2![[thin space (1/6-em)]](https://www.rsc.org/images/entities/char_2009.gif) :
:![[thin space (1/6-em)]](https://www.rsc.org/images/entities/char_2009.gif) 1, v/v) according to Folch's method15 and dried under nitrogen. Then the dried lipids were methylated and the FAME was analyzed by gas chromatography using a CP-Sil88 column (100 m × 0.25 mm × 0.2 μm) in a 6890N gas chromatograph equipped with a flame ionization detector (Agilent, USA). The initial temperature of the column was 45 °C and was held for 5 min, and then it was increased to 175 °C at a rate of 13 °C min−1 and maintained for 27 min, and finally programmed at 4 °C min−1 to reach 215 °C and held for 35 min. Analysis of all peaks was performed by comparing their retention time with FAME standards. In addition, some of the calculations used are as follows: β-oxidation conversion rate = (its β-oxidation product content − control content)/((its content − its control content) + (its β-oxidation product content − control content) + (its Δ9 desaturation product content − control content)); Δ9 desaturation conversion rate = (its Δ9 desaturation product content − control content)/((its content − control content) + (its β-oxidation product content − control content) + (its Δ9 desaturation product content − control content)).
1, v/v) according to Folch's method15 and dried under nitrogen. Then the dried lipids were methylated and the FAME was analyzed by gas chromatography using a CP-Sil88 column (100 m × 0.25 mm × 0.2 μm) in a 6890N gas chromatograph equipped with a flame ionization detector (Agilent, USA). The initial temperature of the column was 45 °C and was held for 5 min, and then it was increased to 175 °C at a rate of 13 °C min−1 and maintained for 27 min, and finally programmed at 4 °C min−1 to reach 215 °C and held for 35 min. Analysis of all peaks was performed by comparing their retention time with FAME standards. In addition, some of the calculations used are as follows: β-oxidation conversion rate = (its β-oxidation product content − control content)/((its content − its control content) + (its β-oxidation product content − control content) + (its Δ9 desaturation product content − control content)); Δ9 desaturation conversion rate = (its Δ9 desaturation product content − control content)/((its content − control content) + (its β-oxidation product content − control content) + (its Δ9 desaturation product content − control content)).
Phospholipid profile analysis
The analysis of phospholipids was performed using a shotgun-MS system consisting of a 4000 QTrap mass spectrometer (AB Sciex, Toronto, Canada) equipped with an electrospray ionization (ESI) source. Isocratic gradient elution was carried out at a flow rate of 0.02 mL min−1 and the mobile phase was methanol. The injection volume was 350 μL. PI was detected using the Shimadzu LC-20AD series LC system consisting of an AB Sciex 4000 QTrap mass spectrometer equipped with a reversed-phase Zorbax Eclipse Plus C18 column (4.6 × 100 mm, 1.8 μm, Agilent). The mobile phase consisted of (A) isopropanol/methanol/water (5/4/1, v/v/v) (10 mM ammonium acetate and 0.1% acetic acid) and (B) isopropanol/water (99/1, v/v) (10 mM ammonium acetate, 0.1% acetic acid). Gradient elution was carried out at a flow rate of 0.35 mL min−1 and the operating conditions were as follows: 0–4 min, 0% B; 4–6 min, 20% B; 6–25 min, 30% B; 25–40 min, 95% B; 40–50 min, 95% B; and 50–55 min, 0% B. The injection volume was 20 μL. The scan rate was 1000 μ s−1 and the turbo ion spray source temperature was 550 °C. All the optimal parameters of PL are shown in Table 1. And the fatty acid composition of PL was determined by secondary EPI negative scan analysis.| Classes | Scan mode | Collision energy (V) | Declustering potential (V) |
|---|---|---|---|
| PC, phosphatidyl choline; PE, phosphatidyl ethanolamine; PS, phosphatidyl serine; PG, phosphatidyl glycerol; and PI, phosphatidyl inositol. | |||
| PC | +PIS 184 | 47.7 | 166.8 |
| PE | +NLS 141 | 35.3 | 139.9 |
| PS | +NLS 185 | 38.8 | 127.7 |
| PG | +NLS 189 | 28.5 | 64.6 |
| PI | +MRM | 32 | 70 |
Western blotting analysis of inflammatory cytokines, PLA2-related proteins and MAPK-related proteins
HUVECs were divided into following groups. The control group: cells were incubated with a sodium hydroxide solution in which the concentration was the same as that of the FA group for 24 h; the FA group: cells were incubated with 100 μM FA for 24 h; the FA + IB group: cells were pretreated with inhibitors for 1 h, and then incubated with 100 μM FA for 24 h. FA stands for different fatty acids including 9t18:1, 11t18:1, 9c18:1 and 11c18:1; IB stands for different inhibitors including 1 μM PYR (cPLA2 inhibitor), 10 μM BEL (iPLA2 inhibitor), 500 μM DTT (sPLA2 inhibitor), 10 μM SB20358 (p38 inhibitor), 10 μM SP600125 (JNK inhibitor) and 10 μM PD98059 (ERK inhibitor). The concentrations and incubation time of the inhibitors were according to the previous studies14,16 and specifications.Total cell lysates were extracted by RIPA buffer on ice. After centrifugation at 12![[thin space (1/6-em)]](https://www.rsc.org/images/entities/char_2009.gif) 000 rpm for 15 min, the supernatant (protein) was collected and stored at −80 °C until use. Protein (60 μg) was added to loading buffer, boiled for 5 min, separated by 10% SDS-PAGE and then transferred to a nitrocellulose membrane. After blocking with 5% skimmed milk at room temperature for 1 h, the membranes were then incubated with anti-ICAM-1, anti-VCAM-1, anti-IL-6, anti-sPLA2, anti-iPLA2, anti-cPLA2, anti-p-cPLA2, anti-p38, anti-p-p38, anti-SAPK/JNK, anti-p-SAPK/JNK, anti-ERK and anti-p-ERK overnight at 4 °C. After that, the membranes were washed with TBST and then incubated with horseradish peroxidase-conjugated IgG antibodies for 1 h at room temperature. Finally, protein blots were visualized by using an enhanced chemiluminescence (ECL) detection kit, and immunoblots were visualized using a ChemiDoc XRS (Bio-Rad Laboratory, Hercules, CA).
000 rpm for 15 min, the supernatant (protein) was collected and stored at −80 °C until use. Protein (60 μg) was added to loading buffer, boiled for 5 min, separated by 10% SDS-PAGE and then transferred to a nitrocellulose membrane. After blocking with 5% skimmed milk at room temperature for 1 h, the membranes were then incubated with anti-ICAM-1, anti-VCAM-1, anti-IL-6, anti-sPLA2, anti-iPLA2, anti-cPLA2, anti-p-cPLA2, anti-p38, anti-p-p38, anti-SAPK/JNK, anti-p-SAPK/JNK, anti-ERK and anti-p-ERK overnight at 4 °C. After that, the membranes were washed with TBST and then incubated with horseradish peroxidase-conjugated IgG antibodies for 1 h at room temperature. Finally, protein blots were visualized by using an enhanced chemiluminescence (ECL) detection kit, and immunoblots were visualized using a ChemiDoc XRS (Bio-Rad Laboratory, Hercules, CA).
PGE2 ELISA
HUVECs were seeded at a density of 1 × 10⁵ cells per mL into 96-well microculture plates after centrifugation and were cultured at 37 °C in humidified air with 5% CO2. HUVECs were incubated with the fatty acids as described in the previous sub-section, and the culture supernatants were analyzed using the PGE2 ELISA kit according to the manufacturer's protocols.Statistical analysis
All experiments were performed three times. Statistical analysis was performed by using SPSS 20.0 (Statistical Package for Social Sciences Inc., Chicago, IL, USA) software. The results are expressed as mean ± standard deviation (SD). Phospholipid data were analyzed by using MetaboAnalyst 4.0 (https://www.metaboanalyst.ca/faces/ModuleView.xhtml) for Heatmap analysis and Partial Least Squares-Discriminant Analysis (PLS-DA). Data were analyzed by means of one-way ANOVA, and the differences between the groups were analyzed by Fisher's PLSD post-hoc test. A p-value <0.05 was considered to indicate statistical significance.Results
Effects of 9t18:1 and 11t18:1 on HUVECs viability
Effect of 9t18:1, 11t18:1, 9c18:1 and 11c18:1 on HUVECs viability is presented in Fig. 1. The results showed that both trans and cis fatty acids induced HUVEC injury in a dose-dependent manner, but at low concentrations, they had no significant effect on cell viability. At the concentration of 100 μM, TFAs (9t18:1 and 11t18:1) significantly decreased HUVEC viability (77.60% and 77.35%, respectively) compared to the control group, while cis fatty acids (9c18:1 and 11c18:1) did not induce cell injury. In addition, the damage by 9t18:1 to cell viability was obviously higher than that by 11t18:1 when the concentration was higher than 100 μM (p < 0.05).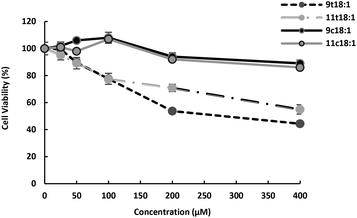 | ||
| Fig. 1 Effects of 9t18:1 and 11t18:1 on HUVEC viability. Data (mean ± SE) are expressed as percentage changes relative to the control. | ||
Effects of 9t18:1 and 11t18:1 on HUVEC membrane integrity, fluidity and permeability
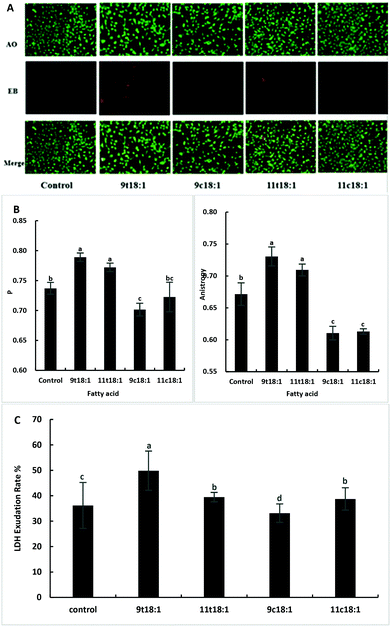
Acridine orange (AO) can enter the cell through the intact cell membrane, and then bind to double-stranded DNA and emit green fluorescence. Ethidium bromide (EB) can only pass through cell membrane damaged cells, and is then embedded in the nuclear DNA and emits orange-red fluorescence. Therefore, the AO-EB method can be used to detect cell membrane integrity. The greater the fluorescence polarization degree P and the anisotropy, the smaller the cell membrane fluidity. The LDH exudation rate can indicate the permeability of the cell membrane. When the cell membrane is damaged, LDH is released into the culture medium through the cell membrane. The exudation rate increases, indicating that the cell membrane is damaged and the permeability is improved. As shown in Fig. 2, TFAs not only increased the membrane integrity (Fig. 2A) but also reduced the membrane fluidity (Fig. 2B) compared to the cis fatty acid and control groups (p < 0.05). And the damage by 9t18:1 to membrane integrity was more pronounced than that by 11t18:1 (p < 0.05). In terms of membrane permeability, 9t18:1 increased LDH efflux most obviously, followed by 11t18:1 and 11c18:1, while 9c18:1 reduced LDH efflux (p < 0.05) (Fig. 2C).Bio-conversion of 9t18:1 and 11t18:1 in HUVECs
As expected, the content of individual fatty acid (9t18:1, 11t18:1, 9c18:1 and 11c18:1) was significantly increased (p < 0.05) in the respective treated group compared to the control group (Table 2). Compared with the control group, 9t18:1, 11t18:1 and 9c18:1 significantly decreased the saturated fatty acid (SFA) content (p < 0.05). 9t18:1 and 11t18:1 increased the contents of trans-monounsaturated fatty acids (trans-MUFA) and total fatty acids (p < 0.05). 9c18:1 also increased trans-MUFA (p < 0.05), but to a lower extent compared with the two TFAs. In addition, the transport rate across the HUVEC plasma membrane of TFAs (9t18:1, 32.55%; 11t18:1, 28.20%) in HUVECs was higher than that of cis fatty acids (9c18:1, 20.55%; 11c18:1, 16.59%). The β-oxidation conversion rates of 11t18:1 to 9t16:1, 9t18:1 to 7t16:1 and 11c18:1 to 9c16:1 were 22.17%, 14.85% and 4.65%, respectively. The β-oxidation conversion rate of 9c18:1 to 7c16:1 in HUVECs was not detected. Besides, only 11t18:1 underwent Δ9 desaturation and its conversion rate to CLA was 8.38%.| Fatty acid | Control | 9t18:1 | 11t18:1 | 9c18:1 | 11c18:1 |
|---|---|---|---|---|---|
| Values (mean ± SD) labelled with different letters indicate significant differences (p < 0.05). ND, not detected; CLA, conjugated linoleic acids; SFA, saturated fatty acids; MUFA, monounsaturated fatty acids; PUFA, polyunsaturated fatty acids. | |||||
| 8:0 | 0.12 ± 0.03b | 0.13 ± 0.04b | 0.02 ± 0.03a | 0.04 ± 0.02a | ND |
| 10:0 | 2.34 ± 1.86 | 0.14 ± 0.1 | 0.01 ± 0.02 | 2.41 ± 2.73 | ND |
| 12:0 | 6.53 ± 0.7b | 0.70 ± 0.34a | 0.44 ± 0.24a | 4.61 ± 3.95b | 0.29 ± 0.09a |
| 14:0 | 4.27 ± 0.50ab | 3.63 ± 0.17a | 4.01 ± 0.11ab | 3.35 ± 0.25a | 4.85 ± 0.96b |
| 16:0 | 65.06 ± 14.91b | 48.97 ± 5.36ab | 55.16 ± 2.32ab | 44.82 ± 3.28a | 62.2 ± 8.6ab |
| 17:0 | 1.25 ± 0.10ab | 1.41 ± 0.25ab | 1.63 ± 0.37b | 0.93 ± 0.02a | 1.52 ± 0.03ab |
| 18:0 | 35.6 ± 4.59b | 24.58 ± 0.15a | 26.94 ± 1.3a | 25.9 ± 0.61a | 32.2 ± 2.12b |
| 20:0 | 0.92 ± 0.19b | 0.8 ± 0.12ab | 0.93 ± 0.09b | 0.57 ± 0.18a | 0.62 ± 0.09ab |
| 22:0 | 0.69 ± 0.53a | 0.76 ± 0.05a | 1.5 ± 0.08b | 0.52 ± 0.11a | 0.89 ± 0.22a |
| 24:0 | 1.89 ± 0.00b | 1.55 ± 0.01b | 1.65 ± 0.1b | 1.15 ± 0.31a | 1.73 ± 0.02b |
| 9c15:1 | 1.12 ± 0.38 | 1.36 ± 0.19 | 1.4 ± 0.21 | 1.09 ± 0.00 | 1.41 ± 0.26 |
| 9c16:1 | 2.49 ± 0.95ab | 2.73 ± 0.32b | 2.99 ± 0.16b | 1.56 ± 0.04a | 5.38 ± 0.36c |
| 10c17:1 | 1.45 ± 0.27ab | 1.12 ± 0.15ab | 1.37 ± 0.15ab | 0.87 ± 0.21a | 1.56 ± 0.49b |
| 9c18:1 | 39.92 ± 4.57b | 31.2 ± 4.58ab | 31.13 ± 1.96ab | 100.22 ± 9.07c | 20.63 ± 2.59a |
| 11c18:1 | 7.79 ± 3.43a | 8.68 ± 0.34a | 8.98 ± 0.25a | 8.12 ± 1.22a | 67.1 ± 4.84b |
| 7t16:1 | ND | 14.85 ± 0.45 | ND | ND | ND |
| 9t16:1 | 1.46 ± 0.41a | ND | 20.82 ± 0.88b | 1.43 ± 0.37a | 1.49 ± 0.33a |
| 9t18:1 | 5.00 ± 2.76a | 90.18 ± 6.04b | ND | 4.56 ± 0.26a | 3.23 ± 0.84a |
| 11t18:1 | 7.62 ± 0.05a | ND | 68.28 ± 3b | 11.41 ± 1.09a | 8.45 ± 2.91a |
| 18:2n-6 | 8.13 ± 1.12 | 8.6 ± 0.61 | 7.79 ± 0.85 | 6.77 ± 2.27 | 6.26 ± 1.05 |
| 20:3n-6 | 1.76 ± 0.46abc | 1.98 ± 0.17c | 1.94 ± 0.11bc | 1.30 ± 0.04a | 1.41 ± 0.1ab |
| 20:4n-6 | 10.6 ± 3.8 | 11.27 ± 0.26 | 12.76 ± 0.38 | 9.47 ± 0.56 | 12.60 ± 1.06 |
| 22:4n-6 | 1.01 ± 0.08a | 1.05 ± 0.12ab | 1.25 ± 0.13abc | 1.35 ± 0.02bc | 1.57 ± 0.23b |
| 18:3n-3 | 1.96 ± 0.16 | 2.81 ± 0.74 | 2.58 ± 0.21 | 2.35 ± 0.49 | 2.4 ± 0.39 |
| 20:3n-3 | 1.45 ± 0.02b | 0.76 ± 0.18a | 0.63 ± 0.16a | 0.95 ± 0.15a | 0.68 ± 0.33a |
| 20:5n-3 | 2.53 ± 0.28c | 2.33 ± 0.09bc | 2.67 ± 0.24c | 1.21 ± 0.08a | 1.99 ± 0.03b |
| 22:3n-3 | 1.34 ± 0.11 | 1.33 ± 0.03 | 1.43 ± 0.25 | 1.3 ± 0.17 | 1.57 ± 0.5 |
| 22:5n-3 | 1.7 ± 0.39a | 2.23 ± 0.05ab | 2.51 ± 0.29b | 1.77 ± 0.11a | 2.65 ± 0.26b |
| 22:6n-3 | 4.75 ± 1.49 | 4.69 ± 0.55 | 5.53 ± 0.45 | 4.32 ± 0.38 | 4.9 ± 0.68 |
| CLA | ND | ND | 7.32 ± 2.01 | ND | ND |
| SFA | 118.68 ± 21.97b | 82.68 ± 5.63a | 92.28 ± 3.23a | 84.30 ± 2.31a | 104.29 ± 11.95ab |
| cis-MUFA | 52.76 ± 0.46a | 45.09 ± 5.2a | 45.88 ± 1.82a | 111.87 ± 10.46c | 96.09 ± 8.54b |
| trans-MUFA | 14.08 ± 2.39a | 105.03 ± 6.49d | 89.1 ± 3.88c | 30.79 ± 2.06b | 13.17 ± 4.08a |
| PUFA | 35.21 ± 5.32b | 37.06 ± 0.6b | 39.07 ± 0.98b | 17.4 ± 1.21a | 36.02 ± 4.63b |
| n-6PUFA | 21.49 ± 3.22ab | 22.91 ± 03ab | 23.74 ± 1.04b | 18.89 ± 1.69a | 21.84 ± 2.44ab |
| n-3PUFA | 13.72 ± 2.11ab | 14.15 ± 0.3ab | 15.34 ± 0.8b | 11.9 ± 0.37a | 14.18 ± 2.18ab |
| Total | 220 ± 25.36a | 269.86 ± 3.74b | 273.66 ± 9.21b | 244.36 ± 16.03ab | 249.57 ± 9.57ab |
| Transport rate | — | 32.55% | 28.20% | 20.55% | 16.59% |
| β-Oxidation rate | — | 14.16% | 22.17% | — | 4.65%a |
| Δ9 desaturation rate | — | — | 8.27% | — | — |
Effects of 9t18:1 and 11t18:1 on HUVEC membrane phospholipid profiles
The profiles of five phospholipid classes (phosphatidyl choline (PC), phosphatidyl ethanolamine (PE), phosphatidyl inositol (PI), phosphatidyl serine (PS) and phosphatidyl glycerol (PG)) and four lysophospholipids (LPC, LPE, LPS and LPI) in HUVECs induced by 9t18:1, 11t18:1, 9c18:1 and 11c18:1 are shown in Table 3. Among all the groups, the content of PC was the highest, accounting for 55.69–61.69% of total phospholipids, followed by PE (17.16–22.89%). LPC was the most abundant lysophospholipid, accounting for 3.44–5.12% of total phospholipids and 54.57–63.23% of total lysophospholipids. Compared with the control group, all fatty acids significantly decreased the content of PE and PS (p < 0.05), and increased the content of PI (p < 0.05). Moreover, when HUVECs were induced with 9t18:1 and 11t18:1, the PI content was increased significantly by 39.5% (9t18:1) and 36.38% (11t18:1), respectively, compared with the control group (p < 0.05). However, the content of PE and PS was significantly reduced compared with the control group (p < 0.05). PE was decreased by 18.89% (9t18:1) and 19.01% (11t18:1), respectively; PS was decreased by 49.27% (9t18:1) and 39.66% (11t18:1), respectively. In lysophospholipids, both 9t18:1 and 11t18:1 significantly increased LPC and LPI levels, while 11t18:1 had a stronger effect on increasing LPC levels and 9t18:1 had a stronger effect on increasing LPI levels (p < 0.05).| Phospholipids | Control | 9t18:1 | 11t18:1 | 9c18:1 | 11c18:1 |
|---|---|---|---|---|---|
| Values (mean ± SD) labelled with different letters indicate significant differences (p < 0.05). ND, not detected. LPC, lyso-phosphatidyl choline; LPE, lyso-phosphatidyl ethanolamine; LPI, lyso-phosphatidyl inositol; LPS, lyso-phosphatidyl serine; PC, phosphatidyl choline; PE, phosphatidyl ethanolamine; PI, phosphatidyl inositol; PS, phosphatidyl serine; PG, phosphatidyl glycerol. | |||||
| LPC | 5.07 ± 0.15c | 5.78 ± 0.58b | 7.29 ± 0.4a | 5.49 ± 0.46bc | 5.18 ± 0.7bc |
| LPE | 1.14 ± 0.11a | 1.26 ± 0.41a | 1.22 ± 0.06a | 1.49 ± 0.53ab | 1.71 ± 0.33a |
| LPI | 0.79 ± 0.06d | 2.37 ± 0.45a | 2.05 ± 0.21b | 1.95 ± 0.15b | 1.39 ± 0.27c |
| LPS | 1.05 ± 0.06a | 1.08 ± 0.19a | 0.97 ± 0.09a | 1.13 ± 0.33a | 1.16 ± 0.25a |
| PC | 84.09 ± 0.67b | 85.65 ± 4.34b | 80.75 ± 6.52b | 79.98 ± 3.09b | 91.11 ± 5.14a |
| PE | 33.72 ± 1.76a | 27.35 ± 4.24b | 27.31 ± 2.55b | 28.74 ± 2.13b | 25.35 ± 2.83b |
| PI | 12.48 ± 0.68a | 17.41 ± 1.87b | 17.02 ± 2.76b | 17.53 ± 0.81b | 17.59 ± 1.15b |
| PS | 8.95 ± 0.64a | 4.54 ± 0.81c | 5.4 ± 0.85c | 7.3 ± 2.24b | 4.19 ± 0.2c |
| PG | ND | 0.34 ± 0.02 | 0.32 ± 0.03 | ND | ND |
| Total | 147.29 ± 3.44a | 145.79 ± 20.31a | 142.34 ± 24.16a | 143.61 ± 7.66a | 147.68 ± 10.34a |
The details of accurate phospholipid changes are shown in the heatmap in Fig. 3. It shows that the changes in the phospholipid content in the cells treated with two TFAs are roughly similar, and the changes in the cells treated with two cis fatty acids are similar. In addition, the changes in the phospholipid content of the cis fatty acid group were more similar to those of the control group compared to that in the TFA group.
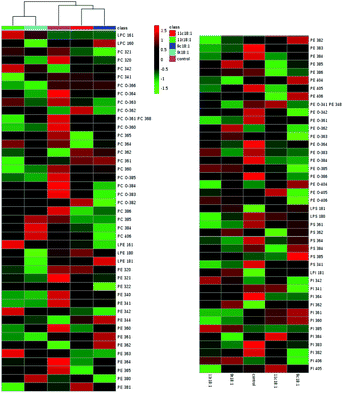 | ||
| Fig. 3 Heatmap of membrane phospholipids in HUVECs induced by 9t18:1, 11t18:1, 9c18:1 and 11c18:1. The red and green squares represented an increase and a decrease of the content, respectively. | ||
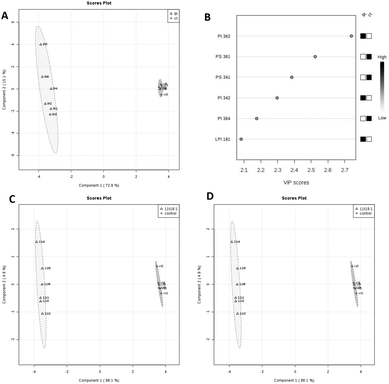
PLS-DA analysis of the effects of 9t18:1 and 11t18:1 on membrane phospholipids in HUVECs is shown in Fig. 4. When HUVECs were induced with 9t18:1, the change in the PI content was the most obvious (p < 0.05), and PI36:2 was the most contributing phospholipid (p < 0.05). Compared with the control group, the contents of PI36:2, PI34:2 and LPI18:1 increased significantly, and the content of PI36:4 decreased significantly (p < 0.05) (Fig. 4A and B). When HUVECs were induced with 11t18:1, the change in the PC content was the most obvious (p < 0.05), and PC34:1 was the most contributing phospholipid. Compared with the control group, the content of PC34:1 decreased significantly, and the contents of PC34:2 and LPC16:1 increased significantly (p < 0.05) (Fig. 4C and D).
Effects of 9t18:1 and 11t18:1 on the expression of PLA2 of HUVECs
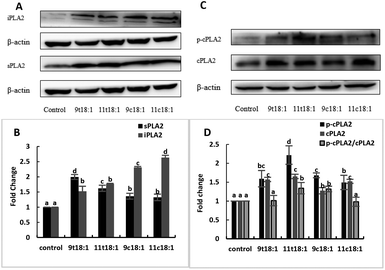
Effects of cis and trans fatty acids on the expression of phospholipases in HUVECs are shown in Fig. 5. The expressions of sPLA2, iPLA2, cPLA2 and cPLA2 phosphorylation (p-cPLA2) were significantly increased in HUVECs after treatment with both trans and cis fatty acids. 9t18:1 and 11t18:1 increased sPLA2 expression more obviously than their cis isomers (p < 0.05), while 9c18:1 and 11c18:1 preferred to activate intracellular iPLA2 expression over TFAs (p < 0.05) (Fig. 5A and B). We also observed that 9t18:1 was more likely to activate sPLA2 than 11t18:1 (p < 0.05), and 11t18:1 was more likely to activate p-cPLA2 than 9t18:1 (p < 0.05).Effects of 9t18:1 and 11t18:1 on the expression of inflammatory cytokines in HUVECs
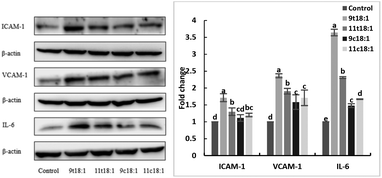
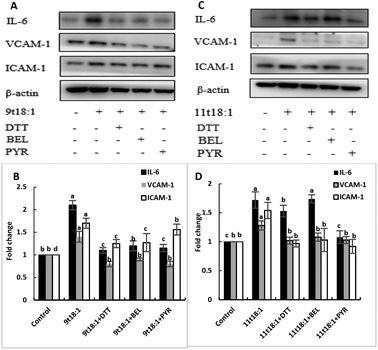
The expression of inflammatory cytokines (ICAM-1, VCAM-1 and IL-6) in HUVECs induced by fatty acids is shown in Fig. 6. The results showed both trans and cis fatty acids significantly increased the expression of ICAM-1, VCAM-1 and IL-6 in HUVECs compared with the control group (p < 0.05), while the effect of TFAs was more obvious than cis fatty acids (p < 0.05). And 9t18:1 enhanced the expression more significantly than 11t18:1 (p < 0.05).Effects of 9t18:1 and 11t18:1 on the secretion of PGE2 in HUVECs
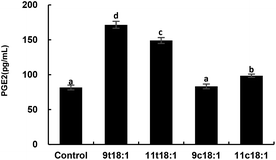
Fig. 7 shows the effects of cis and trans fatty acids on the secretion of PGE2 in HUVECs. Compared with the control group, 9t18:1 and 11t18:1 significantly increased the secretion of PGE2 from 82 pg mL−1 (control group) to 171 pg mL−1 (9t18:1) and 149 pg mL−1 (11t18:1), respectively (p < 0.05). Compared with the control group, PGE2 secretion was significantly increased (p < 0.05) by 108.54% (9t18:1) and 81.72% (11t18:1), respectively, when HUVECs were induced with 9t18:1 and 11t18:1. After treatment with 11c18:1, PGE2 secretion was also increased by 20.73%, but there was no significant difference compared with the control group. 11c18:1 also significantly increased PGE2 secretion from 82 to 99 pg mL−1 (p < 0.05), while 9c18:1 had no significant effect.Effects of 9t18:1 and 11t18:1 on PLA2 in regulating inflammation in HUVECs
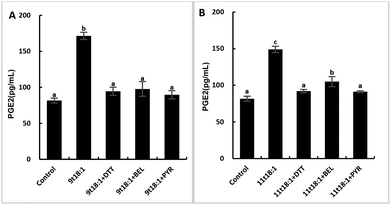
The role of PLA2 in the regulation of inflammation was studied by using three PLA2 inhibitors (PYR, BEL and DTT). Fig. 8 and 9 show the effects of 9t18:1 and 11t18:1 on PLA2 in regulating inflammatory cytokine expression and PGE2 secretion in HUVECs. The protein expression of ICAM-1, VCAM-1 and IL-6 and the secretion of PGE2 were significantly increased in HUVECs induced by 9t18:1 and 11t18:1 (p < 0.05). When pretreated with three PLA2 inhibitors for 1 h and then treated with 9t18:1 and 11t18:1 for 24 h, the expression of ICAM-1 and VCAM-1 decreased significantly compared with the inhibitor-free group (p < 0.05), and the expression of IL-6 also decreased significantly (p < 0.05) except for the 11t18:1 + BEL group (Fig. 8). In addition, the secretion of PGE2 decreased significantly compared to that incubated with 9t18:1 and 11t18:1 alone (p < 0.05) (Fig. 9).Effects of 9t18:1 and 11t18:1 on the regulation of PLA2 expression in HUVECs by the MAPK pathway
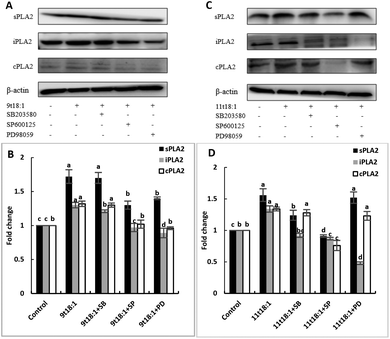
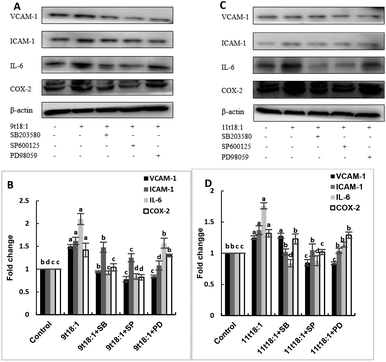
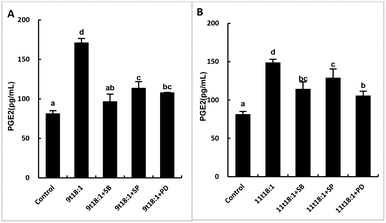
The role of the MAPK pathway in the regulation of PLA2 expression was studied by using three MAPK pathway inhibitors (SB20358, SP600125 and PD98059). Effects of 9t18:1 and 11t18:1 on the regulation of PLA2 expression by the MAPK pathway are shown in Fig. 10. Compared with the control group, the expression of cPLA2, iPLA2, and sPLA2 was significantly increased (p < 0.05) after treatment with 9t18:1 and 11t18:1. When HUVECs were pretreated with MAPK inhibitors for 1 h and then incubated with 9t18:1 and 11t18:1 for 24 h, the expression of cPLA2, iPLA2, and sPLA2 was significantly reduced compared to that when incubated with 9t18:1 and 11t18:1 alone (p < 0.05). Besides, the expression of sPLA2 was most significantly decreased in HUVECs induced by the JNK inhibitor (p < 0.05) and the expression of iPLA2 decreased most significantly after pretreatment of HUVECs with the ERK inhibitor. In the 9t18:1 group, the expression of cPLA2 was affected by both JNK and ERK inhibitors, whereas in the 11t18:1 group, cPLA2 expression was most significantly affected by the JNK inhibitor (p < 0.05).Effects of 9t18:1 and 11t18:1 on the regulation of inflammatory cytokine expression by the MAPK pathway are presented in Fig. 11. The expression of cPLA2, iPLA2 and sPLA2 in the cells pretreated with MAPK inhibitors and then incubated with 9t18:1 and 11t18:1 was significantly lower than that incubated with 9t18:1 and 11t18:1 alone (p < 0.05) except for the 11t18:1 + SB group. In addition, the expression of most inflammatory cytokines in HUVECs was lower after treatment with JNK inhibitors than that after treatment with the other two inhibitors. Fig. 12 shows the effects of 9t18:1 and 11t18:1 on the regulation of PGE2 secretion by the MAPK pathway. When the cells were pretreated with MAPK inhibitors and then incubated with 9t18:1 and 11t18:1, the secretion of PGE2 was significantly decreased compared to that incubated with 9t18:1 and 11t18:1 alone (p < 0.05).
Discussion
Effects of 9t18:1 and 11t18:1 on HUVEC function and their bioconversion in HUVECs
The present results showed that both 9t18:1 and 11t18:1 reduced cell viability (Fig. 1), induced cell membrane damage including reduced membrane integrity and fluidity, and increased membrane permeability (Fig. 2). In addition, the damage by 9t18:1 to HUVECs was significantly stronger than that by 11t18:1 (p < 0.05). HUVECs had different transport rates on different fatty acids. The transport rates of the two TFAs (9t18:1 and 11t18:1) in HUVECs were higher than those of their corresponding cis fatty acids (9c18:1 and 11c18:1). Meanwhile, the transport rate of 9t18:1 was higher than that of 11t18:1 (Table 2). The difference in the transport rates of different fatty acids may be due to their different degrees of damage to the cell membrane. TFAs caused greater damage to cell membranes (including cell membrane integrity, fluidity and permeability) than cis fatty acids, causing cell membranes to be more sensitive to TFA diffusion and thus have a higher transport rate. Some studies17,18 reported that trans fatty acids and cis fatty acids were transported into endothelial cells with different receptors (9t18:1 and 11t18:1 via TLR4 and FAS1, 9c18:1 and 11c18:1 via TNFR1) which may be another reason for their different transport rates. In addition, 9t18:1, 11t18:1 and 11c18:1 underwent β-oxidation in HUVECs and were converted to their corresponding hexadecenoic acid (7t16:1, 9t16:1 and 9c16:1, respectively). But our present study showed that only 11t18:1 underwent Δ9 desaturation in HUVECs (Table 2). Under the catalysis of SCD-1, 11t18:1 was converted to 9c11t-CLA by Δ9 desaturation.9t16:1 was considered to be a beneficial fatty acid that could lower blood lipids, increase high-density lipoprotein cholesterol, lower triglyceride levels, reduce insulin resistance, and reduce the incidence of diabetes.19 Conjugated linoleic acid (CLA) is an octadecadienoic acid containing a cis- or trans-conjugated double bond. 9c11t-CLA and 10t12c-CLA are the most common CLAs, of which 9c11t-CLA is most widely present in humans and animals and is named rumenic acid.20 9c11t-CLA has many beneficial effects in the prevention of atherosclerosis, different types of cancer, and hypertension and is also known to improve immune function.21 We concluded that the difference in the transport rate, β-oxidation conversion rate and Δ9 desaturation reaction of 9t18:1 and 11t18:1 may be the reason for their different effects on HUVEC function.
Effects of 9t18:1 and 11t18:1 on phospholipids in HUVECs
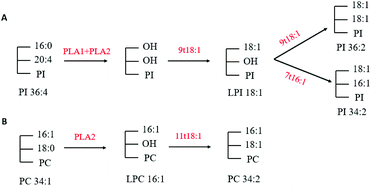
The phospholipidomic data of HUVECs were measured by a shotgun-MS method and a LC-MS method. Our present study has detected a total of five phospholipids (PC, PE, PI, PS and PG) and four lysophospholipids (LPC, LPE, LPI and LPS) (Table 3). Compared with the control group, 9t18:1 and 11t18:1 significantly increased the PI, LPC and LPI content and reduced the PE and PS content (p < 0.05). It can be seen that the transformation occurred between the phospholipid components in the HUVECs induced by 9t18:1 and 11t18:1. Related studies reported that PS synthase and PI synthase competed for substrate CDP-DAG to synthesize PS and PI, respectively.22 We suspected that 9t18:1 and 11t18:1 inhibited intracellular PS synthase activity or activated PI synthase activity and resulted in decreased PS content and increased PI content.Through multivariate statistical analysis, our present study found that 9t18:1 and 11t18:1 had different effects on cellular phospholipid biosynthesis. Therefore, we analyzed several phospholipids that contributed the most to this difference. After treatment with 9t18:1, the content of PI36:2, PI34:2 and LPI18:1 increased while the content of PI36:4 decreased (Fig. 4B). After treatment with 11t18:1, the content of PC34:1 decreased, while the content of PC34:2 and LPC16:1 increased (Fig. 4D). Since PLA1 and PLA2 could respectively hydrolyze acyl bonds on sn-1 and sn-2 in phospholipids, we hypothesized the potential metabolic mechanisms of some important phospholipids in HUVECs induced by 9t18:1 and 11t18:1, as shown in Fig. 13. As shown in Fig. 13A, we speculated that not only 9t18:1, but also the 9t18:1 oxidation product 7t16:1 was involved in the biotransformation of LPI16:1. A lot of studies have reported that 9t16:1 (the β-oxidation product of 11t18:1) has many important physiological functions, such as lowering blood lipids, increasing high-density lipoprotein cholesterol and reducing insulin resistance. However, few articles have reported on 7t16:1 (the β-oxidation product of 9t18:1). We suspected that it may be associated with inflammation and lipid metabolism disorders, a topic which may need further research. As shown in Fig. 13B, we speculated that 11t18:1 activated PLA2 to hydrolyze PC34:1, thereby liberating AA and LPC16:1, resulting in PC34:2. Some previous studies have shown that the changes in cell membrane phospholipids led to many physiological diseases. For example, Graessler et al.23 reported that the levels of phospholipids such as PC-O and PE-O containing 20:4 and 20:5 were significantly decreased in the plasma of hypertensive patients. Sewell et al.24 found that PI34:1 (16:0/18:1) levels were significantly reduced in the macrophages of patients with Crohn's disease (a malignant digestive disorder) compared with healthy people. So, the characteristics of 9t18:1 and 11t18:1 replacing different fatty acids at the acyl position on phospholipids may be one of the reasons for their different effects on HUVECs function.
Effects of 9t18:1 and 11t18:1 on PLA2 in HUVECs
PLA2 is a class of enzymes that selectively cleave ester bonds at the sn-2 site of the phosphoglycerin moiety, and it is widely distributed in the biological world. PLA2 hydrolyzes phospholipids and liberates free fatty acids, mostly AA and lysophospholipids. LPC, also known as lysolecithin, is one of the lysophospholipids which induce vasoconstriction and cause endothelial dysfunction.11 Eizawa et al.25 demonstrated that LPC could inhibit endothelium-dependent hyperpolarization and indomethacin-resistant endothelium-dependent relaxation in the porcine coronary artery. In addition, Yang et al.26 reported that H2O2 treatment induced phosphorylation of cPLA2 via the activation of ERK, increasing the production of LPE and LPC in human endothelial cells. Many studies showed that the activity of cPLA2 could be enhanced in inflammatory cells,27–29 while in non-inflammatory cells, cPLA2 could be activated by TNF-α, IL-1β, IL-6, PMA, LPS, histamine and thrombin.30–32 In addition, cPLA2 has multiple phosphate sites that could be activated by the MAPK pathway and PKC pathway.33,34 Our present study found that the protein expressions of sPLA2, cPLA2, iPLA2, and p-cPLA2 were all significantly increased in HUVECs induced by 9t18:1 and 11t18:1 (p < 0.05) (Fig. 5). The expression of ICAM-1, VCAM-1 and IL-6 was also significantly increased and the effect of 9t18:1 was significantly higher than that of 11t18:1 (p < 0.05) (Fig. 6). In addition, the secretion of PGE2 (a down-stream product of PLA2) in the HUVEC supernatant was significantly increased, and the effect of 9t18:1 was significantly higher than that of 11t18:1 (p < 0.05) (Fig. 7). However, after HUVECs were pretreated with three PLA2 inhibitors (PYR, BEL and DTT), the expression of intracellular inflammatory cytokines (ICAM-1, VCAM-1, IL-6) and the secretion of PGE2 were significantly decreased (Fig. 8 and 9). Taken together, our present study showed that PLA2 was involved in TFA-induced HUVECs pro-inflammatory responses.MAPK pathway involved in 9t18:1 and 11t18:1 induced inflammation of HUVECs
The MAPK pathway is mainly composed of JNK, ERK and p38 in mammals. As a member of the MAPK family, ERK transmitted signals from many extracellular agents to regulate cellular processes, such as proliferation, differentiation and cell cycle progression.35 Recent studies revealed that ERK also promotes inflammation-associated cancer development, mainly by regulating the expression of inflammatory cytokines. JNK is a critical mediator of signal transduction, and many JNK downstream genes regulate the expression and activation of inflammatory mediators, including TNFα, IL-2, E-selectin and matrix metalloproteinases.36,37 The role of JNK in inflammation has been revealed in a T cell-mediated and TNFα-dependent concanavalin A mouse model for acute hepatitis. p38 is a pivotal kinase in inflammatory diseases, such as rheumatoid arthritis, psoriasis, and inflammatory bowel disease.38,39 Our previous study found that 9t18:1 and 11t18:1 would significantly increase the phosphorylation levels of p38, ERK and JNK to induce apoptosis and promote inflammatory responses.17 On this basis, we pretreated the cells with p38, ERK, and JNK inhibitors for 1 h, and then induced the cells with 9t18:1 and 11t18:1 for 24 h. The results showed the MAPK signaling pathway was involved in the protein expression of PLA2 (Fig. 10) and inflammatory cytokines (Fig. 11), and the secretion of PGE2 (Fig. 12) in 9t18:1 and 11t18:1 induced HUVECs. Our present study also found that the MAPK pathway regulated COX-2 expression in 9t18:1 and 11t18:1 induced HUVECs (Fig. 11).COX-2, also known as prostaglandin synthetase, is a key rate-limiting enzyme that catalyzes the synthesis of PGE2 from AA. When PLA2 was stimulated, it would hydrolyze membrane PL to produce free AA, which would be further converted to PGE2 under the catalysis of COX-2.40 Studies have reported that PGE2 is involved in the regulation of both pro-inflammatory and anti-inflammatory effects through its receptors.41,42 Some experiments suggested that the MAPK pathway regulated the expression of PLA2 to alter the production of PC and LPC in endothelial cells.26,43 In addition, some cell experiments44–46 have shown that the expression of inflammatory factors (ICAM-1, VCAM-1, and IL-6) was regulated by PLA2 via the NF-kB transcription factor, and some studies17,18 have found that TFAs could activate the MAPK pathway (JNK, ERK and p38) through the TLR4 receptor and the death receptor FAS/Fas1 cells to induce apoptosis and promote inflammation. Our present study has found that TFAs could activate the MAPK pathway phosphorylation to regulate the expression of PLA2, thereby promoting inflammation. Therefore, our present study speculated an inflammatory pathway in TFA (9t18:1 and 11t18:1) induced HUVECs, as shown in Fig. 14. First, 9t18:1 and 11t18:1 activated the MAPK pathway via the TLR4 receptor and the death receptor FAS/Fas1 to regulate the expression of PLA2. Then, PLA2 not only hydrolyzed membrane phospholipids to liberate AA which was further converted to PGE2 under the catalysis of COX-2, but also activated NF-kB to increase the expression of inflammatory cytokines (ICAM-1, VCAM-1 and IL-6).
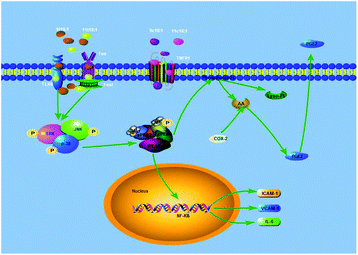 | ||
| Fig. 14 Potential molecular mechanism involved in 9t18:1 and 11t18:1 induced inflammation in HUVECs. | ||
Conclusion
Overall, our present study found that both 9t18:1 and 11t18:1 reduced HUVEC viability, induced cell membrane damage including reduced membrane integrity and fluidity, and increased membrane permeability. However, the damage by 9t18:1 to HUVECs was significantly stronger than that by 11t18:1. In addition, 9t18:1 and 11t18:1 had different effects on phospholipid composition in HUVECs. Both 9t18:1 and 11t18:1 significantly increased the protein expression of PLA2 (sPLA2, iPLA2, cPLA2) in HUVECs; however, 9t18:1 was more likely to activate sPLA2 and 11t18:1 was more likely to activate p-cPLA2. Moreover, the MAPK pathway (p38, JNK and ERK) regulated the expression of PLA2, inflammatory cytokines and COX-2, and secretion of PGE2 in HUVECs induced by 9t18:1 and 11t18:1. In conclusion, 9t18:1 and 11t18:1 activated the MAPK pathway which regulated the expression of PLA2 to cause inflammation.Conflicts of interest
There are no conflicts to declare.Acknowledgements
The authors acknowledge the financial support received from the National Natural Foundation of China (31660447), the Jiangxi Outstanding Youth Talent Project (20171BCB23024), the Chinese Nutrition Association Yihai Kerry Nutrition and Safety Research Foundation (CNS-W2018A40) and the Natural Science Foundation for Youth of Jiangxi Province (20181BAB215034). And we are grateful to the Research Project of State Key Laboratory of Food Science and Technology, Nanchang University (Project No. SKLF-ZZB-201923) for financial support.References
- S. M. Innis, Trans fatty intakes during pregnancy, infancy and early childhood, Atheroscler. Suppl., 2006, 7, 17–20 CrossRef CAS PubMed
.
- D. Mozaffarian and R. Clarke, Quantitative effects on cardiovascular risk factors and coronary heart disease risk of replacing partially hydrogenated vegetable oils with other fats and oils, Eur. J. Clin. Nutr., 2009, 63(Suppl 2), S22–S33 CrossRef CAS
.
- Y. Wang, M. M. Jacome-Sosa and S. D. Proctor, The role of ruminant trans fat as a potential nutraceutical in the prevention of cardiovascular disease, Food Res. Int., 2012, 46, 460–468 CrossRef CAS
.
- W. C. Willett, M. J. Stampfer, J. E. Manson, G. A. Colditz, F. E. Speizer, B. A. Rosner, L. A. Sampson and C. H. Hennekens, Intake of Trans-Fatty-Acids and Risk of Coronary Heart-Disease among Women, Lancet, 1993, 341, 581–585 CrossRef CAS
.
- M. U. Jakobsen, K. Overvad, J. Dyerberg and B. L. Heitmann, Intake of ruminant trans fatty acids and risk of coronary heart disease, Int. J. Epidemiol., 2008, 37, 173–182 CrossRef PubMed
.
- C. Bolton-Smith, M. Woodward, S. Fenton and C. A. Brown, Does dietary trans fatty acid intake relate to the prevalence of coronary heart disease in Scotland?, Eur. Heart J., 1996, 17, 837–845 CrossRef CAS PubMed
.
- K. A. Harvey, C. L. Walker, Z. Xu, P. Whitley and R. A. Siddiqui, Trans fatty acids: induction of a pro-inflammatory phenotype in endothelial cells, Lipids, 2012, 47, 647–657 CrossRef CAS PubMed
.
- S. L. Niu, D. C. Mitchell and B. J. Litman, Trans fatty acid derived phospholipids show increased membrane cholesterol and reduced receptor activation as compared to their cis analogs, Biochemistry, 2005, 44, 4458–4465 CrossRef CAS PubMed
.
- F. A. Kummerow, Q. Zhou, M. M. Mahfouz, M. R. Smiricky, C. M. Grieshop and D. J. Schaeffer, Trans fatty acids in hydrogenated fat inhibited the synthesis of the polyunsaturated fatty acids in the phospholipid of arterial cells, Life Sci., 2004, 74, 2707–2723 CrossRef CAS PubMed
.
- D. Mozaffarian, M. B. Katan, A. Ascherio, M. J. Stampfer and W. C. Willett, Trans fatty acids and cardiovascular disease, N. Engl. J. Med., 2006, 354, 1601–1613 CrossRef CAS PubMed
.
- S. Y. Liu, X. Lu, S. Choy, T. C. Dembinski, G. M. Hatch, D. Mymin, X. Shen, A. Angel, P. C. Choy and R. Y. K. Man, Alteration of Lysophosphatidylcholine Content in Low-Density-Lipoprotein after Oxidative Modification - Relationship to Endothelium-Dependent Relaxation, Cardiovasc. Res., 1994, 28, 1476–1481 CrossRef CAS PubMed
.
- T. Thalhamer, M. A. McGrath and M. M. Harnett, MAPKs and their relevance to arthritis and inflammation, Rheumatology, 2008, 47, 409–414 CrossRef CAS PubMed
.
- C. D. Anfuso, C. Motta, G. Giurdanella, V. Arena, M. Alberghina and G. Lupo, Endothelial PKCalpha-MAPK/ERK-phospholipase A2 pathway activation as a response of glioma in a triple culture model. A new role for pericytes?, Biochimie, 2014, 99, 77–87 CrossRef CAS PubMed
.
- I. T. Lee, C. C. Lin, S. E. Cheng, L. D. Hsiao, Y. C. Hsiao and C. M. Yang, TNF-alpha induces cytosolic phospholipase A2 expression in human lung epithelial cells via JNK1/2- and p38 MAPK-dependent AP-1 activation, PLoS One, 2013, 8, e72783 CrossRef CAS PubMed
.
- J. Folch, M. Lees and G. H. Sloane-Stanley, A simple method for the isolation and purification of total lipides from animal tissues, J. Biol. Chem., 1957, 226, 497–509 CAS
.
- R. Wan, Y. Liu, L. Li, C. Zhu, L. Jin and S. Li, Urocortin increased endothelial ICAM1 by cPLA2-dependent NF-kappaB and PKA pathways in HUVECs, J. Mol. Endocrinol., 2014, 52, 43–53 CAS
.
- J. Li, S. B. Hu, Y. M. He, C. F. Zhuo, R. L. Zhou, F. Chen, H. Y. Li and Z. Y. Deng, 9c11tCLA modulates 11t18:1 and 9t18:1 induced inflammations differently in human umbilical vein endothelial cells, Sci. Rep., 2018, 8, 1535–1546 CrossRef PubMed
.
- H. Rao, L. X. Ma, T. T. Xu, J. Li, Z. Y. Deng, Y. W. Fan and H. Y. Li, Lipid Rafts and Fas/FasL Pathway May Involve in Elaidic Acid-Induced Apoptosis of Human Umbilical Vein Endothelial Cells, J. Agric. Food Chem., 2014, 62, 798–807 CrossRef CAS PubMed
.
- D. Mozaffarian, M. C. D. Otto, R. N. Lemaitre, A. M. Fretts, G. Hotamisligil, M. Y. Tsai, D. S. Siscovick and J. A. Nettleton, trans-Palmitoleic acid, other dairy fat biomarkers, and incident diabetes: the Multi-Ethnic Study of Atherosclerosis (MESA), Am. J. Clin. Nutr., 2013, 97, 854–861 CrossRef CAS PubMed
.
- M. W. Pariza, Y. Park and M. E. Cook, The biologically active isomers of conjugated linoleic acid, Prog. Lipid Res., 2001, 40, 283–298 CrossRef CAS PubMed
.
- A. Bhattacharya, J. Banu, M. Rahman, J. Causey and G. Fernandes, Biological effects of conjugated linoleic acids in health and disease, J. Nutr. Biochem., 2006, 17, 789–810 CrossRef CAS PubMed
.
- M. J. Kelley, A. M. Bailis, S. A. Henry and G. M. Carman, Regulation of Phospholipid Biosynthesis in Saccharomyces-Cerevisiae by Inositol - Inositol Is an Inhibitor of Phosphatidylserine Synthase Activity, J. Biol. Chem., 1988, 263, 18078–18085 CAS
.
- J. Graessler, D. Schwudke, P. E. Schwarz, R. Herzog, A. Shevchenko and S. R. Bornstein, Top-down lipidomics reveals ether lipid deficiency in blood plasma of hypertensive patients, PLoS One, 2009, 4, e6261 CrossRef PubMed
.
- G. W. Sewell, Y. A. Hannun, X. Han, G. Koster, J. Bielawski, V. Goss, P. J. Smith, F. Z. Rahman, R. Vega, S. L. Bloom, A. P. Walker, A. D. Postle and A. W. Segal, Lipidomic profiling in Crohn's disease: abnormalities in phosphatidylinositols, with preservation of ceramide, phosphatidylcholine and phosphatidylserine composition, Int. J. Biochem. Cell Biol., 2012, 44, 1839–1846 CrossRef CAS PubMed
.
- H. Eizawa, Y. Yui, R. Inoue, K. Kosuga, R. Hattori, T. Aoyama and S. Sasayama, Lysophosphatidylcholine Inhibits Endothelium-Dependent Hyperpolarization and N-Omega-Nitro-L-Arginine/Indomethacin-Resistant Endothelium-Dependent Relaxation in the Porcine Coronary-Artery, Circulation, 1995, 92, 3520–3526 CrossRef CAS PubMed
.
- J. Yang, S. Yang, X. Gao and Y. J. Yuan, Integrative investigation of lipidome and signal pathways in human endothelial cells under oxidative stress, Mol. BioSyst., 2011, 7, 2428–2440 RSC
.
- E. A. Capper and L. A. Marshall, Mammalian phospholipases A(2): mediators of inflammation, proliferation and apoptosis, Prog. Lipid Res., 2001, 40, 167–197 CrossRef CAS PubMed
.
- J. Balsinde, M. A. Balboa, P. A. Insel and E. A. Dennis, Regulation and inhibition of phospholipase A2, Annu. Rev. Pharmacol. Toxicol., 1999, 39, 175–189 CrossRef CAS PubMed
.
- A. B. Mukherjee, L. Miele and N. Pattabiraman, Phospholipase A2 enzymes: regulation and physiological role, Biochem. Pharmacol., 1994, 48, 1–10 CrossRef CAS PubMed
.
- S. Akiba, R. Hatazawa, K. Ono, K. Kitatani, M. Hayama and T. Sato, Secretory phospholipase A2 mediates cooperative prostaglandin generation by growth factor and cytokine independently of preceding cytosolic phospholipase A2 expression in rat gastric epithelial cells, J. Biol. Chem., 2001, 276, 21854–21862 CrossRef CAS PubMed
.
- I. J. Gudmundsdottir, H. Halldorsson, K. Magnusdottir and G. Thorgeirsson, Involvement of MAP kinases in the control of cPLA(2) and arachidonic acid release in endothelial cells, Atherosclerosis, 2001, 156, 81–90 CrossRef CAS PubMed
.
- R. Newton, L. M. Kuitert, D. M. Slater, I. M. Adcock and P. J. Barnes, Cytokine induction of cytosolic phospholipase A2 and cyclooxygenase-2 mRNA is suppressed by glucocorticoids in human epithelial cells, Life Sci., 1997, 60, 67–78 CrossRef CAS PubMed
.
- M. M. Muthalif, Y. Hefner, S. Canaan, J. Harper, H. Zhou, J. H. Parmentier, R. Aebersold, M. H. Gelb and K. U. Malik, Functional interaction of calcium-/calmodulin-dependent protein kinase II and cytosolic phospholipase A(2), J. Biol. Chem., 2001, 276, 39653–39660 CrossRef CAS PubMed
.
- L. L. Lin, M. Wartmann, A. Y. Lin, J. L. Knopf, A. Seth and R. J. Davis, Cpla2 Is Phosphorylated and Activated by Map Kinase, Cell, 1993, 72, 269–278 CrossRef CAS PubMed
.
- S. R. Twigg, E. Vorgia, S. J. McGowan, I. Peraki, A. L. Fenwick, V. P. Sharma, M. Allegra, A. Zaragkoulias, E. Sadighi-Akha, S. J. Knight, H. Lord, T. Lester, L. Izatt, A. K. Lampe, S. N. Mohammed, F. J. Stewart, A. Verloes, L. C. Wilson, C. Healy, P. T. Sharpe, P. Hammond, J. Hughes, S. Taylor, D. Johnson, S. A. Wall, G. Mavrothalassitis and A. O. Wilkie, Reduced dosage of ERF causes complex craniosynostosis in humans and mice and links ERK1/2 signaling to regulation of osteogenesis, Nat. Genet., 2013, 45, 308–313 CrossRef CAS PubMed
.
- A. M. Manning and R. J. Davis, Targeting JNK for therapeutic benefit: From JuNK to gold?, Nat. Rev. Drug Discovery, 2003, 2, 554–565 CrossRef CAS PubMed
.
- M. Rincon and R. J. Davis, Regulation of the immune response by stress-activated protein kinases, Immunol. Rev., 2009, 228, 212–224 CrossRef CAS PubMed
.
- T. Zarubin and J. H. Han, Activation and signaling of the p38 MAP kinase pathway, Cell Res., 2005, 15, 11–18 CrossRef CAS PubMed
.
- E. F. Wagner and A. R. Nebreda, Signal integration by JNK and p38 MAPK pathways in cancer development, Nat. Rev. Cancer, 2009, 9, 537–549 CrossRef CAS PubMed
.
- F. A. Kuehl Jr. and R. W. Egan, Prostaglandins, arachidonic acid, and inflammation, Science, 1980, 210, 978–984 CrossRef CAS PubMed
.
- S. Biswas, P. Bhattacherjee, C. A. Paterson, S. L. Tilley and B. H. Koller, Ocular inflammatory responses in the EP2 and EP4 receptor knockout mice, Ocul. Immunol. Inflammation, 2006, 14, 157–163 CrossRef CAS PubMed
.
- K. Yuhki, A. Ueno, H. Naraba, F. Kojima, F. Ushikubi, S. Narumiya and S. Oh-Ishi, Prostaglandin receptors EP2, EP3, and IP mediate exudate formation in carrageenin-induced mouse pleurisy, J. Pharmacol. Exp. Ther., 2004, 311, 1218–1224 CrossRef CAS PubMed
.
- J. Yang, S. Yang and Y. J. Yuan, Integrated investigation of lipidome and related signaling pathways uncovers molecular mechanisms of tetramethylpyrazine and butylidenephthalide protecting endothelial cells under oxidative stress, Mol. BioSyst., 2012, 8, 1789–1797 RSC
.
- T. Sen, N. Sen, M. G. Noordhuis, R. Ravi, T. C. Wu, P. K. Ha, D. Sidransky and M. O. Hoque, OGDHL is a modifier of AKT-dependent signaling and NF-kappaB function, PLoS One, 2012, 7, e48770 CrossRef CAS
.
- H. T. Yu, W. Jiang, H. Du, Y. Xing, G. Z. Bai, Y. Zhang, Y. Li, H. Jiang, Y. Zhang, J. P. Wang, P. Z. Wang and X. F. Bai, Involvement of the Akt/NF-kappa B Pathways in the HTNV-Mediated Increase of IL-6, CCL5, ICAM-1, and VCAM-1 in HUVECs, PLoS One, 2014, 9, e93810 CrossRef
.
- N. Hadad, L. Tuval, V. Elgazar-Carmom, R. Levy and R. Levy, Endothelial ICAM-1 protein induction is regulated by cytosolic phospholipase A2alpha via both NF-kappaB and CREB transcription factors, J. Immunol., 2011, 186, 1816–1827 CrossRef CAS
.
Footnote |
| † These authors are considered as co-first authors. |
| This journal is © The Royal Society of Chemistry 2020 |

