
Nitrogen doped graphene quantum dot-decorated earth-abundant nanotubes for enhanced capacitive deionization†
Akhilesh Babu
Ganganboina
 and
Ruey-An
Doong
*
and
Ruey-An
Doong
*
Department of Biomedical Engineering and Environmental Sciences, National Tsing Hua University, 101, Sec. 2, Kuang Fu Road, Hsinchu, 30013, Taiwan. E-mail: radoong@mx.nthu.edu.tw; Fax: +886 3 5718649; Tel: +886 3 5726785
First published on 18th November 2019
Abstract
The combination of capacitive carbon nanomaterials with metal oxides as electrode materials for capacitive deionization (CDI) has emerged as a promising strategy for water desalination. Herein, environmentally friendly nanocomposites of nitrogen doped graphene quantum dots (N-GQDs) decorated onto halloysite nanotubes (HNTs) have been developed for enhanced CDI. The decoration of as-prepared 8–10 nm N-GQDs onto the surface of HNTs (N-GQDs@HNT) significantly reduces the electric resistance. The N-GQDs@HNT nanocomposites exhibit an ideal electric double layer feature with high specific capacitances of 335 and 201 F g−1 at 0.5 and 10 A g−1, respectively. In addition, more than 95% of the original capacitance can be retained after 3000 charge/discharge cycles at 1 A g−1, which indicates the superior rate capability and stability of the nanocomposites. The symmetric N-GQDs@HNT electrode shows an excellent specific electrosorption (SEC) of 20.1 mg g−1 (874 μmol g−1) and high stability toward Na+ removal after 3 consecutive charge/discharge processes. The CDI Ragone plot indicates that the SEC of N-GQDs@HNT is highly dependent on the flow rate, applied voltage and initial NaCl concentration. The superior electrochemical performance of N-GQDs@HNT is mainly attributed to the increased charge storage sites and good electrical conductivity, resulting in the improvement of the charge transfer and ion transport. These superior performance features make the N-GQDs@HNT a promising electrode material which can pave the way for the development of next generation and environmentally friendly technology using naturally occurring clay minerals as high performance electrode materials for water desalination.
Environmental significanceCapacitive deionization (CDI) is one of most promising technologies for the purification of salty water as well as the removal of metal ions in contaminated water. Traditional activated carbons and mesoporous carbons have been widely used as electrode materials for CDI application. In this study, we have developed a novel nanocomposite by combining 0-dimensional N-doped graphene quantum dots (N-GQDs) with 1-dimensional halloysite nanotubes (HNTs) for the effective and efficient electrosorption of sodium ions. The N-GQDs significantly enhance the conductivity of the nanocomposite, while HNTs provides high surface area and channels for electron and ion transport. This unique characteristic makes N-GQDs@HNT superior in rapid electrosorption of high amounts of sodium ions, compared to most of the carbon-based materials. Most importantly, HNTs are a naturally occurring clay mineral, while GQDs can be easily prepared from agricultural products/wastes, which can constitute an environmentally benign material for green chemistry application. To the best of our knowledge, this is the first report to use low-dimensional environmental clay minerals as electrode materials for high performance CDI application, which can open an avenue to design cost–benefit and environmentally friendly materials for the removal of Na+ and other metal ions from brackish water and wastewater. |
Introduction
The scarcity of water resources and decline of water quality have recently become a global concern. The increasing trend in population growth, urbanization, depletion of natural resources, and water pollution has continuously aggravated this situation.1,2 Given this, removal of salts and pollutants from sea or brackish water is becoming one of the viable options to augment the supply of fresh water. Several technologies including reverse osmosis,3 distillation,4 electrodialysis,5 and thermal processes6 have been developed for the removal of salt from aqueous solutions. However, several limitations such as high energy requirement, poor efficiency, and secondary pollution still exist. Capacitive deionization (CDI), an electrochemical technique utilizing the electrical double-layer capacitor (EDLC) principle as the removal mechanism, has recently been regarded as a promising desalination technology because of its low energy utilization and environmental significance for desalination of brackish water.7 By applying an external electric potential onto two electrodes, the cations and anions are electrosorbed onto the surface of the oppositely charged electrodes, which subsequently purifies the water and wastewater.8The electrochemical performance of carbon-based nanomaterials in CDI is highly influenced by the physicochemical characteristics and internal structures of electrode materials.8,9 More recently, a shift in research interest from activated carbon to nanostructured carbon-based materials is observed.10 As a new member of the carbon family and novel zero-dimensional (0-D) materials, graphene quantum dots (GQDs) have received significant attention in optical and electrochemical applications.11 GQDs are highly crystalline single or few-layered graphene particles,11,12 and exhibit novel optoelectrochemical properties derived from the strong quantum confinement and edge effects such as photoluminescence, high conductivity, chemical inertness, excellent stability, and environmental friendliness.13,14 The doping of GQDs with nitrogen atoms to enhance the electrochemical properties has received considerable attention because of their high electron mobility and low electric resistance.15–17 Besides, multiple defects attached to the edge and size effects of N-GQDs increase the active sites for ion diffusion between N-GQDs and electrolyte, which can provide sufficient pathways to promote charge transportation in interspaces. More recently, several studies have developed N-doped GQDs for electrochemical application.18 Therefore, it is expected that N-GQDs can be a novel electrode material for the fabrication of high-performance energy storage devices with increased stability.
In addition to carbon based materials, the application of metal oxides for desalination is still important. Incorporation of metal oxides like MnO2 and V2O5 into porous carbon electrodes to improve the electrochemical capacitance has been reported.19,20 The combination of metal oxides with carbon based materials can increase the electrosorption capacity and selective separation efficiency of ions as well as the stability of nanomaterials. Byles et al.20 have demonstrated the use of tunnel-structured MnO2 nanowires as a redox active electrode for efficient removal of Na+. El-Deen et al.21 used graphene-wrapped MnO2 nanostructures as an effective and stable electrode material for CDI application. In addition to pure metal oxides, halloysite nanotubes (HNTs), the naturally occurring clay materials containing Al2O3 and SiO2 minerals, have been widely used for adsorption of metal ions because of their layered structure. Similar to kaolin, HNTs are composed of an octahedral alumina crystal in the inner layer and a tetrahedral silica in the outer layer.16 This attractive feature makes HNTs a promising 1-D material for the intercalation of a wide variety of ions because of their high specific surface area, availability of pore texture, tunability of positive and negatively charged surface sites, low cost, and environmental friendliness.16 However, the high impedance of HNTs impairs the application of HNTs as an electrode material and, therefore, the modification of conductive carbon-based materials is thus needed. A previous study has fabricated a graphene–HNT nanocomposite as a superior electrode material for supercapacitor application.22 However, the incorporation of conductive N-GQDs with HNTs as an electrode material for highly electrochemical performance has received less attention. In addition, the electrosorption capacity of N-GQDs@HNT for CDI application has not been reported yet.
Herein, we have reported the combination of 0-D N-GQDs with 1-D HNTs as novel electrode materials for CDI application. N-GQDs were decorated onto the surface of APTES-modified HNTs to enhance the conductivity, while the layered structure of HNTs provides a large surface area to immobilize N-GQDs as well as to electrosorb ions. In addition, the symmetric CDI using N-GQDs@HNT as an electrode material was performed. Fig. 1 shows the schematic illustration of CDI by using N-GQDs@HNT as an electrode material. The electrochemical properties of N-GQDs@HNT including cyclic voltammograms (CV), galvanostatic charge/discharge (GCD) and electrochemical impedance spectra (EIS) indicate that N-GQDs@HNT is a highly promising electrode material with a high specific capacitance of 335 F g−1 at 0.5 A g−1 and excellent rate capability in 1 M NaCl electrolyte. Moreover, the specific electrosorption capacity (SEC) for removal of sodium ions in symmetric CDI processes was examined and CDI Ragone plots under different operating conditions were compared. The as-prepared N-GQD@HNT electrode shows enhanced electrochemical capacitance and surface wettability, which can significantly improve the deionization performance for CDI application.
 | ||
| Fig. 1 Schematic illustration of capacitive deionization using N-GQDs@HNT. Saline water flows through the electrodes and the adsorption of anions and cations on the electrode is induced by the applied electric field. | ||
Experimental section
Materials and chemicals
Citric acid (≥99.9%), urea (≥99.5%), sodium chloride (NaCl) (≥99.5%), HNTs (≥99.5%), 3-aminopropyl triethoxysilane (APTES) (≥97%), sodium dihydrogen phosphate (≥99%), disodium hydrogen phosphate (≥99%) and N-(3-(dimethylamino)-propyl)-N′-ethylcarbodiimide hydrochloride (EDC) (≥98.5%) were purchased from Sigma-Aldrich. N-Hydroxysuccinimide (NHS) (≥98%) was obtained from Alfa Aesar. All other reagents were of analytical grade and were used as received without further purification. All the solutions were prepared by using Milli-Q water (18.2 MΩ cm) unless otherwise mentioned.Synthesis of N-GQDs
N-GQDs were prepared according to our previous report with minor modification by increasing the weight ratio of urea/citric acid to 1.0.12 In a typical synthesis, 0.2 g citric acid and 0.2 g urea were mixed with 5 mL of deionized water. The mixture was then transferred into a 25 mL Teflon lined autoclave and heated to 180 °C for 3 h. The collected brown suspension was mixed with ethanol and centrifuged at 5000 rpm for 5 min. The obtained solid was then re-dispersed with water and dialyzed in a 1 kDa dialysis bag (Cellu Sep) for 1 d to remove the unreacted reactants. The obtained solution was stored in the dark at 4 °C for further use.Synthesis of N-GQD coated HNT nanocomposites
N-GQD coated HNT nanocomposites were prepared by using APTES as the cross linker. APTES was dissolved in dry toluene first and was then added into HNT suspensions for refluxing at 120 °C for 20 h under stirring conditions. Unreacted APTES in the resultant mixture was removed by washing with fresh toluene several times and dried overnight at 70 °C. Amide linkage between the carboxylic acid group of N-GQDs and the amine group of APTES-modified HNTs was formed by using the standard EDC/NHS chemistry. The APTES coated HNTs were then added to the as-prepared N-GQD solution and allowed to react for 4 h in the presence of 4 mg of EDC and 5 mg of NHS.16 N-GQDs@HNT was separated from the resultant mixture by washing with DI water and then dried at 70 °C for further use.Characterization of N-GQDs and N-GQDs@ HNT
A JEOL JEM-ARM200F transmission electron microscope (TEM) and a JEOL JEM-2010 high resolution TEM (HRTEM, Tokyo, Japan) were used to examine the morphology and size of N-GQDs and N-GQDs@HNT. The thermal properties of HNT based nanomaterials were examined by thermogravimetric analysis using a Mettler Toledo DSC/TGA 3+ Star system in N2. X-ray photoelectron spectroscopy (XPS) was performed with an ESCA Ulvac-PHI 1600 photoelectron spectrometer from Physical Electronics using Al Kα radiation photon energy at 1486.6 ± 0.2 eV. Elemental analysis of N-GQDs was carried out using an organic elemental analyzer (VarioEL III).Electrochemical measurements
The electrochemical measurements of N-GQDs@HNT including CV, GCD and EIS were conducted using a potentiostat/galvanostat Autolab PGSTAT 302 N electrochemical test system (Metrohm Autolab BV) connected to a single compartment cell with a three-electrode system. The working electrode was fabricated by coating homogeneous paste of a mixture containing 85 wt% N-GQDs@HNT, 10 wt% carbon black and 5 wt% Nafion. A Pt wire and Ag/AgCl were used as counter and reference electrodes, respectively, using 1 M NaCl as the electrolyte.CDI experiments
The CDI electrodes were fabricated by coating 0.1 g of the as-prepared mixture onto a 40 × 40 mm2 carbon paper electrode with a thickness of 0.1 mm. The CDI apparatus in batch mode was used to measure the deionization efficiency of the electrodes. A symmetric CDI cell was assembled by using a N-GQD@HNT-coated carbon paper electrode as both the cathode and anode, which is separated by a nylon spacer. The initial volume of the NaCl solution was 60 mL and the temperature was maintained at 298 K. The CDI performance of the N-GQD@HNT based electrode was evaluated at different NaCl concentrations (100–500 mg L−1), applied voltages (1.0–1.2 V), and flow rates (10–40 mL min−1). The stability of electrodes was studied for 3 cycles including both deionization and regeneration in every cycle at 1.2 and 0.0 V for desalination and regeneration, respectively. The SEC and charge efficiency (Λ) of the electrode for NaCl removal were obtained according to the following equations:| SEC = (C0 − Ce)V/m | (1) |
| Λ = (Γ × F)/Σ | (2) |
| SER = SEC/t | (3) |
Results and discussion
Characterization of N-GQDs@HNT
The morphology and particle size of N-GQDs are first characterized by electron microscopy. The TEM image in Fig. 2a clearly represents the homogeneously distributed N-GQDs with uniform particle sizes. The fringe pattern in the single N-GQD lattice is clearly observed and the distance is calculated to be 0.21 nm (inset of Fig. 2a), which corresponds to the (100) plane of single crystal graphene.23 After deposition of N-GQDs onto the surface of APTES-modified HNTs using EDC/NHS,24 the TEM image of N-GQDs@HNT shows an uneven coating of a thin film (Fig. 2b), depicting the successful modification of the HNT surface with APTES. The HRTEM image in Fig. 2c clearly indicates the distribution of N-GQDs onto the modified HNT surface. The fringe distance of 0.21 nm matches the characteristic lattice plane of N-GQDs (Fig. 2d), indicating the successful attachment of N-GQDs onto the modified HNT surface. Since N-GQDs are well-distributed on the surface of HNTs and the density of C is lower than those of Al and Si, it can be proved that N-GQDs are mainly onto the surface of HNTs.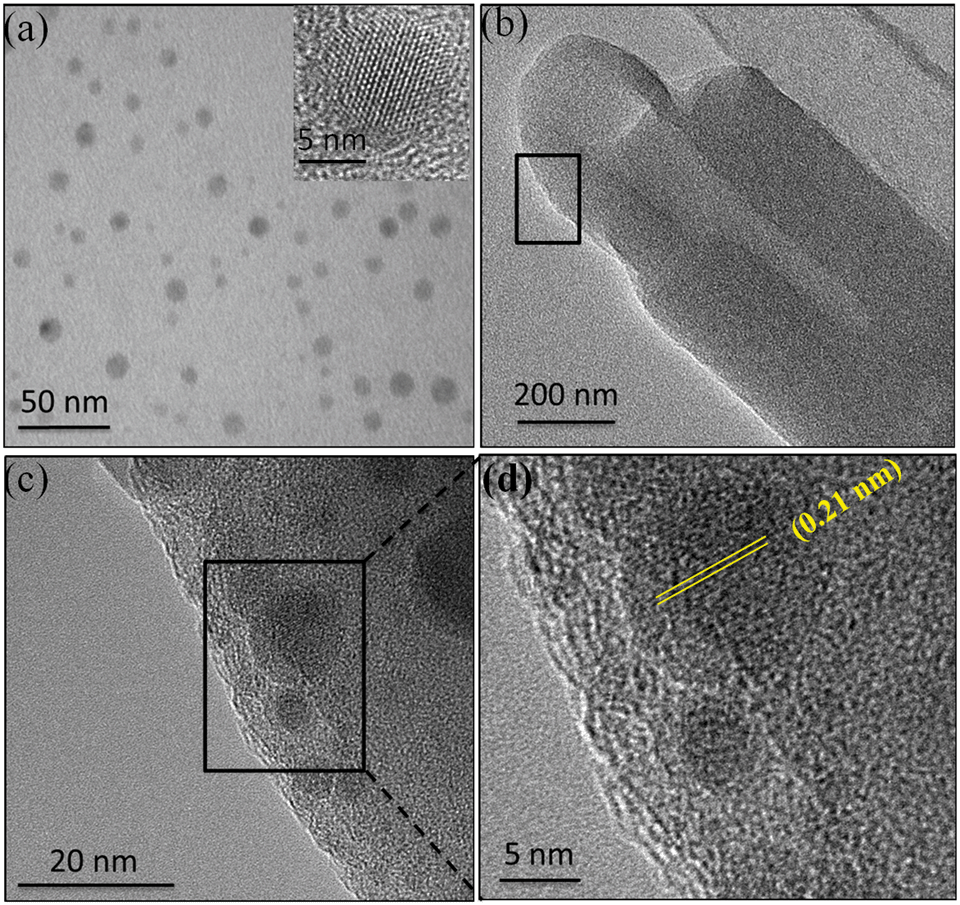 | ||
| Fig. 2 The (a) TEM image of homogenously distributed N-GQDs. Inset is the HRTEM image of N-GQDs, (b) TEM and (c) HRTEM images of N-GQDs@HNT. (d) is the enlarged HRTEM image from the selected area of (c). | ||
The thermal properties of APTES-coated HNTs and N-GQDs@HNT were determined in N2 to quantify the loaded amount of N-GQDs. As shown in Fig. S1 (ESI†), APTES-coated HNTs show a total weight loss of 21 wt% from 30 to 800 °C, while a total weight loss of 23 wt% is clearly observed for N-GQDs@HNT. An additional weight loss of 2 wt% is obtained in comparison with APTES-coated HNTs, which corresponds to the added amounts of N-GQDs onto APTES-coated HNTs. XPS was further used to characterize the change in chemical species of elements in HNT-based nanomaterials. Since HNTs contain mainly Al2O3 and SiO2, the XPS spectra of Si 2p, Al 2p and N 1s are also deconvoluted to illustrate the possible interaction between APTES-modified HNTs and N-GQDs. The deconvoluted Si 2p peaks of HNTs and N-GQDs@HNT (Fig. 3a) clearly show two peaks at 103.5 and 102.7 eV, which can be ascribed to the Si–O and Si–OH groups, respectively. After the modification of the HNT surface with APTES and N-GQDs, the binding energies of Si–O and Si–OH shift to 103.7 and 103.0 eV, respectively, presumably attributed to the formation of APTES-HNT bonding. The deconvolution of the Al 2p peak of HNTs and N-GQDs@HNT shows peaks at 74.8 and 74.3 eV (Fig. 3b), which are the characteristic peaks of Al–OH and Al–O groups, respectively. Similar to the Si peaks, the binding energies of Al–OH and Al–O shift to 75.0 and 74.5 eV after the modification of the HNT surface with APTES and N-GQDs, confirming the formation of APTES-HNT bonding.25 The attachment between the ethoxy group of APTES and the hydroxyl group of HNTs makes N-GQDs@HNT more electronegative, and subsequently results in the shift in the binding energy.26
 | ||
| Fig. 3 The XPS spectra of (a) Si 2p, (b) Al 2p and N 1s of (c) APTES-HNTs and (d) N-GQDs@HNT. | ||
To further understand the change in amine and carboxyl functional groups on the surface of APTES-HNTs and N-GQDs@HNT, the N 1s spectrum was deconvoluted. Fig. 3c shows the deconvoluted N 1s spectra of APTES-modified HNTs with two characteristic peaks of N–H and C–N at 399.2 and 401.8 eV, respectively. The N–H group is mainly attributed to the reaction of –NH2 of APTES-modified HNTs. The attachment of N-GQDs onto the surface of APTES-HNTs results in a shift in the binding energy of N 1s from 399.2 eV to 399.4 eV in N-GQDs@HNT accompanied with the decrease in the peak intensity of the N–H group (Fig. 3d). In addition, the formation of the amide bond after the attachment of N-GQDs between –NH2 of APTES and –COOH of N-GQDs leads to the increase in the peak intensity of C–N peaks, which is the evidence of covalent linkage of N-GQDs onto the APTES modified HNT surfaces.16 In addition, the elemental analysis result shows that the as-prepared N-GQDs contain 38.9%, 14.1% and 6.8% carbon (C), nitrogen (N) and hydrogen (H), clearly indicating the successful doping of N atoms into the lattice of GQDs during the hydrothermal procedures. It is also noted that the doped amount of N atoms is highly dependent on the calcination temperature, and the N content in N-GQDs can be controlled within ±10% under the same preparation conditions at 180 °C for 3 h.
Electrochemical characterization
After the successful fabrication and surface characterization of N-GQDs@HNT, the electrochemical performance of N-GQD@HNT nanocomposites was evaluated using 1 M NaCl as the electrolyte. The CV profiles of N-GQD@HNT based electrodes are first examined to understand the capacitive performance of N-GQD@HNT nanocomposites. As shown in Fig. 4a, the calculated specific capacitance is 300 F g−1 at 5 mV s−1, which is higher than the reported data using graphene and other carbon materials as electrode materials.27,28 Moreover, the specific capacitance of N-GQDs@HNT decreases gradually upon the increase in the scan rate and the specific capacitance decreases to 179 F g−1 when the scan rate increases to 100 mV s−1. It is noted that the CV curves are nearly rectangular at various scan rates of 5–100 mV s−1, depicting that N-GQDs@HNT has an excellent electrical double layer feature in the selected range used in this study. Usually a relatively rectangular shape of the CV curve indicates the quick and effective transportation of aqueous ions to the electrode surface,29 while the large encircled area of the CV curve is expected to have an increased specific capacitance.30 The high conductivity of N-GQDs allows the fast transportation of electrons and electrolyte ions, which allows the CV curves to maintain their rectangular shape at the elevated scan rate. | ||
| Fig. 4 The (a) CV curves of N-GQDs@HNT at 5–100 mV s−1, (b) galvanostatic charge–discharge curves of N-GQDs@HNT at 0.5–10 A g−1, (c) Nyquist plot, and (d) cycling stability of N-GQDs@HNT nanocomposites at 1 A g−1 for 3000 cycles. | ||
The doping of N atoms onto GQDs may change the functionalities of the N-GQD surface such as polarity, electrical conductivity and surface affinity toward aqueous electrolytes, which means that the additional pseudo-capacitance in Fig. 4a may be mainly attributed to the functional groups of N-GQDs. The increase in the nitrogen content could improve the conductivity of carbon-based nanomaterials and induce more defects to generate more accessible sites for the accumulation of charges. Usually high nitrogen content can be obtained at high calcination temperature, which also can increase the specific surface area as well as alter the pore texture of carbon-based materials. A previous study has varied the nitrogen contents in porous carbon by changing the calcination temperature from 600 to 1000 °C and found that the CDI performance of N-doped porous carbon prepared at 1000 °C is better than those at 600–800 °C because of the increase in both N content and specific surface area.31 This result clearly indicates that the increase in the nitrogen content in carbon-based materials is conducive to the increase in the conductivity and defect as well as specific surface area, and subsequently enhances the CDI performance of carbon-based materials. Moreover, the CV curve of HNTs without N-GQDs modification is also investigated and the result is shown in Fig. S2 (ESI†). The specific capacitance of unmodified HNTs is 20 F g−1 at 100 mV s−1, which clearly indicates that the excellent electrochemical performance of N-GQDs@HNT is mainly attributed to the existence of conducting N-GQDs. Although the CV curves of HNTs at 100 mV s−1 and N-GQDs@HNT at 5 mV s−1 are similar, the specific capacitances are different because the scan rate plays a crucial role in the determination of specific capacitance. Ions can transport readily from the bulk solution to the pore at a low scan rate, and would result in the high specific capacitance in comparison with a high scan rate.
Fig. 4b shows the GCD measurements in 1 M NaCl solution in the standard potential window of 0–1 V at various current densities ranging from 0.5 to 10 A g−1. The specific capacitance is calculated to be 335 F g−1 at a current density of 0.5 A g−1 and is maintained at 201 F g−1 at 10 A g−1, confirming the superior rate capability of N-GQDs@HNT. Moreover, the N-GQDs@HNT nanocomposites display a symmetric GCD curve at an applied current density of 0.5–10 A g−1, which indicates the good EDLC characteristic and electrochemical reversibility.32 The high charge/discharge capacity can be attributed to the efficient channels in the 1-D mesoporous character of N-GQDs@HNT for ion and electron transport, and subsequently gives rise to the faster kinetics. Moreover, no obvious iR drop is observed at the beginning of discharge curves, suggesting that N-GQDs@HNT has a very low equivalent series resistance (ESR) and efficient extraction of stored energy.33
To further confirm the ion transport kinetics, electrochemical impedance spectroscopy (EIS) measurements of N-GQDs@HNT were performed in the frequency range of 0.01 to 100 kHz. Fig. 4c shows the Nyquist plots of N-GQDs@HNT and pure HNT electrodes in the presence of 1.0 M NaCl. The Nyquist plot has two regions between Z′ (real axis) and Z′′ (imaginary axis) in the frequency range of 0.01–100 kHz. The N-GQD@HNT electrode shows the typical electrochemical features in the EIS spectra, i.e. a semicircle at high frequency follows by a vertical line in the low frequency range. The vertically straight line at low frequency suggests a good capacitive behaviour with little diffusion limitation on electrode materials.34 Meanwhile, the quasi-semicircle in the high frequency region represents the charge transfer resistance at the electrode and solution interface.35 The low internal resistance is a crucial property of electrode materials for CDI applications. The magnitude of ESR is 7.1 Ω for the as-received HNTs and 4.9 Ω for N-GQDs@HNT, reflecting the fact that the addition of N-GQDs lowers the electrolyte transport resistance of N-GQDs@HNT.
The incorporation of N-GQDs onto the HNT matrix leads to the increase in electrical conductivity. The cycling performance of electroactive material is one of the most significant parameters for the evaluation of practical applicability. Fig. 4d summarizes the temporal evolution of the specific capacitance of N-GQDs@HNT over the consecutive charge–discharge cycles at a current density of 1 A g−1. N-GQD@HNT exhibits a high capacitance of 308 F g−1 initially and retains more than 95% of its initial capacitance after 3000 charge/discharge cycles. No obvious decrease in the capacitance is observed during the cycling period, depicting that the electroactive N-GQD@HNT nanocomposites have an excellent long-term electrochemical stability. Since the doping of N atoms can enhance the conductivity of graphitic GQDs, the incorporation of N-GQDs into HNTs enhances the electrical conductivity and surface affinity toward aqueous electrolytes, which can retain the rate capability and cycling stability. The decoration of N-GQDs on the surface of HNTs also reduces the interface resistance as well as increases the active sites of surface areas for electrochemical reactions. Secondly, the carboxyl groups of GQDs provide the hydrophilic properties of N-GQDs@HNT to promote ion transportation. Thirdly, the multilayer structure and the mesoporous feature of 1-D HNTs shorten the diffusion paths to improve the electron and ion transport kinetics during their insertion/extraction process. These results clearly indicate that N-GQD@HNT nanocomposites are excellent and stable electrochemical materials which can meet the requirements of capacitive deionization materials for practical applications. The coaxial coating of N-GQDs with 1-D HNTs endows the electrode material with outstanding electrochemical properties with respect to both mass and geometric areas, which can serve as superior electrode materials for water desalination application.
CDI performance
Since the high capacitance of the fabricated N-GQD@HNT nanocomposites reflect the possibly high salt adsorption capacity, the CDI performance of N-GQDs@HNT was then investigated with respect to the effects of flow rates, applied voltages and initial NaCl concentrations. In addition, the CDI efficiency and stability of N-GQD@HNT nanocomposites were holistically examined to evaluate the feasibility of their practical application to water desalination. Various flow rates ranging from 10 to 40 mL min−1 were applied to examine the CDI performance of N-GQD@HNT electrodes in the presence of 500 mg L−1 NaCl. As shown in Fig. 5a, the SEC boosts rapidly at the first 10 min, and then gradually levels off to a plateau within 60 min at all the selected flow rates. The SEC of N-GQDs@HNT is 12.6 mg g−1 at a flow rate of 10 mL min−1, and then increases to the maximum SEC value of 20.05 mg g−1 at 20 mL min−1. However, the SEC decreases to 14.67 mg g−1 upon increasing the flow rate to 30–40 mL min−1. Fig. 5b presents the CDI Ragone plots of N-GQD@HNT electrodes at different flow rates. It is clear that the SER is a function of the SEC and flow rate. The SER of N-GQDs@HNT decreases from 0.88 mg g−1 min−1 at a SEC of 4.4 mg g−1 to 0.12 mg g−1 min−1 at a SEC of 13.6 mg g−1 when the flow rate is 10 mL min−1. Moreover, the SEC curve shifts toward the right and upper side when the flow rate increases from 10 to 20 mL min−1, which means that the electrosorbed amount of NaCl increases as the flow rate increases. However, the further increase in the flow rate to 30–40 mL min−1 moves the plot back to the left and lower side because of the decrease in the CDI performance of N-GQDs@HNT. This result clearly demonstrates that 20 mL min−1 is the optimal flow rate for N-GQDs@HNT to electrosorb salt and the further increase in the flow rate decreases the removal capacity and rate of NaCl. Fig. 5c shows the SEC profiles of N-GQD@HNT electrodes at different applied voltages ranging from 0.8 to 1.2 V. With the increase in the applied voltage, the SEC also increases accordingly from 13.2 mg g−1 at 0.8 V to 20.05 mg g−1 at 1.2 V, presumably attributed to the strong electrostatic interaction.36 | ||
| Fig. 5 CDI performance of the N-GQD@HNT electrodes. The (a) SEC curves and (b) CDI Ragone plots at different flow rates, (c) SEC curves and (d) CDI Ragone plots in the potential window of 0.8–1.2 V, and (e) SEC curves and (f) CDI Ragone plots at various NaCl concentrations of 50–500 mg L−1. The general operating conditions are: NaCl, 500 mg L−1; voltage, 1.2 V; and flow rate, 20 mL min−1. | ||
The CDI Ragone plots between the SEC and SER of the N-GQD@HNT electrode material in the applied voltage window of 0.8–1.2 V is presented in Fig. 5d. The increase in voltage shifts the Ragone plots to the upper right corner and a SER of 0.18 mg g−1 min−1 is observed at a SEC of 21.6 mg g−1, indicating the excellent CDI performance of N-GQDs@HNT on the removal of NaCl with the increase in applied voltage. Fig. 5e shows the effect of the initial NaCl concentration on the electrosorption capacity of N-GQDs@HNT. It can be observed that the SEC is 11.9 mg g−1 at 100 mg L−1 NaCl and then increases to 16.9 mg g−1 at 200 mg L−1. The SEC can be further increased to 20.05 mg g−1 at 500 mg L−1. Moreover, the slope of the SEC curve increases along with the increase in the initial concentration from 50 to 500 mg L−1, which indicates the increased salt removal rates at high initial NaCl concentration.37 To further evaluate the effect of the high NaCl concentration on the SEC, a high concentration of 750 mg L−1 was used. As shown in Fig. S3 (ESI†), the SEC decreases from 20.1 to 17.6 mg g−1 when the initial NaCl concentration increases from 500 to 750 mg L−1, clearly showing that the salt concentration of 500 mg L−1 can result in the highest SEC value and the further increase in NaCl concentration would slightly lower the SEC efficiency of N-GQDs@HNT.
Charge efficiency is an effective way to illustrate the double layer formed at the interface between the surface electrode materials and solution. As shown in Fig. S4 (ESI†), the charge efficiency reduces slightly from 0.53 to 0.39 when the NaCl concentration increases from 100 to 500 ppm, which is in accordance with previous reports. Fig. 5f shows the CDI Ragone plot of N-GQD@HNT electrodes as a function of various aqueous NaCl concentrations. It is clear that the Ragone curve moves to the right and top direction, depicting that the high concentration of NaCl enhances the electrosorption efficiency and rate of N-GQDs@HNT. The high NaCl concentration benefits the formation of the electric double layer and high conductivity, and subsequently accelerates the salt ion transportation from the pore/channel to the electrode. This would result in the increase in the salt removal rate when the aqueous NaCl concentration increases.20,38
Fig. 6 compares the CDI performance of N-GQDs@HNT with those recently reported results using mesoporous carbons.27,28,38,39 The electrosorption performance of N-GQDs@HNT is significantly higher than those of the most recently reported materials including metal oxide and carbon. It is clear that the electrosorption curve of N-GQD@HNT electrodes is located in the right and upper part of the Ragone plot, which indicates the superior performance of N-GQD@HNT electrodes in terms of the salt electrosorption rate. A previous study has used a mesoporous graphene electrode material for CDI and found that the SEC was 15.2 mg g−1.27 Gu et al. have developed nitrogen doped porous carbon spheres as electrode materials and the SEC of the developed materials was 12.95 mg g−1.40 Several carbon based nanomaterials including metal–organic framework derived porous carbon,41 activated carbon–MnOx,42 polymer-based porous carbon,43 carbon aerogel–MnOx,44 graphene sponge-derived porous carbon,45 TiS2–CNTs,46 and MoS2 (ref. 47) have been developed for CDI application and the SEC values were in the range of 5.81–15.67 mg g−1 when the NaCl concentrations were in the range of 100–500 mg L−1. In this study, the surface functionalization of naturally available HNTs with N-GQDs for CDI application is well explored and a SEC of 20.05 mg g−1 is obtained, which is higher than the reported data. The use of low cost and naturally occurring HNTs as the support for the preparation of scalable N-GQD@HNT nanocomposites is an environmentally friendly strategy to facilitate the high efficient and rapid electrosorption of ions, which can serve as promising electrode materials for CDI application.
 | ||
| Fig. 6 The CDI Ragone plot of N-GQD@HNT electrodes and comparison with those reported in ref. 27, 28, 37, and 38. | ||
The superior electrochemical performance of N-GQD@HNT nanocomposites on capacitive deionization is mainly attributed to the low impedance and surface functionalization. Our previous study indicated that the specific surface area and average pore size of the as-received HNTs are 45.4 m2 g−1 and 14.8 nm, respectively,16 which means that HNTs are an effective 1-D space framework to provide large specific surface area and suitable pore size to broaden the space for the transport of electrons and ions, and subsequently give rise to the fast kinetics. In order to overcome the disadvantage of a low capacitance and high resistance of HNTs, N-GQDs are introduced to the surface of HNTs to enhance the electrochemical activity as well as to improve the surface wettability, which can further provide more electrochemical active sites to accumulate charges as well as to facilitate ion accessibility. The excellent electrical conductivity can not only promote the electron transport but also reduce the interface resistance of the electrode, and, therefore, benefit the N-GQD@HNT electrode toward CDI performance.
The surface functionality with abundant hydrophilic carboxyl groups from GQDs also offers high polarity and good ion affinity to the N-GQD@HNT electrode. As a result, a boosted accessibility of electrolyte ions to the electrode material is expected, which can contribute to a faster ion diffusion process from the bulk solution to the surface of N-GQDs@HNT. Moreover, the surface modification of N-GQDs plays an important role in minimizing the aggregation of HNTs as well as in promoting the effective electrochemical reactions at the electrode/electrolyte interface. All the aforementioned chemical and structural features of the N-GQD@HNT nanocomposite can thus contribute a synergistic effect to the enhancement of the capacitance and electrosorption efficiency and rate.
The regeneration process is essential to evaluate the feasibility of the developed nanocomposite for CDI application. Fig. 7a shows the change in sodium ions and current during salt adsorption and regeneration processes by N-GQDs@HNT. Voltages of 1.2 V and 0.0 V are used for charging and discharging of the solutions, respectively. The charging at 1.2 V allows the adsorption of Na ions and 20% of sodium ions are removed by 0.1 g of electrode material from the bulk solution within 60 min. During the regeneration process at 0.0 V, the Na+ ions are released dramatically in 7 min and 54% of the adsorbed ions are restored after 20 min, clearly demonstrating that the N-GQD@HNT electrode is a promising material for CDI application. Meanwhile, the current declines sharply from 37 mA to 15 mA within 30 s and then gradually decreases to 7 mA because of the generation of the electric double layer between the interface of the electrode and solution. After 120 min of charging reaction, the regeneration process starts at 0.0 V, and the current immediately declines to −31.2 mA and then gradually increases to −0.6 mA. In addition, the concentration of sodium ions in solutions increases rapidly within the first 5 min of discharging and the maximum recovery is obtained within 15 min, clearly indicating that the symmetric N-GQD@HNT electrode is a promising material for CDI application.
 | ||
| Fig. 7 (a) Electrosorption–desorption cycle with respect to the change in Na+ and current and (b) regeneration performance of the N-GQD@HNT electrode in a continuous flow using 500 mg L−1 NaCl solution at 1.2 V with a flow rate of 20 mL min−1. | ||
The desalination efficiency of the N-GQDs@HNT electrodes in continuous flow solutions was further evaluated. Fig. 7b shows the change in sodium ion concentration in three consecutive electrosorption and regeneration cycles by N-GQD@HNT electrode materials. The sodium ion concentration in the effluent decreases rapidly during the first 20 min after applying a cell voltage of 1.2 V. However, the electrosorption of sodium ion becomes slow after 20 min because of the gradual saturation of the electrosorption capacity of the electrodes. In addition, the regeneration at 0.0 V quickly releases the sodium ions from the surface of the N-GQD@HNT electrodes into solutions, and the released sodium ion concentrations can reach 98% of the original value because of the constant feeding in the continuous system. In addition, we have performed a consecutive electrosorption–desorption process experiment for 50 cycles in batch mode at charge and discharge voltages of 1.2 and 0 V, respectively. As shown in Fig. S5 (ESI†), the sodium ion concentration in the effluent decreases rapidly during the deionization process when the external voltage was applied. In addition, the sodium ions were quickly released from the surface of the N-GQD@HNT electrodes into solutions during the regeneration processes, and the released concentrations could reach 97% of the original value. No obvious decrease in the sodium ion removal rate was observed after 50 regeneration cycles, clearly indicating the superior charge–discharge efficiency of N-GQDs@HNT. The superior electrochemical performance of N-GQDs@HNT is attributed to the existence of conducting N-GQDs. The formation of an electrostatic double layer (EDLC) on the surface of N-GQDs plays a major role in Na ion removal. In addition, the 1-D HNT framework provides large specific surface area and suitable pore texture to accelerate the transport of electrons and ions, resulting in the enhancement of CDI performance. Therefore, experiments on the optimization of N-GQD/HNT ratios can enhance the CDI performance of N-GQD@HNT under various operating conditions.
Conclusions
In this study, we have demonstrated an effective strategy to significantly boost the capacitive properties of N-GQD@HNT based electrodes in the presence of neutral aqueous electrolytes. Novel N-GQD@HNT nanocomposites have been successfully developed for effective electrosorption of sodium ions in CDI processes by intimately anchoring N-GQDs onto HNT surfaces. The CV curves of N-GQDs@HNT show ideal rectangular and symmetric voltammograms with non-Faradaic reaction. The specific capacitance of N-GQDs@HNT is 335 F g−1 at 0.5 A g−1 and retains 57% of capacitance at 10 A g−1. N-GQDs@HNT is an excellent electrode material for high performance CDI by providing suitable pore texture for charge accommodation and fast transport for ions and electrons. The CDI Ragone plots indicate that the N-GQD@HNT electrode exhibits an extremely high salt electrosorption capacity of 20.05 mg g−1 at 1.2 V in a 500 mg L−1 NaCl solution and the SER is highly dependent on the flow rate, applied voltage and initial NaCl concentration. Moreover, N-GQDs@HNT also displays good regeneration behaviour. To the best of our knowledge, this is the first report on the use of N-GQD decorated 1-D naturally occurring HNTs as promising anode materials for capacitive deionization applications. The results obtained in this study clearly demonstrate that N-GQDs@HNT is a promising CDI material for the effective removal of Na+ and other metal ions from aqueous solutions, which can open an avenue to develop highly stable and efficient desalination technology by using environmentally benign materials for the treatment of grey and brown waters.Conflicts of interest
There is no conflict to declare.Acknowledgements
The authors acknowledge the Ministry of Science and Technology (MOST), Taiwan, for financial support under grant no. MOST 107-2221-E-007-113-MY3 and 107-2011-I-007-302. RA Doong also thanks the Universiti Sains Malaysia for the support of this study (1001/PBAHAN/8014117). Akhilesh Babu Ganganboina acknowledges the MOST, Taiwan, for financial support.Notes and references
- S. Lele, V. Srinivasan, B. K. Thomas and P. Jamwal, Water Int., 2018, 43, 281–304 CrossRef.
- E. Petelet-Giraud, L. Cary, P. Cary, G. Bertrand, A. Giglio-Jacquemot, R. Hirata, L. Aquilina, L. M. Alves, V. Martins and A. M. Melo, Sci. Total Environ., 2018, 618, 645–657 CrossRef CAS PubMed.
- C. Chong, W. Lau, N. Yusof, G. Lai, N. Othman, T. Matsuura and A. Ismail, Desalination, 2018, 428, 218–226 CrossRef CAS.
- J. Xu, N. S. Bettahalli, S. Chisca, M. K. Khalid, N. Ghaffour, R. Vilagines and S. P. Nunes, Desalination, 2018, 432, 32–39 CrossRef CAS.
- D. İpekçi, E. Altıok, S. Bunani, K. Yoshizuka, S. Nishihama, M. Arda and N. Kabay, Desalination, 2018, 44, 69–75 CrossRef.
- M. Rahimi, Z. Schoener, X. Zhu, F. Zhang, C. A. Gorski and B. E. Logan, J. Hazard. Mater., 2017, 322, 551–556 CrossRef CAS PubMed.
- T. Yan, J. Liu, H. Lei, L. Shi, Z. An, H. S. Park and D. Zhang, Environ. Sci.: Nano, 2018, 5, 2722–2730 RSC.
- J. Oladunni, J. Zain, A. Hai, F. Banat, G. Bharath and E. Alhseinat, Sep. Purif. Technol., 2018, 207, 291–320 CrossRef CAS.
- Y. Dong, L. Ma, C. Y. Tang, F. Yang, X. Quan, D. Jassby, M. J. Zaworotko and M. D. Guiver, Nano Lett., 2018, 18, 5514–5521 CrossRef CAS PubMed.
- G. Murphy and D. Caudle, Electrochim. Acta, 1967, 12, 1655–1664 CrossRef CAS.
- A. B. Ganganboina, A. Dutta Chowdhury and R. A. Doong, ACS Appl. Mater. Interfaces, 2017, 10, 614–624 CrossRef PubMed.
- A. B. Ganganboina and R. A. Doong, Microchim. Acta, 2018, 185, 526 CrossRef PubMed.
- A. D. Chowdhury, A. B. Ganganboina, Y. C. Tsai, H. C. Chiu and R. A. Doong, Anal. Chim. Acta, 2018, 1027, 109–120 CrossRef PubMed.
- N. T. N. Anh and R. A. Doong, ACS Appl. Nano Mater., 2018, 1, 2153–2163 CrossRef.
- Y. C. Nie, F. Yu, L.-C. Wang, Q.-J. Xing, X. Liu, Y. Pei, J.-P. Zou, W.-L. Dai, Y. Li and S. L. Suib, Appl. Catal., B, 2018, 227, 312–321 CrossRef CAS.
- A. B. Ganganboina, A. D. Chowdhury and R. A. Doong, ACS Sustainable Chem. Eng., 2017, 5, 4930–4940 CrossRef CAS.
- A. D. Chowdhury, A. B. Ganganboina, E. Y. Park and R. A. Doong, Biosens. Bioelectron., 2018, 122, 95–103 CrossRef CAS PubMed.
- M. Kaur, M. Kaur and V. K. Sharma, Adv. Colloid Interface Sci., 2018, 259, 44–64 CrossRef CAS PubMed.
- A. B. Ganganboina and R. A. Doong, Sens. Actuators, B, 2018, 273, 1179–1186 CrossRef CAS.
- B. W. Byles, D. A. Cullen, K. L. More and E. Pomerantseva, Nano Energy, 2018, 44, 476–488 CrossRef CAS.
- A. G. El-Deen, N. A. Barakat and H. Y. Kim, Desalination, 2014, 344, 289–298 CrossRef CAS.
- L. Zhu, H. Wang, J. Bai, J. Liu and Y. Zhang, Desalination, 2017, 420, 145–157 CrossRef CAS.
- A. B. Ganganboina, A. D. Chowdhury and R. A. Doong, Electrochim. Acta, 2017, 245, 912–923 CrossRef CAS.
- M. Darder, P. Aranda, C. Ruiz-García, F. M. Fernandes and E. Ruiz-Hitzky, Adv. Funct. Mater., 2018, 28, 1704323 CrossRef.
- P. Yuan, P. D. Southon, Z. Liu, M. E. Green, J. M. Hook, S. J. Antill and C. J. Kepert, J. Phys. Chem. C, 2008, 112, 15742–15751 CrossRef CAS.
- Y. Zhang, X. He, J. Ouyang and H. Yang, Sci. Rep., 2013, 3, 2948 CrossRef PubMed.
- H. Wang, T. Yan, P. Liu, G. Chen, L. Shi, J. Zhang, Q. Zhong and D. Zhang, J. Mater. Chem. A, 2016, 4, 4908–4919 RSC.
- S. Zhao, T. Yan, H. Wang, G. Chen, L. Huang, J. Zhang, L. Shi and D. Zhang, Appl. Surf. Sci., 2016, 369, 460–469 CrossRef CAS.
- K. Lee, H. Lee, Y. Shin, Y. Yoon, D. Kim and H. Lee, Nano Energy, 2016, 26, 746–754 CrossRef CAS.
- C. Xue, F. Yang, E. Wang, L. Feng, X. Du, X. Hao and X. Li, Electrochim. Acta, 2018, 271, 406–416 CrossRef CAS.
- Y. Liu, T. Chen, T. Lu, Z. Sun, D. Chua and L. Pan, Electrochim. Acta, 2015, 158, 403–409 CrossRef CAS.
- D. T. Pham, J. P. Baboo, J. Song, S. Kim, J. Jo, V. Mathew, M. H. Alfaruqi, B. Sambandam and J. Kim, Nanoscale, 2018, 10, 5938–5949 RSC.
- O. Parlak, Y. K. Mishra, A. Grigoriev, M. Mecklenburg, W. Luo, S. Keene, A. Salleo, K. Schulte, R. Ahuja and R. Adelung, Nano Energy, 2017, 34, 570–577 CrossRef CAS.
- Y. C. Tsai and R. A. Doong, Desalination, 2016, 398, 171–179 CrossRef CAS.
- Y. Liu, B. Huang, X. Lin and Z. Xie, J. Mater. Chem. A, 2017, 5, 13009–13018 RSC.
- C.-H. Hou and C.-Y. Huang, Desalination, 2013, 314, 124–129 CrossRef CAS.
- A. Ebrahimi, G. D. Najafpour and D. Y. Kebria, Desalination, 2018, 432, 1–9 CrossRef CAS.
- M. Liu, M. Xu, Y. Xue, W. Ni, S. Huo, L. Wu, Z. Yang and Y.-M. Yan, ACS Appl. Mater. Interfaces, 2018, 10, 31260–31270 CrossRef CAS PubMed.
- L. Chang, J. Li, X. Duan and W. Liu, Electrochim. Acta, 2015, 176, 956–964 CrossRef CAS.
- X. Gu, M. Hu, Z. Du, J. Huang and C. Wang, Electrochim. Acta, 2015, 182, 183–191 CrossRef CAS.
- Z. Wang, T. Yan, J. Fang, L. Shi and D. Zhang, J. Mater. Chem. A, 2016, 4, 10858–10868 RSC.
- J. Yang, L. Zou, H. Song and Z. Hao, Desalination, 2011, 276, 199–206 CrossRef CAS.
- K. Tang, J. Chang, H. Cao, C. Su, Y. Li, Z. Zhang and Y. Zhang, ACS Sustainable Chem. Eng., 2017, 5, 11324–11333 CrossRef CAS.
- W. Cai, Z. Xiong, T. Hussain, J. Yang, Y. Wang and J. Liu, J. Electrochem. Soc., 2016, 163, A2515–A2523 CrossRef CAS.
- A. G. El-Deen, R. M. Boom, H. Y. Kim, H. Duan, M. B. Chan-Park and J.-H. Choi, ACS Appl. Mater. Interfaces, 2016, 8, 25313–25325 CrossRef CAS PubMed.
- P. Srimuk, J. Lee, A. Tolosa, C. Kim, M. Aslan and V. Presser, Chem. Mater., 2017, 29, 9964–9973 CrossRef CAS.
- P. Srimuk, J. Lee, S. Fleischmann, S. Choudhury, N. Jäckel, M. Zeiger, C. Kim, M. Aslan and V. Presser, J. Mater. Chem. A, 2017, 5, 15640–15649 RSC.
Footnote |
| † Electronic supplementary information (ESI) available: TGA of HNT based materials, CV curves of pure N-GQDs and pure HNTs, SEC, charge efficiency of N-GQDs@HNT at different NaCl concentrations and regeneration performance. See DOI: 10.1039/c9en00852g |
| This journal is © The Royal Society of Chemistry 2020 |