
The role of vanadium species during SO2 removal over a V2O5/AC catalyst
Qianqian
Guo
 ab,
Wen
Jing
b,
Yaqin
Hou
b,
Yulin
Li
b,
Fenghai
Li
a and
Zhanggen
Huang
*b
ab,
Wen
Jing
b,
Yaqin
Hou
b,
Yulin
Li
b,
Fenghai
Li
a and
Zhanggen
Huang
*b
aSchool of Chemistry and Chemical Engineering, Heze University, Heze 274015, P.R. China
bState Key Laboratory of Coal Conversion, Institute of Coal Chemistry, Chinese Academy of Sciences, Taiyuan 030001, P.R. China. E-mail: zghuang@sxicc.ac.cn; Tel: +86 351 4043727
First published on 11th December 2019
Abstract
The role of vanadium species during SO2 removal over a V2O5/AC catalyst was studied in detail using in situ diffuse reflectance infrared Fourier transform spectroscopy, Raman spectroscopy, temperature programmed desorption, X-ray photoelectron spectroscopy and N2 adsorption. Results revealed that V2O5 reacted with SO2 to form a stable vanadium(V) sulfate of V2O3(SO4)2. However, V2O3(SO4)2 did not deactivate the catalyst and was catalytically active towards SO2 oxidation, leading to the formation of H2SO4. Thus, the sulfur capacity of the V2O5/AC catalyst was determined by formation of V2O3(SO4)2 and H2SO4. Increasing V2O5 loading enhanced the formation of V2O3(SO4)2 but inhibited that of H2SO4 because V2O3(SO4)2 occupied the pores for H2SO4 storage.
1. Introduction
Sulfur dioxide (SO2) is a major air pollutant.1 SO2 removal is a topic of ongoing research since it causes severe environmental problems such as acid rain and photochemical smog.2,3 In this regard, activated carbon/coke (AC) has been demonstrated to remove SO2 effectively due to its large surface area, abundant functional groups and microporous structure.4–6SO2 chemical adsorption on AC contains several steps involving adsorption of SO2 onto the surface, oxidation of SO2 to SO3 by O2, reaction of SO3 with H2O to form H2SO4, and the storage of H2SO4 in the pores.7–9 The rate-determining step is the oxidation of SO2 to SO3.9 Therefore, modification of AC to improve its catalytic activity towards SO2 oxidation is a very effective way to enhance SO2 removal. In this regard, modification of AC with metal oxides has been extensively studied. Many metal oxides, such as CuO,10,11 Fe2O3,12,13 and MnOx,14,15 loaded on AC have been reported to be catalytically active at low temperatures. By catalyzing with metal oxides, SO2 is oxidized to SO3 by O2, which then reacts with metal oxides to form stable metal sulfates. In this way, SO2 is fixed onto the AC. The formed metal sulfates (CuSO4, Fe2(SO4)3, MnSO4, etc.) are inactive for SO2 oxidation. As a result, the catalysts are deactivated. The mechanism of SO2 removal could be expressed as follows:
| MOx + SO2 + O2 → M(SO4)x (M = Cu, Fe, Mn, etc.) |
The AC modified with vanadium oxide (V2O5/AC) is also active for SO2 removal. Precisely because of its high activity, abundant studies have been conducted in the past two decades. Various factors affecting the sulfur capacity16–19 and regeneration of sulfated catalysts20–22 have been elaborately studied. Modified with V2O5, the activated carbon honeycomb was more effective towards SO2 removal compared to AC.16,17 The sulfated catalyst regenerated in an NH3 atmosphere exhibited even higher activity than the fresh one.21 All of these studies were based on the premise that the product resulting from SO2 removal was H2SO4. By catalyzing with V2O5, SO2 was oxidized to SO3 by O2. However, SO3 reacted with H2O to form H2SO4, rather than with V2O5 to form a stable vanadium sulfate.23 Apparently, this mechanism is different from other AC supported metal oxides, and could be expressed as follows:
| SO2 + 1/2O2 + H2O → H2SO4 |
In the case of SO2 oxidation over V2O5/AC, some researchers considered that SO2 reacted with V2O5 to form an intermediate of VOSO4, which readily converted into V2O5.18,19,24,25 However, in our previous studies, detailed characterization of AC supported VOSO4 revealed that VOSO4 could not convert into V2O5 and H2SO4, but was easily oxidized into a new vanadium(V) sulfate of divanadium(v) trioxide disulfate by O2 according to the reaction as follows:26,27
| 2VIVOSO4 + 1/2O2 → VV2O3(SO4)2 |
Moreover, the AC modified with V2O3(SO4)2 exhibited high activity towards SO2 removal, indicating the catalytic role of V2O3(SO4)2 in SO2 oxidation.26 This is different from other metal sulfates (CuSO4, Fe2(SO4)3, MnSO4, etc.), which are inactive for SO2 oxidation. Additionally, the characteristic peak of V2O3(SO4)2 during the temperature programmed process was observed over sulfated V2O5/AC,26 implying the transformation of V2O5 into V2O3(SO4)2. In other words, the V2O5/AC catalyst might exist in another reaction for SO2 removal, with the metal sulfate being the final product. This finding would provide a new point of view for SO2 removal over V2O5/AC.
The objective of this work is to provide spectroscopic evidence for the formation of V2O3(SO4)2 and to elucidate the relationship between V2O3(SO4)2 and H2SO4. To achieve this purpose, the catalysts with various V2O5 loadings were investigated for SO2 removal. Then, the sulfated catalysts were characterized in detail by using in situ diffuse reflectance infrared Fourier transform spectroscopy (DRIFTS), Raman spectroscopy, temperature programmed desorption (TPD), X-ray photoelectron spectroscopy (XPS) and N2 adsorption. Based on the information obtained, the role of vanadium species during SO2 removal over the V2O5/AC catalyst was discussed.
2. Experimental
2.1 Catalyst preparation
The V2O5/AC catalyst was prepared by pore volume impregnation.28 The volume of solution used in the impregnation was equal to the volume of the support. The coal-based AC purchased from Xinhua Chemical Plant with a surface area of 986 m2 g−1 was used as the support. The V2O5/AC catalyst was prepared by pore volume impregnation with an aqueous solution of ammonium metavanadate (99.9%, Aladdin) in oxalic acid (99.5%, Aladdin). After impregnation, the sample was dried at 50 °C for 12 h and 120 °C for 5 h, calcined in N2 at 500 °C for 6 h, and pre-oxidized in air at 250 °C for 5 h. The V2O5 loadings were determined by the concentration of ammonium metavanadate solution and confirmed by inductively coupled plasma (ICP) analysis. The catalyst is expressed as Vx/AC, where x is the V2O5 loading. For instance, V5/AC is the catalyst with 5 wt% V2O5.The V2O3(SO4)2/AC catalyst was prepared by impregnating AC with vanadyl sulfate (99.9%, Alfa) aqueous solution, followed by drying in air at 50 °C for 12 h and then at 150 °C for 5 h. During this process, vanadyl sulfate (VIVOSO4) was oxidized into divanadium(V) trioxide disulfate (VV2O3(SO4)2) by O2.26,27 The V2O3(SO4)2 content was 3.5 wt% and denoted as VS/AC.
2.2 Catalyst characterization
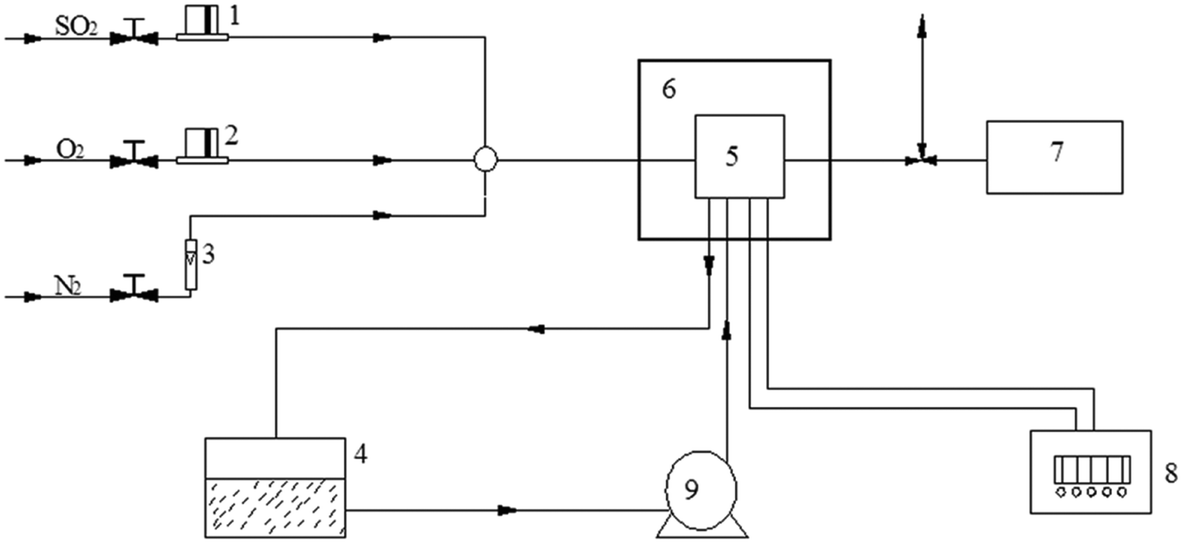 | ||
| Fig. 1 The scheme of the in situ DRIFTS analysis system. (1 and 2) mass flow controller; (3) rotameter; (4) cooling water; (5) sample chamber of the FTIR spectrometer; (6) high pressure/high temperature chamber of the diffuse reflectance accessory; (7) sweep gas analysis meter; (8) temperature controller; (9) water pump. | ||
2.3 SO2 removal
The temperature of flue gas was in the range of 120–200 °C after electrostatic precipitation. Moreover, low temperature was favorable for SO2 removal. Therefore, SO2 removal over the V2O5/AC catalyst was conducted at 120 °C in the same fixed bed quartz reactor (i.d. 22 mm) containing 3 g catalyst. The feed rates of N2, O2 and SO2 were controlled by mass flow meters. Water vapor was introduced into the reactor by passing N2 through a heated gas-wash bottle containing deionized water. The content of water vapor was controlled by both water temperature and the flow rate of N2. Simulated flue gas consisted of 0.15% SO2, 4.5% O2, 2.5% H2O and balanced N2. The total flue gas rate was maintained at 400 mL min−1, corresponding to a space velocity of 4000 h−1. The concentrations of SO2 and O2 in the inlet and outlet of the reactor were analyzed using a KM 9106 Quintox flue gas analyzer.3. Results and discussion
3.1 SO2 removal
The results of SO2 removal are illustrated in Fig. 2. In all runs, the measurements were terminated when SO2 conversion decreased from 100% to 90%. The SO2 retention was quantified by integrating curve area and expressed as mg SO2/g catalyst. As can be seen, the AC support showed almost no SO2 retention. After modification with V2O5, the breakthrough time was significantly enhanced, indicating the promoting role of vanadium oxide in SO2 removal. Additionally, the V2O3(SO4)2/AC exhibited a sulfur capacity of 42.4 mg SO2 per g catalyst, indicating the catalytic role of V2O3(SO4)2 in SO2 oxidation. The result was consistent with our previous work.30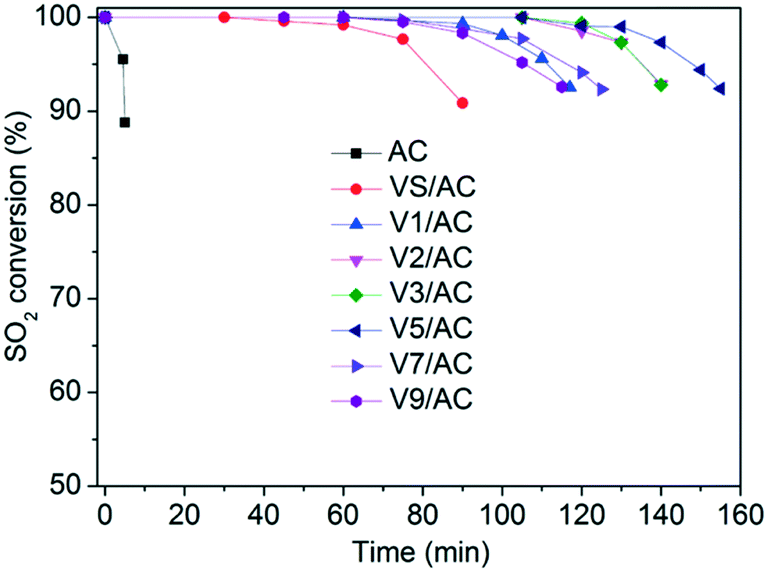 | ||
| Fig. 2 SO2 breakthrough profiles over various Vx/AC catalysts at 120 °C. Reaction conditions: 0.15% SO2, 4.5% O2, 2.5% H2O, N2 balance, 4000 h−1. | ||
The sulfur content and the specific activity per mol of V atom as a function of V2O5 loading are illustrated in Fig. 3. The sulfur content increased with V2O5 loading, reaching a maximum at V5/AC. Then, it decreased with further increasing V2O5 loading. The specific activity per mol of V atom decreased continuously with V2O5 loading. The V1/AC showed an S/V molar ratio of 7.8. According to studies, SO2 was oxidized into SO3 over vanadium sites.23,31 SO3 migrated to the AC support and reacted with H2O to form H2SO4 as the final product, which was stored in AC pores. The chemical form of vanadium oxides was not changed and continuously catalyzed SO2 oxidation to H2SO4, leading to high specific activity per mol of V atom. However, for the catalyst with high V2O5 loading such as V9/AC, the S/V molar ratio was 0.8, which was almost an order of magnitude lower than V1/AC and could not be interpreted by the current mechanism. Therefore, the mechanism of SO2 removal over V9/AC might be different from that over V1/AC.
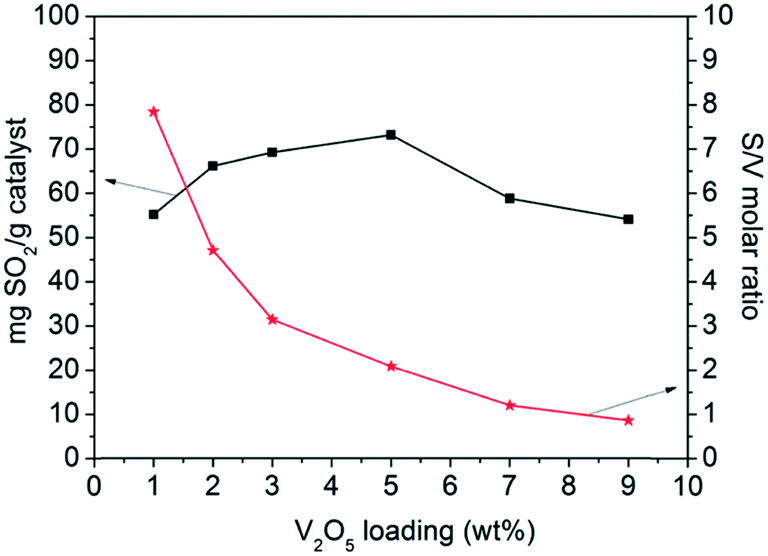 | ||
| Fig. 3 Evolution of the sulfur content and S/V molar ratio as a function of V2O5 loading. | ||
3.2 In situ DRIFTS
To determine the chemical form of sulfates, the sulfated catalysts were subjected to Fourier transform infrared (FTIR) analysis. However, due to the overlap of C–O stretching and O–H bending modes of alcoholic and carboxylic groups on AC, the evolution of the characteristic peak of sulfates with V2O5 loading was not evident.29 Thus, in situ DRIFTS was used to characterize the sulfated catalyst, because the background spectrum could be recorded to avoid the influence of oxygen groups existing on the AC surface. V1/AC, V5/AC and V9/AC were selected for in situ DRIFTS analysis.As shown in Fig. 4, no visible peak could be observed at the beginning of the experiment. As the exposure proceeded, a broad band in the region of 900–1300 cm−1 appeared over the three catalysts, and the peak intensity increased continuously with time. This band was ascribed to the stretching motion of adsorbed bisulfate (HSO4−) and/or sulfate (SO42−) on the surface. As a free anion in solution, sulfate had a tetrahedral symmetry and belonged to the point group Td. For this symmetry, there were two infrared sulfate vibrations accessible to the spectroscopic investigation using the IR technique. They were non-degenerate symmetric stretching ν1 (980 cm−1, IR inactive) and triply degenerate asymmetric stretching ν3 bands (1100 cm−1, IR active). However, if the sulfate ion was adsorbed on the surface, its symmetry could be lowered into C3v or C2v. As a result, the ν1 vibration mode became IR active, and ν3 vibration split into two peaks for C3v and three peaks for C2v.23 Thus, the broad band in the region of 900–1300 cm−1 was a result of the ν1 vibration and ν3 splitting.23,29
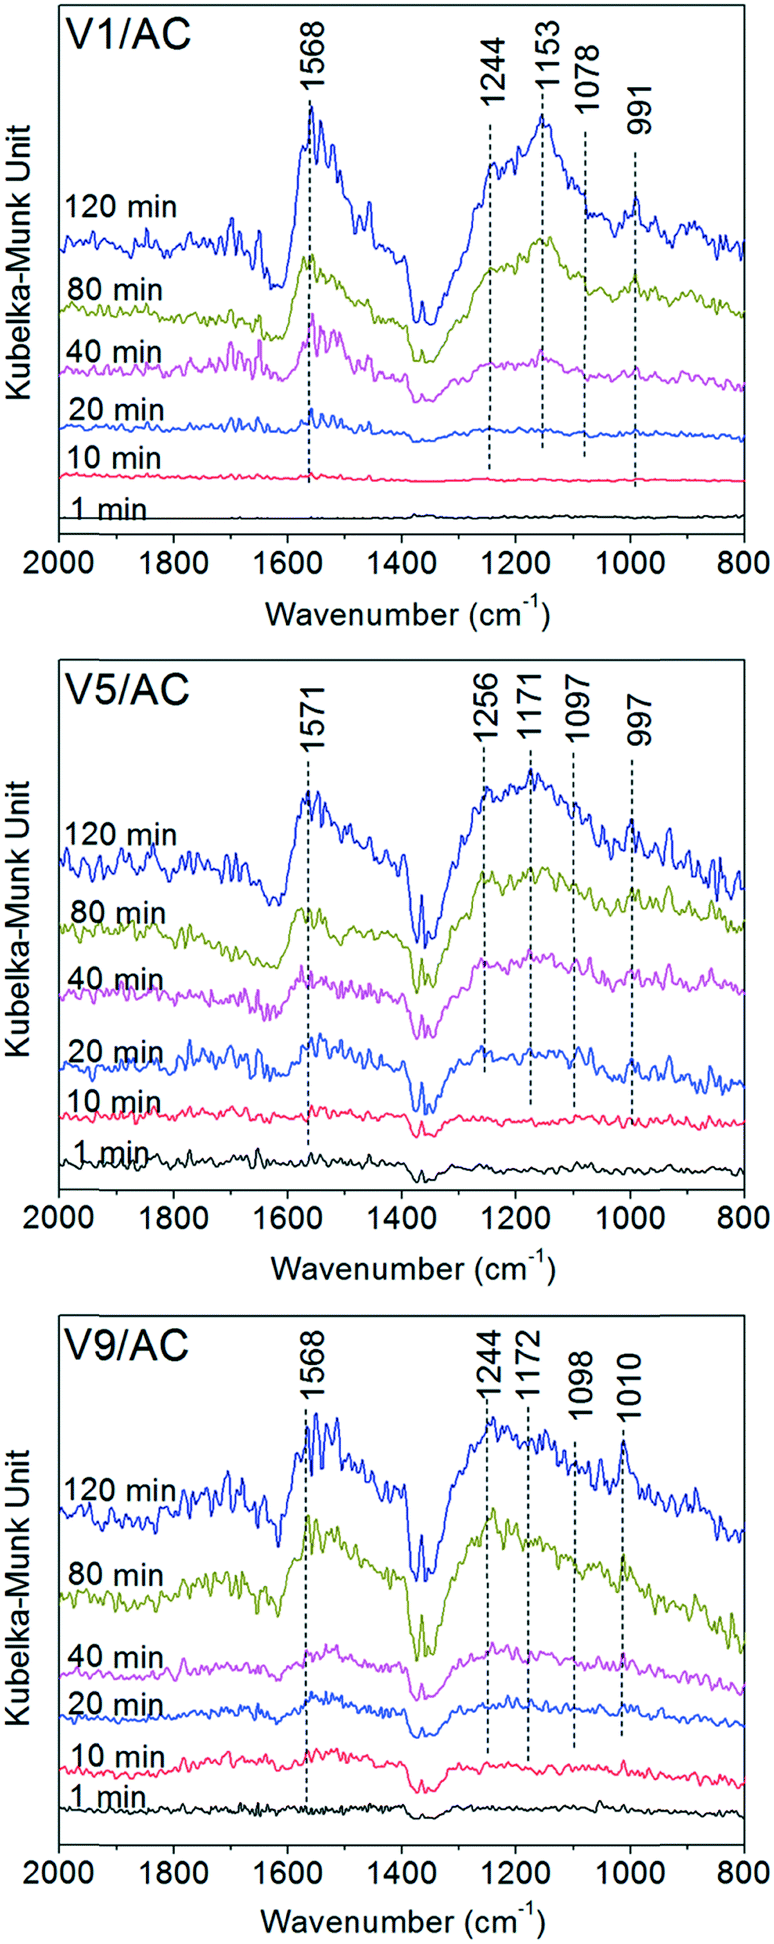 | ||
| Fig. 4 DRIFTS spectra of Vx/AC at 1, 10, 20, 40, 80, and 120 min during sulfation at 120 °C. Reaction conditions: 150 ppm SO2 and 4.5% O2 in 100 mL min−1 N2. | ||
The band of sulfated V1/AC showed features at 991, 1078, 1153 and 1244 cm−1, and the main peak located at 1153 cm−1. As the V2O5 loading increased, the band of sulfates became more irregular and the main peak moved towards a high wave number. The characteristic peak of V5/AC is located at 1171 cm−1, and that of V9/AC at 1244 cm−1. The result indicated that the sulfates over the three catalysts were adsorbed on the sites with different chemical natures. For V1/AC, it was widely accepted that the sulfates were mainly linked to the AC support and existed in the form of H2SO4.23 However, for the catalysts with higher V2O5 loading, the sulfates existed in a more complicated chemical form.
In addition, it was worth noting that a band at 1571 cm−1 appeared concomitantly with the sulfates. It was resulted from the active of C![[double bond, length as m-dash]](https://www.rsc.org/images/entities/char_e001.gif) C modes in polyaromatic as a result of the adsorption of sulfates.29
C modes in polyaromatic as a result of the adsorption of sulfates.29
3.3 Raman spectroscopy
Due to the high dispersion of vanadium species and the dark material properties of AC, the characterization of vanadium species over AC was difficult. According to the study of Guerrero-Pérez,32 when the BET surface area was 1056 m2 g−1 and the surface density of VOx was 3 nm−2 corresponding to a V2O5 loading of 48 wt%, the X-ray diffraction (XRD) pattern showed no signal for vanadium species. However, Raman spectroscopy was successful in characterizing the evolution of VOx over AC.32 Therefore, Raman spectroscopy was used to characterize the vanadium species over the sulfated catalysts (SVx/AC). The results are shown in Fig. 5.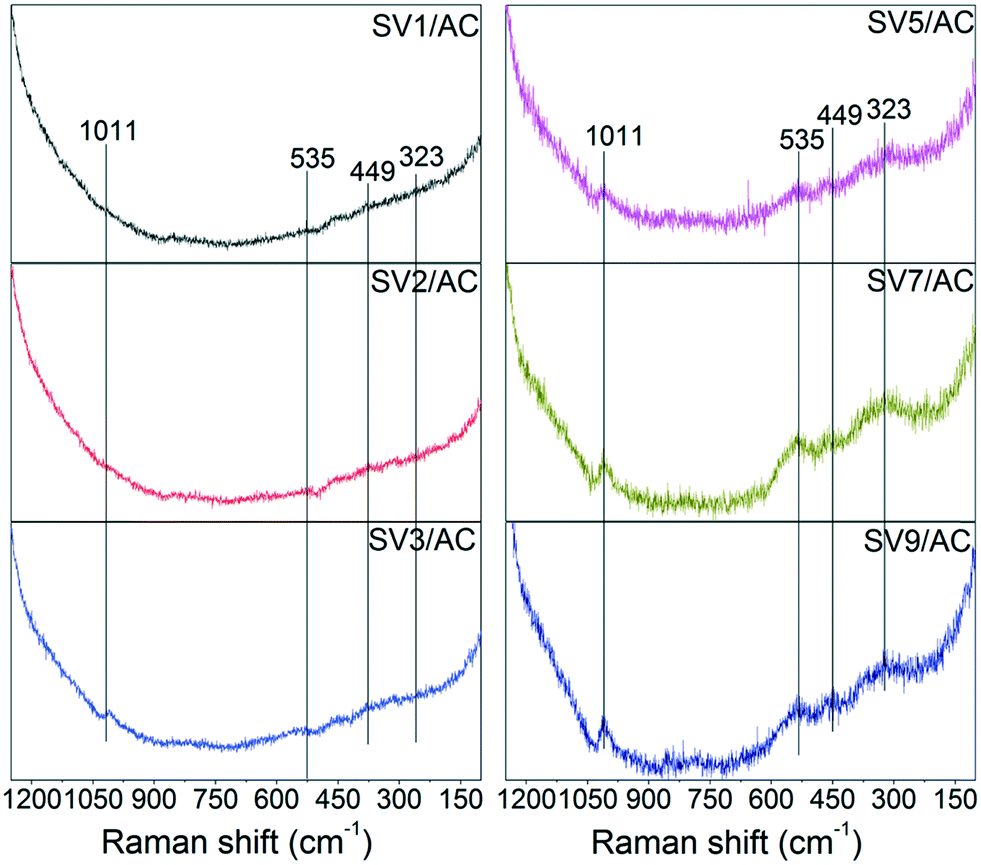 | ||
| Fig. 5 Raman spectra of SVx/AC catalysts. | ||
For SV1/AC and SV2/AC, no characteristics of vanadium species could be detected due to the low V2O5 loading. When the V2O5 loading increased to 3 wt%, a peak at 1011 cm−1 assigned to ν(VO) appeared,32,33 and the intensity of this band increased with V2O5 loading. Moreover, a new band at 535 cm−1 due to ν(S–O–V), which was the characteristic peak of divanadium(V) trioxide disulfate (VV2O3(SO4)2), was detected.33 V2O3(SO4)2 was composed of pairs of highly distorted VO6 octahedra connected to one another by a bridging O atom and two SO4 tetrahedra, with characteristic bands at 1011 cm−1 due to ν(VO), 750 cm−1 due to ν(V–O–V) and 535 cm−1 due to ν(S–O–V).33 The Raman spectroscopy data showed apparently the vibrations of ν(VO) and ν(S–O–V), indicating the transformation of V2O5 into V2O3(SO4)2 after sulfation. Compared to ν(VO), ν(V–O–V) in polyvanadate structures, such as (VO)2P2O7 and (VO)2O(SO4)44−, was much weaker and easily smeared out due to the lower signal-to-noise ratio, resulting in the absence of ν(V–O–V).32,34 The band at 449 cm−1 was assigned to ν(SO42−), and the band at 323 cm−1 was attributed to lattice vibrations.33 Conclusively, the appearance of characteristic bands assigned to ν(VO) and ν(S–O–V) strongly indicated the formation of V2O3(SO4)2 after SO2 removal.
3.4 TPD study
According to studies, the SO2-TPD pattern of the sulfated V2O5/AC catalyst showed a peak at 300–320 °C, which was related to the decomposition of H2SO4.23,31,35 On the other hand, V2O3(SO4)2 loaded on AC formed a peak at 375 °C during the temperature-programmed process.26,30 If V2O5 indeed transformed into V2O3(SO4)2 after SO2 removal, there should be two SO2 release peaks when the temperature-programmed process was performed on sulfated catalysts (SVx/AC). Based on this speculation, the TPD experiment was performed. The results are illustrated in Fig. 6. For comparison, the TPD result of fresh VS/AC reflecting the decomposition behavior of V2O3(SO4)2 over AC is also shown.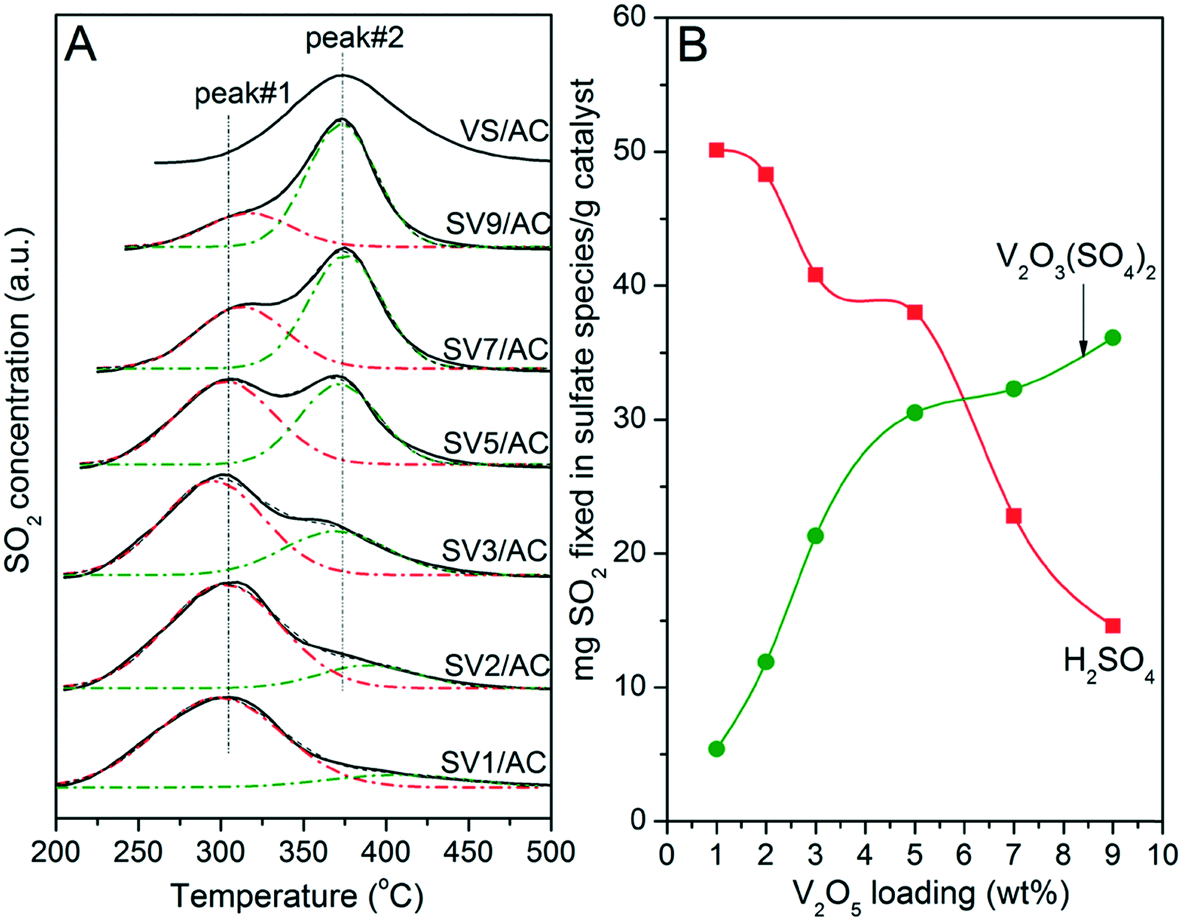 | ||
| Fig. 6 TPD (A) and Gaussian fitting (B) results of SVx/AC catalysts. Reaction conditions: 0.5 g catalyst, 400 mL min−1 N2, heating rate of 5 °C min−1. | ||
For SV1/AC and SV2/AC, the SO2 release peak is located at 305 °C, which was a result of the decomposition of H2SO4.31 However, a shoulder at 375 °C assigned to the decomposition of V2O3(SO4)2 was also visible. Moreover, the intensity of this shoulder increased with V2O5 loading, accompanied by a continuous decrease of the peak at 305 °C. For SV7/AC and SV9/AC, the peak at 375 °C became the main peak and that at 305 °C reduced to a shoulder. This result clearly demonstrated the transformation of V2O5 into V2O3(SO4)2 during SO2 removal. Apparently, the formation of V2O3(SO4)2 was in accordance with V2O5 loading. The catalyst with higher V2O5 loading generated greater amounts of V2O3(SO4)2. To clearly describe the TPD results, Gaussian fitting was performed to calculate the amount of H2SO4 and V2O3(SO4)2. As shown in Fig. 6B, the amount of V2O3(SO4)2 increased continuously with V2O5 loading, while that of H2SO4 showed an opposite trend.
The results in Fig. 6 indicated that there were two reactions simultaneously occurring over V2O5/AC during SO2 removal:
| V2O5 + 2SO2 + O2 = V2O3(SO4)2 | (I) |
| SO2 + 1/2O2 + H2O = H2SO4 | (II) |
For the catalyst with low V2O5 loading such as V1/AC, reaction (II) was the main process for SO2 removal. With increasing V2O5 loading, reaction (I) gradually took the place of reaction (II).
Numerous studies proposed that V2O5 was the active component for SO2 oxidation to H2SO4 during SO2 removal over the V2O5/AC catalyst.16,17,23,35,36 However, Raman and TPD results indicated the transformation of V2O5 into V2O3(SO4)2 after SO2 removal. Moreover, as indicated in Fig. 2 and our previous work,26,30 V2O3(SO4)2 was catalytically active for SO2 oxidation. Thus, which was the active component responsible for SO2 oxidation to H2SO4?
As shown in Fig. 6A, the characteristic peak of H2SO4 was 70 °C lower than that of V2O3(SO4)2, which avoided the overlap of two peaks and made TPD a powerful technique to study the relationship between reaction (I) and (II). Additionally, the intensity of peaks 1 and 2 over sulfated V5/AC was close to each other. Therefore, the V5/AC catalyst was selected to study the process of SO2 removal further.
Six V5/AC catalysts were subjected to sulfation for 30, 60, 90, 120, 150 and 360 min, respectively. Then, TPD experiments were performed on sulfated catalysts to investigate formations of H2SO4 and V2O3(SO4)2 at different stages of SO2 removal. The results are illustrated in Fig. 7. Note that the V5/AC catalyst was saturated with SO2 at the sulfation time of 360 min.
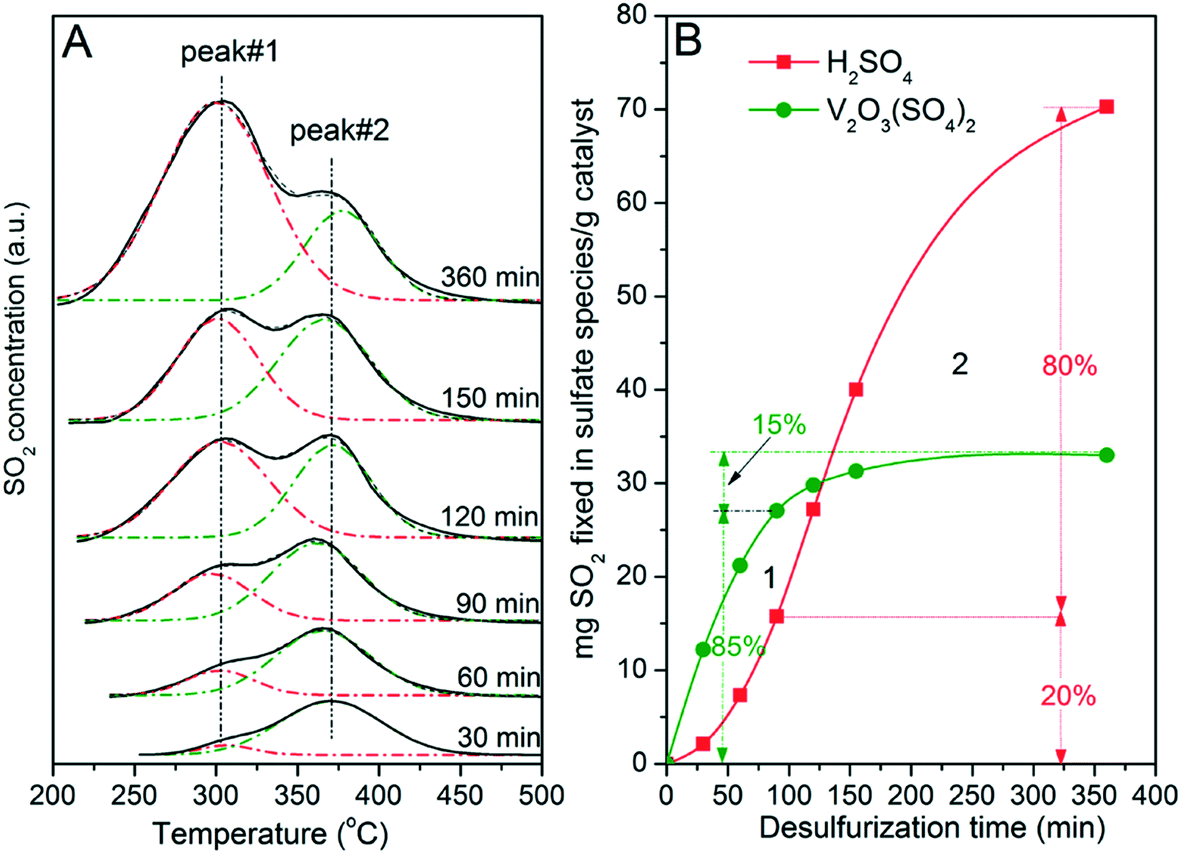 | ||
| Fig. 7 TPD (A) and Gaussian fitting (B) results of the sulfated V5/AC catalysts with sulfation times of 30, 60, 90, 120, 150, and 360 min. Reaction conditions: 0.5 g catalyst, 400 mL min−1 N2, heating rate of 5 °C min−1. | ||
As shown in Fig. 7A, the catalyst with the sulfation time of 30 min showed a peak at 375 °C, indicating that V2O3(SO4)2 was the main sulfate on the catalyst. Apparently, reaction (I) was the main process for SO2 removal at the initial stage. In addition, a shoulder at 305 °C, which was the characteristic peak of H2SO4, was also visible. With increasing time, the intensities of both peaks 1 and 2 were enhanced. However, the intensity of peak 1 grew faster than that of peak 2. At the end of sulfation, peak 1 became the main peak while peak 2 relatively reduced to a shoulder. Similar results were also obtained over V2/AC and V7/AC, with the differences in intensities of peak 2 due to different V2O5 loadings.
Apparently, the formation of V2O3(SO4)2 was superior to that of H2SO4. H2SO4 mainly formed after the transformation of V2O5 into V2O3(SO4)2. To clearly describe this process, Gaussian fitting was performed. The fitting result was plotted versus reaction time. As shown in Fig. 7B, the amount of V2O3(SO4)2 and H2SO4 increased with time. At the sulfation time of 360 min, the amount of V2O3(SO4)2 corresponded to a sulfur capacity of about 34 mg SO2 per g cat, with the S/V molar ratio being 0.97. This indicated that 97% of V2O5 had transformed into V2O3(SO4)2. The two lines crossed each other at about 125 min, dividing the sulfation into two stages. At stage 1, reaction (I) was the main process for SO2 removal. At stage 2, sulfation mainly proceeded viareaction (II).
To clearly describe the formation of V2O3(SO4)2 and H2SO4, sulfation at 90 min was selected for further analysis. At the time of 90 min, 85% of V2O5 had transformed into V2O3(SO4)2. In contrast, 80% of H2SO4 formed in the time region of 90–360 min in which the vanadium species mainly existed as V2O3(SO4)2. In other words, H2SO4 mainly formed after most of V2O5 had transformed into V2O3(SO4)2. Considering the catalytic role of V2O3(SO4)2 and the fact that the AC was almost inactive for SO2 oxidation, this result strongly indicated that the formation of H2SO4 resulted from the catalytic activity of V2O3(SO4)2 for SO2 oxidation. During SO2 removal over V2O5/AC, V2O5 firstly transformed into V2O3(SO4)2. By catalyzing with V2O3(SO4)2, SO2 was oxidized to SO3 by O2, which then reacted with H2O to form H2SO4. This in turn accounted for the two stages of SO2 removal. At first, molecular SO2 reacted with V2O5 to form V2O3(SO4)2. However, the probability of this reaction gradually decreased with the consumption of V2O5. In contrast, with the formation of V2O3(SO4)2, the opportunity for SO2 oxidation to H2SO4 catalyzed by V2O3(SO4)2 increased. As a result, reaction (II) gradually took the place of reaction (I) and acted as the main process for SO2 removal, dividing the whole sulfation process into two stages. It could be expected that the time for stage 1 was determined by V2O5 loading. The lower the V2O5 loading was, the shorter the time of stage 1 became.
During stage 2, the presence of H2O was essential. H2O could react with SO3 to form H2SO4. Moreover, H2SO4 formed on the catalyst surface could be continuously swept by H2O adsorbed in the pores.9 Therefore, H2O significantly promoted SO2 removal. Because SO2 removal over the V2O5/AC catalyst with low V2O5 loading mainly proceeded via stage 2, the presence of H2O was critical. The sulfur capacity of V1/AC was only 6 mg SO2 per g catalyst in the absence of H2O. When 2.5% H2O was added in the flue gas, the sulfur capacity increased to 55 mg SO2 per g catalyst.
Conclusively, V2O5 transformed into V2O3(SO4)2 during SO2 removal over V2O5/AC. However, V2O3(SO4)2 did not deactivate the catalyst. The formation of H2SO4 resulted from the catalytic activity of V2O3(SO4)2 for SO2 oxidation.
3.5 XPS study
To gain further insight into the sulfates, the sulfated V5/AC catalysts were subjected to XPS. Fig. 8 shows the core level S2p spectra. The peak at 168.6 eV was assigned to S6+, indicating the formation of SO42−. The intensity of the peak increased with time, which implied the accumulation of SO42− over the catalyst surface. Additionally, an apparent shoulder at 169.7 eV was visible, indicating the existence of two types of sulfates, which was in accordance with TPD. The peak at 168.6 eV was assigned to H2SO4.23 The shoulder at 169.7 eV might be assigned to V2O3(SO4)2, which was a result of the attraction of electrons by vanadium(V) spurring the peak position of S2p to move towards higher binding energy.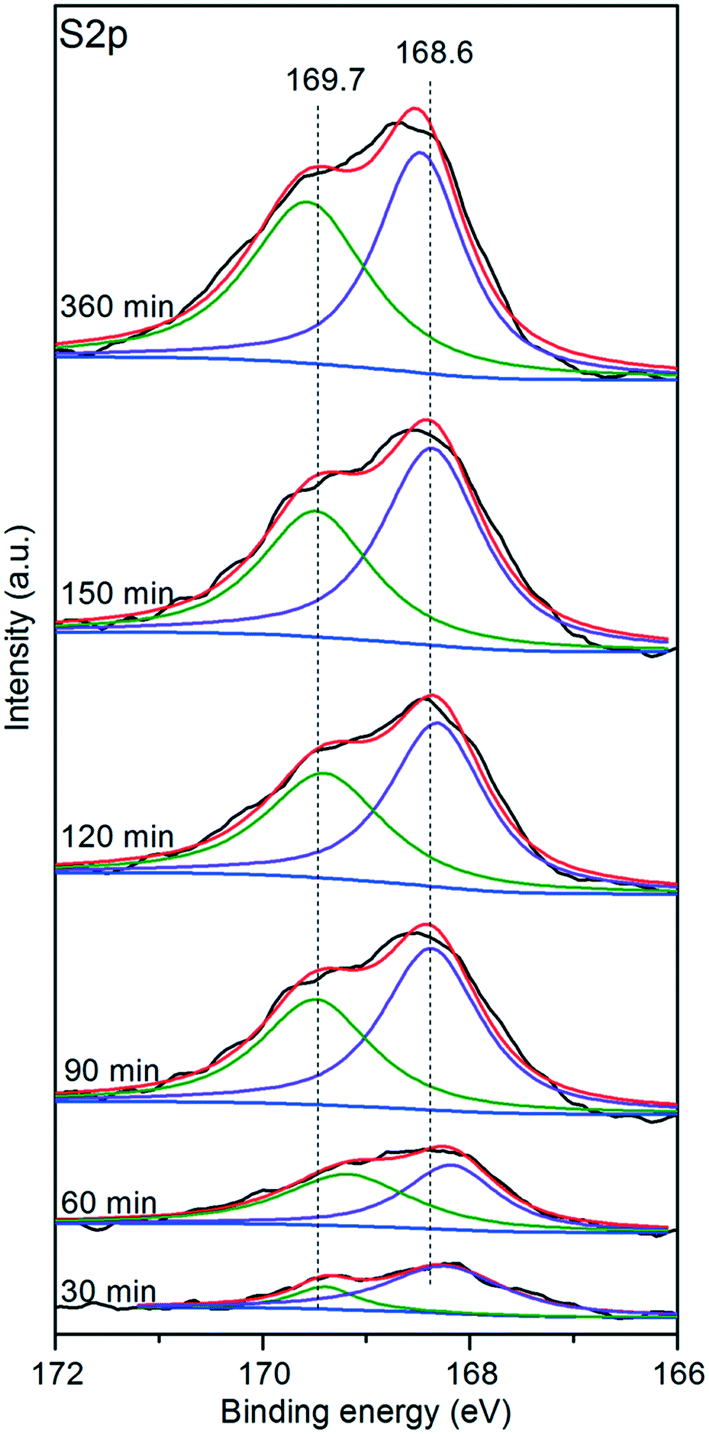 | ||
| Fig. 8 Core level S2p spectra of the sulfated V5/AC catalysts. | ||
Additionally, it should be noted that the evolution of two sulfates versus time revealed by XPS was not in accordance with TPD. The TPD results indicated that the formation of V2O3(SO4)2 was the main process at the initial stage of sulfation. However, XPS implied that H2SO4 was the main sulfate through the whole sulfation process. This was derived from the nature of the two characterization techniques. During the temperature programmed process, all of the sulfates were desorbed. By contrast, XPS is a surface characterization technique, and only the sulfates on the catalyst surface could be detected. The discrepancy between the TPD and XPS results indicated that the distribution of two sulfates was not homogeneous. Apparently, H2SO4 tended to store in the pores close to the surface by comparison with V2O3(SO4)2.
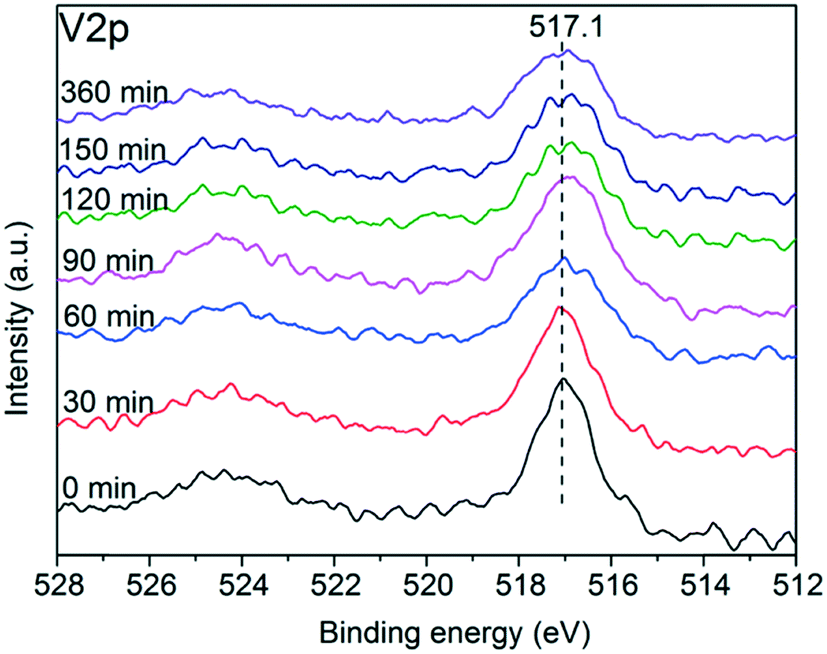
Fig. 9 shows the core level V2p spectra of the sulfated V5/AC catalysts. The peak of V2p3/2 at 517.1 eV was typical for V5+,37,38 indicating that the vanadium species were maintained in the high oxidation state. However, the full width at half maximum (FWHM) of the V2p3/2 spectrum gradually increased from 1.22 eV to 2.25 eV with sulfation, implying that vanadium(V) became more reductive. Compared to vanadium(V), the S atom is an electron donor, and thereby led to the reduction of vanadium(V) to some extent.
 | ||
| Fig. 9 Core level V2p spectra of the sulfated V5/AC catalysts. | ||
3.6 Role of vanadium species in SO2 removal
Based on the information obtained, it was clear that V2O5 transformed into V2O3(SO4)2 during SO2 removal. The sulfur capacity of V2O5/AC was determined by formation of V2O3(SO4)2 and H2SO4. For the catalyst with low V2O5 loading, the small amount of V2O3(SO4)2 mainly acted as an active component for SO2 oxidation to H2SO4. With the V2O5 loading increasing, its role as the sulfate contributing to sulfur capacity was enhanced. It was accepted that H2SO4 formed over V2O5/AC mainly stored in the pores of AC, especially in micropores.19 Thus, the pore volume of AC was an important factor affecting the formation of H2SO4. Since the formation of V2O3(SO4)2 was superior to that of H2SO4, it was expected that V2O3(SO4)2 might occupy the pores of AC for H2SO4 storage and thus inhibit its formation. To prove this, the sulfated V5/AC catalysts were subjected to N2 adsorption. As illustrated in Table 1, the BET surface and the pore volume decreased continuously with sulfation. In the time region of 0–90 min, the formation of V2O3(SO4)2 was the main process for SO2 removal based on the results of TPD. The surface area and pore volume decreased obviously with time.| Samples | S BET (m2 g−1) | V total (cm3 g−1) | S micro (m2 g−1) | V micro (cm3 g−1) |
|---|---|---|---|---|
| V5/AC | 797 | 0.465 | 434 | 0.201 |
| SV5/AC-30 | 769 | 0.441 | 413 | 0.189 |
| SV5/AC-60 | 708 | 0.414 | 383 | 0.175 |
| SV5/AC-90 | 667 | 0.387 | 353 | 0.162 |
| SV5/AC-120 | 621 | 0.371 | 321 | 0.146 |
| SV5/AC-150 | 580 | 0.360 | 295 | 0.138 |
| SV5/AC-360 | 495 | 0.301 | 223 | 0.105 |
Thus, V2O3(SO4)2 played two roles in the formation of H2SO4. On the one hand, the catalytic activity of V2O3(SO4)2 was essential for H2SO4 formation. On the other hand, as a sulfate contributing to sulfur capacity, V2O3(SO4)2 occupied the pores for H2SO4 storage and thus inhibited its formation. The two contradictory roles might achieve a balance over V5/AC, resulting in the highest sulfur capacity under the reaction conditions applied in this work.
Accordingly, a mechanism of SO2 removal over V2O5/AC is proposed in Scheme 1. The active component of V2O5 firstly transformed into V2O3(SO4)2. However, V2O3(SO4)2 did not deactivate the catalyst and further catalyzed SO2 oxidation to H2SO4. Actually, transformation of metal oxides into metal sulfates occurred on a large number of the AC supported metal oxides. In most cases, such a transformation deactivated the catalyst. Therefore, a high sulfur capacity could be only obtained on the catalyst with high loading of metal oxide. In this case, a typical example is CuO/AC. CuSO4 was the only sulfur-containing species over sulfated CuO/AC with a S/Cu molar ratio being not higher than 1.10,11 By contrast, benefitting from the catalytic activity of V2O3(SO4)2, the catalyst still kept its catalytic activity towards SO2 oxidation after transformation of V2O5 into V2O3(SO4)2, leading to the formation of H2SO4. As a result, a high sulfur capacity could be obtained over V2O5/AC with low V2O5 loading. For this reason, most previous studies paid special attention to the V2O5/AC catalyst with V2O5 loading being not higher than 2 wt%.16,17,31,39,40
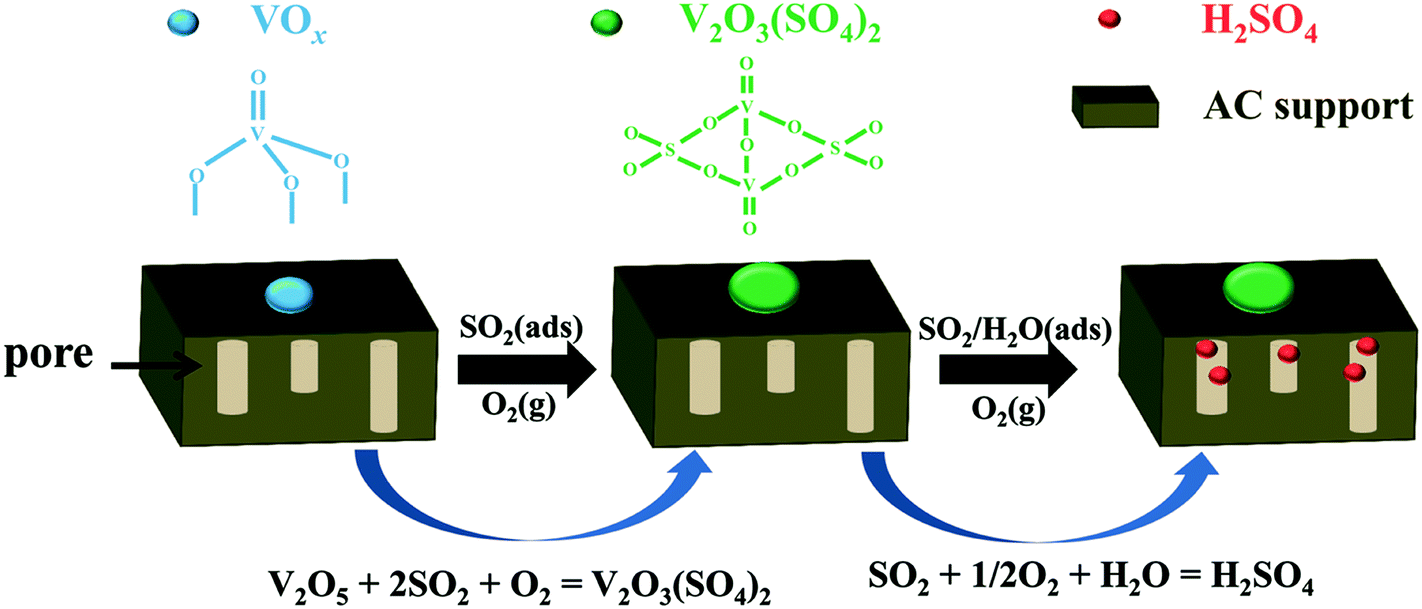 | ||
| Scheme 1 Mechanism of SO2 removal over the V2O5/AC catalyst. | ||
4. Conclusions
In the present work, the role of vanadium species during SO2 removal over a V2O5/AC catalyst was studied in detail using various techniques. Results revealed that the vanadium species had two roles in SO2 removal. On the one hand, V2O5 reacted with SO2 to form V2O3(SO4)2. In this way, a part of SO2 was fixed on the catalyst. On the other hand, V2O3(SO4)2 did not deactivate the catalyst and acted as an active component catalyzing SO2 oxidation to H2SO4. Therefore, the sulfur capacity of V2O5/AC was determined by formation of V2O3(SO4)2 and H2SO4. Because V2O3(SO4)2 occupied the pores for H2SO4 storage, increasing V2O5 loading enhanced the formation of V2O3(SO4)2 but inhibited that of H2SO4. Benefitting from the catalytic activity of V2O3(SO4)2, a high sulfur capacity could be obtained on V2O5/AC with low V2O5 loading, with H2SO4 being the main sulfate. In this case, the vanadium species mainly acted as active components for SO2 oxidation.Conflicts of interest
There are no conflicts to declare.Acknowledgements
The authors gratefully acknowledge the financial support by the National Key Research and Development Program (2017YFC0210203), the National Natural Science Foundation of China (grants 21902173 and 21978314), the Key Research and Development Program of Shanxi Province (201703D11101804), and the Shandong Province Science Foundation (ZR2017BB063).References
- M. Berger, P. Fioux, S. Dorge, H. Nouali, D. Habermacher, E. Fiani, M. Vierling, M. Moliere, J. F. Brilhac and J. Patarin, Catal. Sci. Technol., 2017, 7, 4115–4128 RSC.
- J. Yun, C. Zhu, Q. Wang, Q. Hu and G. Yang, Chemosphere, 2019, 217, 18–25 CrossRef CAS PubMed.
- K. Li, L. Chen, S. J. White, K. Han, B. Lv, K. Bao, X. Wu, X. Gao, M. Azzi and K. Cen, Atmos. Res., 2017, 192, 38–47 CrossRef CAS.
- J. M. Rosas, R. Ruiz-Rosas, J. Rodríguez-Mirasol and T. Cordero, Chem. Eng. J., 2017, 307, 707–721 CrossRef CAS.
- Y. Zhu, X. Han, Z. Huang, Y. Hou, Y. Guo and M. Wu, Chem. Eng. J., 2018, 337, 741–749 CrossRef CAS.
- M. J. Lázaro, A. Boyano, M. E. Gálvez, M. T. Izquierdo, E. García-Bordejé, C. Ruiz, R. Juan and R. Moliner, Catal. Today, 2008, 137, 215–221 CrossRef.
- P. Davini, Carbon, 1991, 29, 321–327 CrossRef CAS.
- F. Carrasco-Marin, E. Utrera-Hidalgo, J. Rivera-Utrilla and C. Moreno-Castilla, Fuel, 1992, 71, 575–578 CrossRef CAS.
- A. A. Lizzio and J. A. DeBarr, Fuel, 1996, 75, 1515–1522 CrossRef.
- H. H. Tseng and M. Y. Wey, Carbon, 2004, 42, 2269–2278 CrossRef CAS.
- H. H. Tseng and M. Y. Wey, Chemosphere, 2006, 62, 756–766 CrossRef CAS PubMed.
- J. Ma, Z. Liu, S. Liu and Z. Zhu, Appl. Catal., B, 2003, 45, 301–309 CrossRef CAS.
- T. Grzybek and H. Papp, Appl. Catal., B, 1992, 1, 271–283 CrossRef CAS.
- S. Pan, H. Luo, L. Li, Z. Wei and B. Huang, J. Mol. Catal. A: Chem., 2013, 377, 154–161 CrossRef CAS.
- J. X. Guo, Y. F. Qu, S. Shu, X. J. Wang, H. Q. Yin and Y. H. Chu, New J. Chem., 2015, 39, 5997–6015 RSC.
- Y. Wang, Z. Huang, Z. Liu and Q. Liu, Carbon, 2004, 42, 445–448 CrossRef CAS.
- Y. Wang, Z. Liu, L. Zhan, Z. Huang, Q. Liu and J. Ma, Chem. Eng. Sci., 2004, 59, 5283–5290 CrossRef CAS.
- J. Ma, Z. Liu, Q. Liu, S. Guo, Z. Huang and Y. Xiao, Fuel Process. Technol., 2008, 89, 242–248 CrossRef CAS.
- Y. Xiao, Q. Liu, Z. Liu, Z. Huang, Y. Guo and J. Yang, Appl. Catal., B, 2008, 82, 114–119 CrossRef CAS.
- Y. Guo, Z. Liu, Y. Li and Q. Liu, J. Fuel Chem. Technol., 2007, 35, 344–348 CrossRef CAS.
- Y. Guo, Z. Liu, Q. Liu and Z. Huang, Catal. Today, 2008, 131, 322–329 CrossRef CAS.
- Y. Guo, Z. Liu, Z. Huang, Q. Liu and S. Guo, Ind. Eng. Chem. Res., 2005, 44, 9989–9995 CrossRef CAS.
- Z. Zhu, Z. Liu, H. Niu, S. Liu, T. Hu, T. Liu and Y. Xie, J. Catal., 2001, 197, 6–16 CrossRef CAS.
- Q. Liu and Z. Liu, Fuel, 2013, 108, 149–158 CrossRef CAS.
- P. Li, Z. Liu, Q. Li, W. Wu and Q. Liu, Ind. Eng. Chem. Res., 2014, 53, 7910–7916 CrossRef CAS.
- W. Jing, Q. Guo, Y. Hou, G. Ma, X. Han and Z. Huang, Catal. Commun., 2014, 56, 23–26 CrossRef CAS.
- V. N. Krasil'nikov and V. G. Bamburov, Dokl. Chem., 2007, 416, 247–250 CrossRef.
- Z. Zhu, Z. Liu, S. Liu and H. Niu, Appl. Catal., B, 1999, 23, L229–L233 CrossRef CAS.
- W. Jing, Q. Guo, Y. Hou, X. Han and Z. Huang, Korean J. Chem. Eng., 2014, 31, 794–800 CrossRef CAS.
- W. Jing, Y. Hou, Q. Guo, Z. Huang, X. Han and G. Ma, J. Fuel Chem. Technol., 2013, 41, 1223–1233 CrossRef CAS.
- X. Xing, Z. Liu and J. Yang, Fuel, 2008, 87, 1705–1710 CrossRef CAS.
- M. O. Guerrero-Pérez, J. M. Rosas, R. López-Medina, M. A. Bañares, J. Rodríguez-Mirasol and T. Cordero, J. Phys. Chem. C, 2012, 116, 20396–20403 CrossRef.
- A. P. Tyutyunnik, V. N. Krasil'nikov, V. G. Zubkov, L. A. Perelyaeva and I. V. Baklanova, Russ. J. Inorg. Chem., 2010, 55, 501–507 CrossRef CAS.
- I. Giakoumelou, V. Parvulescu and S. Boghosian, J. Catal., 2004, 225, 337–349 CrossRef CAS.
- Z. Zhu, H. Niu, Z. Liu and S. Liu, J. Catal., 2000, 195, 268–278 CrossRef CAS.
- Z. Zhu, Z. Liu, H. Niu and S. Liu, J. Catal., 1999, 187, 245–248 CrossRef CAS.
- E. García-Bordejé, J. L. Pinilla, M. J. Lázaro, R. Moliner and J. L. G. Fierro, J. Catal., 2005, 233, 166–175 CrossRef.
- T. Tong, J. Chen, S. Xiong, W. Yang, Q. Yang, L. Yang, Y. Peng, Z. Liu and J. Li, Catal. Sci. Technol., 2019, 9, 3779–3787 RSC.
- X. Xing, Z. Liu and J. Wang, Fuel Process. Technol., 2007, 88, 717–722 CrossRef CAS.
- J. Wang, J. Yang and Z. Liu, Fuel Process. Technol., 2010, 91, 676–680 CrossRef CAS.
| This journal is © The Royal Society of Chemistry 2020 |