
 Open Access Article
 This Open Access Article is licensed under a Creative Commons Attribution-Non Commercial 3.0 Unported Licence
A multiple decay-length extension of the Debye–Hückel theory: to achieve high accuracy also for concentrated solutions and explain under-screening in dilute symmetric electrolytes
Roland
Kjellander

Department of Chemistry and Molecular Biology, University of Gothenburg, SE-412 96 Gothenburg, Sweden. E-mail: roland.kjellander@gu.se; Tel: +46 31 7869027
First published on 8th September 2020
Abstract
The Poisson–Boltzmann and Debye–Hückel approximations for the pair distributions and mean electrostatic potential in electrolytes predict that these entities have one single decay mode with a decay length equal to the Debye length 1/κD, that is, they have a characteristic contribution that decays with distance r like e−κDr/r. However, in reality, electrolytes have several decay modes e−κr/r, e−κ′r/r etc. with different decay lengths, 1/κ, 1/κ′ etc., that in general are different from the Debye length. As an illustration of the significance of multiple decay modes in electrolytes, the present work uses a very simple extension of the Debye–Hückel approximation with two decay lengths, which predicts oscillatory modes when appropriate. This approach gives very accurate results for radial distribution functions and thermodynamic properties of aqueous solutions of monovalent electrolytes for all concentrations investigated, including high ones. It is designed to satisfy necessary statistical mechanical conditions for the distributions. The effective dielectric permittivity of the electrolyte plays an important role in the theory and each mode has its own value of this entity. Electrolytes with high electrostatic coupling, like those with multivalent ions and/or with solvent of low dielectric constant, have decay lengths in dilute solutions that substantially deviate from the Debye length. It is shown that this is caused by nonlinear ion–ion correlation effects and the origin of under-screening, i.e., 1/κ > 1/κD, in dilute symmetric electrolytes is analyzed. The under-screening is accompanied by an increase in the effective dielectric permittivity that is also caused by these correlations. The theoretical results for the decay length are successfully compared with recent experimental data for simple electrolytes in various solvents. The paper includes background material on electrolyte theory and screening in order to be accessible for nonexperts in the field.
1 Introduction
1.1 Brief overview of electrolyte theories and screening
Electrolytes are ubiquitous and in many fields of science and industrial applications it is important to understand their properties and to be able to calculate, for example, various thermodynamical and structural quantities. The study of electrolyte systems has a long history and is still a very active field of science. This illustrates both the importance and the complexity of such systems.There exist an abundance of statistical mechanical theories for electrolytes that are based on approximations of various degrees of sophistication and accuracy. A selection of the most prominent ones that are relevant for bulk systems are presented and discussed in ref. 1–6. A cornerstone is the Debye–Hückel (DH) approximation,7 which gave an answer to an important puzzle at the time of its development in the 1920s, namely experimentally observed deviations from ideality in very dilute electrolyte solutions. In solutions of nonelectrolytes such deviations disappear proportionally to the concentration, while for electrolytes they decay like the square root of concentration due to the long range 1/r decay of the Coulomb interactions as function of distance r. In the DH approximation, the mean electrostatic potential from a charge is screened and decays like a Yukawa function e−κDr/r, where κD is the is the Debye parameter and 1/κD the Debye length, which are obtained from
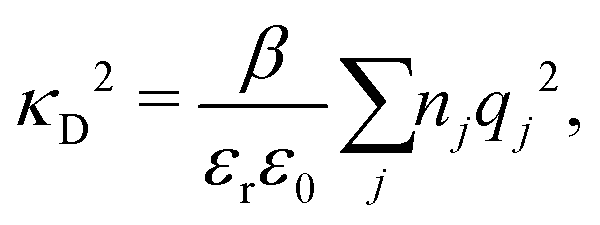 | (1) |
 | (2) |
The DH approximation is the linearized version of the Poisson–Boltzmann (PB) approximation, which is a mean field theory where the correlations between ions in the ion cloud around each ion are neglected. It gives a quite good description of electrolytes for low electrolyte concentrations, but fails when the concentration is increased. We here primarily consider the primitive model of electrolyte solutions, where the ions are charged hard spheres and the solvent is modeled as a dielectric continuum with dielectric constant εr, and we will also treat classical plasmas of such ions for which εr = 1.
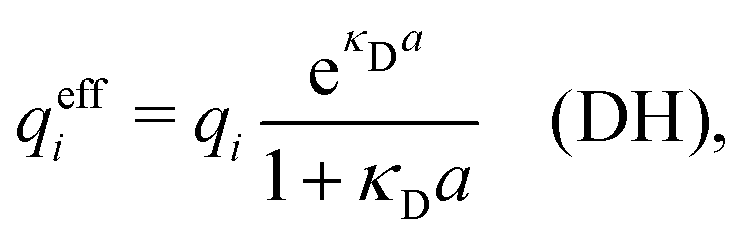
A large number of improvements of the DH approximation has been suggested over the years. One of the most well-known is the approach by Pitzer,8–10 where various DH expressions for thermodynamical quantities are parametrized to fit experimental data for a wide concentration interval. In most of the improved DH approximations, the decay length of the mean electric potential ψi(r) from an ion of species i is equal to the Debye length. The actual decay length in electrolytes is, however, in general not equal to the Debye length; it is only approximately equal to the Debye length for sufficiently low concentrations. For higher concentrations the decay length depends significantly on other system parameters than those that appear in eqn (1), for example the ion sizes.
When the electrolyte concentration is increased and the decay length starts to deviate noticeably from the Debye length, the mean electrostatic potential ψi(r) decays for large r like e−κr/r where κ ≠ κD. The radial charge density ρi(r) around an ion and, in general, the pair distribution function gij(r) also decay in this manner. The deviation of κ from κD is not described by the DH or PB approximations and neither is the fact that these functions become oscillatory at high ionic densities.11,12 The latter feature was found by Kirkwood already in the 1930s13,14 and later confirmed in other approaches by Martynov15 and Outhwaite.16 The presence of such oscillations is connected to the fact that there exist several decay modes in electrolytes, that is, contributions to the distribution functions and the electrostatic potential that decay like Yukawa functions e−κr/r, e−κ′r/r etc. where the decay parameters κ, κ′ etc. are different. For low ionic densities, the two leading decay parameters, which give the longest decay lengths, satisfy κ < κ′. When the ion density is further increased, κ and κ′ approach each other and at the so-called Kirkwood crossover point they become equal. Beyond that point κ and κ′ turn complex and we have κ = κℜ + iκℑ and 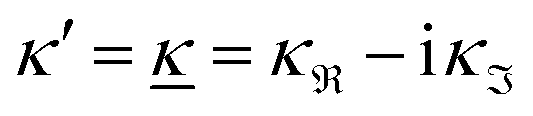 , where i is the imaginary unit and κℜ and κℑ are real (underbar denotes complex conjugation). The pair of decay modes then gives rise to a contribution that decays like an “oscillatory Yukawa function” e−κℜrcos(κℑr + α), where α gives the phase for the oscillations. This kind of oscillatory mode occurs in concentrated solutions and is the dominant one for molten salts.
The presence of several decay modes with different decay parameters has been numerically verified for simple electrolytes by computer simulations,17–20 the Hypernetted Chain (HNC) approximation18,21–23 and the Generalized Mean Spherical Approximation (GMSA).24 The leading modes give rise to the oscillatory behavior at high ion densities in accordance with the scenery above. Many other approximate theories for electrolytes also predict such decay modes and the occurrence of the Kirkwood cross-over, for example the Mean Spherical Approximation (MSA),25–29 the Linearized Modified Poisson–Boltzmann (LMPB) approximation by Outhwaite,16,30,31 the Modified Debye–Hückel (MDH) approximation by Kjellander,32 the closely related “Local Thermodynamics” (LT) approximation by Hall,33 the Generalized Debye–Hückel (GDH) approximation by Lee and Fisher,34,35 the Modified MSA by Varela and coworkers,36–39 the charge renormalization theory by Ding et al.40 and the ionic cluster model approach by Avni and coworkers.41
These theories, from GMSA onwards, are linear approximations, meaning that ψi(r) and ρi(r) are proportional to the ionic charge qi. They provide explicit equations for the decay parameter with multiple solutions κ, κ′ etc. including complex-valued ones when appropriate and so does also the original theory by Kirkwood and that by Martynov. All give decay parameters that are dependent on the ionic diameter a and qualitatively they give similar results for κ/κD and κ′/κD as functions of κDa. Most of these approximations have been used to obtain thermodynamical quantities, distribution functions and/or the mean electrostatic potential.15,16,27,28,31–33,37,39,42–47 Xiao and Song48–50 have developed a linear theory that exploits all decay modes obtained in many of these approximations to calculate thermodynamical quantities for electrolytes. We will return to some of these linear, approximate theories later. All of them work in general well for low ionic densities but have shortcomings, especially for high densities.
When the electrostatic coupling between the ions is not weak, linear theories are inadequate. Many nonlinear approximations for electrolytes have been used to obtain pair distributions and thermodynamical quantities. They include the HNC approximation51–55 and other integral equation theories.54,56–61 There are also improved versions of the PB approximation that correct for the neglect of correlations in the ion cloud around each ion, like the Modified PB approximation by Outhwaite et al.16,62–64 and the correlation-enhanced PB theory by Su and coworkers.65 Furthermore, various field theories4,66–70 have been developed for the study of bulk electrolytes. Pair distributions and thermodynamical quantities for bulk electrolytes have, of course, been calculated also by simulations.11,12,17–20,55,59,61,71–80
The nonlinear theories do not in general provide any explicit equation for the decay parameter like the linear ones above do, but from these theories and from computer simulations, the values of κ, κ′ etc. have been extracted numerically for various electrolytes.17–23,81–84 The decay parameter κ of the leading decay mode can in many cases be obtained by curve fitting to the tails of the functions for large r, but it is in general not straightforward to obtain those of the other modes and one must use systematic means to extract them from the distribution functions.18
One approximate way to incorporate some effects of nonlinearity into linear theories is to introduce ion pairing as originally done by Bjerrum.85 In this approach one assumes that anion–cation pairs exist in equilibrium with free ions in the electrolyte, so the concentration of the latter ions is lower than the total concentration. Since the pairs are electroneutral, they do not contribute to the Debye parameter in eqn (1) and the Debye length 1/κD becomes larger than in their absence – a quite trivial reason for a change in decay length. The pair formation is a nonlinear phenomenon because the electrostatic interaction between two paired ions is large. The effects of this nonlinearity is included in the value of the equilibrium constant that describes the equilibrium.
There exist various ways to construct theories of pairing. One kind of approach is to include ion pairs in a DH-type theory86–88 for the electrolyte and another is to base the ion pair theory on the MSA;88–92 see ref. 93 for a comparison of different variants of these approaches. Fisher and coworkers34,88,93 stress the importance of including the interactions between the dipoles formed by the ion pairs and the free ions. In many cases, it is reasonable to consider a part of the effect from the presence of such dipoles as an augmentation of the dielectric permittivity of the electrolyte. We will treat some aspects of ion pairing and changes in dielectric permittivity later. Transient ion pairing is, in fact, an aspect of strong anion–cation correlations, which affect the decay length and the (effective) dielectric permittivity of the electrolyte.94,95
Electrolyte systems have in general a complex behavior and most theories mentioned above are quite complicated to use, in particular those that yield accurate distribution functions. A fair question to ask is how thermodynamic properties and distribution functions possibly can be accurately obtained without undue complications and without the use of empirical fitting parameters. In order a get a perspective on this question, let us first consider some approaches that have been used for such a task.
A simple linear approximation that takes into consideration that the decay length depends on the ion diameter is the Corrected Debye–Hückel (CDH) approximation by Abbas, Nordholm and coworkers.78,96 They make an Ansatz that the radial charge density ρi(r) around an ion (and therefore the electrostatic potential ψi(r)) is proportional to e−κr/r, where the decay parameter κ is not the same as κD. The value of κ is then determined from an optimization of an approximate free energy of the system. By combining CDH with the Carnahan–Starling equation of state97 for hard spheres, they obtain the activity coefficient for monovalent (1![[thin space (1/6-em)]](https://www.rsc.org/images/entities/char_2009.gif) :1) electrolytes in aqueous solution in very good agreement with simulations for a wide range of concentrations, including concentrated solutions.78 For 2:1 electrolytes they obtain equally good agreement except for small ion sizes, but the latter results are still good. As pointed out by Abbas et al.,78 the thermodynamical quantities obtained from this Ansatz are in very good agreement with simulation results for high densities despite that the actual ρi(r) is oscillatory rather than proportional to e−κr/r.
:1) electrolytes in aqueous solution in very good agreement with simulations for a wide range of concentrations, including concentrated solutions.78 For 2:1 electrolytes they obtain equally good agreement except for small ion sizes, but the latter results are still good. As pointed out by Abbas et al.,78 the thermodynamical quantities obtained from this Ansatz are in very good agreement with simulation results for high densities despite that the actual ρi(r) is oscillatory rather than proportional to e−κr/r.
Likewise, for a parametrized DH approach with fitting parameters for thermodynamics like that of Pitzer mentioned earlier, the structural entities are qualitatively different from the accurate ones at high concentrations. The same is the case for approaches that use the PB approximation.
Attard84 also makes the assumption that ρi(r) is proportional to e−κr/r. By requiring that ρi(r) fulfills some necessary conditions that we will consider later, he obtains the Self-Consistent Screening Length (SCSL) approximation for the single decay parameter κ, which can be a real or complex number depending on the ion density. This is a linear theory that has been successfully used to calculate thermodynamical quantities for monovalent electrolytes solutions with low up to moderate concentrations. Another theory that uses only one decay mode in the calculation of thermodynamical properties is the MDH approximation.32 It is also successful for low up to moderate concentrations. These two approximations will be treated in quite some detail later.
Janecek and Netz80 investigated whether properties of electrolytes can be described in terms of an effective screening length. They extracted a single effective screening parameter κeff by simulation of various electrolyte solutions (corresponding to 1:1 and 2:2 salt in water) and used it to calculate thermodynamic properties from a DH-like theory where κD is replaced by κeff. For high concentrations where the simulated radial charge density is oscillatory, a complex-valued screening parameter was extracted instead of κeff. This approach works very well for the thermodynamics of 1:1 electrolytes for the concentration range investigated and somewhat less well for the 2:2 case. The parameter κeff is in general not the same as the decay parameter κ of the asymptotic decay of ρi(r) discussed in the current work,† but κeff approaches the actual κ when the concentration is decreased towards zero. As pointed out by the authors, the effective screening parameter “does not provide an accurate description of the charge density distribution.” They also used the ion-pairing DH-type theory by Fisher and coworkers88,93 to calculate activity coefficients, which worked very well for 2:2 electrolytes and less well for monovalent ones.
From these examples we see that even if an approximation reproduces thermodynamical data accurately, the structural entities like ρi(r) and the pair distribution function gij(r) obtained in the approximation do not need to be equal to the correct ones. Even when these functions are oscillatory, the thermodynamical entities can be accurately obtained from a single Yukawa decay mode with a real decay parameter. Likewise, when there are more than one decay mode, the thermodynamics can be accurately obtained from just one Yukawa mode. The value of the decay parameter used is in general different from that of the actual κ of the electrolyte. To judge whether an approximation gives a fully accurate description of a system, it is accordingly important to investigate both thermodynamical and structural quantities. A successful theory gives accurate results for both. An important aim of the current work is to develop a simple theory that accomplishes this. Thereby, the presence of more than one decay mode will be included in the treatment of simple electrolytes.
Incidentally, it should be noted that several simultaneous modes that decay like monotonic or oscillatory Yukawa functions have also a prominent role in dense ionic liquids, like room temperature ionic liquids. An analysis of these decay modes is important for the understanding of such systems – not only for structure and thermodynamics, but also for interactions in the systems including surface forces. The modes can, for example, be detected in surface force experiments. It has recently been shown95,98 that all such decay modes, including those that are dominated by “packing” of molecules in the dense liquids, are in general also decay modes of the electrostatic interactions and are therefore governed by the dielectric response of the liquid.‡ The same is true also for the decay mode of long-range density–density correlation fluctuations with a decay length that diverges on approach to a critical point and the very long-range monotonically decaying mode that recently has been found99 for dense electrolytes. Likewise, for dilute electrolyte solutions with discrete molecular solvent, oscillatory decay modes that are dominated by the structure of the solvent also constitute decay modes of the electrostatic interactions.95,98 Such modes have often been designated as “solvation forces;” in the case of aqueous systems “hydration forces.”
1.2 Overview of the current work
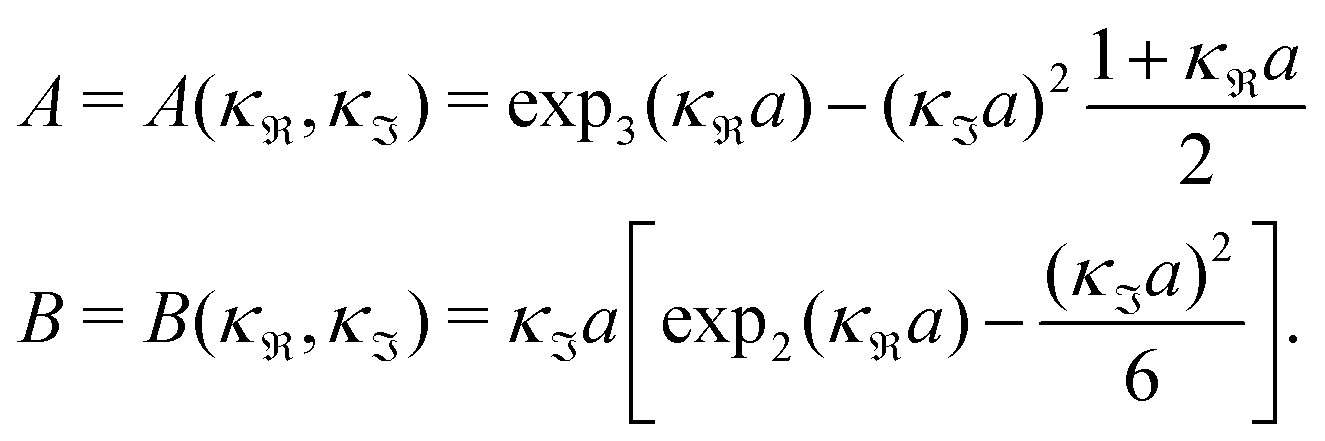
We will limit ourselves in the current work to solutions of simple electrolytes in the primitive model and to classical plasmas. In order to illustrate the importance of the various decay modes, we will include two Yukawa modes and show that both modes are crucial in order to obtain very good description of both structural and thermodynamical quantities for a wide range of ion densities, including concentrated solutions and dense plasmas. As concluded in the previous section, a successful theory accurately predicts both kinds of quantities. The decay modes are physically distinguishable and the decay lengths 1/κ and 1/κ′ constitute characteristic properties of the propagation of screened electrostatic interactions in the electrolyte. For the oscillatory case, where κ and κ′ are complex, the decay length 1/κℜ and the wave length 2π/κℑ have the corresponding roles. The basic idea in this approach is simple: for a radial function f(r) like ψi(r), ρi(r) or the potential of mean force wij(r) between two ions, one makes the approximate Ansatz that f(r) is given by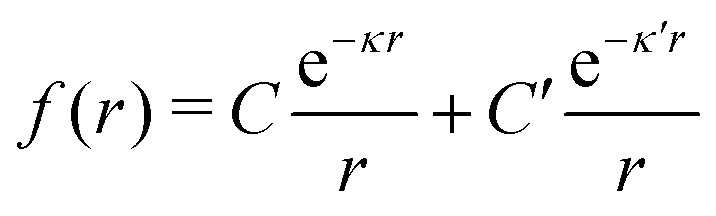 | (3) |
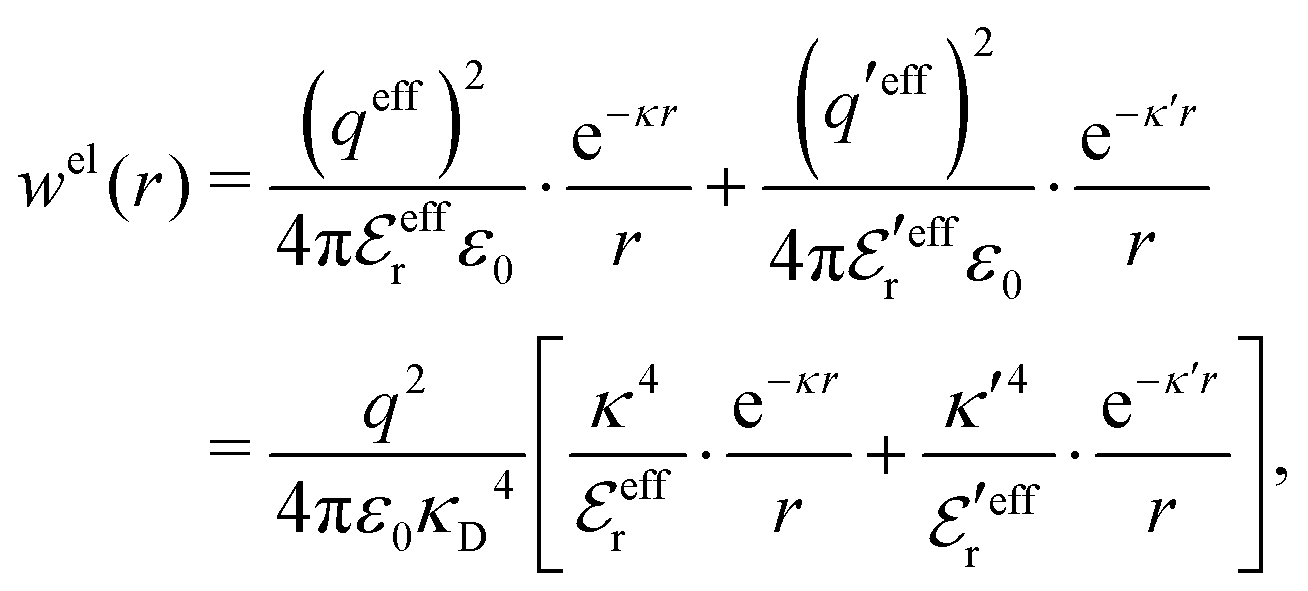
An important further ingredient is the use of an exact relationship§ between the decay parameter κ and the effective charges, namely100,101
 | (4) |
In the present work, we will primarily investigate systems with sufficiently low electrostatic coupling so that electrostatic response can be linearized. The resulting mathematical formulas for both the structural and thermodynamic quantities are simple and straight-forward to apply in practice. They are obtained by using first-principle statistical mechanics and are free from any fitting parameters. The results obtained for conditions corresponding to monovalent ions in aqueous solutions at room temperature are in very good agreement with computer simulations and other accurate calculations for all concentrations. Such conditions also include classical plasmas at high temperatures. We will also see why it is insufficient with one single decay mode for the accurate description of distribution functions of electrolytes with medium to high densities.
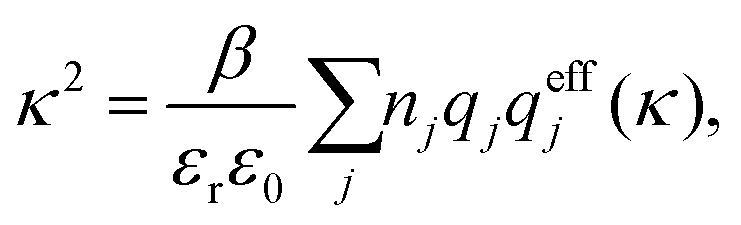
Nonlinear correlational effects for high electrostatic coupling will also be investigated. In fact, the long-range nature of the Coulomb interactions gives such effects in highly diluted electrolyte solutions and thin plasmas. They can cause substantial deviations of κ from κD, which are given by the following exact limiting law101 – here written for the case of a binary electrolytes¶
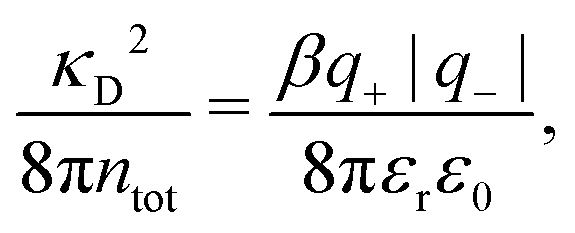
 | (5) |
![[small script l]](https://www.rsc.org/images/entities/char_e146.gif) BκD is a coupling constant, B = βqe2/(4πεrε0) is the Bjerrum length, qe is the elementary (protonic) charge and zj = qj/qe is the ionic valency. The deviation of κ2/κD2 from the value 1, as described by this law, arises solely from the tails of the long-range, purely electrostatic correlations between the ions when r → ∞ and does not depend on any other properties of the ions than their charges. These other properties, like the ion size, enter in the following term (not shown in eqn (5)) that is proportional to Λ2, i.e., proportional to the ionic concentration.
BκD is a coupling constant, B = βqe2/(4πεrε0) is the Bjerrum length, qe is the elementary (protonic) charge and zj = qj/qe is the ionic valency. The deviation of κ2/κD2 from the value 1, as described by this law, arises solely from the tails of the long-range, purely electrostatic correlations between the ions when r → ∞ and does not depend on any other properties of the ions than their charges. These other properties, like the ion size, enter in the following term (not shown in eqn (5)) that is proportional to Λ2, i.e., proportional to the ionic concentration.
For symmetric electrolytes (z+ = |z−|), the second term in the rhs of eqn (5) is identically equal to zero and we have κ < κD for sufficiently dilute solutions because lnΛ < 0 there, which means that the decay length is larger than the Debye length (“under-screening”). For dilute solutions of asymmetric electrolytes (z+ ≠ |z−|), the second term is dominant and for such electrolytes κ > κD in the limit of infinite dilution, so the decay length is smaller than the Debye length (“over-screening”).
These predictions have been verified experimentally. For a highly asymmetric electrolyte, z+ = 12 and z− = − 1, the positive deviation of κ from κD has been experimentally measured in dilute solutions by Kékicheff and Ninham103 in agreement with the leading term in eqn (5). For symmetric electrolytes, the negative deviation of κ from κD, has recently been measured in dilute solutions of simple electrolytes with high electrostatic coupling by Smith, Maroni, Trefalt and Borkovec104 and Stojimirović, Galli and Trefalt105 (henceforth referred to as “Trefalt and coworkers”) by surface force experiments. This latter case will be discussed in quite some detail in the current work.
While all linear approximations mentioned earlier give the correct limiting laws for the thermodynamical properties, eqn (2), in the limit of zero ionic density, they do not give the correct behavior of κ2/κD2 in this limit as given by eqn (5). For example, the MSA, GMSA, LMPB, MDH, LT and GDH approximations predict that κ2/κD2 decays proportionally to Λ2 when the density goes to zero. On the other hand, the HNC approximation, which is a nonlinear approximation, gives a κ that agrees with eqn (5) for both symmetric22 and asymmetric81 electrolytes at low ionic densities. In the analysis presented in the current work, we will see the importance of including nonlinear ion–ion correlation effects in order to obtain the correct behavior of the decay parameter for dilute systems. Such effects influence the values the effective ionic charges and hence κ viaeqn (4).
The paper is organized as follows. In Section 2, some relevant parts of the theory of electrolytes are presented as a background for the rest of the paper and the main approximations made in the current work are introduced. A couple of approximations with a single decay-mode are treated in Section 3 and a simple equation for κ that is used in a large part of the paper is obtained. The Multiple-Decay Extended Debye–Hückel (MDE-DH) approximation, developed in this work, is described in Section 4, starting with the simplest version, which is sufficient provided that the ionic sizes are not too large so ionic core–core correlations are not too prominent. This version of the theory gives both radial distribution functions and thermodynamical quantities in very good agreement with simulations and Hypernetted Chain (HNC) calculations that are very accurate for the systems studied. The complete version of the MDE-DH approximation is used to successfully treat dense systems with large ions, whereby quite intricate details of the pair distribution functions are obtained in agreement with simulations. In Section 5, effects of nonlinear ion–ion correlations on the main decay mode are investigated. The screening properties of thin plasmas and dilute solutions of symmetric electrolytes are thereby studied, in particular the under-screening that occurs in such electrolytes with high electrostatic coupling. This under-screening is accompanied by an augmentation of the effective dielectric permittivity of the electrolyte caused by the strongly nonlinear ion–ion correlations. The various types of deviations of κ from κD in symmetric electrolytes and the reasons for them are studied in Section 6, whereby an approximate limiting law for κ2/κD2 is derived for symmetric electrolytes that extends the exact law (5) by adding higher order contributions. An analysis is made of the experimental results by Trefalt and coworkers104,105 for the deviations of κ from κD in dilute solutions of simple electrolytes with high electrostatic coupling. Different mechanisms for this phenomenon are discussed. Finally, in Section 7 the main results of the paper are summarized and concluding remarks are given. As an aid to the reader, this section contains references to some central equations of this work.
2 Background and basic approximations
We will consider electrolytes in bulk phase using the primitive model. This model is also applicable to classical plasmas where εr = 1. Each ion has a point charge qj at its center and the total ion density in bulk is .
.
The average density of ions of species j at distance r from the center of an ion of species i is equal to njgij(r) = nje−βwij(r), where gij(r) is the pair distribution function and wij(r) is the pair potential of mean force. The mean charge density around the i-ion is given by the radial charge-distribution function
 | (6) |
 for the bulk phase. When dealing with ρi(r) and other functions of r, we will denote this i-ion as the “central ion” and the surrounding charge density constitutes its ion cloud.
In the Poisson–Boltzmann approximation one assumes that
| wij(r) = qjψi(r) (PB) | (7) |
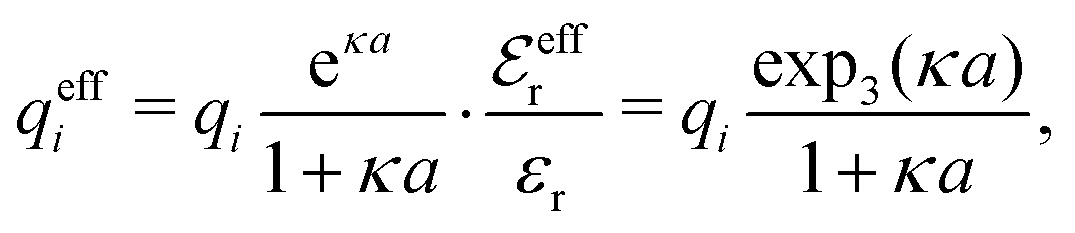
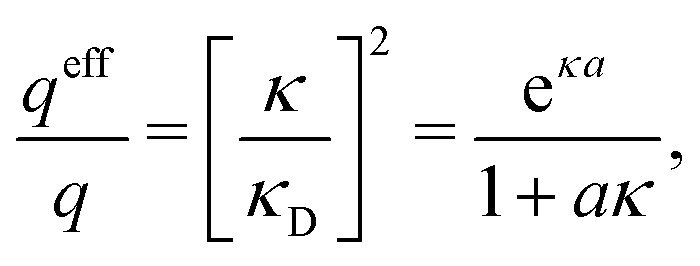
where Ci is a constant. In the limit of infinite dilution κD → 0, Ci → qi/(4πεrε0) and ψi(r) approaches the ordinary Coulombic potential qi/(4πεrε0r) from the charge qi. Therefore, for an electrolyte of any ionic density, it is reasonable to define an effective charge qeffi of the ion from Ci = qeffi/(4πεrε0) in the PB approximation, so we have
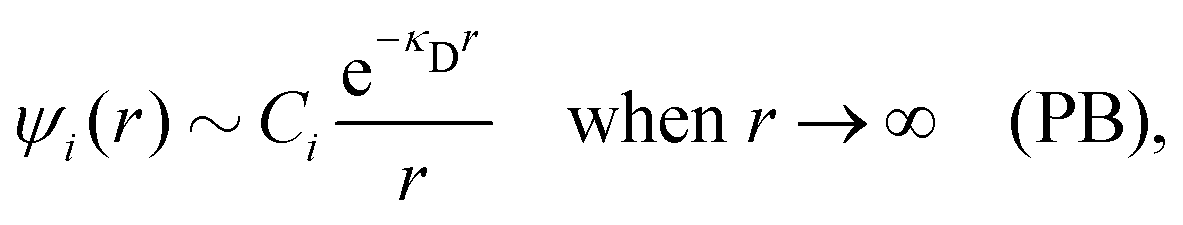
 | (8) |
 | (9) |
In the linearized version of the PB approximation, the Debye–Hückel approximation, it is assumed that βwij(r) is sufficiently small so that e−βwij(r) ≈ 1 − βwij(r) and the following well-known expressions are valid for r ≥ a
 | (10) |
 | (11) |
 | (12) |
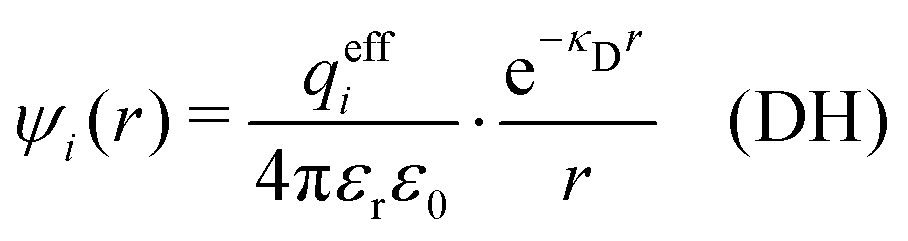 | (13) |
 | (14) |
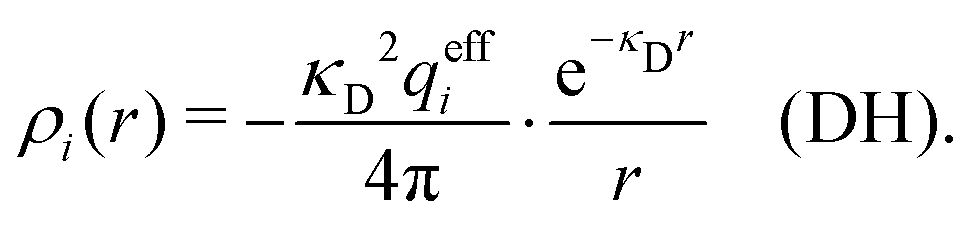
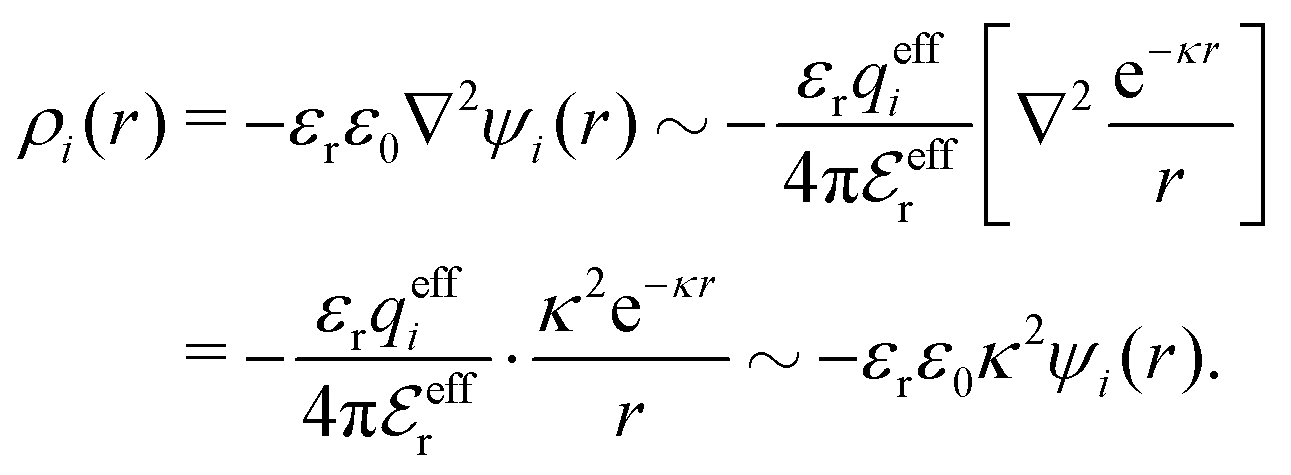
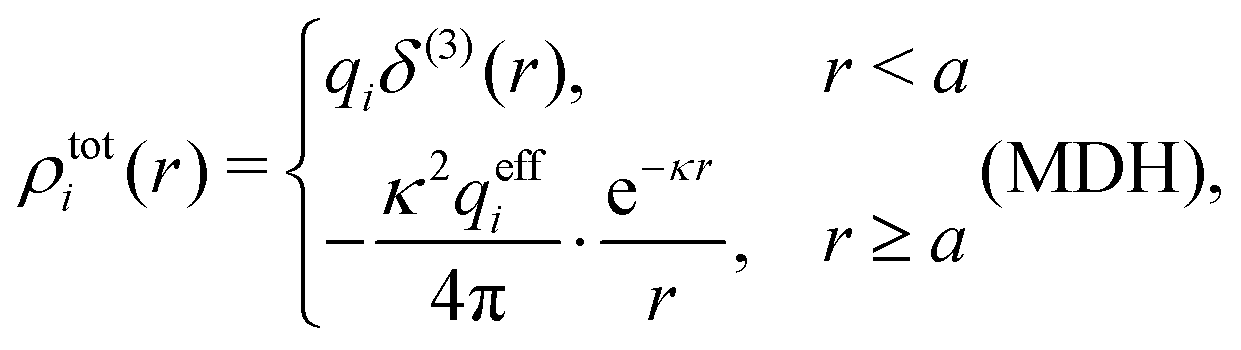
The total charge density associated with an i-ion, including the charge of the ion itself, is ρtoti(r) = qiδ(3)(r) + ρi(r), where δ(3)(r) is the three-dimensional Dirac delta function. The charge density must satisfy the condition of local electroneutrality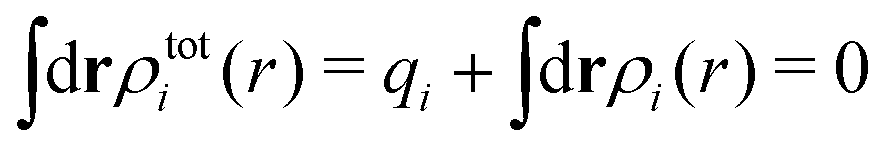 , which is satisfied for ρi in eqn (11) and (14). The electrostatic potential is given by the solution to Poisson's equation −εrε0∇2ψi(r) = ρtoti(r) and can be written as
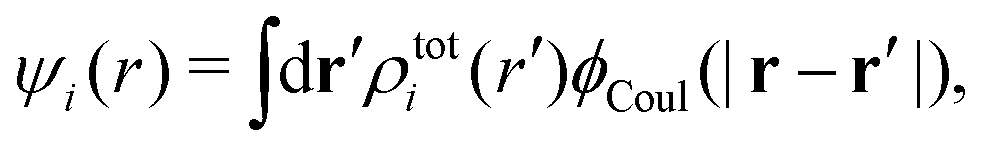 | (15) |
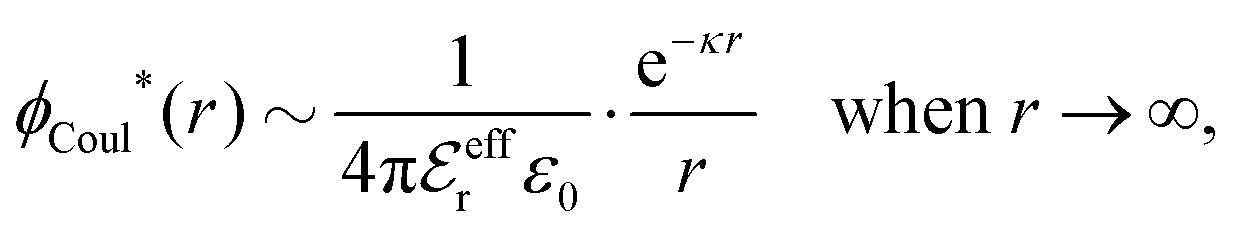
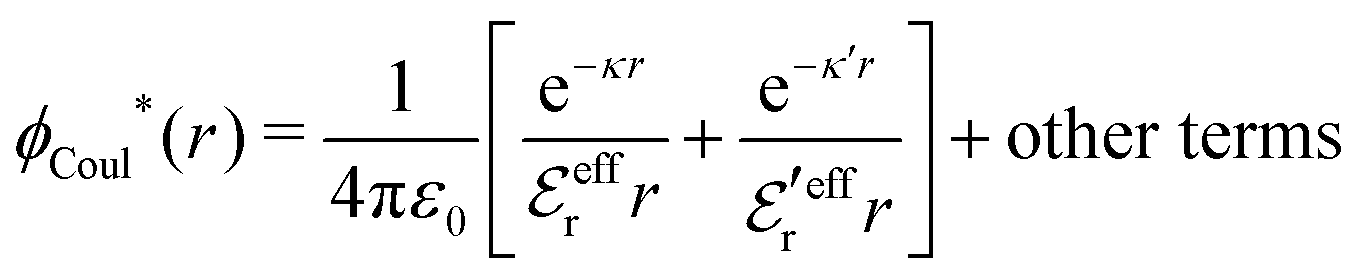
The (unit) screened Coulomb potential in electrolytes can be defined from the potential ψq(r) from a point charge q in the limit of zero q in the following manner||
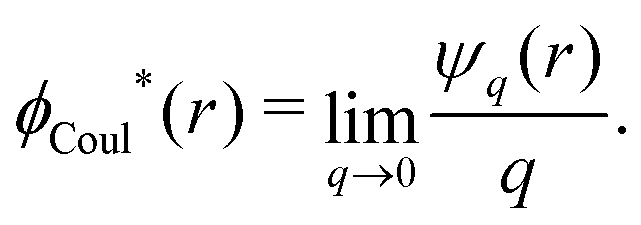
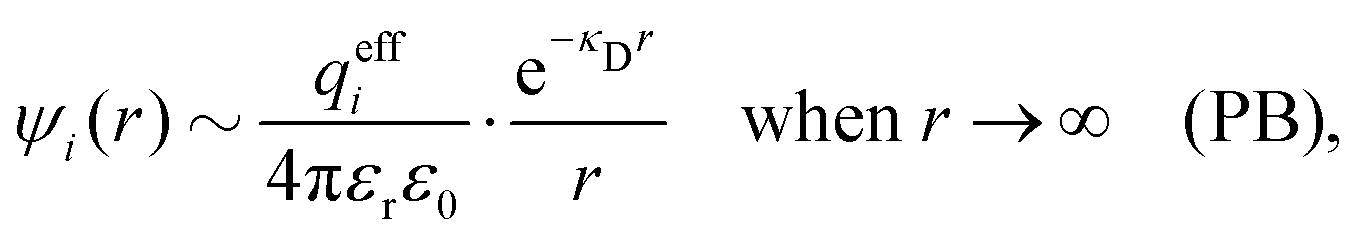
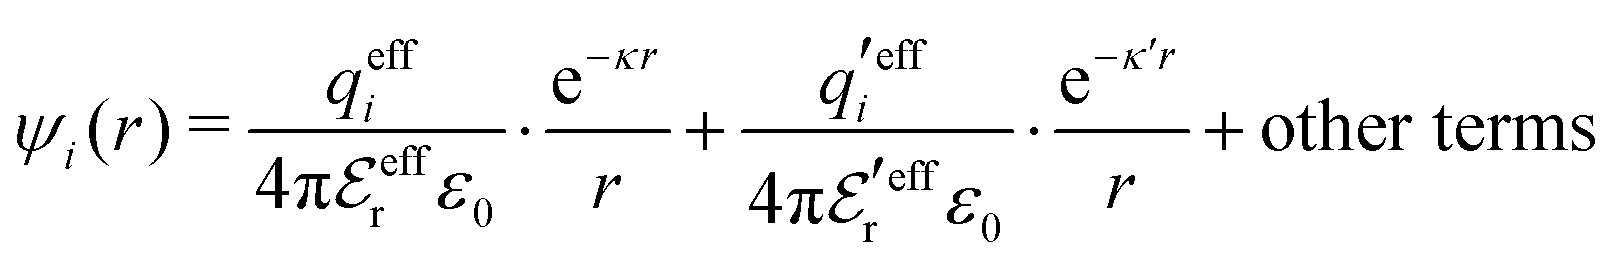
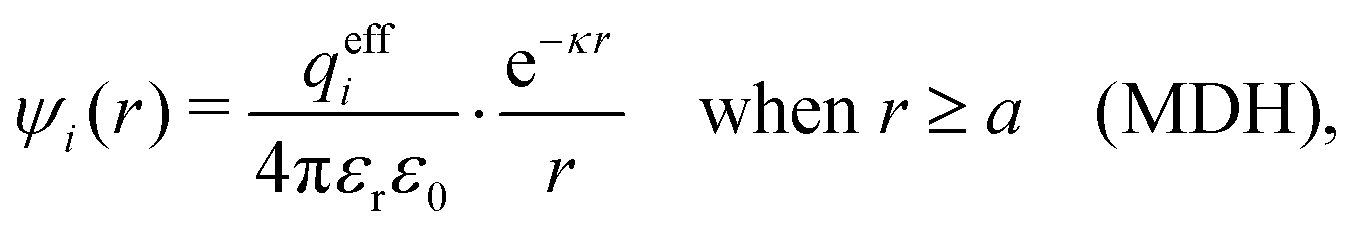
This function governs the spatial propagation of electrostatic potentials in the electrolyte. In the DH approximation we have ψi(r) = qeffiϕCoul*(r) for r ≥ a and in the PB case ψi(r) ∼ qeffiϕCoul*(r) for large r.

Also in the general (exact) case, ϕCoul*(r), wij(r) and the other functions decay like a Yukawa function if the density is not too high, but the decay parameter κ deviates from κD and the prefactors have other values. In exact statistical mechanics, all ions are treated on the same basis, which means that wij is symmetrical with respect to i and j and all ions have an effective charge qeffl ≠ ql for l = i, j. Dressed Ion Theory (DIT),22,23,100,101 which is an exact reformulation of classical, equilibrium statistical mechanics of electrolytes in the fluid state, gives a formalism to handle these matters. Provided that the ion density is not too high we have from DIT
 | (16) |
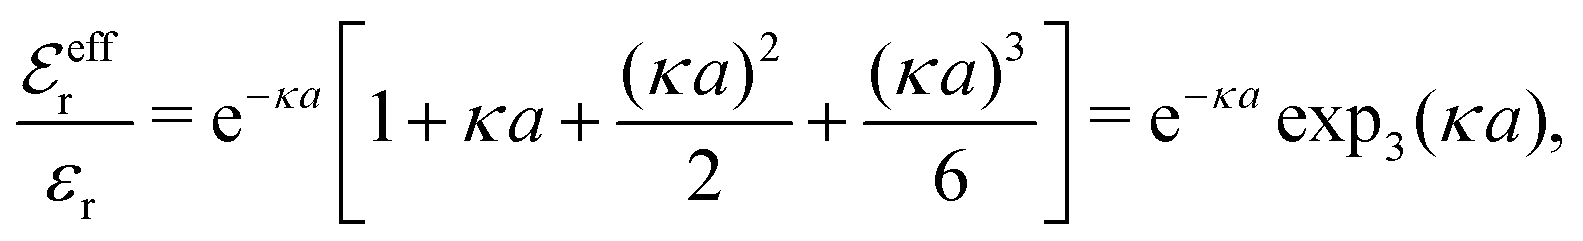
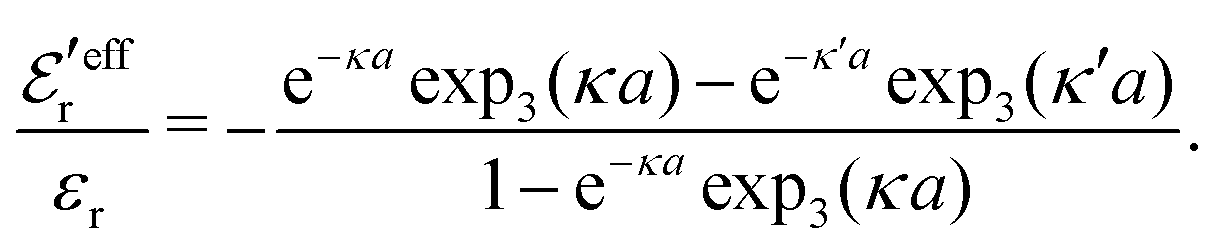
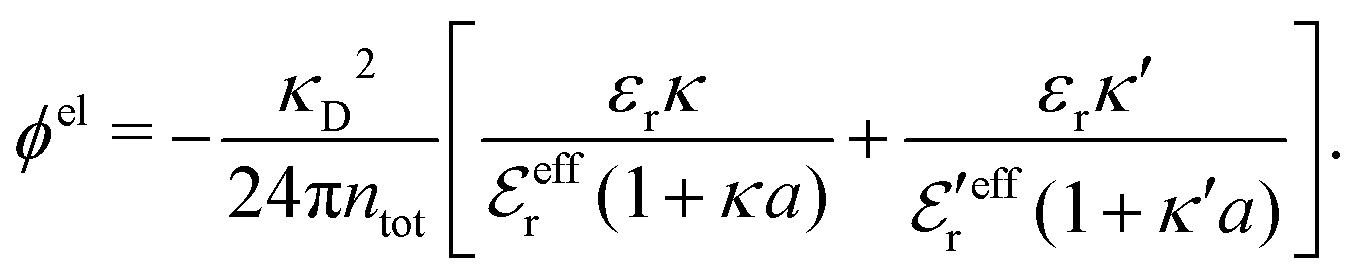
 is an effective dielectric permittivity of the electrolyte that differs from the dielectric constant εr of the solvent. Thus
  specifies the magnitude of the tail of ϕCoul*(r) for large r and gives a measure of the dielectric response of the electrolyte. In the PB and DH approximations one sets
  equal to εr, so the dielectric constant of the pure solvent is used in ϕCoul* of these approximations instead
  , which is of a property of the electrolyte.
The mean electrostatic potential due to an i-ion decays like
 | (17) |
 in the denominator instead of εr. Note that ψi(r) ∼ qeffiϕCoul*(r) like in the PB approximation. Furthermore,
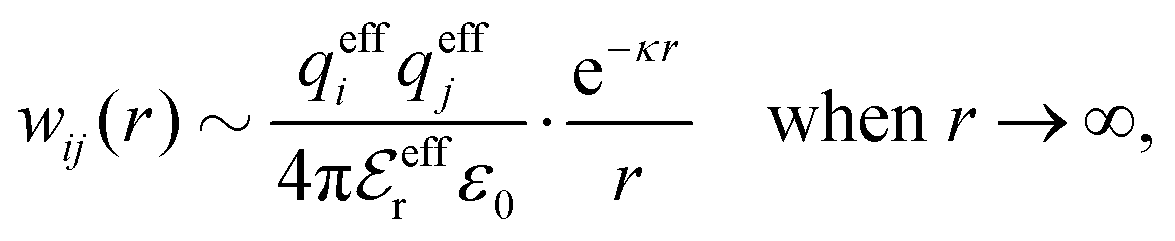 | (18) |
 from the distribution functions of the system,** but we will not enter into any details here.
The appearance of the product qeffiqeffj in wij(r) of eqn (18) has some immediate, important consequences. Using eqn (17) we see that wij(r) ∼ qeffjψi(r) for large r, so the effective charge appears as the prefactor instead of the actual charge qi that one has in the PB approximation wij(r) = qjψi(r). Recall that the latter equation caused the incorrect symmetry of eqn (9). Since hij(r) ∼ −βwij(r) for large r we have from eqn (6)
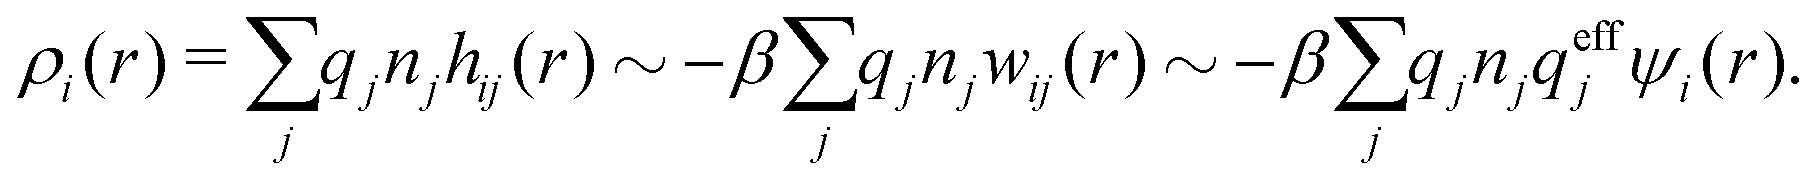
By comparing the rhs of these two equations we see that the decay parameter κ is given by
 | (19) |
 and κ → κD.
To conclude, the radial charge density decays like
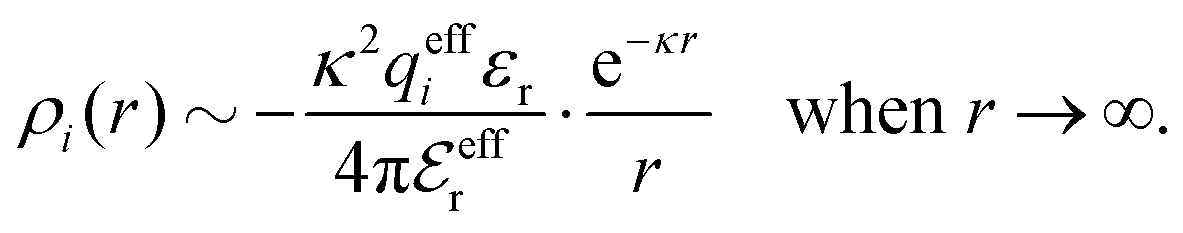 | (20) |
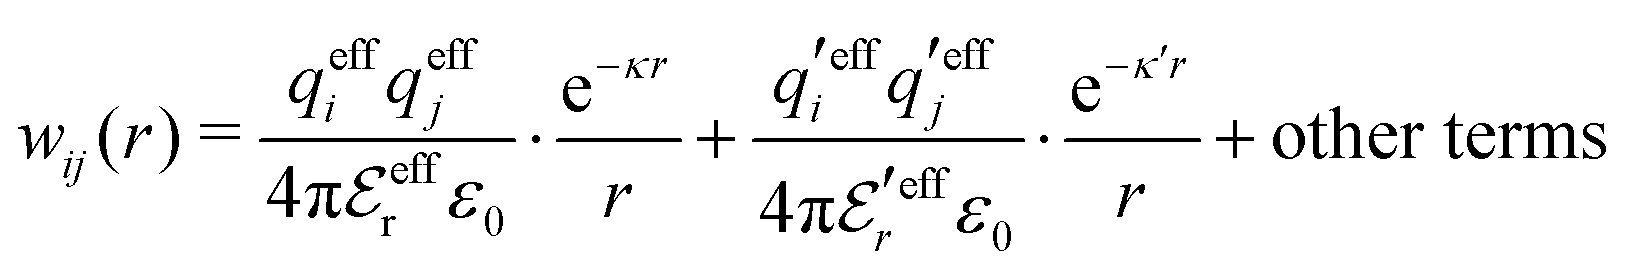
Eqn (18) only describes one decay mode of wij(r) of the electrolyte system. As mentioned in the Introduction, there exist several decay modes with different decay parameters, κ, κ′ etc. and we have22,23,106 the likewise exact result
 | (21) |
 and
and  . The decay parameter κ′ is given by
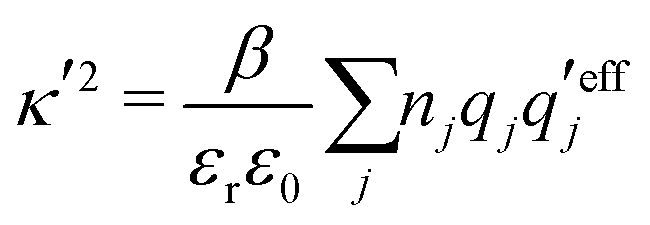 | (22) |
 | (23) |
As an alternative to eqn (19) and (22), one can express both of them as
 | (24) |
The various decay modes in eqn (21) and (23) give the following principal contributions to the electrostatic potential and charge density for r ≥ a
 | (25) |
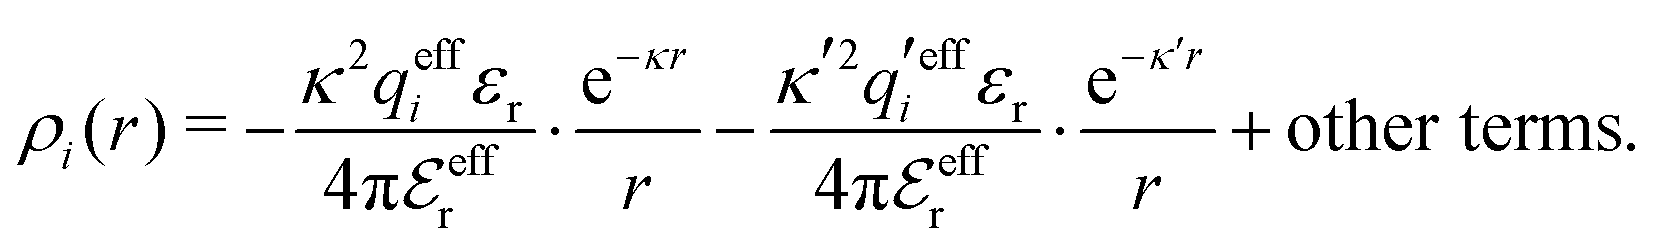 | (26) |
For elevated ion densities, the leading decay of wij(r), ϕCoul*(r), ψi(r) and ρi(r) for large r become exponentially damped oscillatory at a Kirkwood cross-over point. This is included in eqn (21), (23), (25) and (26) and corresponds, as we have seen, to a pair of decay parameters that become complex-valued, κ = κℜ+ iκℑ and  . This behavior cannot be obtained in the PB approximation since κD is a real number. The entities qeffi and
  also become complex-valued at the cross-over point and the corresponding primed quantities become the complex conjugates of the unprimed ones. Beyond the Kirkwood point, the two first terms in eqn (26) yield when r → ∞
 | (27) |
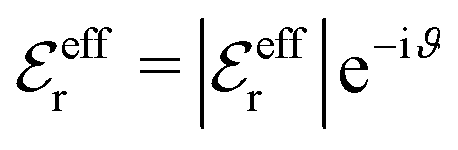
 , qeffi = |qeffi|e−iηi and κ = |κ|e−iθ with real ϑ, ηi and θ and where we have defined αi = ηi + 2θ − ϑ.
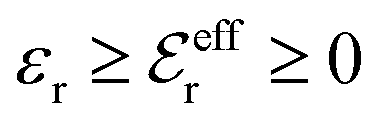
One can show23,101 that before the Kirkwood crossover point we have  and
and  and that
  and
and  go to zero at that point. Thus
  goes from εr to 0 when the ion density varies from zero to the Kirkwood point. The sum of the two first terms in the rhs of eqn (26) remains, however, finite at that point since the two infinities from
  and
and  in the respective term have different signs and cancel each other.
In this paper we will explore approximations that express the electrostatic correlations in terms of the decay modes with different κ values. We will thereby make the following Ansatz for the electrostatic part welij of the potential of mean force
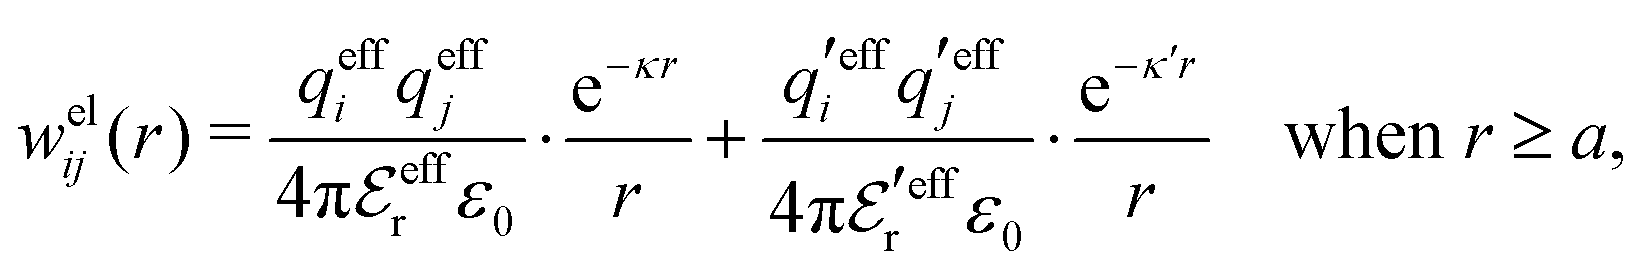 | (28) |
Our approximation (28) is similar to the so-called exponential Debye–Hückel (DHX) approximation,71,107 where the rhs of eqn (9) is used as an approximation for wij(r) in gij(r) = e−βwij(r), that is,
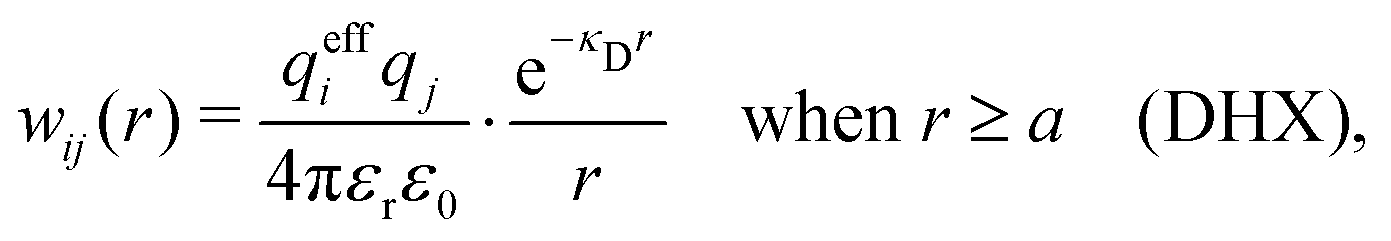 | (29) |
Our Ansatz (28) is accordingly an extension of the DHX approximation to several decay modes. A major difference between it and the DHX approximation is that the effective entities qeffi,  etc. in eqn (28) can be determined in a self-consistent manner from requirements that need to be fulfilled. In contrast, qeffi in the DHX approximation is explicitly determined by eqn (12) from the system parameters like density, temperature etc., which leads to the violations mentioned earlier.
In the main approximation of the current paper, the electrostatic response is linearized. This approximation will be denoted as the Multiple-Decay Extended Debye–Hückel, MDE-DH, approximation and is used in the first part of the current work, before Section 5. The linearization motivates the designation “an extended Debye–Hückel approximation,” since the DH approximation is a linear approximation for the electrostatic response. In the last part of the work, nonlinear contributions are studied and an extended DHX approximation is used.
Approximations that explicitly deal with several decay modes have been proposed earlier. Xiao and Song48–50 have developed a linear theory for electrolytes that they designate as a molecular Debye–Hückel theory (they use the acronym MDH, which should not be confused with MDH used in the current work). This theory, which is based on DIT, focuses on the decay modes of ψi(r) as expressed in eqn (25) with several Yukawa function terms present, one for each decay mode with decay parameter κl. These modes are obtained from the static dielectric function ![[small epsilon, Greek, tilde]](https://www.rsc.org/images/entities/i_char_e0de.gif) (k), where k is the wave number, via an equation that is equivalent to eqn (24).§§ They write ψi(r) in terms of the Yukawa functions of all decay modes,
(k), where k is the wave number, via an equation that is equivalent to eqn (24).§§ They write ψi(r) in terms of the Yukawa functions of all decay modes, 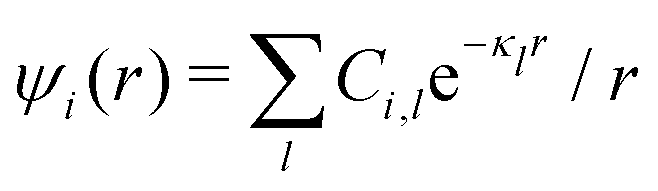 for r ≥ a, where l in principle runs over all modes, whereby they neglect all other contributions to ψi. In practice the sum is limited to a few modes. The coefficients Ci,l are determined from equations that use the dielectric function (k) as input, whereby the latter can be taken from various theories like the MSA, LMPB, MDH or HNC approximations. The results are then used to calculate thermodynamical properties of the system. This approximation is closely related to the simplest version of the MDE-DH approximation of the current work, but it is not identical because the latter contains nonlinear contributions, which are important in the pair distributions and for thermodynamical consistency, as will be seen.
Another approach is that of Outhwaite and Bhuiyan,31 who have used the LMPB approximation to calculate ψi(r) in manner that also shares features with the simplest version of the MDE-DH approximation in the present work. They obtain κ and κ′ as the two smallest solutions of the LMPB equation for the decay parameters, whereby ψi(r) is approximated for r ≥ 2a like in eqn (3) and obtained for r < 2a by other means. The coefficients that correspond to C and C′ are determined via various alternative conditions on ψi, where one alternative is essentially the same as in the current work.
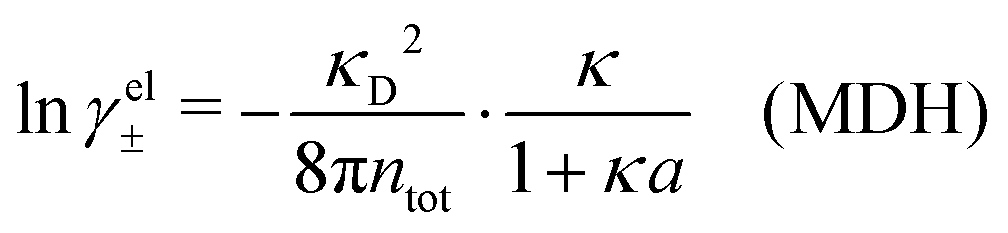
3 Modified Debye–Hückel approximations with a single decay-length
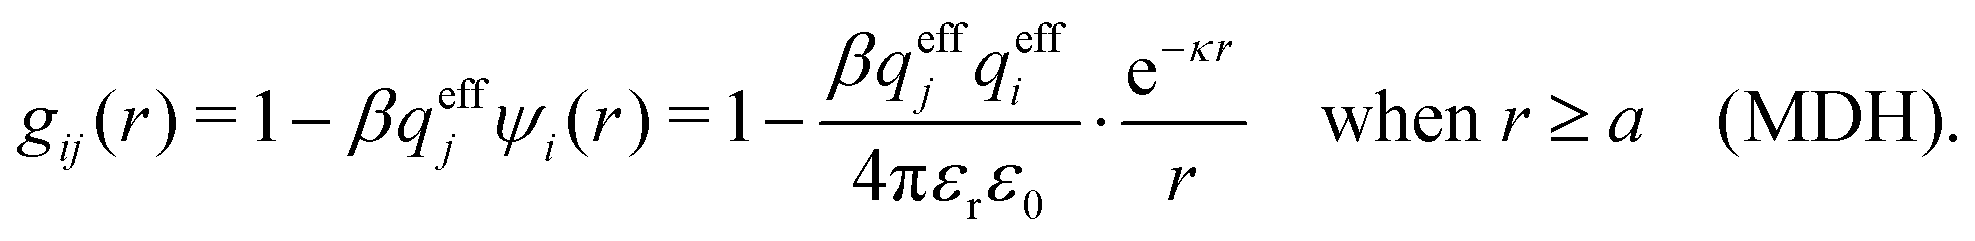
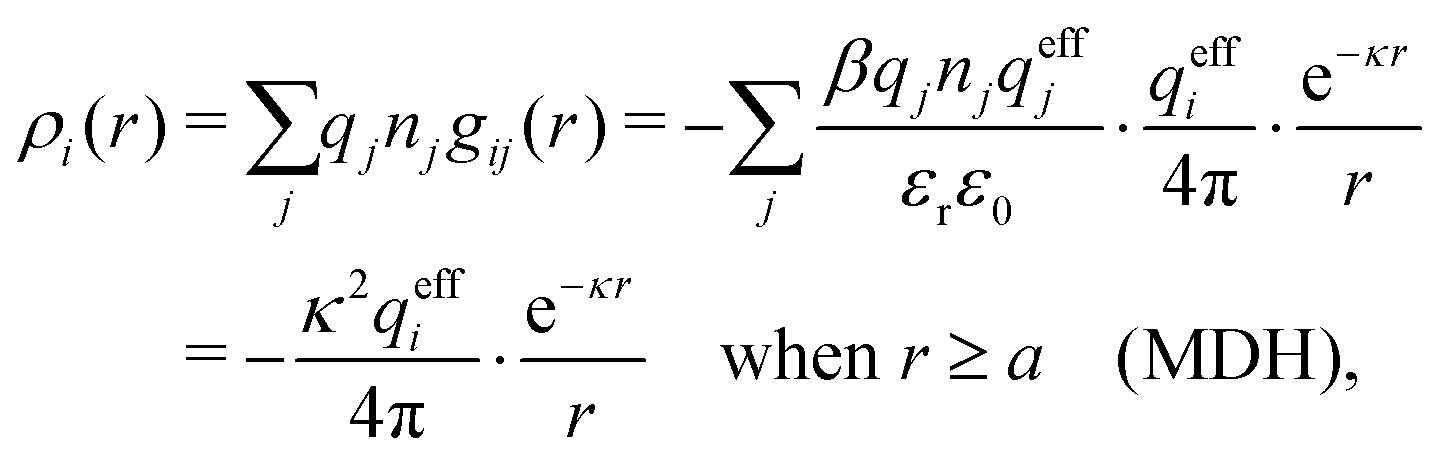
We saw in the Introduction that several approaches with a single decay lengths go quite a long way towards the objective to accurately obtain thermodynamical entities for electrolytes in a simple manner. In order to explicitly see why a single mode nevertheless is not sufficient in general, we will investigate two such approaches that are particularly relevant for the understanding of the approximations suggested in the current work.As a preparation for the Multiple-Decay Extended DH approximation, let us consider the Modified Debye–Hückel (MDH) approximation by Kjellander,32 where one uses the following Ansatz with a single decay mode
 | (30) |
 , so the value of
  for low ion densities is assumed. Like the DH approximation, MDH is a linear approximation where the charge density of the ion cloud around an ion is proportional to the charge qi. It can therefore be valid only for sufficiently low electrostatic coupling (high temperatures and/or high εr). By inserting eqn (30) into the condition of local electroneutrality we obtain
which gives
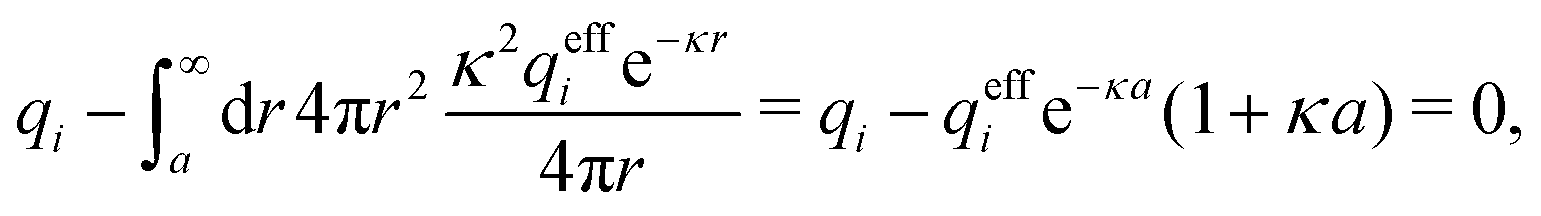
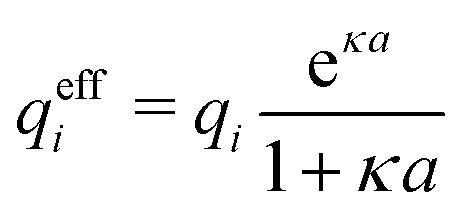 | (31) |
 | (32) |
The deviation of qeffi from qi expressed by eqn (31) is caused simply by the excluded volume that the ionic core gives rise to in the radial charge distribution. When all ions are treated on the same basis so all have qeffj ≠ qj, this deviation has quite far-reaching effects as we now will see. By inserting eqn (31) into the exact eqn (19) and using eqn (1) we obtain the MDH result32
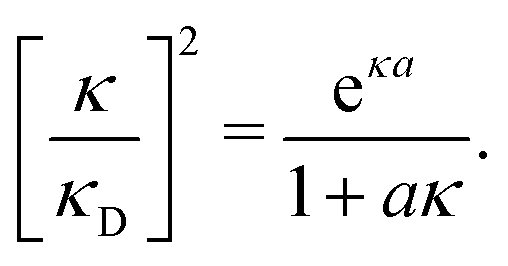 | (33) |
In order to illustrate how the solution to eqn (33) behaves, let us write eqn (33) as f(κa) = κDa, where f(x) = [x2(1 + x)/ex]1/2 and plot f as function of κa. This function is plotted as the full curve in Fig. 1 and the solution is the intersection point between the curve and a horizontal line at f = κDa; the figure shows an example with κDa = 0.477 for which the intersection (full circle) occurs at κa = 0.500. In the figure we see that there is a second intersection point, which is shown as an open circle. This point also corresponds to a solution of eqn (33), which hence has two solutions for κ which we will denote as κ and κ′, respectively. These two solutions exists for any κDa < 1.346, which is the maximum of the curve; the latter occurs for  and is marked by a full square in the figure. The function f(x) goes to zero when x → ∞, so the right-hand intersection occurs for increasingly large κa when κDa goes to zero, which means that κ′ → ∞ in this limit. As we will see shortly, this solution is physically relevant and gives rise to a second decay mode.
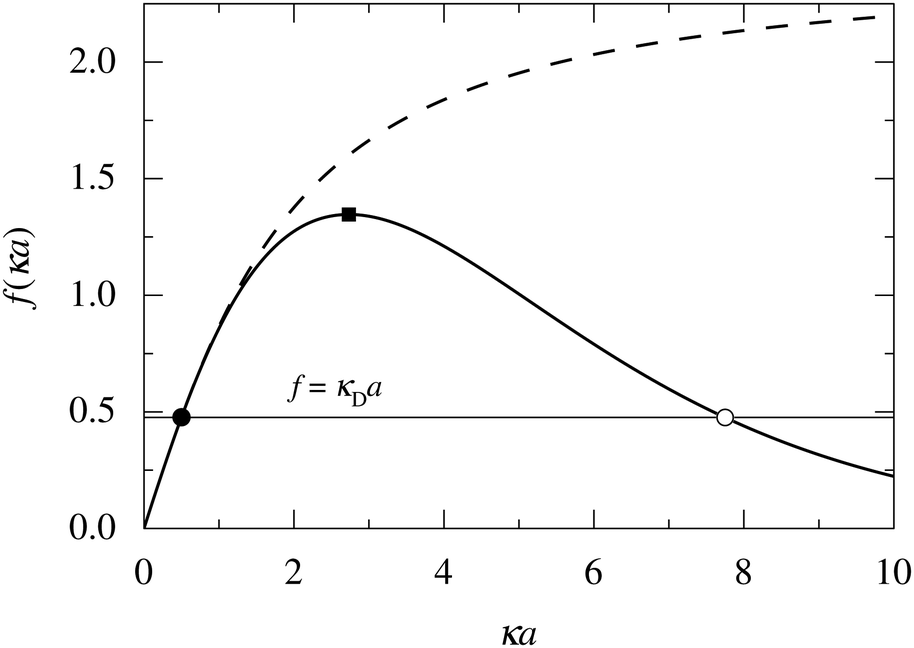 | ||
| Fig. 1 Plots of f(κa) for two different functions: the full curve shows f(x) = [x2(1 + x)/ex]1/2 and the dashed curve shows f(x) = [x2(1 + x)/exp3(x)]1/2, where exp3(x) is an exponential sum function defined in eqn (37). The horizontal line shows f = κDa with κDa = 0.477. This line has two intersections with the full curve that are shown as a full circle and an open circle, respectively. The two intersections correspond to the two solutions κ and κ′ of eqn (33) when κDa = 0.477. The maximum of the full curve is marked with a full square. | ||
We have thus shown that eqn (33) has two solutions κ and κ′ with κ < κ′, where κ goes to κD and κ′ goes to infinity when κDa goes to zero, or in other words, when the ion density goes to zero. The two solutions κ and κ′ appear despite the fact that the MDH theory was set up by using the ansatz in eqn (30) with only one κ parameter. This is an inconsistency that we will resolve later. When the ion density and hence κDa are increased, κ and κ′ approach each other and beyond κDa = 1.35, i.e., above the maximum in Fig. 1, the solutions κ and κ′ to eqn (33) become complex-valued, κ = κℜ + iκℑ and  , which is in agreement with the general result mentioned above in Section 2.¶¶
The values of κ/κD, κ′/κD, κℜ/κD and κℑ/κD from the solutions to eqn (33) are plotted as functions of κDa in Fig. 2a and are compared with results from Monte Carlo (MC) simulations and Hypernetted Chain (HNC) approximation calculations of the decay of ψi(r) and ρi(r) for a 1:1 electrolyte in water at room temperature with a = 4.6 Å. These results also correspond to a classical 1:1 plasma in vacuum (εr = 1) when T = 23400 K, which has the same value of kBTεr. The HNC approximation is very accurate for these systems. It is seen in the figure that the predictions from eqn (33) agree very well with the MC and HNC results, including the Kirkwood crossover point and beyond.|||| This is quite remarkable considering the humble origin of eqn (33). Obviously, the second root of eqn (33) and the cross-over to oscillatory decay have a great physical relevance. We will explore this in the next section. Fig. 2b shows a plot of κℜ/κD and κℑ/κD from eqn (33) for larger values of aκD. Other linear approximations like the MSA and LMPB theories, which are considerably more complicated, give predictions that are very similar to those shown in the figure.
 | ||
| Fig. 2 (a) Decay parameters divided by the Debye parameter κD for a 1:1 aqueous electrolyte solution at room temperature as functions of κDa, which is proportional to the square root of the ion density. The same results apply to a classical 1:1 plasma in vacuum at T = 23400 K. Thick curves: obtained from the solutions of eqn (33); thin curves: HNC results and open symbols: MC simulation results. The Kirkwood crossover point is shown as a filled symbol for the HNC results and those from eqn (33). The MC data are taken from ref. 18 and the HNC data from ref. 21 and 22. (b) The real and imaginary parts of κ from eqn (33) divided by κD. | ||
Apart from the local electroneutrality condition that the charge distribution has to fulfill, there is also the Stillinger–Lovett second moment condition108 that must also be fulfilled. This condition expresses the fact that from the point of view of electrostatics, electrolytes behave like perfect conductors. It can be formulated as
 | (34) |
We may strictly enforce the Stillinger–Lovett condition by refraining from the assumption that  and select the value of
  so that eqn (34) is satisfied. Guided by eqn (20) we then take
 | (35) |
 | (36) |
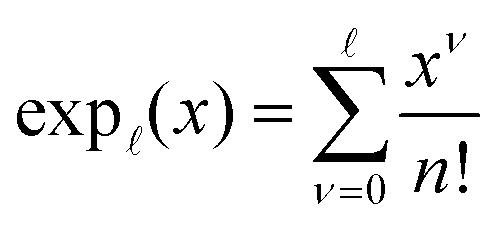 | (37) |
 for κa < 1, so it is a good approximation to set
  for low to medium ion densities as done in the MDH approximation.
By applying the local electroneutrality to eqn (35) we obtain
 from eqn (36) to get the last equality. Using eqn (19), we obtain
 | (38) |
This is a clear example of the fact that one may not achieve an improvement of an approximate theory by enforcing a necessary condition. The problem is that it is too restrictive to assume that there only exist one decay mode e−κr/r for the charge density, so the enforcement of the Stillinger–Lovett condition leads to a theory that gives qualitatively incorrect results for high ion densities. In order to obtain a Kirkwood crossover point we need two decay modes e−κr/r and e−κ′r/r. Thereby the oscillatory decay for high ion densities can be obtained in a correct manner. The MDH and SCSL approximations with a single decay mode can be used only for low to moderate ion densities. We will return to the SCSL approximation in Section 5; here we will continue with MDH approximation that is more accurate.
The MDH Ansatz (30) corresponds, as we will verify shortly, to the approximations wij(r) = qeffjψi(r) and gij(r) = e−βwij(r) ≈ 1 − βwij(r), so by inserting ψi from eqn (32) we obtain
 | (39) |
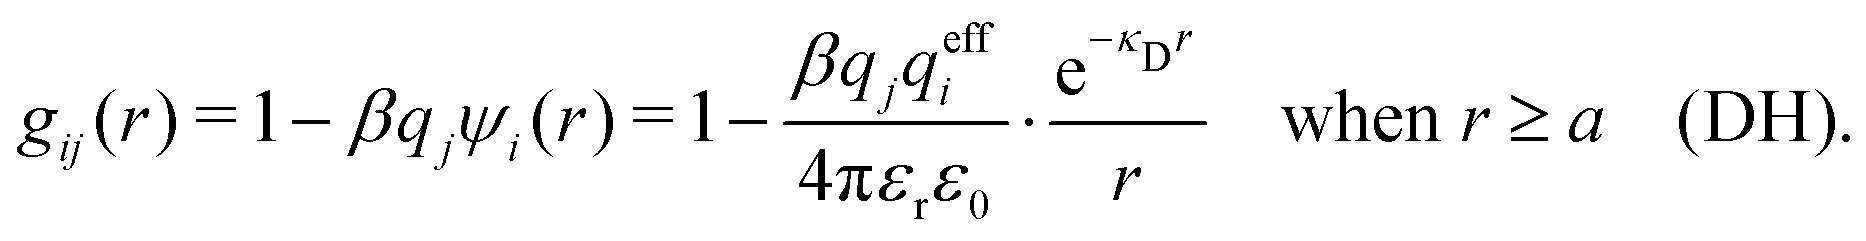 | (40) |
The gij(r) in eqn (39) gives the charge density in eqn (30), as can be easily verified as follows. We have
 | (41) |
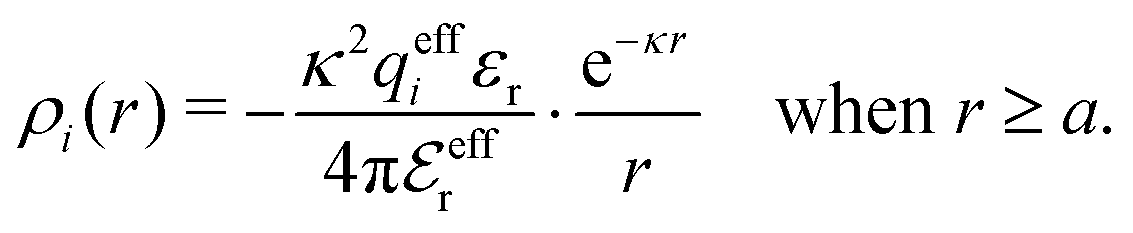
 . This is the same as the second line in eqn (30). In the DH approximation we instead obtain the charge density given by eqn (14) for r ≥ a
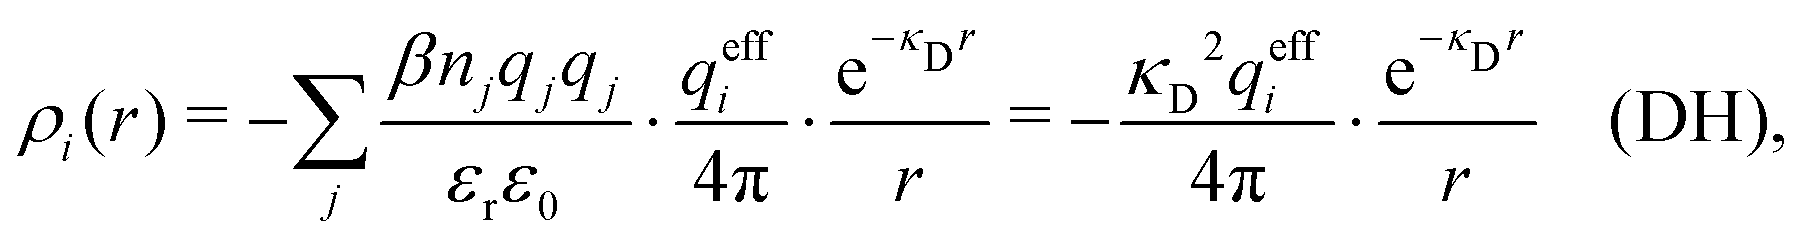 | (42) |
The total ion density around an i-ion is equal to  . In the DH and MDH approximations, this density is equal to the bulk value ntot for r ≥ a because it follows from eqn (39) and (40) that
  .
.
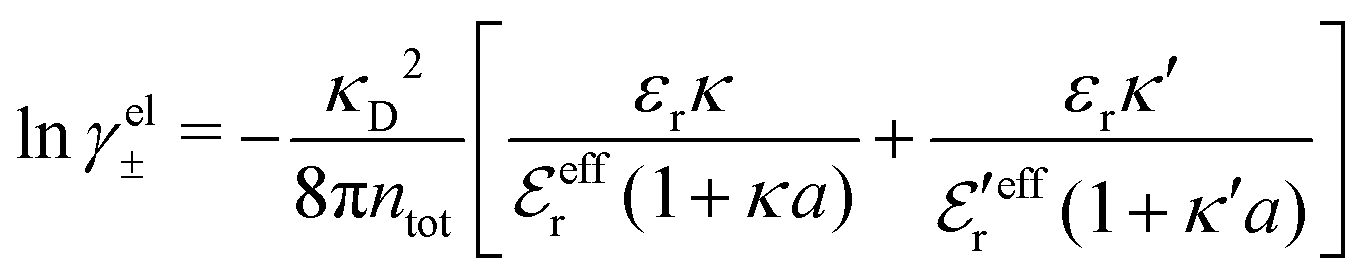
4 Debye–Hückel extensions with multiple decay lengths
4.1 Decay parameters and effective permittivities
To resolve the inconsistencies of the single decay mode approaches, we use eqn (26) as basis for a better approximation. We take the first two terms as an Ansatz that we assume holds for all r ≥ a | (43) |
The Ansatz in eqn (43) constitutes an important ingredient of the simplest version of the MDE-DH approximation, which we will denote as the Simple MDE-DH approximation. We will later formulate the Complete MDE-DH approximation [see eqn (54), (55) and (97)], but eqn (43) is sufficient in many cases and works very well provided that the ion size is not too large and core–core correlations are not too prominent.
By applying the local electroneutrality 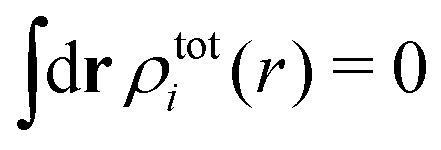 to eqn (43) and using eqn (31) and its analogue for the primed quantities, we can readily deduce that
 | (44) |
 and
and  we need one more equation, which we can obtain by applying the Stillinger–Lovett condition to the ansatz in eqn (43) and use the exact eqn (19) and (22). This yields
 | (45) |
 and
and  imply that
 | (46) |
 | (47) |
 and
and 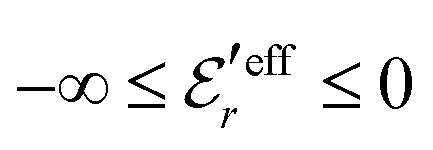 , so
, so  is negative in agreement with the general results mentioned in Section 2. The value zero occurs at the Kirkwood point, that is,
as follows from eqn (46) and (47). This is also in agreement with the general exact results mentioned in Section 2. In the limit of infinite dilution where
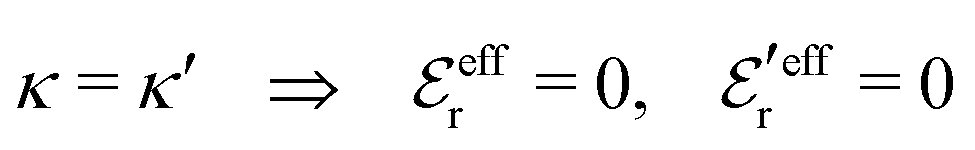
 and
and  , the second term in eqn (43) vanishes and eqn (30) becomes valid, but close to the Kirkwood cross-over point this second term is about equally important as the first term.
In the top frame of Fig. 3 the values of  from eqn (46) are compared to results from MC simulations and the HNC approximation for the same system as in Fig. 2. The agreement is good; the curve from the present theory is somewhat shifted horizontally relative to that from HNC due the the slight difference in Kirkwood point as seen in Fig. 2. The prediction for
  is plotted in the bottom frame of Fig. 3.
 | ||
Fig. 3 The ratios  (top frame) and (top frame) and  (bottom frame) as functions of κDa. The full curves show the result from eqn (46), the dashed curve show HNC results and the symbols show MC simulation results. The HNC and MC data are taken from ref. 18 for the same system as in Fig. 2 (see ref. 21 and 22 for further HNC data). Note the difference in ordinate scales of the two frames. (bottom frame) as functions of κDa. The full curves show the result from eqn (46), the dashed curve show HNC results and the symbols show MC simulation results. The HNC and MC data are taken from ref. 18 for the same system as in Fig. 2 (see ref. 21 and 22 for further HNC data). Note the difference in ordinate scales of the two frames. | ||
For the case where κ is complex-valued, κ = κℜ + iκℑ, we write  and
and  . One then obtains from eqn (44) that
 | (48) |
 | (49) |
In Fig. 4 we have plotted
 and ϑ as functions of κDa. At the Kirkwood crossover point, to the left in the figure, we have
  and ϑ = π/2.
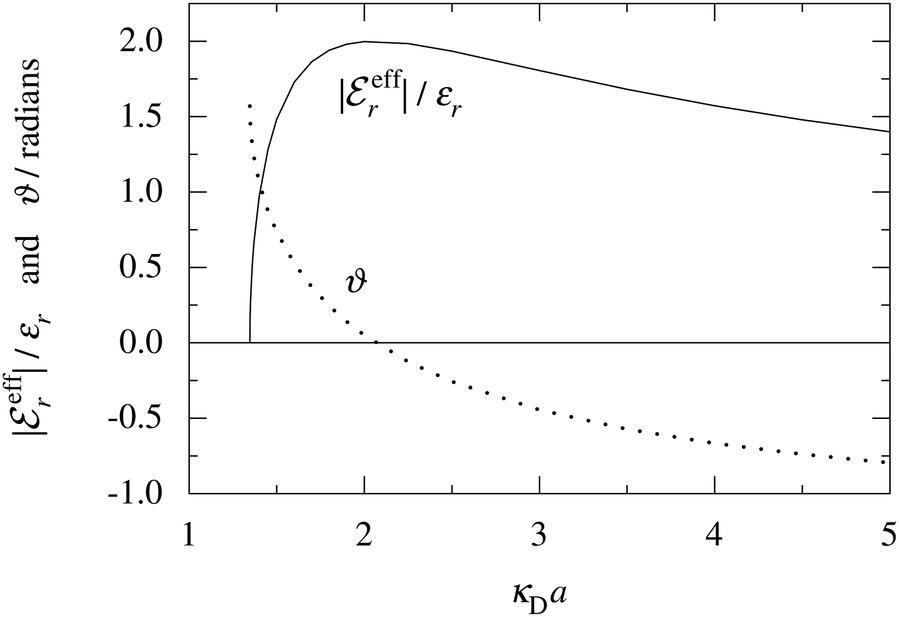 | ||
Fig. 4 The ratio  and the phase angle ϑ of and the phase angle ϑ of  from eqn (48) and (49) as functions of κDa beyond the Kirkwood crossover point where κ is complex-valued. from eqn (48) and (49) as functions of κDa beyond the Kirkwood crossover point where κ is complex-valued. | ||
For complex-valued κ and κ′ the radial charge distribution is oscillatory and the second line of eqn (43) can be written as (cf.eqn (27))
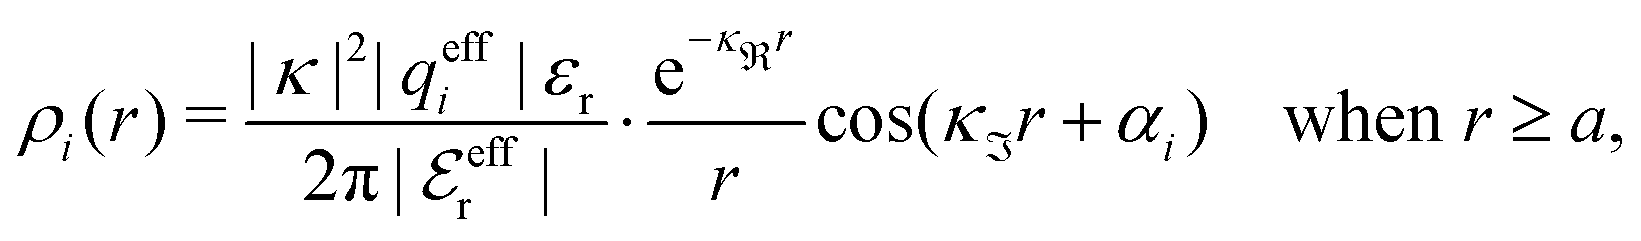 | (50) |
 , qeffi = |qeffi|e−iηi and κ = |κ|e−iθ as before. Note that θ = −arctan(κℑ/κℜ).
4.2 Radial distribution functions
For binary symmetric electrolytes, the number densities of cations and anions are equal, n+ = n− ≡ n, the ionic charges are q+ = −q− ≡ q, the absolute valency z = q/qe and ntot = 2n. For ions of equal diameter (the restricted primitive model, RPM) we also have ρ+(r) = −ρ−(r) ≡ ρ(r) and qeff+ = −qeff− ≡ qeff. From eqn (1) and (19) follow | (51) |
In the RPM, the electrolyte bulk phase is completely specified by the two dimensionless parameters βR ≡ βq2/(4πεrε0a) = z2B/a and τ = κDa; the latter is the abscissa of Fig. 2–4. Alternatively, any two independent combination of these two parameters can be used to specify an RPM system, like reduced total ionic density ntotR ≡ ntota3 = τ2/(4πβR) and the product βRτ. The inverse of the latter is the so-called plasma parameter 4πntot/κD3.
We will test the predictions of the Simple MDE-DH Ansatz in eqn (43) by comparing with results from MC simulations and HNC calculations for an electrolyte with βR = 1.55, which can be, for example, a 1:1 aqueous electrolyte solution at room temperature with ions of diameter a = 4.6 Å or a classical plasma of such ions in vacuum at T = 23400 K. Depending on the ion density (concentration), the parameter τ has different values. The radial charge distribution ρ(r) is calculated using κ and κ′ obtained from the solutions of eqn (33),  obtained from eqn (46) and
  from eqn (47). In Fig. 5 the function r|ρ(r)| as function of r for the cases of 0.5 and 0.7 M electrolytes is plotted on a semilogarithmic scale, whereby a Yukawa function decay becomes a straight line.
 | ||
| Fig. 5 The radial charge distribution ρ(r) for a 1:1 electrolyte plotted as rρ(r) as a function of r on a semilogarithmic scale. The ion diameter is a = 4.6 Å and the concentration is 0.5 M in frame (a) and 0.7 M in frame (b) [τ = κDa = 1.07 and 1.27, respectively, and βR = 1.55]. The open squares in frame (a) show results from MC simulations18 and in both frames the full curves show HNC results,18,21,22 the dotted curves show results from the Simple MDE-DH approximation, eqn (43), and the dashed curves show results from solely the first (leading) term in this equation. The unit for rρ(r) is qea−2. | ||
In Fig. 5a we see that the MC and HNC results virtually coincide with each other, so the HNC approximation is very accurate for the monovalent electrolyte. The prediction from eqn (43) (dotted curve) agrees very well with the MC and HNC results for all r except in a very short interval just outside the core region, 1 ≤ r ≲ 1.3a and the curves virtually coincide for r ≳ 2a. In Fig. 5b the agreement is equally good. The dashed curves are calculated from the first term in eqn (43), which is leading for large r. In Fig. 5b this curve coincides with the accurate results r ≳ 2.5a, but it deviates substantially from the dotted curve for smaller r values. This implies that the contribution from the second Yukawa term with decay parameter κ′ is important for the 0.7 M case. For the 0.5 M it is less important, but it still gives a noticeable contribution that makes the dotted curve to deviate from the dashed one. The difference in importance of the second term for the 0.7 and 0.5 M cases is due to the fact that the magnitude of  in the denominator of this term increases rapidly when the concentration is decreased, see Fig. 3. We can conclude that the Ansatz (43) gives very good results for the 1:1 electrolyte systems; the deviation for small r has little consequence in most cases and is caused by terms in ρ(r) with shorter decay lengths that are not included in the Ansatz.
This conclusion is supported by Fig. 6, which shows results for 0.1, 0.7 and 1.0 M electrolytes (the data for 0.7 M are the same as in Fig. 5b). Here, ρ(r) is plotted on a linear scale as 4πr2ρ(r), which is proportional to the amount of charge at distance r. The curves for 0.1 M show that the first term in eqn (43) dominates for nearly all distances; the second term is very small because  has very large magnitude when the concentration is low. The deviation from the HNC curve occurs, like for the other cases, mainly very close to the core region and has little consequence.
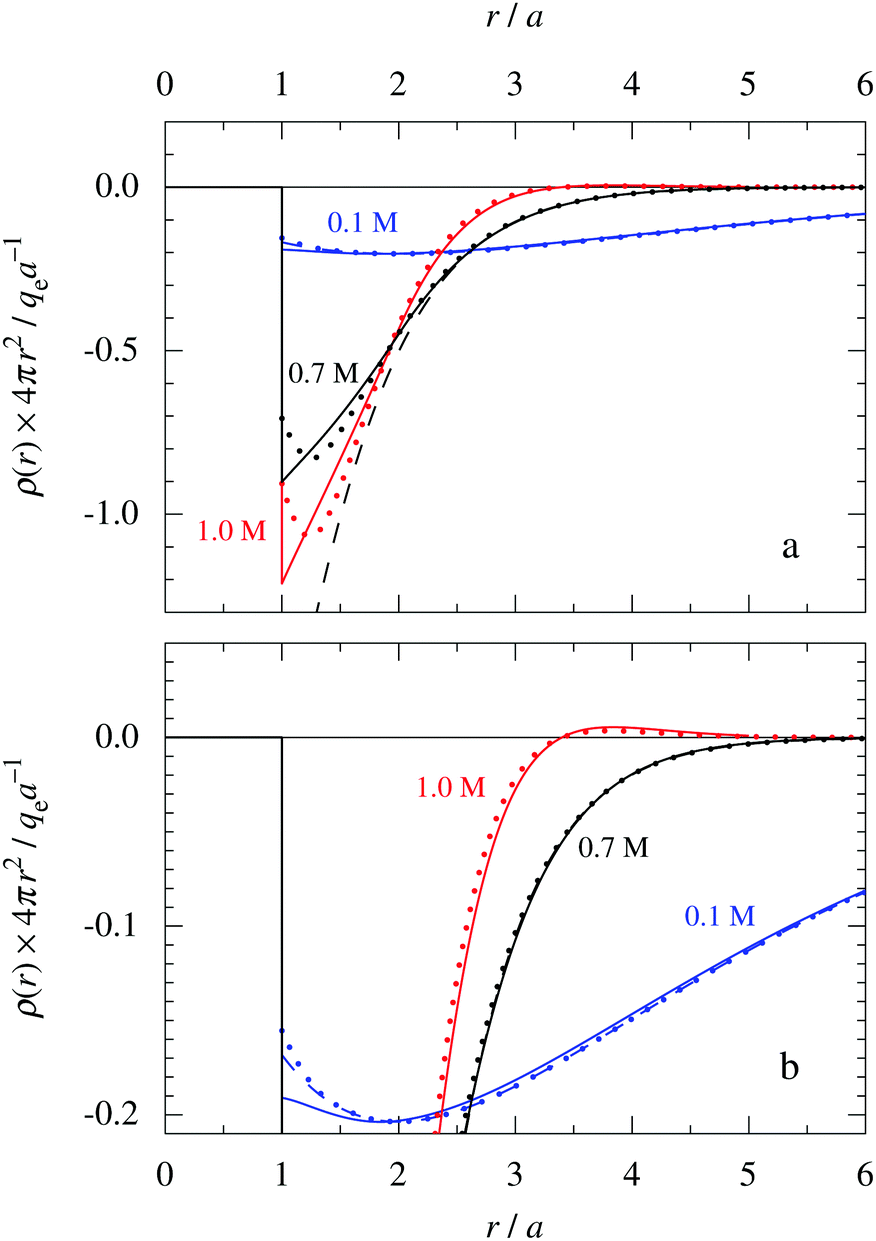 | ||
| Fig. 6 The radial charge density ρ(r) for a 1:1 electrolyte plotted as 4πr2ρ(r) as function of r. The ion diameter is a = 4.6 Å and the concentration is 0.1 M (red curves), 0.7 M (black curves) and 1.0 M (blue curves) [τ = κDa = 0.48, 1.27 and 1.51, respectively, and βR = 1.55]. For the cases 0.7 M (same as in Fig. 5b) and 0.1 M, the full curves show HNC results, the dotted curves show results from the Simple MDE-DH approximation, eqn (43), and the dashed curves show results from the first term in this equation. In the case of 1.0 M, the full curve shows the HNC data and the dotted curve show the results from eqn (50). The bottom frame shows a magnified view of the top one. The HNC data are from ref. 21 and 22. | ||
For the 0.7 M case in Fig. 6a, we can very clearly see the importance of the second Yukawa term, since without it, the deviation from the accurate HNC curve is large for r < 2a as apparent from the dashed black curve. Thus it is very important to have the two decay modes present in the theory in order to describe the electrolyte in an appropriate manner. This conclusion is, of course, further emphasized when κ and κ′ and become complex-valued at the Kirkwood cross-over point and give rise to oscillations at higher concentrations. The conditions for the 1.0 M case in Fig. 6 are beyond this point, so ρ(r) has an exponentially damped oscillatory decay. We then have complex  and the two terms in eqn (43) yield the expression for ρ in eqn (50). It is seen from the results from this equation, shown as the red dotted curve in the figure, that the agreement with the accurate HNC curve is about equally good as the results for the other concentrations. Note that the two red curves cross the abscissa axis at virtually the same point in Fig. 6b, which means that the phase α obtained from the Ansatz is very good.
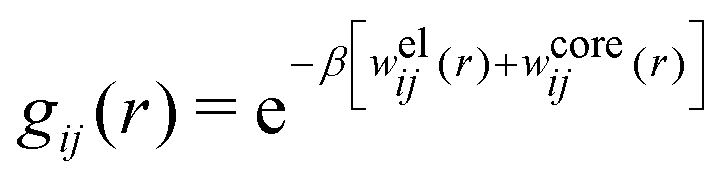
Let us now turn to the pair distribution function gij(r) = e−βwij(r). The Ansatz (43) can be obtained from eqn (28) for the electrostatic part, welij, of the potential of mean force. When βwij(r) is sufficiently small we can linearize the pair distribution function gij(r) ≈ 1 − βwij(r) and when the electrostatic contributions to wij dominate we can set wij(r) ≈ welij(r), so we have 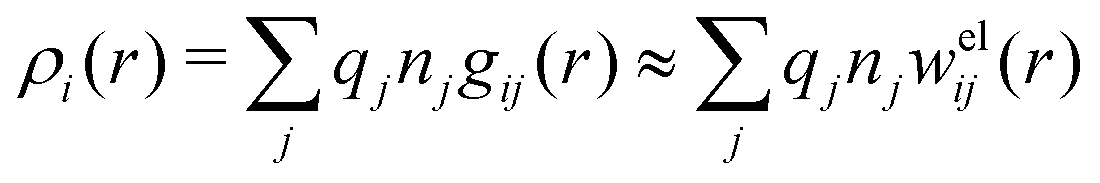 . By inserting eqn (28) and using eqn (19), we obtain eqn (43) [compare with the derivation of eqn (41)]. As we will see shortly, in the RPM the Ansatz (43) is valid also for somewhat more general conditions.
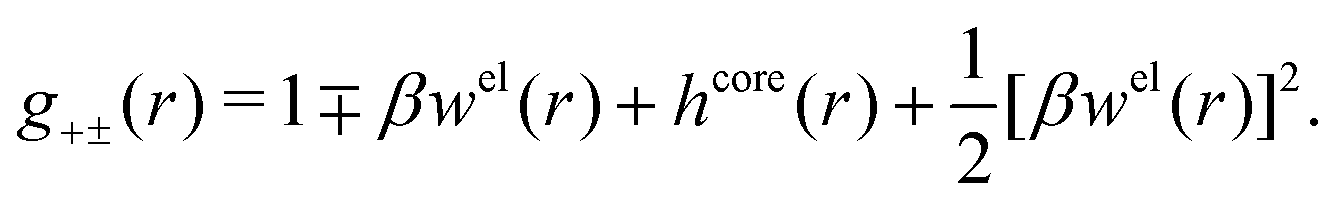
When the ion density is high, the approximation wij(r) ≈ welij(r) is insufficient because there are important steric contributions missing due to core–core correlations. The latter are in general coupled to the electrostatic correlations, so for simplicity, we will restrict ourselves to symmetric electrolytes in the RPM, where the density-charge correlation function is identically equal to zero and the coupling between electrostatic and core correlations is weak. We make the following Ansatz
 | (52) |
Eqn (52) together with the two-mode Ansatz for welij(r) in eqn (28) constitute a starting point for the formal development of the approximations used in the current work. The details are given in Appendix A. Here we will only give the main points.
In the RPM, the Ansatz (52) implies that
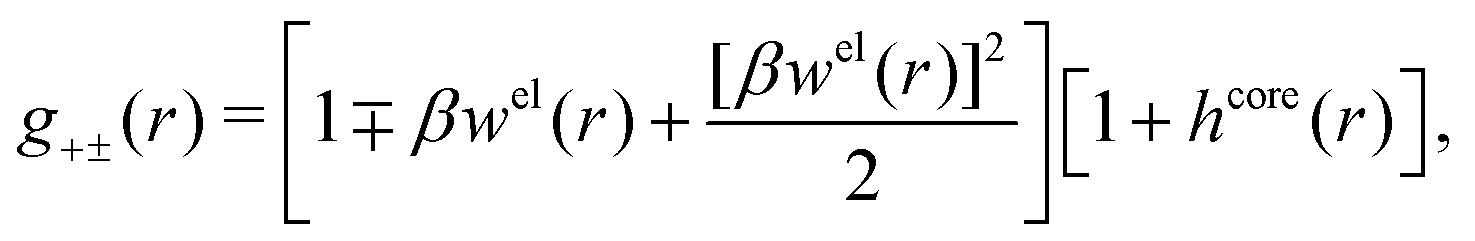
| g+±(r) = e−β[±wel(r)+wcore(r)] = e∓βwel(r)gcore(r) | (53) |
 | (54) |
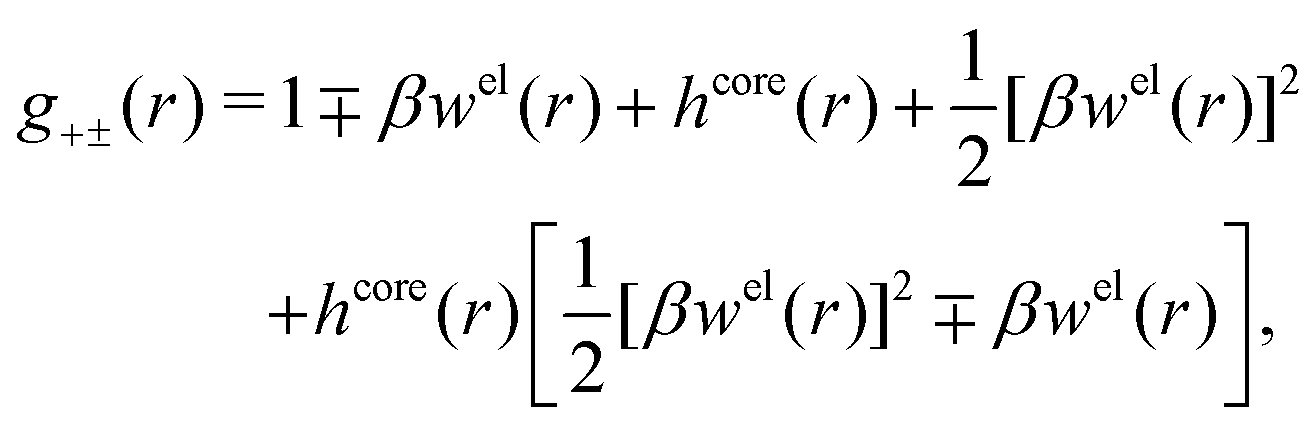
In the MDE-DH approximations we assume that βwel(r) is sufficiently small so that we can approximate e∓βwel(r) ≈ 1∓βwel(r) + [βwel(r)]2/2. We obtain
 | (55) |
 | (56) |
 | (57) |
The inclusion of a square term [βwelij(r)]2/2 from electrostatics has been done for a long time in some kinds of theories, for example as an improvement of the DH approximation with welij(r) given by eqn (29).10 In the present case, the use of the square term of welij(r) with two decay modes and with coefficients that makes gij(r) satisfy the required electroneutrality and second moment conditions gives, as we will see in the next section, thermodynamic consistency to a considerable degree. In, for example, the GMSA approximation24,47 one instead includes an empirical contribution with parameters that are selected to give thermodynamic consistency. The present approach does not contain any such parameters.
In systems where the core–core correlations are not very strong, it is a good approximation to neglect the cross-terms between hcore and wel in eqn (56) since they are of higher order and are smaller than the other terms for most separations r in such cases. We then obtain for r ≥ a
 | (58) |
 and
and  in eqn (44)–(49). The corresponding expressions in the Complete MDE-DH approximation are given in Appendices A and B.
Since we have retained solely the linear and quadratic terms in βwel in both MDE-DH approximations, their range of validity is clearly limited to systems at sufficiently high temperatures and/or high εr so that βR is sufficiently low. For monovalent ions of diameter 4.6 Å in aqueous solution at room temperature, which constitute the system for the MC simulations that we successfully have compared with in the previous examples, we have βR = 1.55. The appropriate βR values for the MDE-DH approximations apparently are of this order of magnitude or less.
As a test of the Complete MDE-DH approximation, the radial distribution function gij(r) has been calculated for a system with rather large ions, a = 6.6 Å, and high electrolyte concentration, where the core–core correlations are important and the charge density distribution ρ(r) is oscillatory. For this system βR = 1.10. The results for gij and Δg = g+− − g−− are presented in Fig. 7, where they are compared to MC simulations results of Zwanikken and coworkers.61 As seen in the figure, the MDE-DH approximation gives excellent results that nearly coincide with the MC ones. Note that the resolution of the ordinate scale in frame (d) of the figure is an order of magnitude larger than in frame (a). It is noteworthy that quite intricate details of the pair distribution functions are obtained in agreement with simulations. Our results are, in fact, slightly better than those of both the HNC approximation and Zwanikken's DHEMSA approximation,61 which is quite remarkable considering the simplicity of the present Ansatz.
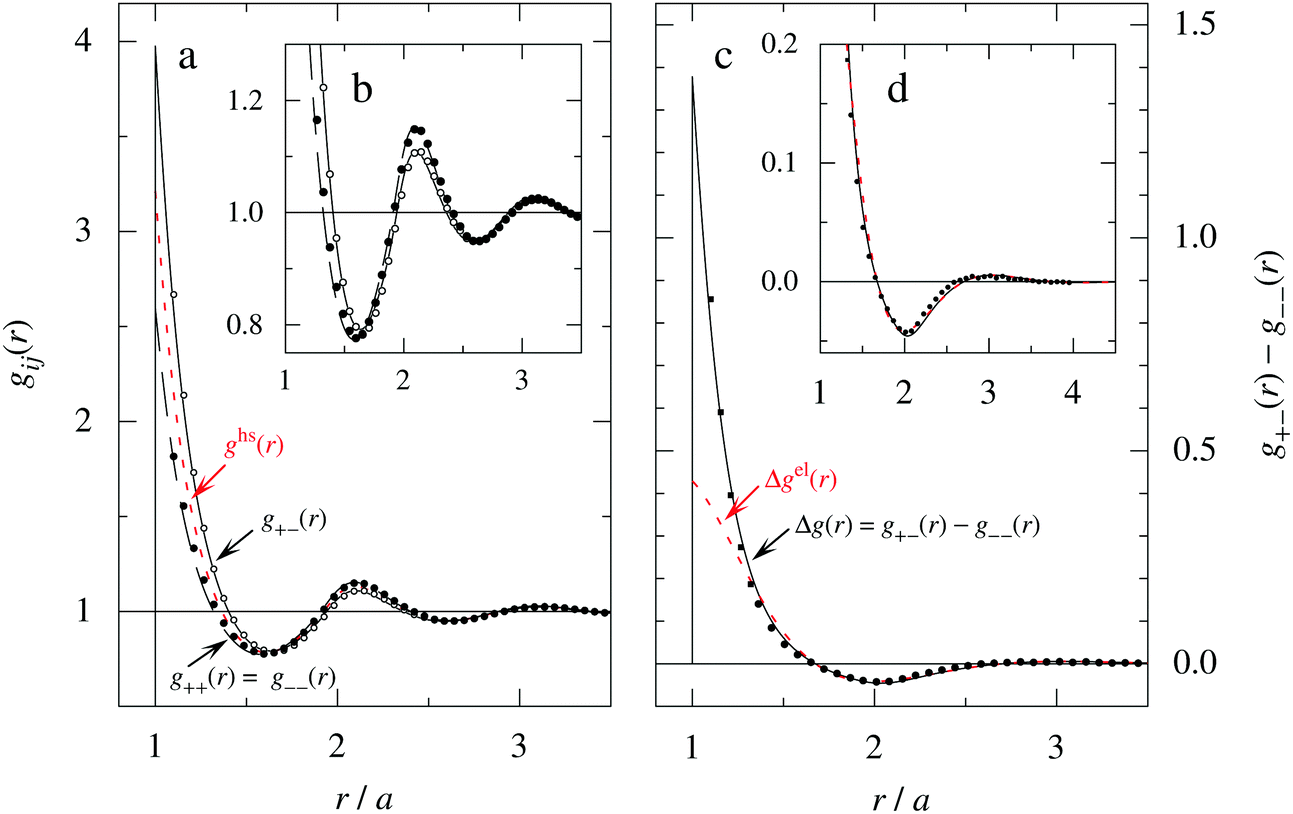 | ||
| Fig. 7 (a) The radial distribution function gij(r) for a 2 M 1:1 electrolyte with ions of diameter a = 6.6 Å (τ = κDa = 3.11 and βR = 1.10) calculated in the Complete MDE-DH approximation (black curves) compared with data from MC simulations (symbols) taken from ref. 61. The red curve (short dashes) shows the pair distribution ghs(r) for a hard sphere fluid of the same density and sphere diameter (packing fraction η = 0.37). The insert (b) shows a magnified view of the gij(r) curves in frame (a). (c) The difference Δg(r) = g+−(r) − g−−(r), which is proportional to the radial charge-density distribution ρ−(r) around a negative ion. Full curve is the MDE-DH and symbols are the MC results [the full circles are from Δg(r) data of ref. 61 and the full squares are calculated from gij(r) in frame (a) taken from the same reference]. The red curve (short dashes) shows Δgel(r) = 2βwel(r), which is the electrostatic part of Δg in the present approximation. The insert (d) shows a magnified view of the curves in frame (c). Note the large differences in ordinate scales of the various frames. | ||
In order to investigate the effects of core–core correlations in this system, the pair distribution ghs(r) of the hard sphere fluid is plotted in Fig. 7a and it is seen that the main oscillation of gij(r) with a wave length ≈a is caused by these correlations. It is also seen in frames (a) and (b) of the figure that there is another oscillatory component with longer wave length superimposed on the main oscillation. This component is equal to the term ∓βwel(r) in eqn (56), which is oscillatory here.*** It makes the g+− and g−− curves to repeatedly intersect with one another and has a wave length 2π/κℑ = 2.06a. In frames (c) and (d) this component gives the contribution Δgel(r) = 2βwel(r), which is the electrostatic part of Δg in the current approximation. For r ≳ 1.3a it is seen that Δgel(r) gives nearly the entire Δg(r).
As seen in eqn (56), gij(r) has also contributions from [βwel(r)]2/2 and from the two cross-terms involving hcore and wel. All these contributions have shorter decay lengths than the other ones, so they mainly contribute for small r.
For the present system we have  and ϑ = −0.828 radians as obtained from eqn (109) and (110) in Appendix B. This can be compared with the values obtained from the Simple MDE-DH approximation, eqn (48) and (49), which are 1.77 and −0.477, respectively. Eqn (58) of the latter approximation gives gij functions for this system that do not agree well with the MC data in Fig. 7. This shows the importance of using the Complete MDE-DH approximation here. All other numerical results obtained so far and those in Section 4.3 below are obtained for systems with smaller ions where it is sufficient to use the Simple MDE-DH approximation based on the Ansatz (43) and eqn (54), (57) and (58).
4.3 Thermodynamic quantities
Let us now turn to the thermodynamic properties and we start with the chemical potential μi of an ion of species i| μi = μideali + μexi = kBTln(λi3ni) + μexi, |
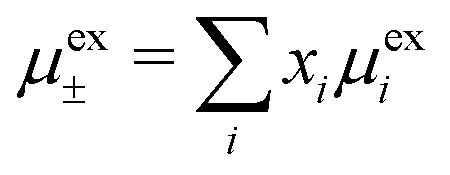 where xi = ni/ntot. The mean activity coefficient γ± is defined from lnγ± ≡ μex±/kBT and we likewise define lnγel± ≡ μex,el±/kBT and lnγcore± ≡ μex,core±/kBT. The latter is equal to μex,corei/kBT for any i because all ions have the same size. Obviously, lnγ± = lnγel± + lnγcore±.
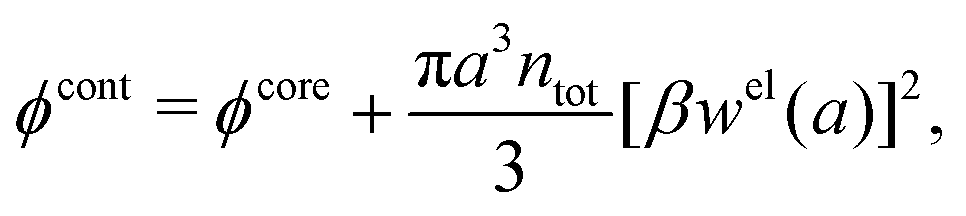
Let us start with the core term and consider the excluded volume hole in the electrolyte where an uncharged sphere of diameter a can fit. This volume, where the centers of the surrounding ions cannot enter, is equal to 4πa3/3. In the DH and MDH approximations
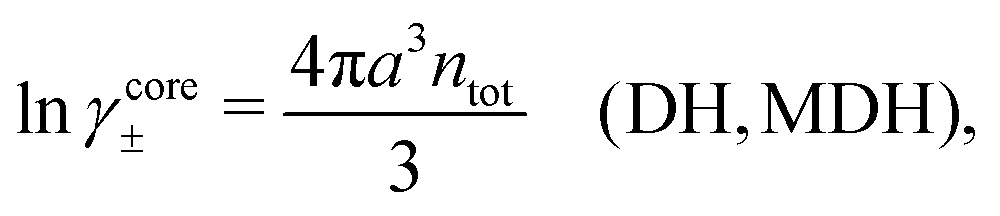 | (59) |
lnγcore± = kBTntot × 4πa3/3 is the reversible pressure-volume work done when a hole of radius a and volume 4πa3/3 is formed in a low-density fluid and the density around the hole is equal to ntot throughout. As we have seen, in these approximations the total ion density around an ion is equal to the bulk value ntot for all distances from the ion and the same applies to an uncharged sphere or a hole.
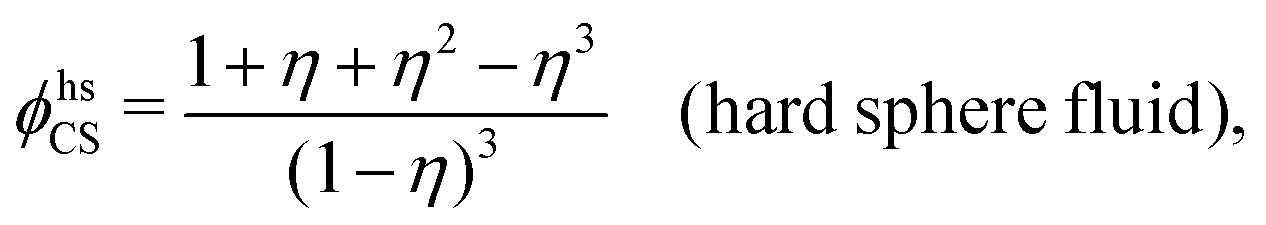
For high ion densities it is, of course, not reasonable to evaluate lnγcore± as if the total density around an uncharged sphere is unaffected by the interactions with the latter. In the MDE-DH theories for the RPM, an uncharged sphere does not interact electrostatically with the ions because wel is proportional to the charge of the central particle, but hard core interactions are included because of the presence of the gcore in the pair distribution function in eqn (53). Therefore, lnγcore± is equal to the excess chemical potential for the creation of a hole in a dense fluid of hard spheres of number density nhs, which is set equal to the total ion density ntot. Since we use the Verlet–Weis' semi-empirical expression for ghs and set gcore = ghs we have
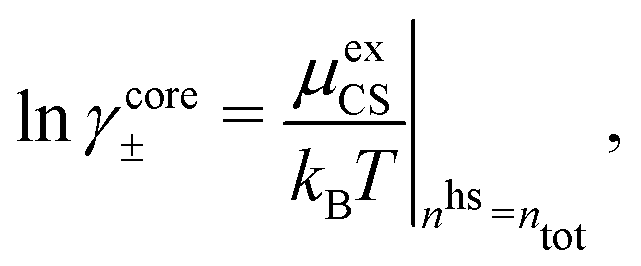 | (60) |
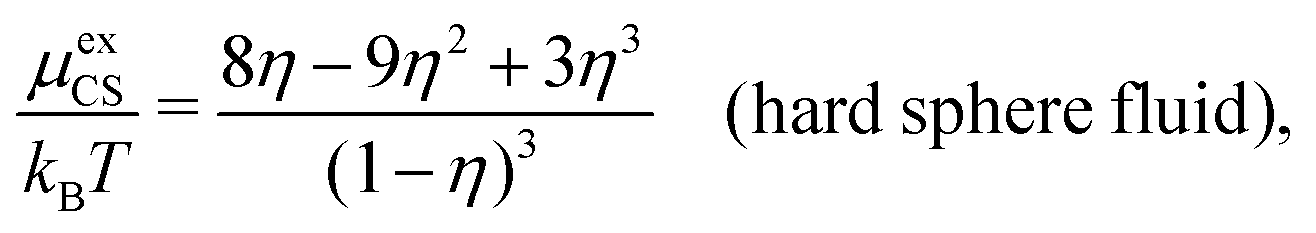 | (61) |
γcore± from eqn (60) approaches that of eqn (59) when the concentration is decreased to zero.
The electrostatic parts of the chemical potential and the activity coefficient can be calculated from the radial charge distribution functions of the electrolyte. In the DH approximation we have
 | (62) |
 | (63) |
where it is clearly seen that the prefactor is a constant that is independent of the ion density.
In the Simple MDE-DH approximation based on the Ansatz (43) and eqn (58), it is shown in Appendix C that
 | (64) |
In any approximate theory where the charge density ρi is proportional to qi, like the DH, MDH and MDE-DH approximations, μex,el± is equal to the excess (interactional) average energy per ion, Uex/Ntot (see eqn (115) ff. in Appendix C), where 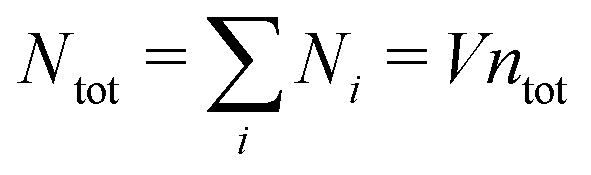 is the total number of ions and V is the volume of the system. We therefore have lnγel± = βUex/Ntot in these approximations, so in the the Simple MDE-DH approximation we have
 | (65) |
γel± ≈ βUex/Ntot.
In Fig. 8a, lnγ± obtained in the Simple MDE-DH approximation is compared with results from MC simulations and we see that the agreement is very good for all concentrations; there are slight differences between the results for high concentrations that are hard to see in the plot. The red portions of the curves indicate the region where the radial charge distribution is oscillatory and the Kirkwood cross-over point is shown by red arrows. The DH prediction is also plotted and serves as a reference in the figure. The electrostatic contribution lnγel± from these approximations is shown and these curves also give the predicted average energy plotted as βUex/Ntot. The latter quantity as obtained from MC simulations is plotted as blue triangles in the figure and the Simple MDE-DH approximation results are very good agreement with the MC data; the slight differences seen for high concentrations are actually nearly the same as for the lnγ± results in the figure.
 | ||
| Fig. 8 (a) The logarithm of the mean activity coefficient γ± and its electrostatic part γel± plotted as functions of the square root of the salt concentration csalt for 1:1 aqueous electrolyte solutions (a = 4.25 Å, T = 298 K, βR = 1.68). The full and dotted curves show lnγ± from the Simple MDE-DH approximation; the full curve is obtained directly and the dotted one is obtained via an integration of the osmotic coefficient. The symbols show the results from MC simulations taken from ref. 77. The alternatingly dashed-minidashed curve shows lnγel± = βUex/Ntot from the Simple MDE-DH approximation (in this approximation μex,el± = kBTlnγel± is equal to Uex/Ntot). The blue triangles show βUex/Ntot from the same MC simulations (lnγel± is in general not equal to βUex/Ntot in simulations). The Kirkwood cross-over point (K) between monotonic and oscillatory decay is indicated by red arrows; for the red portions of the curves the radial charge distribution is oscillatory. For reference, we also show the Debye–Hückel (DH) predictions for lnγ± and lnγel± = βUex/Ntot as dashed curves. (b) The osmotic coefficient ϕ plotted in the same manner. The full curve shows Simple MDE-DH, symbols MC and dashes DH results. | ||
Fig. 9a shows the low concentration region in more detail, where the results from the MDH approximation are also included. The latter cannot give any prediction at high ion densities (beyond the Kirkwood cross-over point) because there is only one term for the Ansatz in eqn (30) and, as seen in the figure, the MDH approximation works well only for concentrations up to about 0.25 M (c1/2salt ≈ 0.5 M1/2). Again we see that it is very important to have the two decay modes present in the theory in order to describe the electrolyte in an appropriate manner. The dashed-dotted curve is calculated by using lnγcore± from eqn (59) rather than from eqn (60). By comparing the full and the dashed-dotted curves we can see that for concentrations below about 0.25 M (c1/2salt ≈ 0.5 M1/2), it it does not matter which expression one uses, but for higher concentrations one must use the CS expression in order to obtain the correct values for lnγ±.
 | ||
| Fig. 9 The quantities (a) lnγ± and (b) ϕ for the same system as in Fig. 8, but displayed in an expanded view for low concentrations. The full, dotted and short-dashed curves and the open circles are the same as in Fig. 8. In frame (a), the crosses show MC simulation data from ref. 72 and the long-dashed curve shows the result of the MDH approximation. The dashed-dotted curves in both frames are based on the Ansatz (43), like the full and dotted curves, but they are calculated with the same hard core contribution for lnγ± and ϕ as the DH and MDH approximations. The red portions of the curves indicate the region where the radial charge distribution is oscillatory. | ||
The osmotic coefficient ϕ is defined from ϕ = P/Pideal where P is the (osmotic) pressure of the fluid and Pideal = kBTntot is the ideal pressure. The excess pressure is Pex = P − Pideal and the excess osmotic coefficient is given by ϕex = Pex/Pideal = ϕ − 1 (see eqn (116) ff. in Appendix C). In the DH approximation we have
 | (66) |
 | (67) |
As shown in Appendix C, in the Simple MDE-DH approximation we have
 | (68) |
 | (69) |
so we have
| ϕcore = ϕhsCS|nhs=ntot − 1 | (70) |
The prediction for ϕ obtained in the Simple MDE-DH approximation is shown as the full curve in Fig. 8b and the low concentration region is shown in Fig. 9b. It is seen that this prediction is in very good agreement with the MC data for all concentrations. Again, the curve nearly coincide with the MC data.
The activity coefficient can alternatively be obtained from the osmotic coefficient via the relationship
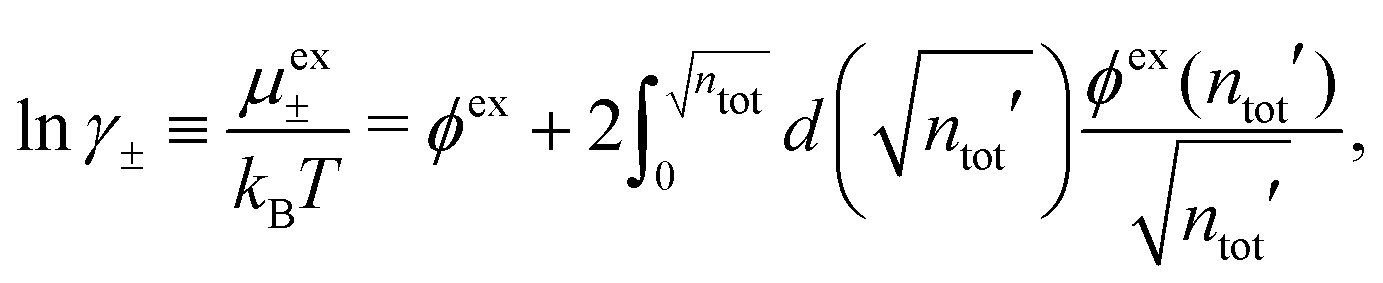 | (71) |
 is suitable since ϕex(ntot′) is proportional to
  for small densities). In the integrand, ϕex(ntot′) is evaluated for an electrolyte with total density ntot′ that varies from 0 to the final value while keeping the mole fraction xi constant, whereby one sets the ion density equal to ni′ = xintot′ when calculating ϕex.
In approximate theories, there is no guarantee that lnγ± calculated from ϕexviaeqn (71) is the same as lnγ± obtained earlier. In order to have consistency, one would need to obtain the same value of each quantity irrespectively of how it is calculated, but this is guaranteed only in exact theory. A well-known fact is that the DH approximation shows very poor consistency for lnγ± and the same is true for the MDH approximation.32 The use of eqn (71) is discussed in Appendix C, where we see that it is a common feature of all linear approximations (where ρi is proportional qi) that the contribution ϕel in ϕex integrated according to eqn (71) does not give lnγel±. In the DH and MDH approximations, this is the cause of the inconsistency for lnγ±.
In the Simple MDE-DH approximation, the contribution ϕel does not give lnγel±via this integration for the same reason. However, there is also an electrostatic contribution from the square term in ϕcont given by eqn (68) that originates from the square term in eqn (58). This contribution makes the situation different. In Fig. 8a the dotted curve shows lnγ± obtained via the integration (71) from the osmotic coefficient in Fig. 8b. In Fig. 9a the low concentration region is shown in more detail. The dotted curve agrees well with the full curve, so we see that this approximation shows a good thermodynamic consistency in this respect. Considering that the theory is based on the very simple Ansatz (43) and eqn (58), this is an accomplishment. In fact, it is not uncommon for more advanced theories to lack such a consistency.
For the system in Fig. 7 with large ions, the Complete MDE-DH approximation given by eqn (54) and (55) is, as we have seen, needed for the distribution functions because the cross-terms in eqn (56) give non-negligible contributions. However, when the thermodynamic quantities of this system are calculated in this approximation, lnγ± deviates only by 0.4% and ϕ by 0.9% from the predictions by the Simple MDE-DH approximation, so the latter can still be used as a good approximation for these quantities. This is a further example of the fact that thermodynamical quantities sometimes are not overly sensitive to the details of the structural entities like the distribution functions. The corresponding deviations for the contributions lnγel± and ϕel are 5.5% for both.††† If the latter quantities are needed with a higher accuracy than this, one has, of course, to use the Complete MDE-DH approximation. The formulas for such calculations are presented in Appendix C, eqn (125)–(127).
5 Influence of terms with higher powers of wij
As we have seen, the approximations in this paper are based on the basic Ansatz (52)where
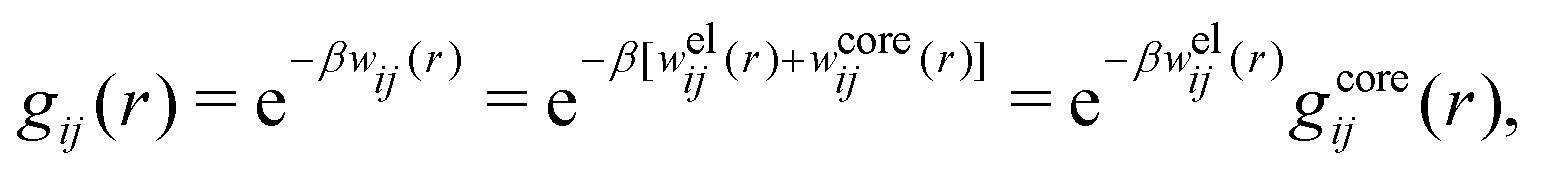
 is set equal to ghs and welij is given by the Ansatz (28) with two Yukawa function terms. The electrostatic part of gij can be expressed as a Taylor expansion
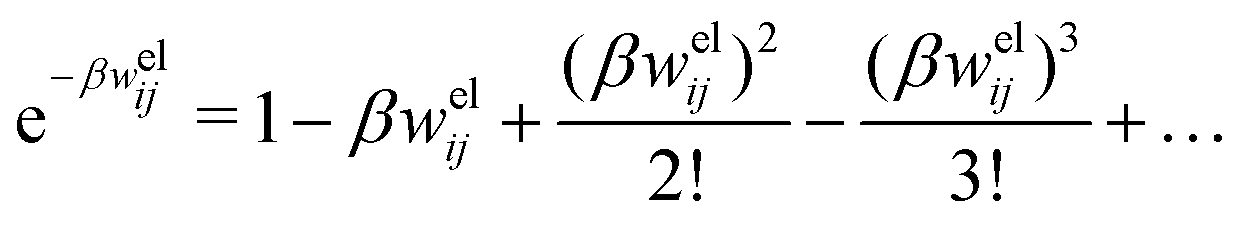 | (72) |
There remains, however, one issue to be considered. For dilute electrolytes where the screening is low, welij(r) has a long range and the terms with higher powers than two have, in fact, a qualitative effect on the screening behavior. In the limit of infinite dilution we have the exact limiting law in eqn (5) for the screening parameter κ, which takes the following form for symmetric binary electrolytes‡‡‡
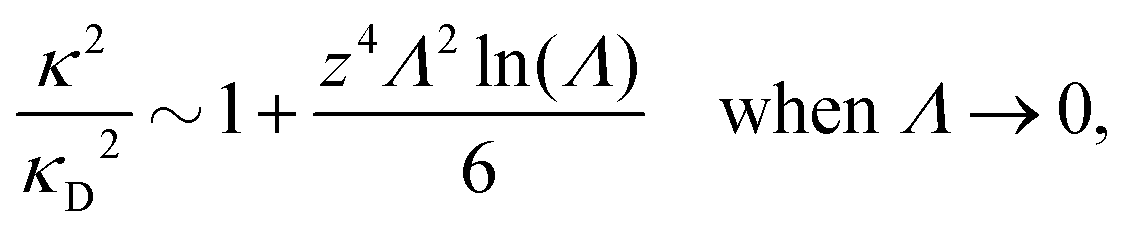 | (73) |
As we have seen, since the logarithm in eqn (73) is negative for small Λ, the second term in the rhs is negative there, so κ < κD for dilute symmetric electrolytes and there is accordingly under-screening. However, the approximate formula (33) for κ in the MDE-DH approximation implies over-screening, κ > κD, and when κD → 0 it gives (κ/κD)2 ∼ 1 + (κa)2/2 ∼ 1 + (κDa)2/2. Therefore, this κ is qualitatively incorrect for very dilute solutions in this approximation. Other linear approximations for the electrostatic response in electrolytes, like MSA, LMPB and GDH, share the same features; they all predict that κ ≥ κD and a limiting form proportional to (κDa)2.
As mentioned in the Introduction, it has been experimentally observed that κ < κD in dilute solutions of symmetric electrolytes at high electrostatic coupling, so this phenomenon is relevant to investigate. Since eqn (73) has general validity as an exact limiting law, it is applicable also for low electrostatic coupling so it is theoretically interesting to start with this latter case.
In order to analyze these matters, let us investigate the predictions of the full nonlinear expression for ρ(r) = qn[g++(r) − g+−(r)] with gij(r) given by eqn (53) and (54), that is,
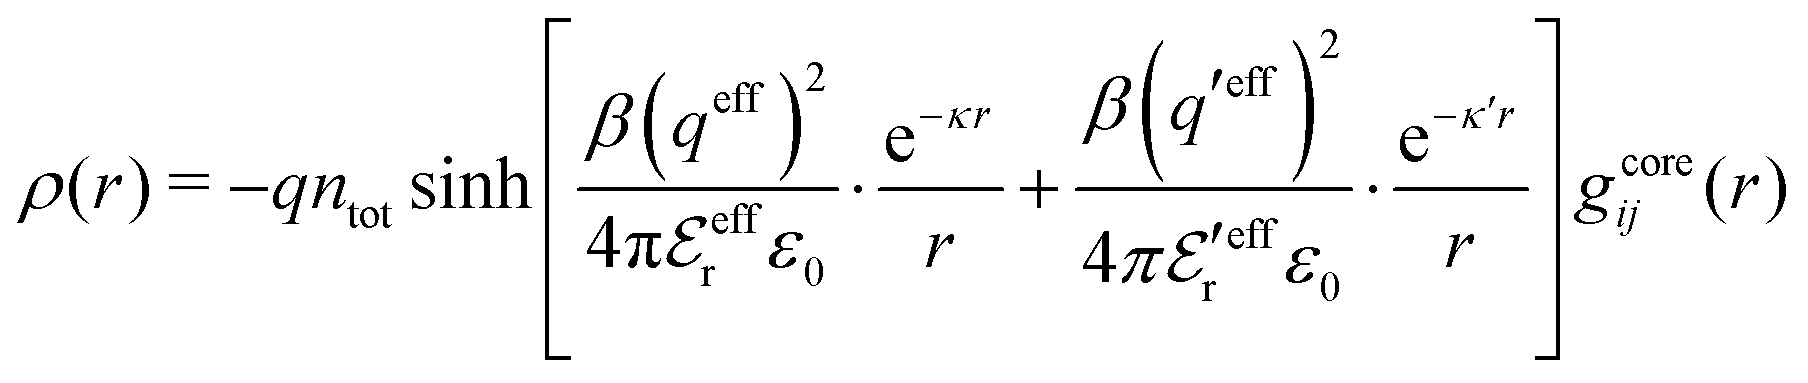 | (74) |
 is very large there and gcoreij(r) ≈ 1, so ρ(r) is given to a very good approximation by
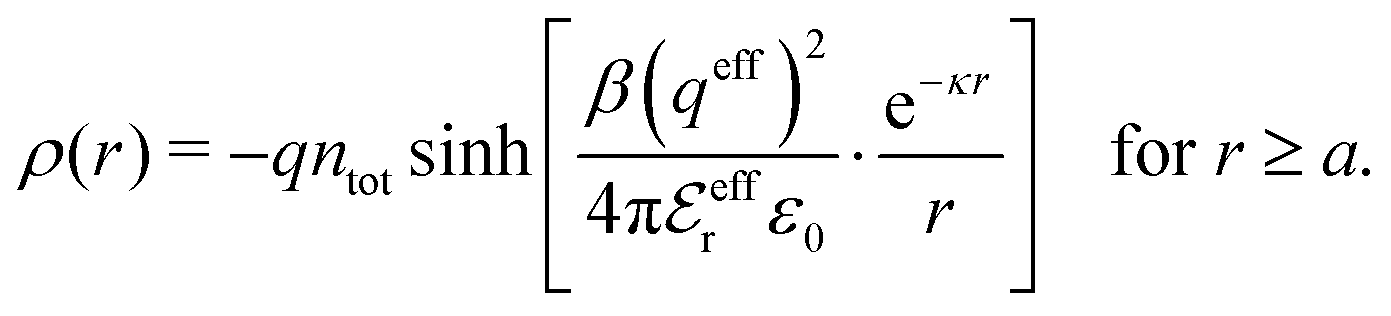 | (75) |
 in eqn (74) for low electrolyte concentrations.
Using the exact eqn (51), we can write the coefficient in the prefactor of the argument of sinh in eqn (75) as
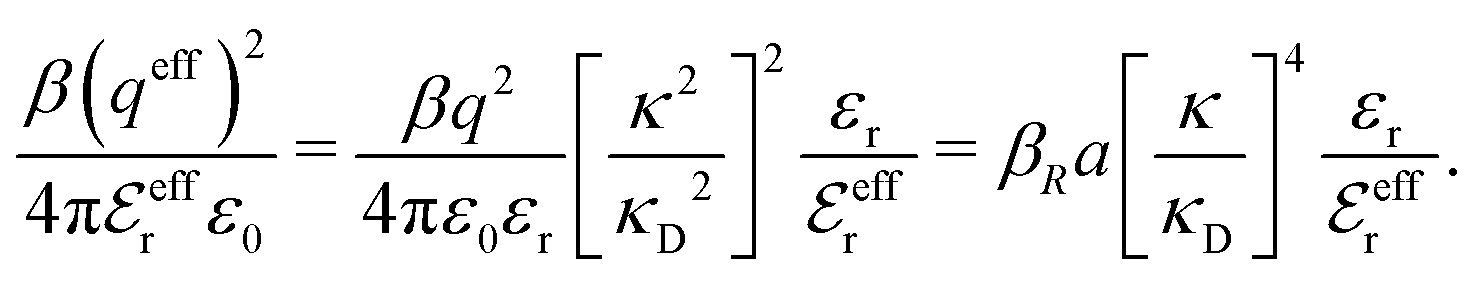
and
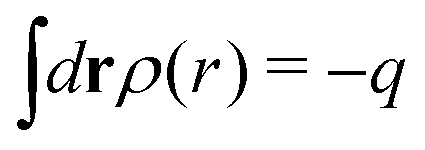
respectively. By inserting eqn (75) into these equations and using ntota3 = τ2/(4πβR), we obtain the following set of equations for the two unknowns κ/κD and
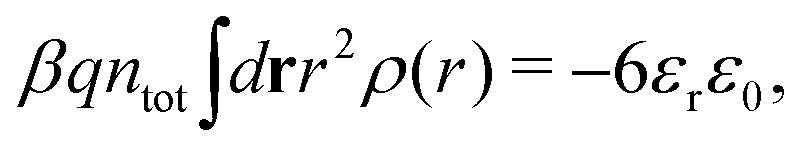
 for given dimensionless system parameters τ and βR
 | (76) |
 | (77) |
 . It constitutes an approximate nonlinear theory that is valid for dilute electrolytes. We will denote this approximation as the Extended DHX (EDHX) approximation. It is the limiting form for infinite dilution of the nonlinear (DHX) version of the MDE-DH approximation, where ρ(r) is given by eqn (74) and g+±(r) = e∓βwel(r)gcore(r) with wel from eqn (54) [cf. the discussion in Section 2 in connection to eqn (28) and (29)].
Before proceeding we note that the linearized version of this approximation is equal to the self-consistent screening length, SCSL, approximation by Attard, which was discussed in Section 3. This follows because linearization of eqn (75) gives [cf.eqn (35)]
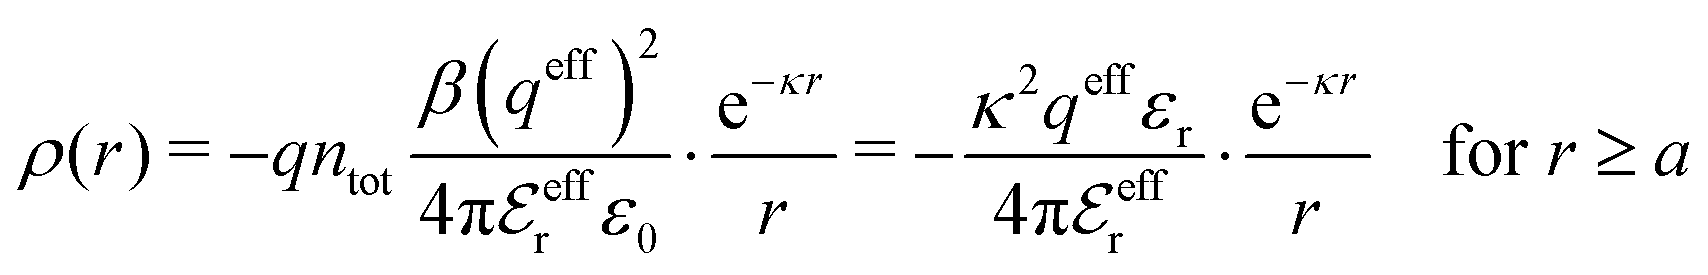
 given by eqn (36). Since the EDHX and SCSL approximations contain only one decay mode, they can be useful only for dilute electrolytes.
The numerical solution of eqn (76) and (77) of the EDHX approximation gives the following results. Fig. 10 shows the ratios κ2/κD2 and  as functions of τ = κDa for a monovalent electrolyte with a = 4.6 Å in aqueous solution at room temperature, which corresponds to βR = 1.55 (recall that κDa is proportional to the square root of concentration). The predictions of the EDHX approximation are compared in the figure with results from MC simulations, the HNC, MDE-DH and SCSL approximations. In the insert to Fig. 10a, which shows a magnified view of the dilute region, we see that the EDHX approximation indeed gives κ < κD for the dilute electrolyte in agreement with the exact asymptotic formula and the HNC approximation. However, the slight dip of κ2/κD2 below 1 occurs for small ion densities where the deviation of κ from κD is negligible in practice. Despite that the curves for MDE-DH and SCSL approximations in the insert show the qualitatively incorrect behavior with κ > κD, it only on this greatly magnified scale that this can be seen. Likewise, in the insert to Fig. 10b we can see that
  for dilute solutions as shown by the HNC and EDHX approximations, while the MDE-DH and SCSL approximations give
  there, which is incorrect. Also in this case, the incorrect behavior occurs for low densities where the deviation of
  from εr is negligible for most practical purposes.
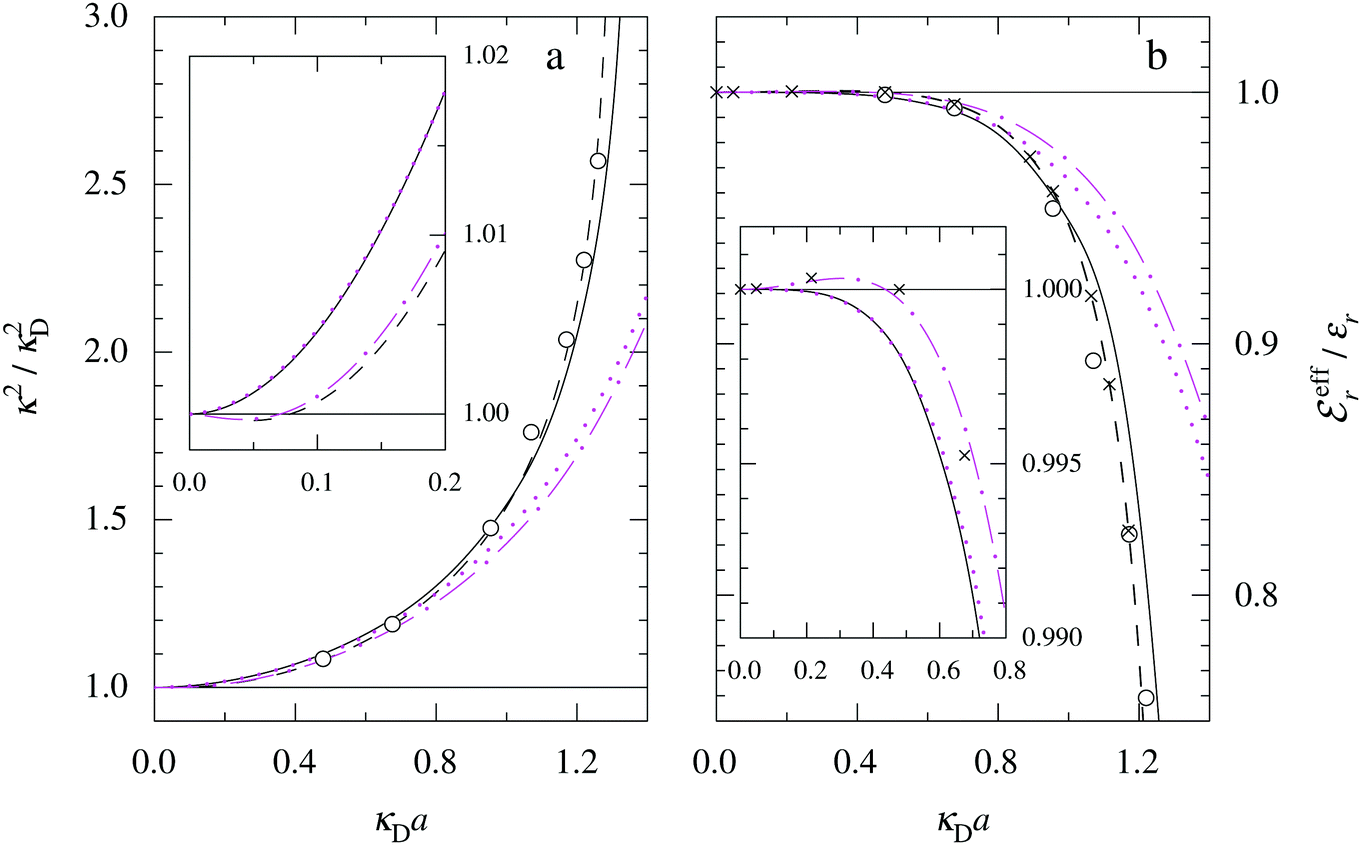 | ||
Fig. 10 The ratios (a) κ2/κD2 and (b)  plotted as functions of κDa for monovalent electrolytes in aqueous solution at room temperature (βR = 1.55). The respective insert shows the same plot in an expanded view for low concentrations (low κDa). The dot-dashed curves are the result from the EDHX approximation, eqn (76) and (77), and the dotted curves are from the SCSL approximation; both are drawn in magenta color. The full curves are the Simple MDE-DH results, the dashed curves and crosses show the results from HNC calculations (the crosses occur only in b), and open circles are from MC simulations. The HNC and MC data are taken from ref. 18 and 22. plotted as functions of κDa for monovalent electrolytes in aqueous solution at room temperature (βR = 1.55). The respective insert shows the same plot in an expanded view for low concentrations (low κDa). The dot-dashed curves are the result from the EDHX approximation, eqn (76) and (77), and the dotted curves are from the SCSL approximation; both are drawn in magenta color. The full curves are the Simple MDE-DH results, the dashed curves and crosses show the results from HNC calculations (the crosses occur only in b), and open circles are from MC simulations. The HNC and MC data are taken from ref. 18 and 22. | ||
In the main frames of Fig. 10 we see, as before, that the MDE-DH approximation gives a very good over-all account of the properties of the monovalent electrolyte. Furthermore, we can see that the EDHX and SCSL approximations do not work for higher concentrations, because, as pointed out earlier, they only contain one decay mode. In the figure one can clearly see that it is very important to include two decay modes with different decay parameters κ and κ′, as in the MDE-DH approximation, in order to get agreement with the accurate calculations outside the dilute region.
The fact that κ < κD for low concentrations, as shown by the asymptotic formula eqn (73), is a general feature for symmetric electrolytes. Due to the factor z4 in this equation, the under-screening will become much more pronounced when the valency of the ions is increased. This has been verified for divalent (2:2) electrolytes in ref. 18 and 22 by HNC and MC calculations; these HNC and MC results are shown in Fig. 11 together with the corresponding result from the EDHX approximation. As seen in Fig. 11a, we have κ < κD for the divalent case in a wide concentration interval and the negative deviation of κ2/κD2 from 1 reaches about 30% (shown by the MC data) before it rises again. This highly significant difference from the monovalent case is solely due to the difference in ionic charge by a factor of two; everything else is the same. In this case the HNC approximation (dashed curve) does not provide accurate values of κ, except for low concentrations. As pointed out earlier, the EDHX approximation is applicable only for sufficiently dilute electrolytes, but for higher concentrations it nevertheless has the correct qualitative behavior in a part of the concentration interval shown.
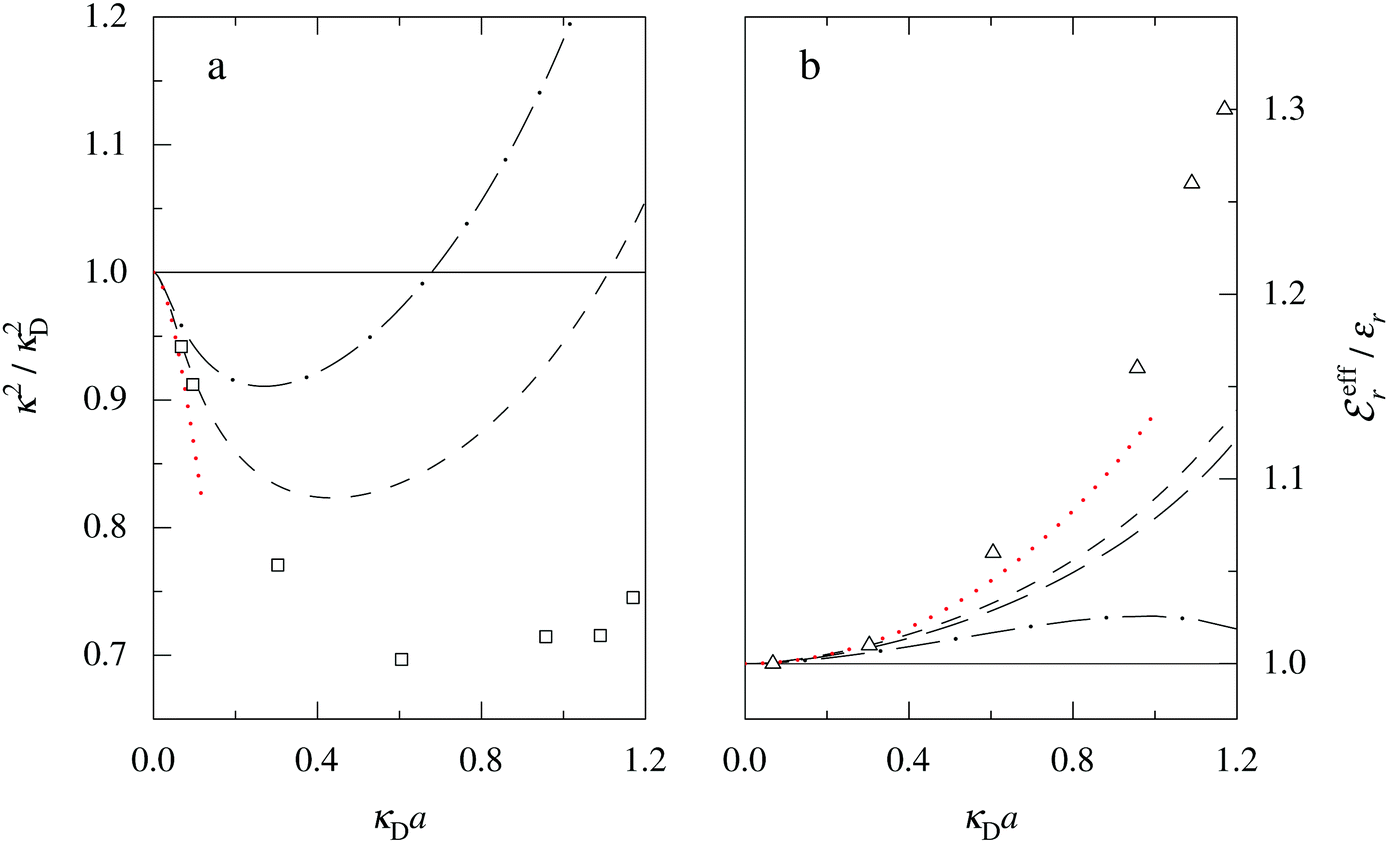 | ||
| Fig. 11 Frames (a) and (b) show the same kind of plot as Fig. 10a and b, but for divalent (2:2) electrolytes in aqueous solution at room temperature. The symbols show the results from MC simulations, the dashed curves from HNC calculations, the dot-dashed curves from the EDHX approximation that is valid only for low concentrations, and the red dotted curves show the asymptotes given by eqn (81) and (82), respectively. The ions have diameter a = 4.6 Å and βR = 6.22 except for the HNC results in frame (b), where a = 4.2 Å (short dashes) and 5.0 Å (long dashes); the corresponding HNC curve of a = 4.6 Å would lie between these curves. The HNC and MC data are taken from ref. 18 and 22. | ||
The results for the effective dielectric permittivity  for the divalent electrolytes is shown in Fig. 11b. Again, the HNC approximation provides accurate results only in the dilute region. In contrast to the monovalent case, we see that
  in the entire interval shown. The under-screening is accordingly accompanied by an augmentation of the effective dielectric permittivity of the electrolyte caused by the strongly nonlinear ion–ion correlations. For 1:1 electrolytes we have
  only in a small part of the very dilute region in the insert to Fig. 10b. Furthermore, we saw in Fig. 3 for the latter case, that
  quickly approaches εr from below when κDa is decreased from the Kirkwood cross-over point and then stays nearly constant
 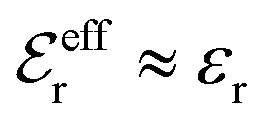 when κDa → 0. In contrast, for the 2:2 case in Fig. 11,
  approaches εr from above in a slow manner when κDa → 0. Incidentally, we may note that for high values of κDa (outside the figure) there is a Kirkwood cross-over point at κDa ≈ 1.7 for the 2:2 case with a = 4.6 Å and
  decreases quickly to zero when that point is approached, see ref. 18 and 22.
The nonlinear electrostatic effects in ion–ion correlations are important for any system where the electrostatic coupling is appreciably stronger than the monovalent case we have investigated, that is, for lower temperatures, lower εr or higher valencies. This means that terms in higher powers of welij than the square one in eqn (72) cannot be neglected and the MDE-DH approximation is inadequate in these cases.
From the results from the EDHX approximation we see that apart from dilute systems it is clearly insufficient to have only one decay mode. We need to include at least two decay modes with different decay parameters κ and κ′ as shown in eqn (74) and the corresponding expression for g+±(r) mentioned earlier. Then we have at least four parameters to determine κ, κ′,  and
and  . For the monovalent case we have the fortunate circumstance that κ and κ′ can be quite accurately be determined by solving eqn (33) and that
  and
and  then can be determined from the application of the local electroneutrality condition and the Stillinger–Lovett second moment condition. This is not the case in general so one will need to apply further conditions that allow four parameters or more to be determined. This will not be pursued in the current paper.
6 The various types of deviations of κ from κD for symmetric electrolytes
The deviations of κ from κD can be analyzed in terms of the effective charges qeff since we have the exact relationship eqn (19), , which can be written as [eqn (51)]
 | (78) |
The fact that qeff > q for most concentrations in the monovalent case is simply a geometrical effect of the finite ion size. When the ion diameter a is increased from some small value, the surrounding ion cloud is pushed further out, as apparent already in the DH approximation, where eqn (11) for r ≥ a can be written as

For cases like divalent (2:2) electrolytes where κ < κD, there is, instead under-screening, so the decay length 1/κ is longer than the Debye length and qeff < q. This lowering of qeff is caused by strong anion–cation correlations; each ion strongly attracts ions of opposite charge causing large values of g+−(r) near contact, r = a. The large amount of opposite charge near the ion leads to a reduction of the potential for large r. The ion thus appear to have a smaller charge, that is, a smaller qeff. The strong (nonlinear) anion–cation correlational attractions hence gives qeff < q and κ < κD. Nothing more than strong anion–cation correlations are needed to give rise to the negative deviations of κ from κD in dilute solutions. This is apparent from the EDHX approximation, which shows this behavior, and when the electrostatic coupling is large, this gives, as we have seen, a large negative deviation.
Decay lengths 1/κ that are much longer than the the Debye length 1/κD have been experimentally obtained in surface force measurements of divalent (2:2) and trivalent (3:3) electrolytes in dilute aqueous solutions104 and monovalent electrolytes in dilute isopropanol solutions105 by Trefalt and coworkers. Isopropanol has dielectric constant εr = 17.9, so the electrostatic coupling for monovalent ions in isopropanol corresponds approximately to divalent ions in water. Their experimental results are shown in Fig. 12 together with theoretical data that will be discussed later.
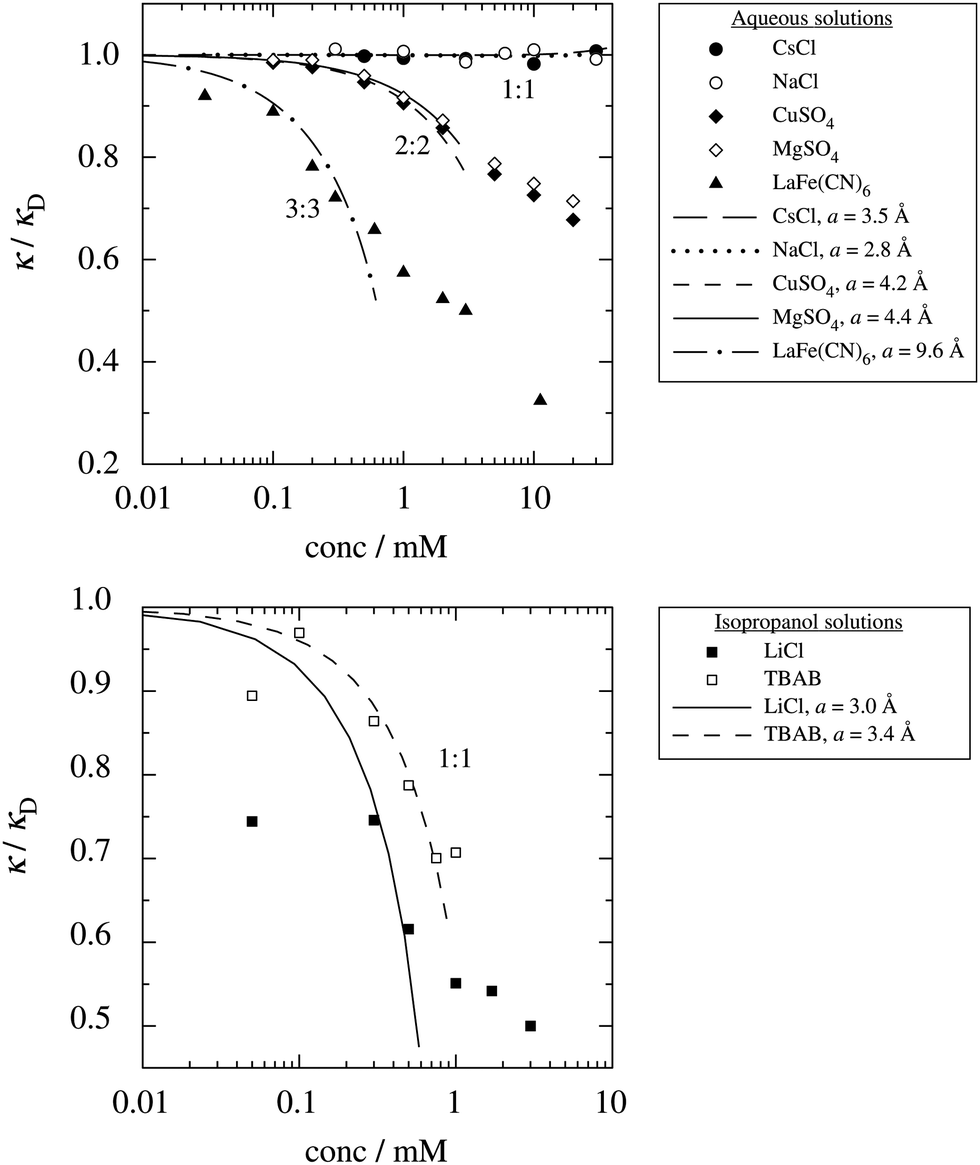 | ||
| Fig. 12 The ratio κ/κD as function of concentration on a logarithmic scale for monovalent (1:1), divalent (2:2) and trivalent (3:3) electrolytes in dilute aqueous solution and monovalent (1:1) electrolytes in dilute isopropanol solution. Experimental data from ref. 104 and 105 are shown as symbols and predictions of the asymptotic formula (81) for low concentrations are shown as curves. The values of the ionic diameter a, which is the single fitting parameter for the asymptote, are shown in the rectangles to the right in the plot, where also the ionic species are displayed. | ||
They analyzed their results in terms of ion pairing, where anion–cation pairs are in equilibrium with dissociated ions, as described by a simple mass action law with equilibrium constant K, where the ionic activity coefficients are set to one. By only including the dissociated (free) ions with density nfreei in the DH expression (1) for the decay parameter, they obtained an effective κ, defined from 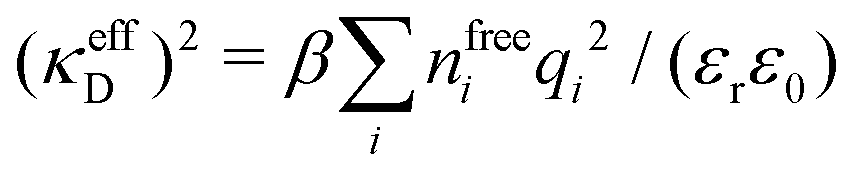 , which can be written
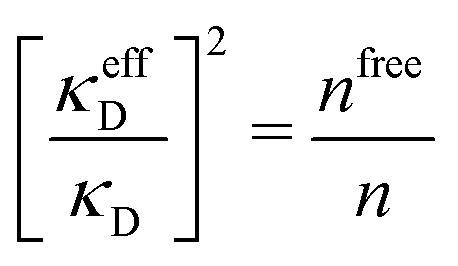 | (79) |
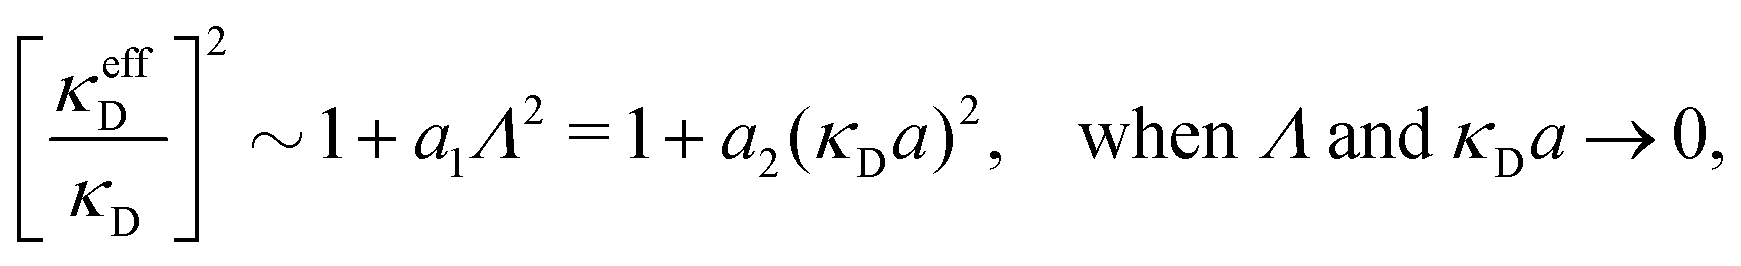 | (80) |
Ion pairing in simple electrolytes is an example of strong anion–cation correlations, where the contact value of g+−(r) is very large. The pairing is a transient state for the ions involved in the pairing. Fundamentally, all ions should be treated on the same basis irrespectively if they are paired or not, but as an approximation one can model the system such that paired ions are treated as a separate species as done in the pairing theories mentioned in the Introduction. The effective charge qeff above for symmetric electrolytes, thereby correspond to an average over free ions and ions that are members of some pair,
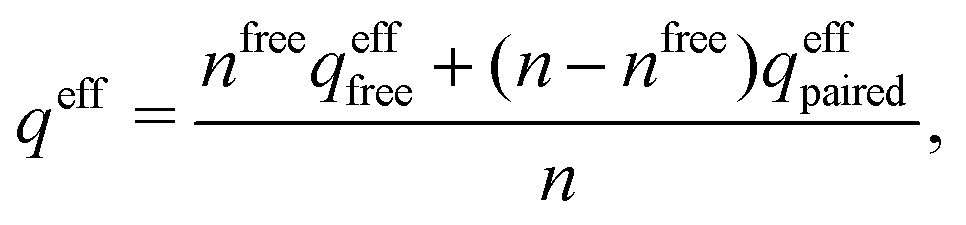
In the approach by Trefalt and coworkers, they have accordingly tacitly assumed that the effective charge of the free ions is equal to the bare ionic charge, which gives eqn (79) without the factor qefffree/q. This can be a reasonable approximation for a system with high electrostatic coupling provided nfree ≪ n. However, this assumption, together with their additional assumption that the ionic activity coefficients are equal to one, set a limit on the applicability of their approach. The equilibrium condition used for paired and free ions thereby constitutes a simple model for the effects of ion–ion correlations. The reason why the asymptotic expression (80) does not agree with the exact formula (73) is the approximation qefffree = q.
Even if an ion pair is a transient state caused by strong anion–cation correlations rather than a kind of separate species, the two ions will act like a dipole in the interactions with the other ions including other transient pairs. There may also be other transient aggregates with more than two ions. Pairs and other transient aggregetes and their effects on the decay lengths and the effective dielectric permittivities of the electrolyte can be handled by the exact DIT formalism.94,95 It is, for example, found that the strong anion–cation attractive correlations at short separations (transient pairs corresponding to high values of g+−(r) near contact) have qualitatively the same effect on the dielectric properties of the electrolyte as an actual pair. As we saw in Fig. 11, we have  for 2:2 electrolytes of low to moderate concentrations, so there is an augmented dielectric permittivity of the electrolyte as expected from such a mechanism.
In order to investigate the dilute region further, let us extract the leading asymptotic terms for κ2/κD2 and  in the limit τ = κDa → 0 from eqn (76) and (77) of the EDHX approximation. We will thereby include terms up to order τ2, that is, up to terms that are proportional to concentration. Since this approximation is designed to give accurate results for dilute electrolytes, the derived asymptotic formulas should be correct in the limit of zero concentration. As shown in Appendix D we obtain
 | (81) |
 | (82) |
 ,
,  is Euler's constant and s(x) = x/(5!·2) + x2/(7!·4) + … is defined in eqn (136) of Appendix D.
In the rhs of eqn (81), the second term, which is negative for small κDa, dominates when κDa → 0 due to the logarithm and decays to zero in this limit. Eqn (81) agrees with the exact limiting law (73) since βRτ = z2Λ and lnτ = ln(Λ) + ln(z2/βR) ∼ ln(Λ) when the concentration and hence Λ and τ go to zero.¶¶¶
For divalent electrolytes in aqueous solution, the predictions of the asymptotic formulas (81) and (82) are plotted as red dotted curves in Fig. 11a and b, respectively. Despite that these formulas were derived from the EDHX approximation in the limit zero concentrations, each asymptote continues not far from the simulated results in a quite wide concentration interval and give therefore surprisingly reasonable estimates of the latter. This means that the asymptotes can be useful also outside the region of very high dilution, at least for the purpose of approximate assessments of ion–ion correlation effects in κ2/κD2 and  at high electrostatic coupling where the MDE-DH approximation is inadequate.
As a test of such an assessment, the asymptote from formula (81) has been compared with the experimental data by Trefalt an coworkers104,105 mentioned earlier.|||||| Data are available for CsCl, NaCl, CuSO4, MgSO4 and LaFe(CN)6 solutions in water and tetrabutylammonium bromide (TBAB) and LiCl solutions in isopropanol. Note that for a given T, εr and valency z of the symmetric electrolyte, the predicted asymptote as function of concentration contains only one parameter, namely the ionic diameter a. In the asymptotic formula, the diameter will correspond to an average value since the anions and cations in the experiments have somewhat different sizes.
The results of a comparison with the experimental data with a as the single fitting parameter is presented in Fig. 12, whereby all cases apart from monovalent ions in water (CsCl and NaCl) were fitted; the experimental uncertainties for the latter were too large to make a fit meaningful. For the other cases, the fits to the low-concentration part of the experimental data are quite good overall considering the experimental uncertainties. The values of the ionic diameters obtained are reasonable, but as we will see below, they are probably somewhat too large. Note that ionic sizes used in primitive model calculations fitted to experimental data are usually different from bare diameters and often include effects of hydration, in particular for multivalent ions. As regards the LiCl solutions in isopropanol there are to few experimental data points available in order to say something definite about the fit in this case. The first data point to the left in the plot for this system and for TBAB in isopropanol are outliers, which demonstrate the experimental difficulties in this kind of measurements.
We can conclude that strong anion–cation correlations constitute the explanation for the experimentally observed over-screening in dilute solutions at room temperature when z is high or εr is low, whereby the decay lengths are considerably longer than the Debye length. The same is true for thin ionic plasmas at moderately high temperatures. There is no need to assume actual ion pairing, although such pairing can be used as a simple way to model such correlations as mentioned in the Introduction and discussed above. The asymptotic formula (81) can accordingly be used as a simple means to approximately assess nonlinear ion–ion correlations effects in dilute solutions. The fact that the asymptote nearly quantitatively describes the variation of the decay length with electrostatic coupling strengths (varying z, εr or T) is thereby a great advantage.
Finally, it is of interest to investigate the asymptotes from eqn (81) and (82) in more detail in the dilute region. The ratios κ2/κD2 and  for divalent and monovalent symmetric electrolytes in water are plotted in Fig. 13 as functions of κDa for low values of the latter. Fig. 13a shows a magnified view of Fig. 11a in the dilute region of the 2:2 case and we see that the asymptote joins the other curves when κDa → 0 as it should. It thereby joins the HNC curve somewhat faster than the curve from the EDHX approximation in this limit.
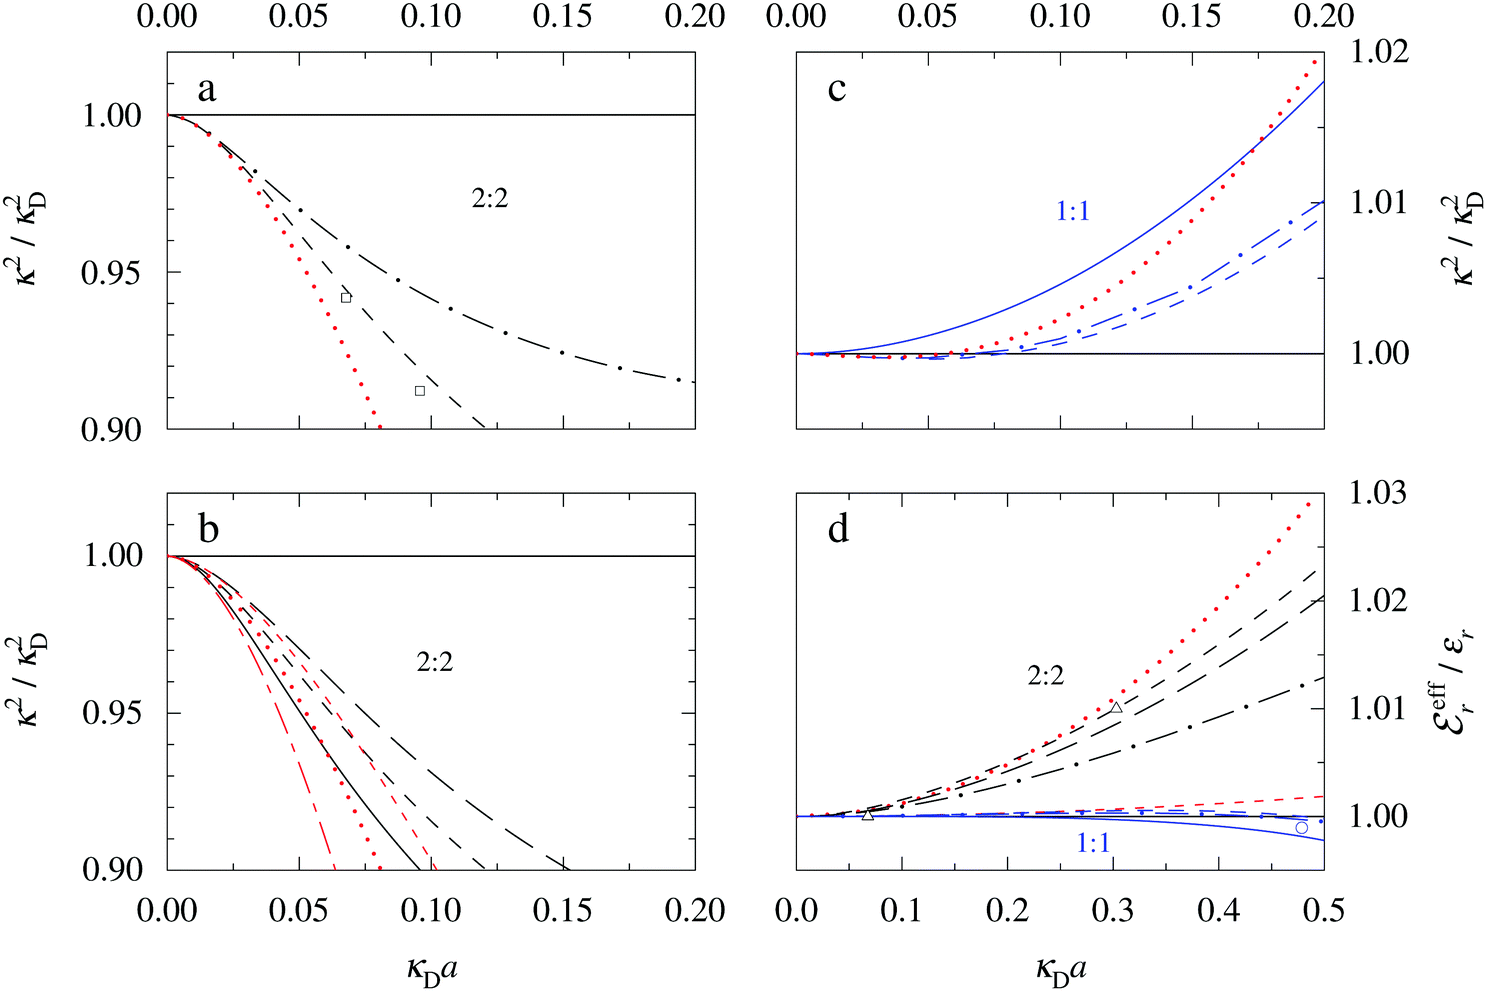 | ||
Fig. 13 The ratios κ2/κD2 and  as functions of κDa for divalent (2:2) and monovalent (1:1) electrolytes in dilute aqueous solution compared with the asymptotes (red curves). (a) The same curves as in Fig. 11a for the divalent case shown the dilute region at large magnification. The red dotted curve is the asymptote for κ2/κD2 from eqn (81). The ion diameter is a = 4.6 Å and βR = 6.22. (b) An illustration of the ion size dependence of κ2/κD2 for divalent electrolytes; from bottom to top a = 4.2, 4.6 and 5.0 Å. Black curves are from HNC calculations and red curves from the asymptotic formula (81). (c) The red dotted curve shows the asymptote for κ2/κD2 from eqn (81) for monovalent electrolytes with βR = 1.55. The full, dashed-dotted and dashed curves (MDE-DH, EDHX and HNC results respectively) are the same as the corresponding curves in Fig. 10a. (d) as functions of κDa for divalent (2:2) and monovalent (1:1) electrolytes in dilute aqueous solution compared with the asymptotes (red curves). (a) The same curves as in Fig. 11a for the divalent case shown the dilute region at large magnification. The red dotted curve is the asymptote for κ2/κD2 from eqn (81). The ion diameter is a = 4.6 Å and βR = 6.22. (b) An illustration of the ion size dependence of κ2/κD2 for divalent electrolytes; from bottom to top a = 4.2, 4.6 and 5.0 Å. Black curves are from HNC calculations and red curves from the asymptotic formula (81). (c) The red dotted curve shows the asymptote for κ2/κD2 from eqn (81) for monovalent electrolytes with βR = 1.55. The full, dashed-dotted and dashed curves (MDE-DH, EDHX and HNC results respectively) are the same as the corresponding curves in Fig. 10a. (d)  for divalent electrolytes (black curves and red dots, βR = 6.22) and monovalent electrolytes (blue curves and red mini-dashes, βR = 1.55) in aqueous solution. The red curves show for divalent electrolytes (black curves and red dots, βR = 6.22) and monovalent electrolytes (blue curves and red mini-dashes, βR = 1.55) in aqueous solution. The red curves show  from the asymptotic expression (82). The curves for the divalent case are the same as in Fig. 11b shown the dilute region at large magnification and the blue curves are the same as the corresponding ones in Fig. 10b. The HNC and MC data are taken from ref. 18 and 22. from the asymptotic expression (82). The curves for the divalent case are the same as in Fig. 11b shown the dilute region at large magnification and the blue curves are the same as the corresponding ones in Fig. 10b. The HNC and MC data are taken from ref. 18 and 22. | ||
Fig. 13b shows how the ion diameter affects both the HNC curves and the asymptotes when a varies between 4.2 to 5.0 Å for 2:2 electrolytes. The middle case, a = 4.6 Å, is the same as in frame (a) of the figure. We can see that the asymptote for a certain a value, say a = 5.0 Å, lies close to the HNC curve for a slightly smaller a value, say 4.6 Å, in a whole κDa interval. This implies that the fits made in Fig. 12 for the asymptotes most likely give somewhat too large values of a.
In Fig. 13c it is seen that the asymptote for the monovalent case accurately describes the slight dip of κ2/κD2 below 1 for small κDa. When κDa is increased, the asymptote approaches and then crosses the full curve, that is, the decay parameter from the MDE-DH approximation, eqn (33), which goes like like κ2/κD2 ∼ 1 + τ2/2 for small τ. We may note that eqn (81) contains a τ2/2 contribution, namely from the term 1/2 in the coefficient of the τ2 term.
The ratio  for both divalent and monovalent electrolytes is plotted in Fig. 13d. For the 2:2 case the asymptote lies quite closely to the the accurate results in a wide interval, as we saw previously in Fig. 11. The asymptote in the 1:1 case joins the accurate curves from above,
  , in the dilute region, where these latter curves lie slightly above 1, as seen more clearly in the inset to Fig. 10b.
7 Summary and concluding remarks
This work is based on the following observations. In electrolytes there are several decay modes for the electrostatic interactions, each having a decay length and a magnitude. In the DH and PB approximations there is, however, only one mode that gives a screened Coulomb potential equal to ϕCoul*(r) = e−κDr/(4πε0εrr) with a decay length equal to the Debye length 1/κD and magnitude proportional to 1/εr. The mean electrostatic potential ψi(r) due to an ion of species i is in the DH approximation obtained for r > a by multiplying ϕCoul*(r) by the effective charge qeffi given by eqn (12), so we have ψi(r) = qeffie−κDr/(4πε0εrr). In the PB approximation ψi(r) decays for large r as the rhs of this expression.A correct treatment of electrolytes provides a screened Coulomb potential ϕCoul*(r) with multiple decay modes, where the modes give contributions like (cf.eqn (23))
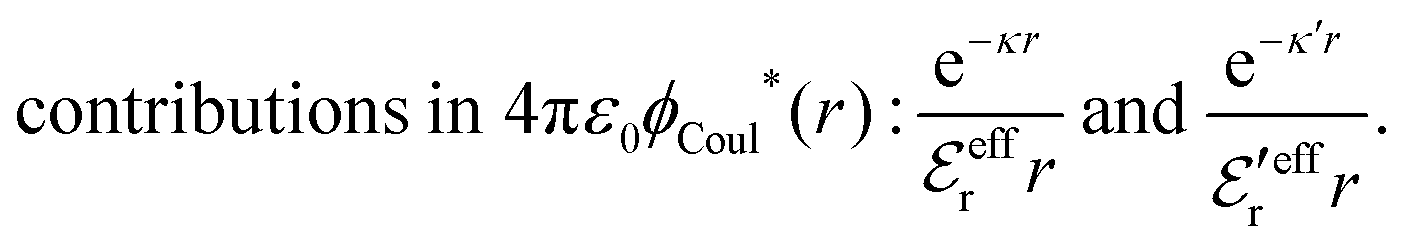 | (83) |
 and
and  , respectively, which are effective dielectric permittivities of the electrolyte for the respective mode. They depend on the dielectric response of the electrolyte. We have here only included the two main modes with the largest decay lengths. The mean electrostatic potential ψi(r) has the following principal contributions from these modes (cf.eqn (25))
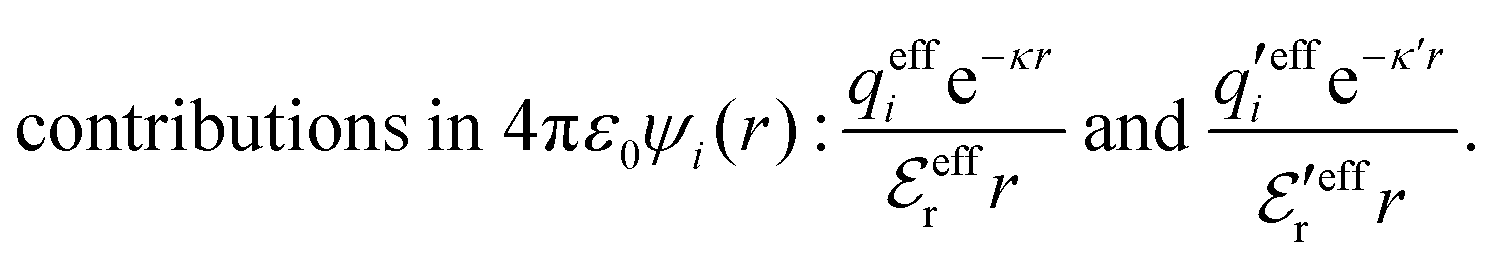 | (84) |
 are the effective charges of the i-ion, whereby each mode has its own value of this charge. The decay parameter κ can be expressed in terms of qeffj as
 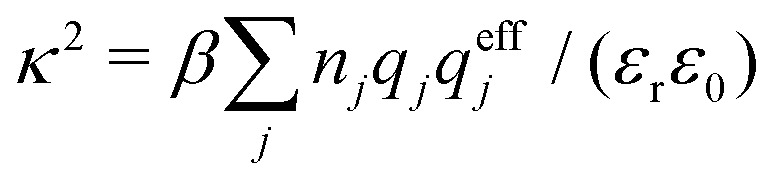 [eqn (4) and (24)] and κ′ is given by the analogous expression with
  . The electrostatic part of the potential of mean force wij(r) for species i and j has contributions with yet another factor of effective charge, namely (cf.eqn (21))
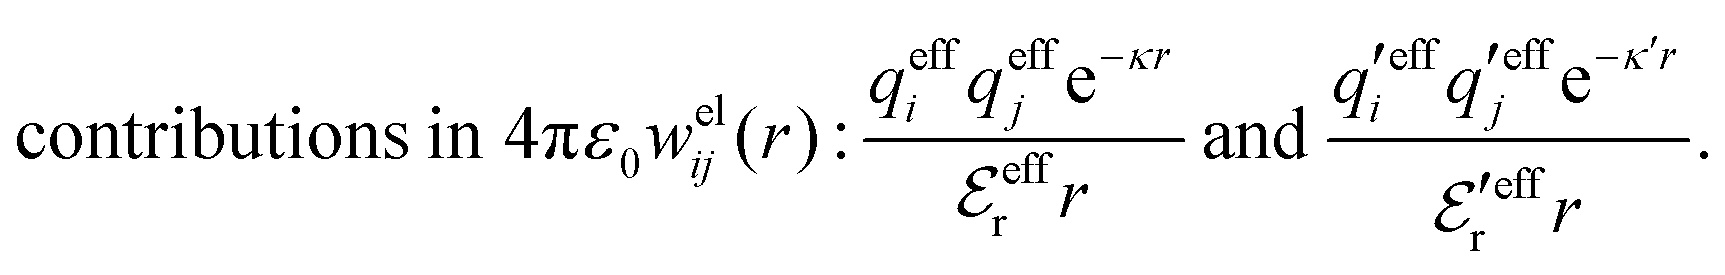 | (85) |
In the Multiple-Decay Extended Debye–Hückel, MDE-DH, approximation developed in the current work, one assumes as an approximation that solely the first two decay modes contribute to the electrostatics in electrolytes, so welij is given by the sum of the contributions in eqn (85). Furthermore one takes wij(r) = welij(r) + wcoreij(r), where wcoreij is the contribution from the ionic core–core correlations that is approximated by whs from a hard sphere fluid. The term wcoreij expresses a further decay mode for the interactions. We have
 | (86) |
 and
and  are derived and the resulting theory does not contain any fitting parameters.
For symmetric electrolytes with ions of diameter a, which is the main case treated in the current work, ψi(r) is proportional to the ionic charge qi, so the MDE-DH theory is a linearized approximation for the electrostatic response like, for example, the MSA, GMSA, LMPB, MDH and GDH theories. In contrast to these latter approximations, the MDE-DH theory contains the square term [βwelij(r)]2/2, which contributes to the pair distributions but not to ψi (see Section 4.2). This term guarantees that gij(r) ≥ 0 for all r and leads to a good thermodynamic consistency.
The approximation comes in two versions, the Simple and the Complete MDE-DH approximations (the differences between the two are explained in Section 4.2, eqn (55) ff.). The simple version is applicable when wcoreij is not too large, for example systems with small ions. Its results are in very good agreement with simulations and Hypernetted Chain calculations for all concentrations investigated, including high ones, provided the electrostatic coupling is not too high for instance monovalent electrolytes in water at room temperature. All numerical results in Section 4 apart from Fig. 7, where the ions are large, are calculated in this approximation. Furthermore, in the Simple MDE-DH approximation, there are simple analytical expressions for  and
and  [eqn (46) and (47)] and for the thermodynamic properties: the activity coefficient γ± is given by lnγ± = lnγel± + lnγcore± with lnγel± from eqn (64) and lnγcore± from eqn (60) and the osmotic coefficient ϕ = 1 + ϕel + ϕcont with ϕel from eqn (69) and ϕcont from eqn (68) [see also eqn (124)]. These expressions are valid also for complex-valued κ and κ′, but they are reformulated in Appendix C into equivalent formulas that are more easy to use for that case.
The Complete MDE-DH approximation is used to obtain the results in Fig. 7, which shows the pair distribution functions for a dense system with large monovalent ions. These results are in excellent agreement with simulations, including quite intricate details. It is, however, sufficient to use the formulas of Simple MDE-DH approximation to calculate the thermodynamic quantities for this case; the difference between the two versions of the approximation for these quantities is less than 1%. Thus, in practical applications, the simple version of the approximation is in many cases sufficient unless structural entities are required. This is agreement with the observation discussed in the Introduction that it is simpler to calculate thermodynamical entities than structural ones.
In the MDE-DH approximations and the other approximations with linearized electrostatic response mentioned above, we have κ ≥ κD for all concentration where κ is real, while the exact limiting law (5) says that there is under-screening, κ < κD, for sufficiently dilute solutions of symmetric electrolytes. This under-screening is caused by nonlinear electrostatic response of the electrolyte that is not included in the MDE-DH approximations. In order to investigate this matter, the nonlinear approximation given by the first equality in eqn (86) is used in the low density limit, where contributions from wcoreij and the second decay mode in welij go to zero and therefore can be neglected. The approximation where these contributions to wij are not included is called the Extended DHX, EDHX, approximation since it is an extension of the exponential Debye–Hückel, DHX, approximation (cf. Section 2).
The EDHX approximation is used to calculate κ and  for symmetric electrolytes and it is found that κ < κD for sufficiently dilute solutions in agreement with the exact limiting law. Furthermore, it is found that
  in the dilute region, while the linear approximations predict that
  . The EDHX results are thereby in agreement with the HNC approximation, which is considerably more complex. In the case of monovalent electrolytes in water at room temperature, it is found that this qualitatively incorrect behavior of the linear approximations has negligible consequences in practice because they occur for so low concentrations that the deviations of κ/κD and
  from 1 are miniscule.
For multivalent ions in water and monovalent ions in solvents with considerable lower εr, the situation is completely different and under-screening is very substantial for dilute solutions of symmetric electrolytes, as found by MC simulations, HNC calculations and experiments. Likewise,  is considerably larger than εr for the dilute solutions due to the nonlinear ion–ion correlation effects. An approximate limiting law (81) for symmetric electrolytes that extends the exact law by including higher order terms is derived in the EDHX approximation and a corresponding law for
  , eqn (82), is also derived. These approximate laws contain the ion size dependence of κ and
  for dilute solutions. Despite that they are strictly valid only for very low concentrations, they can be used as a reasonable approximation in a wider concentration interval to describe the effect of nonlinear ion–ion correlation effects in dilute electrolytes. The approximate limiting law for κ/κD is used to analyze the experimental results by Trefalt and coworkers104,105 for this ratio in aqueous multivalent electrolyte solutions and monovalent electrolytes dissolved in isopropanol. The law is successfully fitted to the experimental results for low concentrations whereby the ion diameter is the sole fitting parameter. This gives important insights into the reasons behind the deviations of κ from κD and mechanisms of the latter is discussed in some detail Section 6.
In order to give a further perspective on the decay modes and the associated entities in electrolytes, it is worthwhile to mention the following facts regarding more sophisticated models for electrolytes than the primitive model. Recall that for a classical plasma of spherical ions, the decay parameters κ, κ′ etc. satisfy the exact eqn (24) with εr = 1. For an electrolyte solution with molecular solvent, that is, in presence discrete polar molecules, we still have εr = 1 because the particles are in vacuum, but eqn (24) is not valid as it stands because it is, in fact, restricted to systems where all particles are spherically symmetric. The solvent molecules and any ion species that is not spherical give rise to additional terms in this equation that depend on the orientational degrees of freedom of these particles. The equation thereby is replaced by the following exact equation98
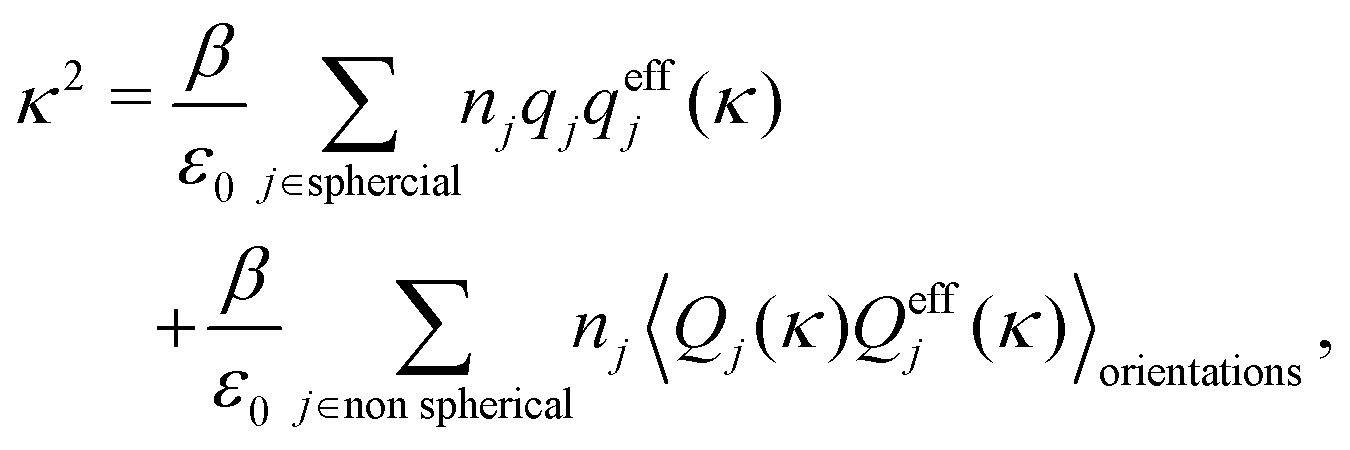 | (87) |
Eqn (87) has a rather complicated form. It is, however, mathematically equivalent to a much simpler, exact equation95,98
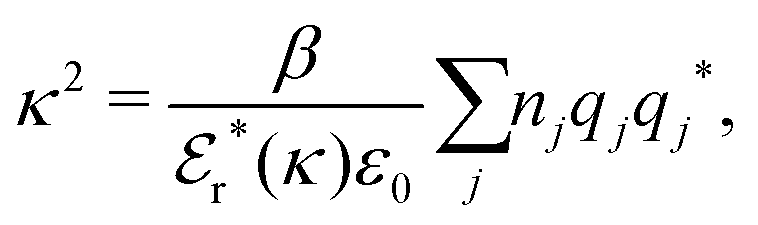 | (88) |
 , called the dielectric factor, is a kind of renormalized dielectric permittivity, which is not the same as
  . Both
  and
and  can be defined in terms of static dielectric response function of the electrolyte.95,98 Note that
  is a function of κ, while qj* is independent of κ and has the same value for all decay modes. The decay parameters κ, κ′ etc. are solutions to this equation and, of course, also solutions to the equivalent eqn (87).††††
 contains the major effects of solvent-solvent, solvent-ion and ion–ion correlations that are important for the decay mode with decay parameter κ. The value of qj* is, of course, also affected by these correlations, but since it does not depend on κ, it is not specific for any mode. The general eqn (88) has a form that is very similar to the definition (1) of the Debye parameter.
Thus there are two different entities  and
and  that take the role that εr has in the PB and DH approximations.
  appears in the eqn (88) for κ and
  appears, as we have seen, in the magnitude of, for example, the screened Coulomb potential ϕCoul*, the mean electrostatic potential ψj and the charge density ρj. Each mode has its own values for these entities.
In some PB, DH and other primitive model approaches one replaces εr by an ion-concentration dependent entity εelectrolyter, which is obtained from macroscopic measurements of the dynamic dielectric response of bulk electrolytes at finite but small frequency, whereby a zero frequency macroscopic response is extracted. This entity contains contributions from the orientational and translational degrees of freedom of the solvent molecules and from ion-solvent correlations that are not included in the primitive model. It is, however, not the same as  or
or  . When some mode has a small κ it may, however, be a reasonable approximation to set
  and
and  equal to εelectrolyter for that particular mode, but not for the other modes. When the ion concentration goes to zero,
  and
and  for the mode with longest decay length, which goes to the Debye length in this limit.
For a system with spherical particles, eqn (88) is mathematically equivalent to eqn (24). In the primitive model both  and
and  solely contains contributions from the ionic degrees of freedom.
Conflicts of interest
There are no conflicts to declare.Appendices
A Pair distribution functions for RPM, theoretical considerations
In this Appendix we will fill in the details regarding the pair distribution functions for RPM electrolytes in the MDE-DH approximation. As customary, we define the functions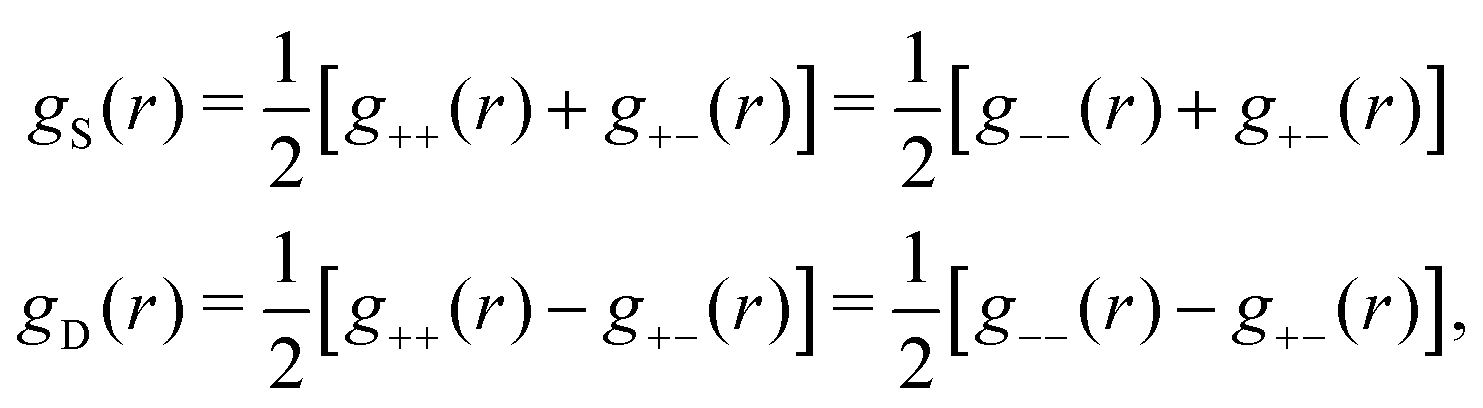 | (89) |
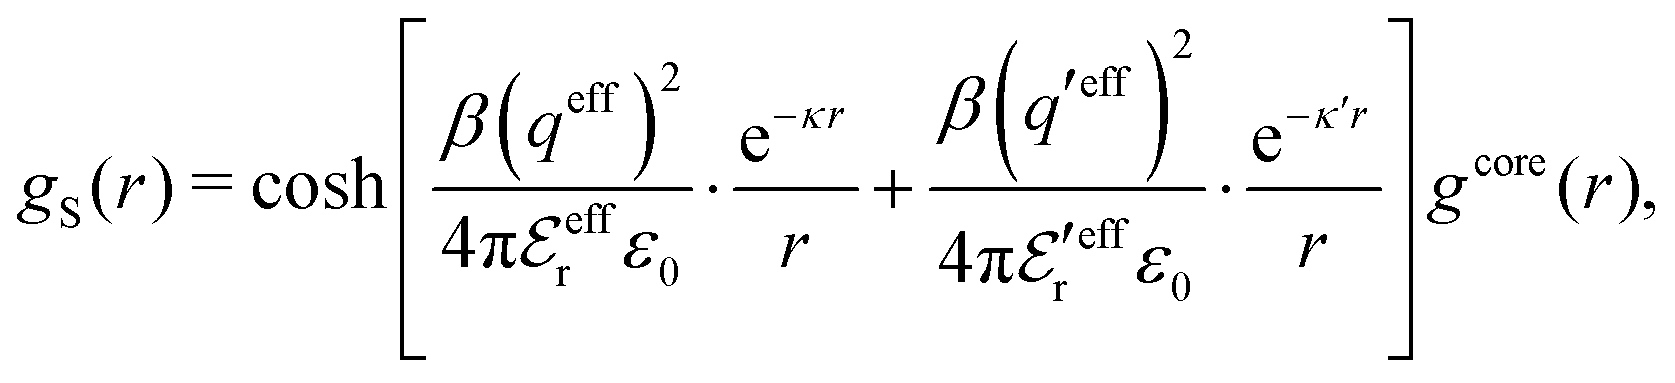 | (90) |
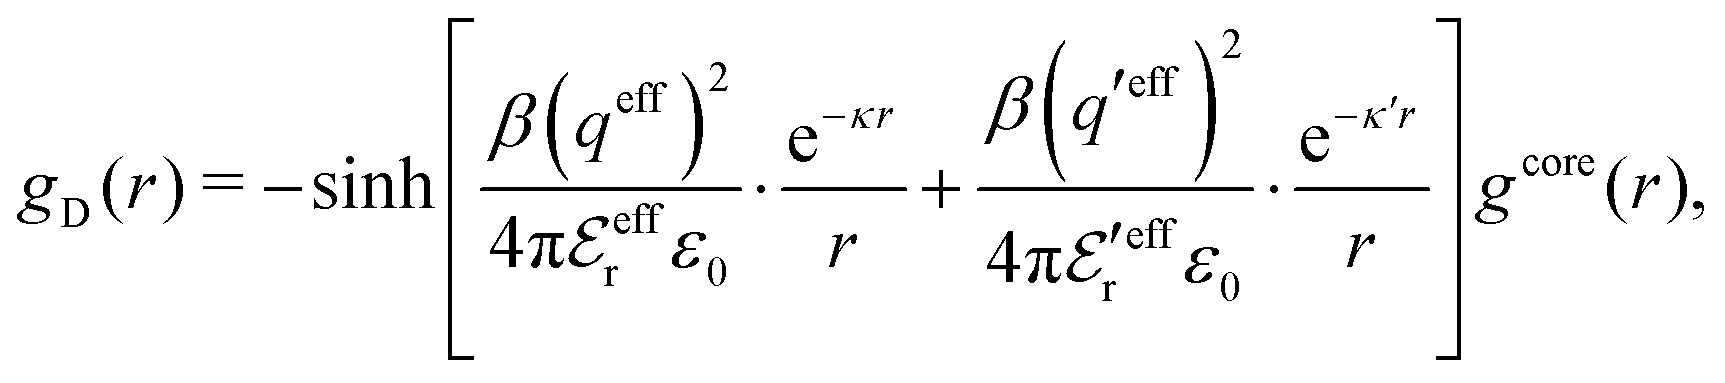 | (91) |
| ρ(r) = qn2gD(r) = qntotgD(r) | (92) |
When the electrostatic coupling is sufficiently weak, we can use the approximations cosh(x) ≈ 1 + x2/2 and sinh(x) ≈ x in these expressions and obtain as a good approximation
 | (93) |
| gD(r) = −βwel(r)gcore(r). | (94) |
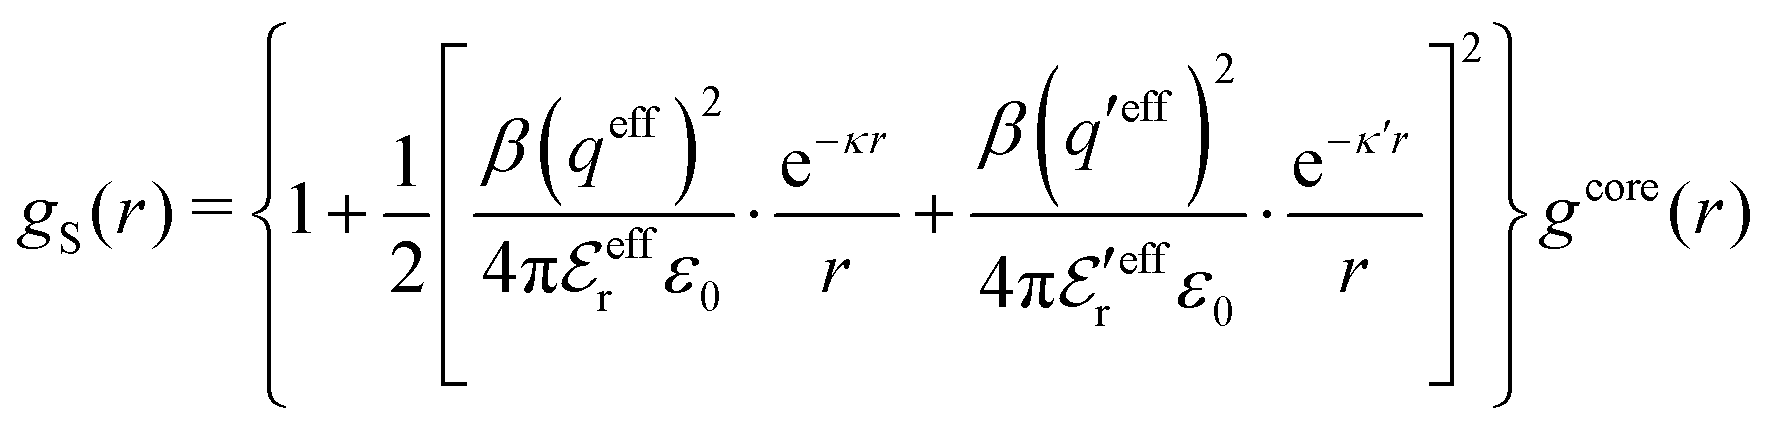 | (95) |
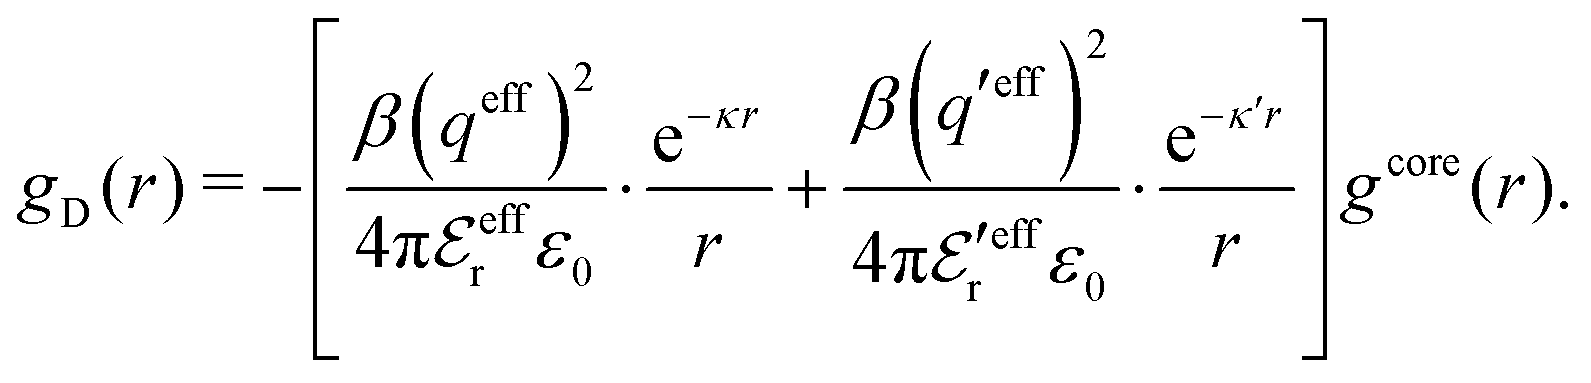 | (96) |
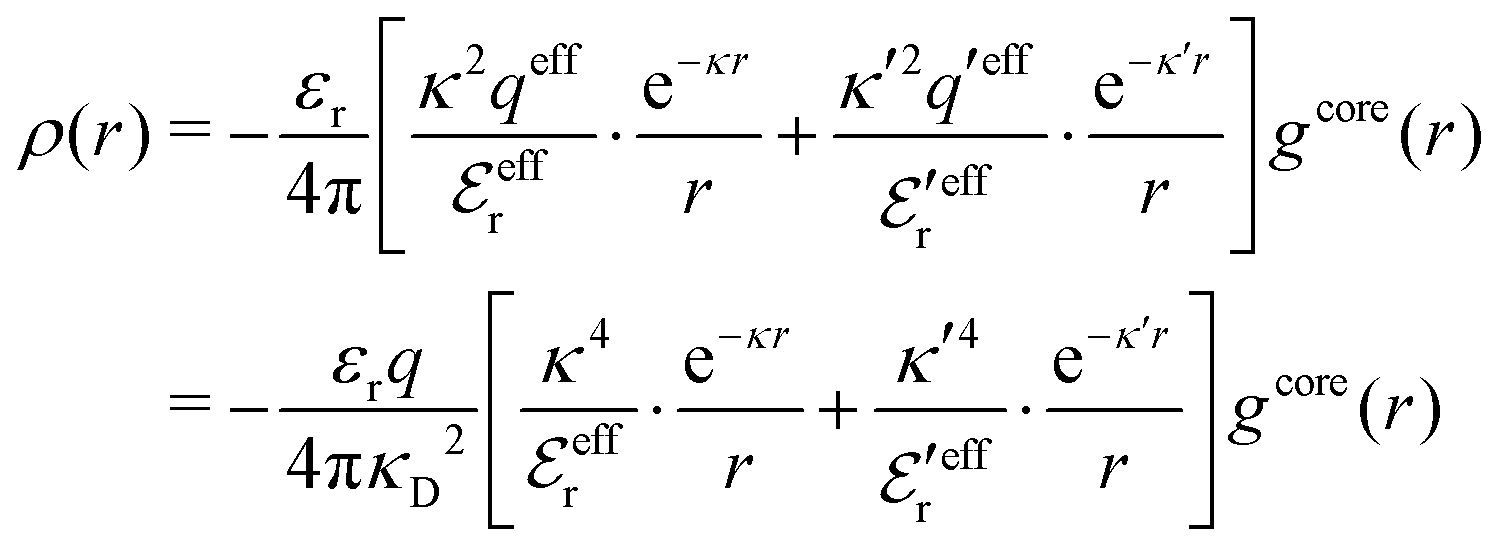 | (97) |
In the Simple MDE-DH approximation, where the cross-terms between hcore and wel are neglected, we obtain for r ≥ a
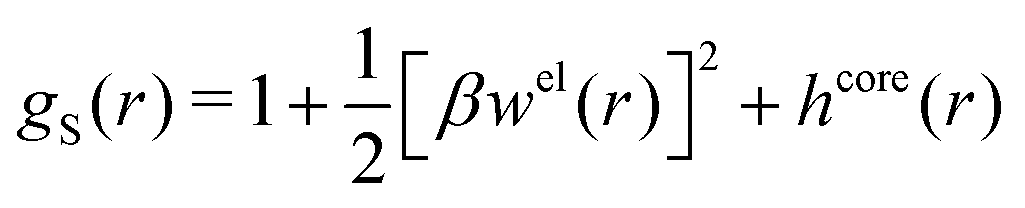 | (98) |
| gD(r) = −βwel(r) | (99) |
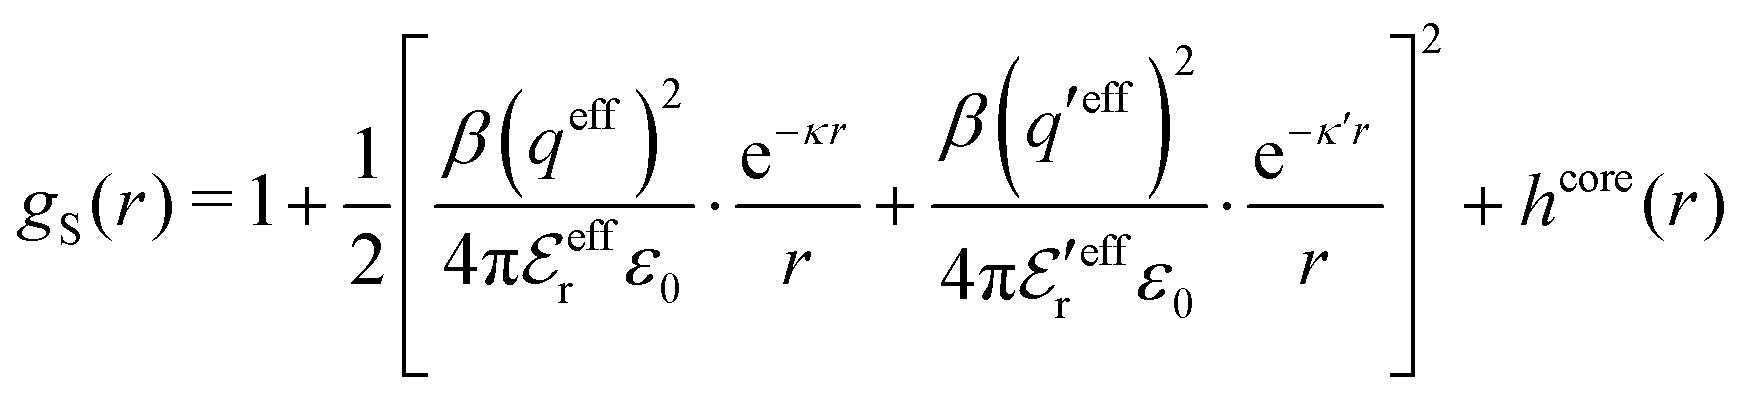 | (100) |
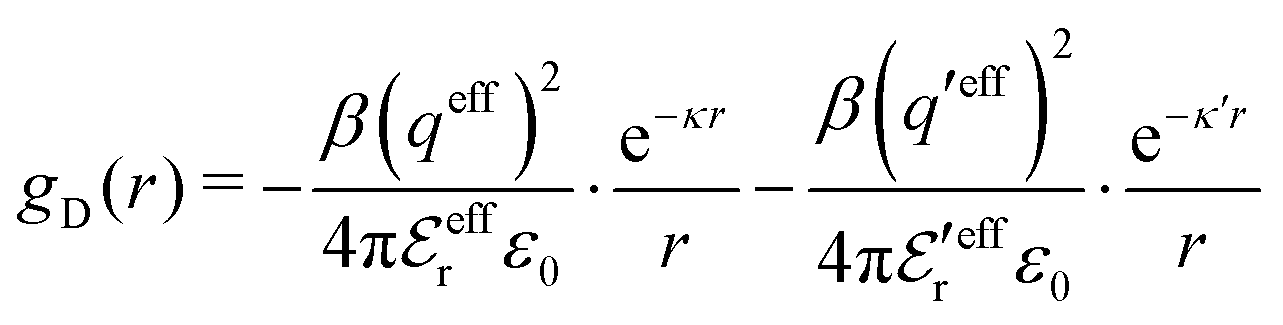 | (101) |
When one uses the Complete MDE-DH approximation, the expressions for  and
and  are different from eqn (44)–(49). As shown in Appendix B, the local electroneutrality and the Stillinger–Lovett second moment conditions yield
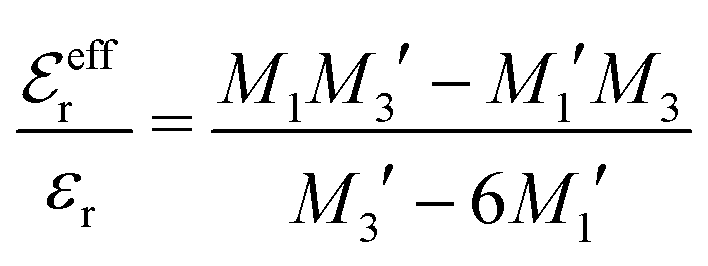 | (102) |
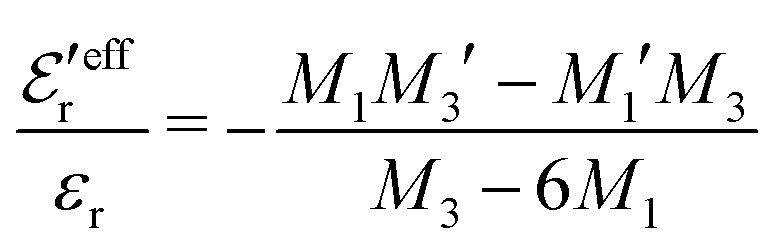 | (103) |
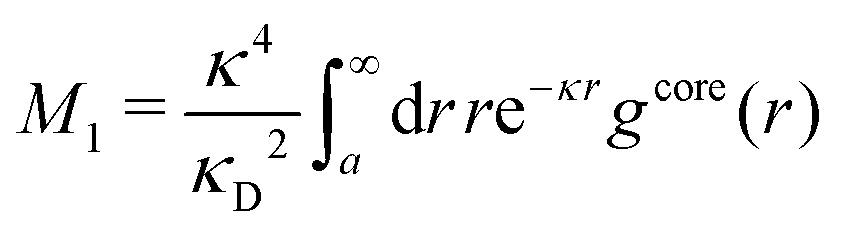 | (104) |
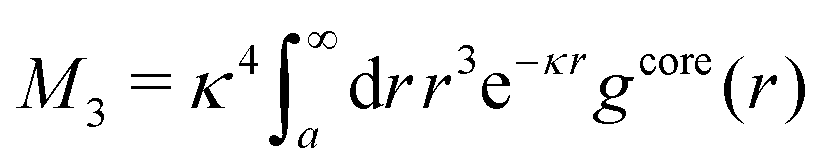 | (105) |
exp3(κa) and likewise for M1′ and M3′, whereby the result in eqn (46) and (47) is obtained as a good approximation.
In the case of complex-valued decay parameters κ and  , we have
  and
and  , whereby eqn (102) and (eqn 103) yield
  and
and  . Explicit expressions for
  and ϑ are given in Appendix B [eqn (109) and (110)]. From eqn (95) and (96) it follows that
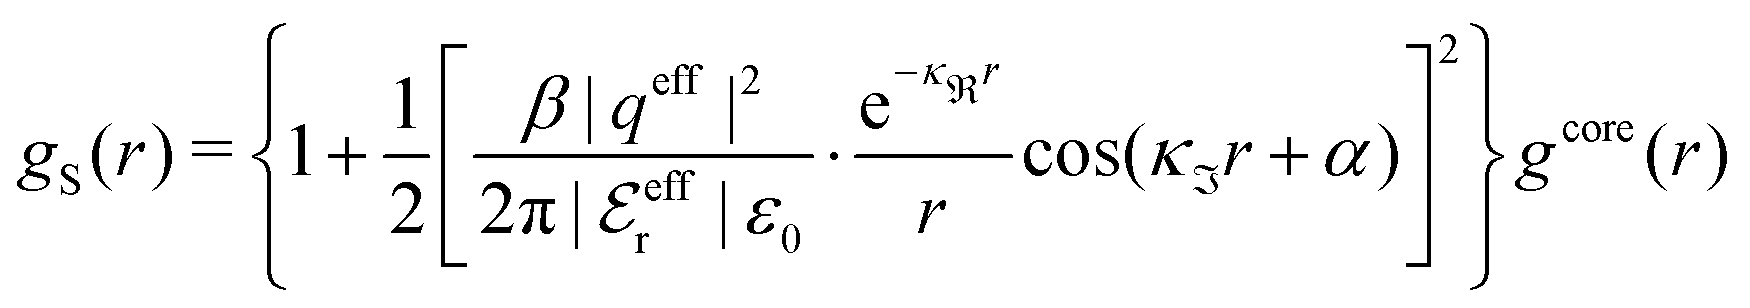 | (106) |
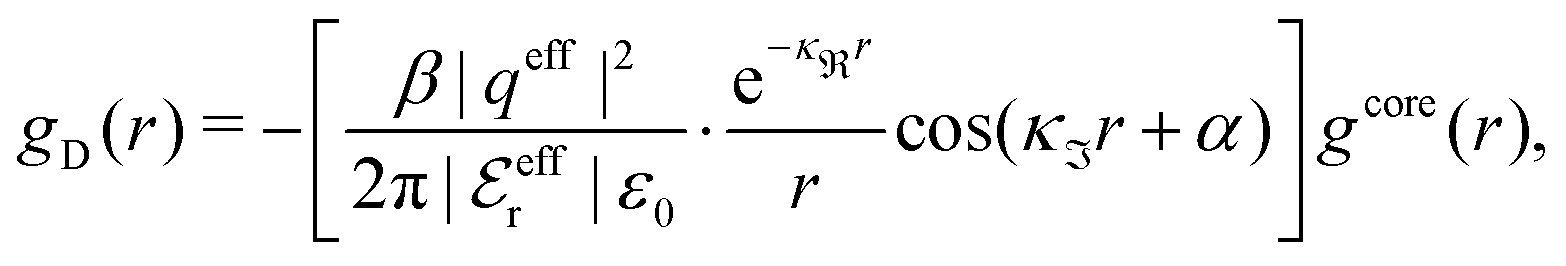 | (107) |
B Equations for  and
and 
In this Appendix we will derive eqn (102) and (103) of Appendix A for 

 and
and  of RPM electrolytes in the Complete MDE-DH approximation when κ and κ′ are real-valued. We will also obtain the corresponding equations for the complex-valued case.
We have from eqn (97)
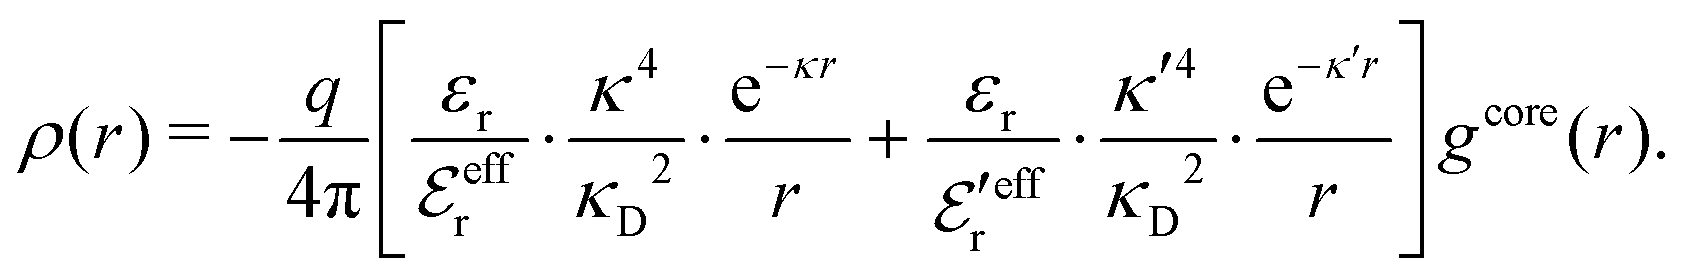
The local electroneutrality condition yields
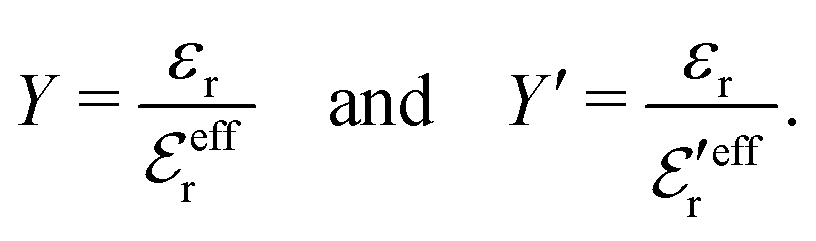
and the Stillinger–Lovett second moment condition (34), which can be written as
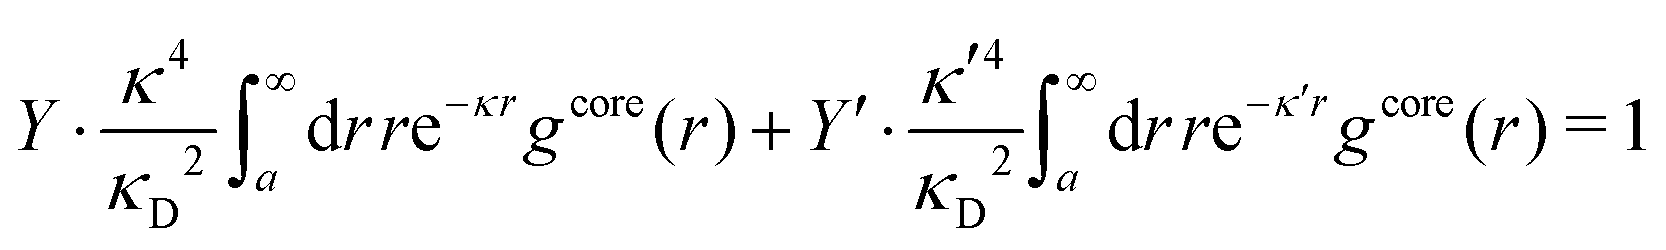
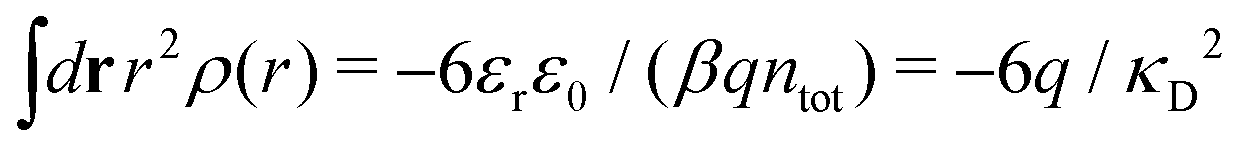 in the RPM, yields
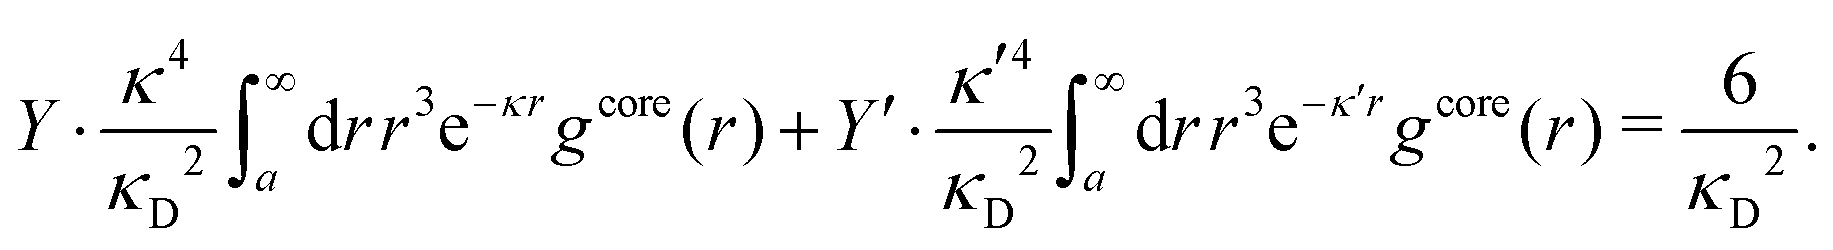
This set of equations can be expressed as
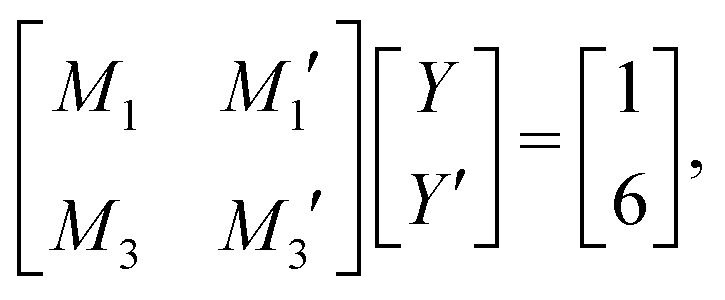 | (108) |
In the case of complex-valued decay parameters κ = κℜ + iκℑ = |κ|e−iθ and  we have
 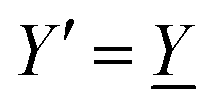 ,
,  and
and  . In this case we can write
 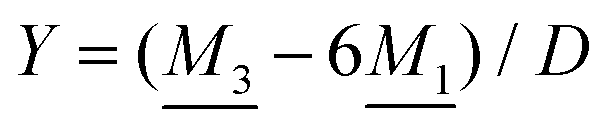 and
and  , where ℑ(·) means the imaginary part. Furthermore we have
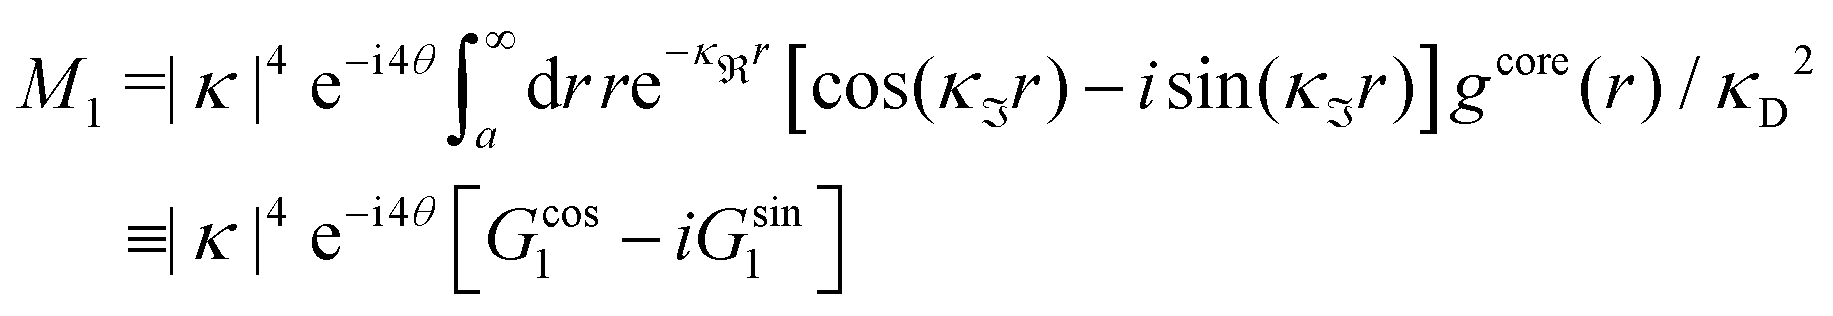
where Gcosν and −Gsinν are defined as the real and the complex parts of the integrals, respectively. We hence obtain
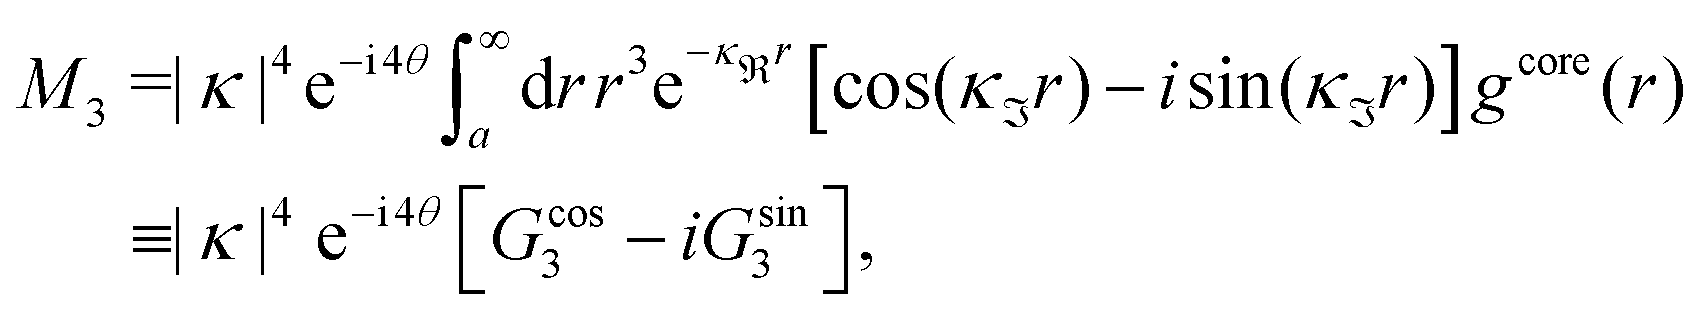
where we have used −i = ei3π/2. By extracting |Y| and arg(Y) we obtain
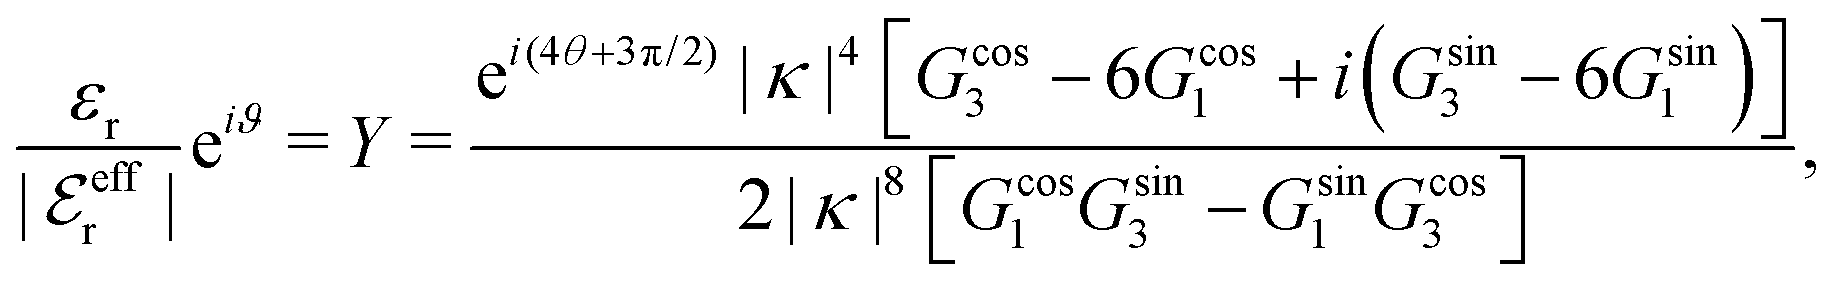
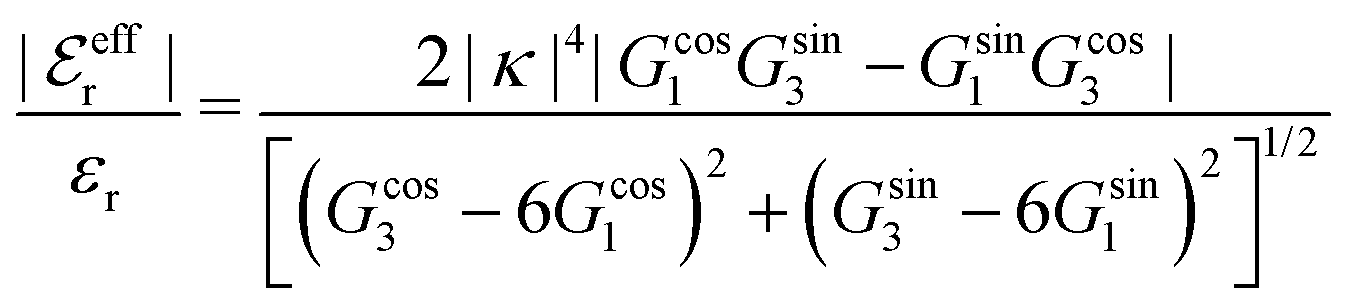 | (109) |
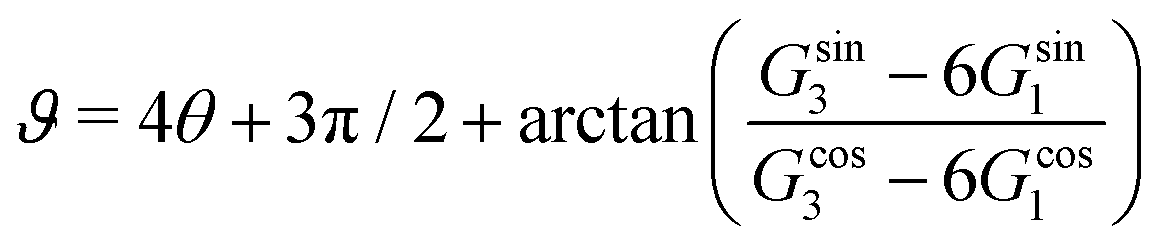 | (110) |
C Theoretical considerations for Uex, γ± and ϕ
Here we will present the theoretical details regarding the thermodynamic entities. The electrostatic contribution μex,eli to the excess chemical potential is, as we have seen, the free energy change (= the reversible work) when the charge of a sphere inserted in the electrolyte is changed from 0 to qi. It can be calculated via a coupling parameter integrationwhere uelij(r) = qiqj/(4πεrε0r) is the electrostatic pair potential, ξ is the coupling parameter 1 ≤ ξ ≤ 1, gij(r;ξ) is the pair distribution function around a partially charged ion with charge ξqi placed at the origin and ρi(r;ξ) is the charge density around this ion. All other ions are fully charged throughout. The corresponding contribution to the mean activity coefficient γ± is
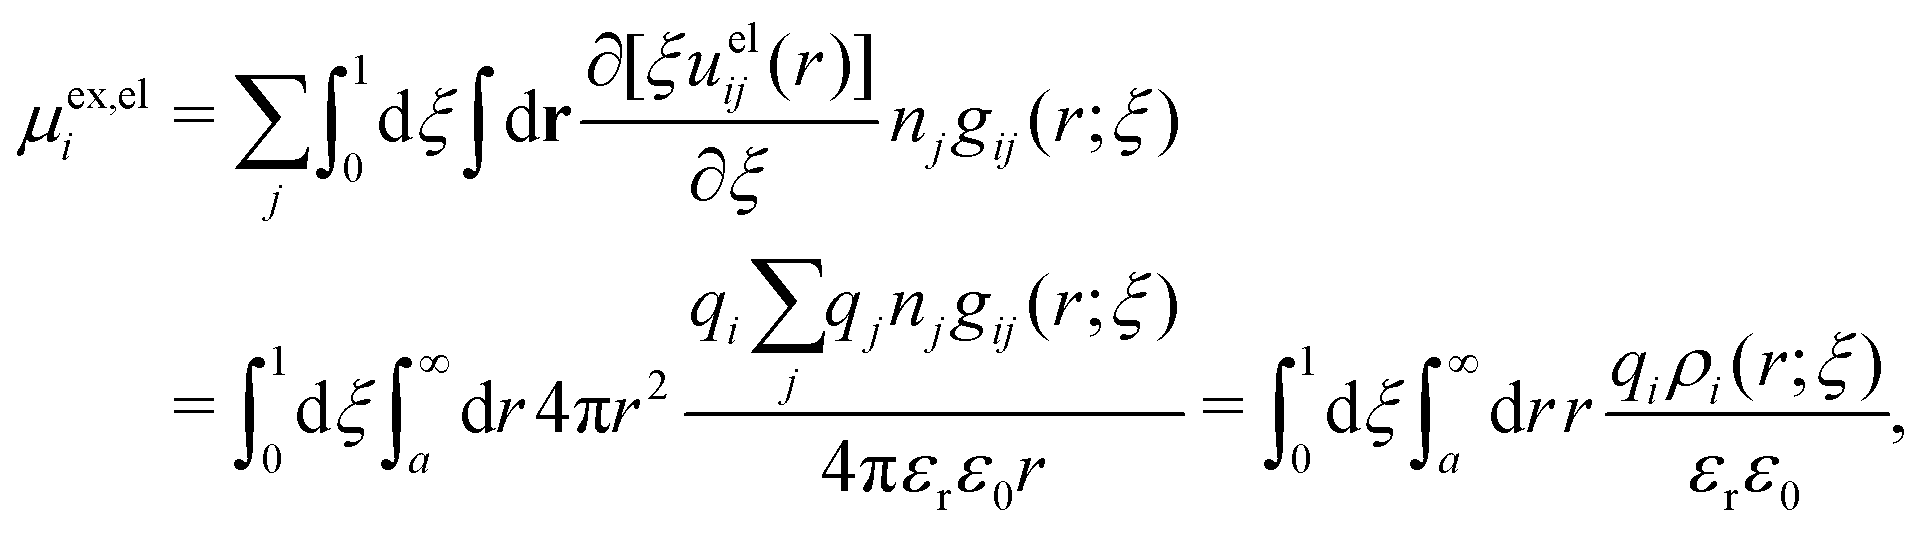
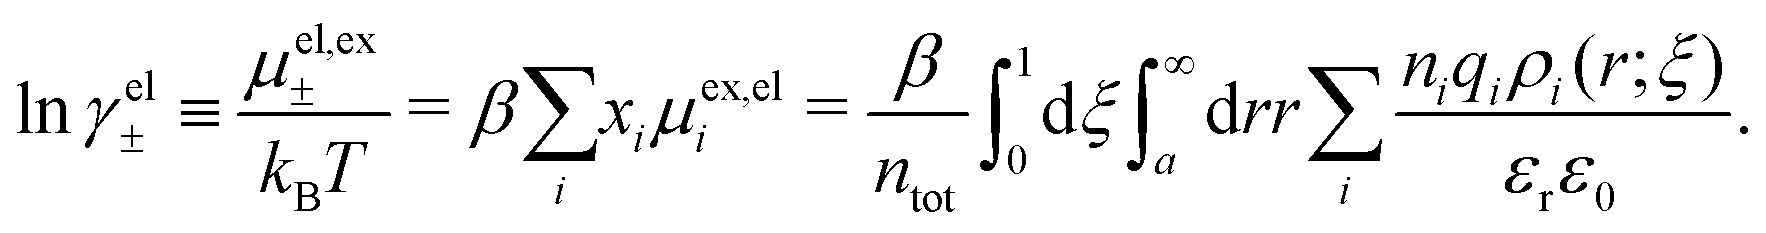 | (111) |
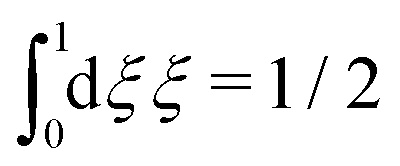 so we have
 | (112) |
γel± in eqn (62) and (63), respectively.
In the Simple MDE-DH approximation based on the Ansatz (43), we take ρi(r) from the second line in this equation and obtain after simplification
 | (113) |
γel± can be used as they stand, but they can alternatively be written in a more convenient manner as | (114) |
Note that tan
 ϑ can be obtained in terms of κℜ and κℑ from eqn (49).
The average internal energy U of the system is
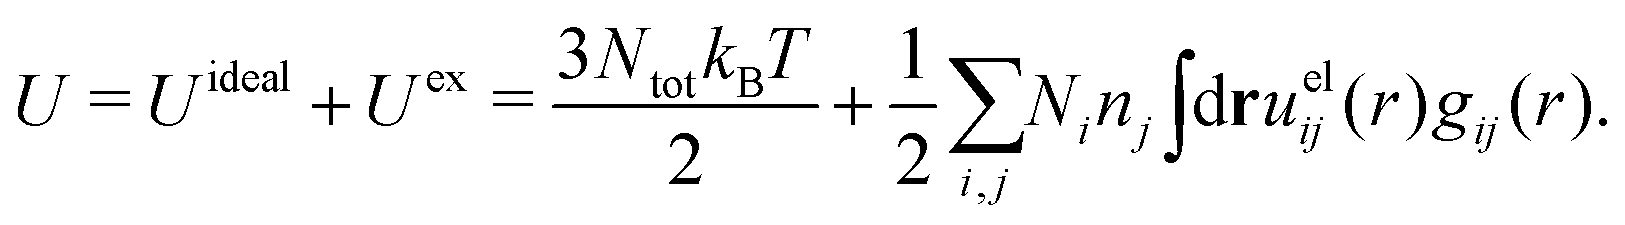
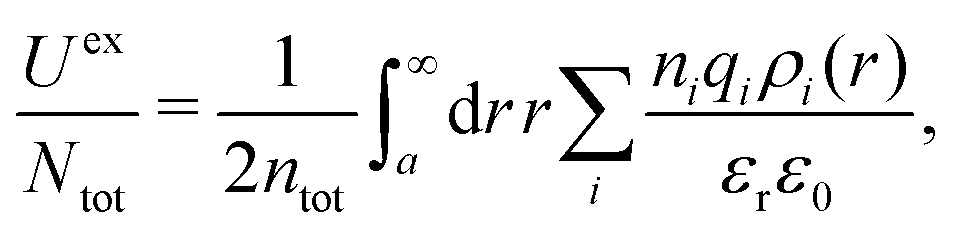 | (115) |
γel± in such cases. Consequently, in the Simple MDE-DH approximation βUex/Ntot is equal to the rhs of (eqn 113), so (eqn 65) follows when (eqn 33) is used. When κ and κ′ are complex, βUex/Ntot can be calculated from rhs of eqn (114).
Next, we treat the osmotic coefficient. The excess pressure of the electrolyte consists of two parts Pex = Pcont + Pel, where Pcont is the contact pressure evaluated at the hard core surfaces of the ions
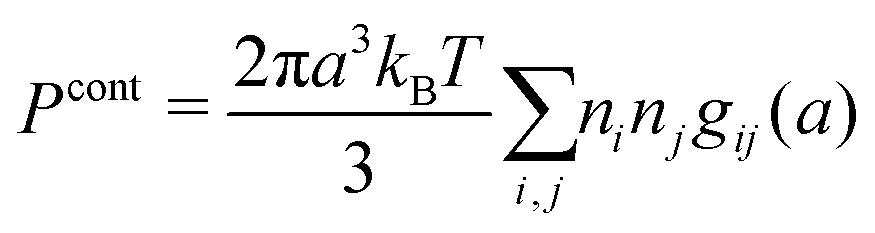 | (116) |
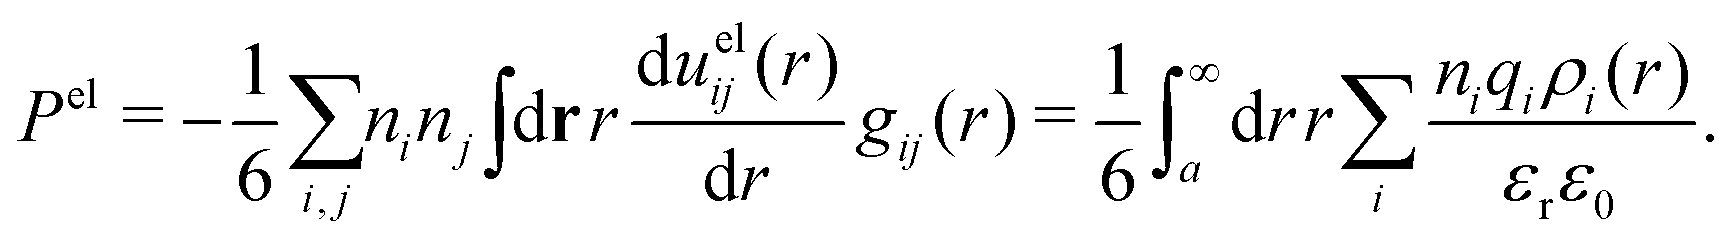 | (117) |
 | (118) |
In the Simple MDE-DH approximation based on the Ansatz (43) we obtain
 | (119) |
As mentioned in Section 4.3, the DH and MDH approximations show very poor consistency for lnγ± obtained from eqn (112) and that obtained from the osmotic coefficient viaeqn (71). The reason for this lies in the handling of the electrostatic contributions. Both approximations treat the core contribution consistently, because we have
 | (120) |
γcore± given in eqn (59). Eqn (120) follows from the fact that  for r ≥ a in the DH and MDH approximations, so we have
 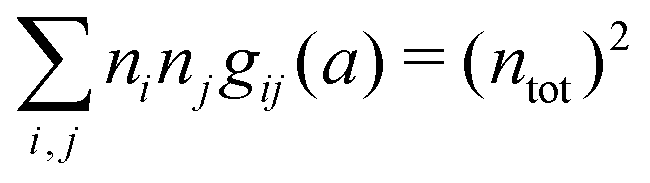 . The inconsistency originates from the fact that ϕel inserted into eqn (71) does not give the same electrostatic contribution as the one obtained from eqn (111). The latter is, in fact, a general feature of linear approximations, where the charge density ρi(r) is proportional to qi. This can be realized as follows.
For these kinds of approximations, lnγel± is calculated from eqn (112) and a comparison with the second term in eqn (118) shows that the integral is the same in both equations and that the prefactors differ only by a factor of 1/3, which implies that lnγel± = 3ϕel. This means that in eqn (71) one obtains one third of lnγel± from the first term on the rhs and that the second term must yield two thirds of lnγel± in order to have consistency. Thus the integral in this second term must be equal to one third of lnγel±, that is, equal to ϕel. Consistency is achieved provided the function ϕex(ntot) satisfies  , where we have made the substitutions ntot′ = t2 and ntot = s2. This implies that ϕel(s2) = Ks, that is,
  , where K is a constant. This is satisfied for the Debye–Hückel limiting law (2) for ϕex = ϕ − 1 at infinite dilution, but not otherwise. Since the limiting law is an exact result of statistical mechanics, it must obey the consistency requirement, but no other linear approximation can be consistent in the sense that ϕel inserted into eqn (71) yields lnγel± (except in the limit of infinite dilution).
Since the charge density ρi(r) is proportional to qi in the MDE-DH approximations, they share the same feature, that is, lnγel± is not obtained from ϕelvia the integration in eqn (71). However, ϕel is not the only contribution to ϕex where electrostatics matter in these approximations; there is a further contribution due to the quadratic terms in wel in eqn (55) and (58) in the complete and simple versions of this approximation, respectively. We will start by considering the Simple MDE-DH approximation and see that there is an electrostatic part in ϕcontact due to the presence of the quadratic term [βwel(r)]/2 in eqn (58) and hence in eqn (98). This is an important contribution that is necessary for the good agreement between the MDE-DH and MC data for ϕ in Fig. 8 and 9 and for the good consistency between the two different manners to calculate lnγ±.
From eqn (118) we obtain for the RPM
 | (121) |
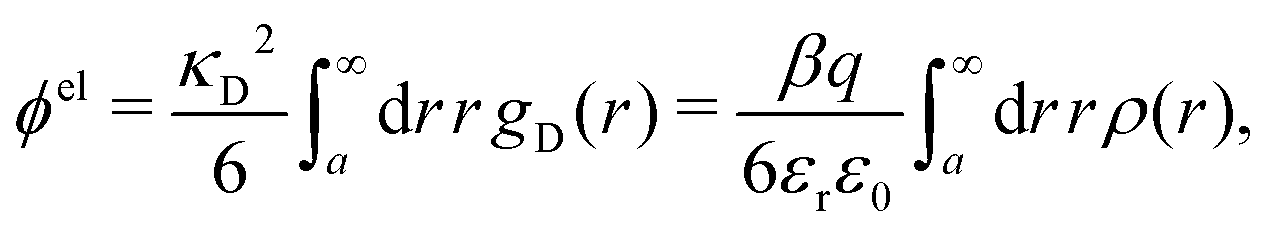 | (122) |
 | (123) |
 | (124) |
In the Complete MDE-DH approximation it follows from eqn (93) and (121) that
 | (125) |
 | (126) |
 | (127) |
γcore± is given by eqn (60).
D Asymptotic formulas at high dilution
In this appendix we consider κ2/κD2 and in very dilute solutions of symmetric electrolytes of ions with diameter a and derive approximate asymptotic formulas for these entities when τ = κDa → 0. These formulas will be extracted from eqn (76) and (77), which can be written as
 | (128) |
 | (129) |
 . We will extract all contributions to order τ2 or less, that is, up to and including contributions that are proportional to the total ionic density ntot. We do this by expanding sinhx = x + x3/3! + x5/5! + … and expressing the integrals involving [e−XτR/R]ν in terms of known functions, namely
and
where
 is the incomplete Gamma function and where we have defined
  from
from | (130) |
 . The function
  for m > 5 has the limit
 | (131) |
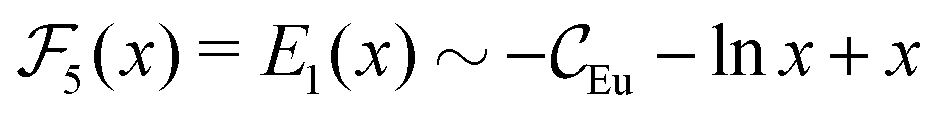 when x → 0, where
  is Euler's constant.
Using these results in eqn (128), which is the local electroneutrality condition, we obtain
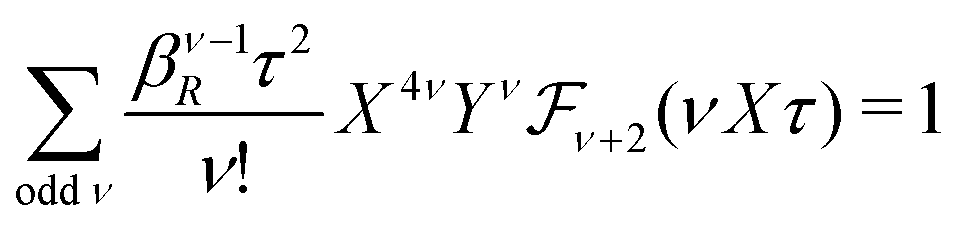 | (132) |
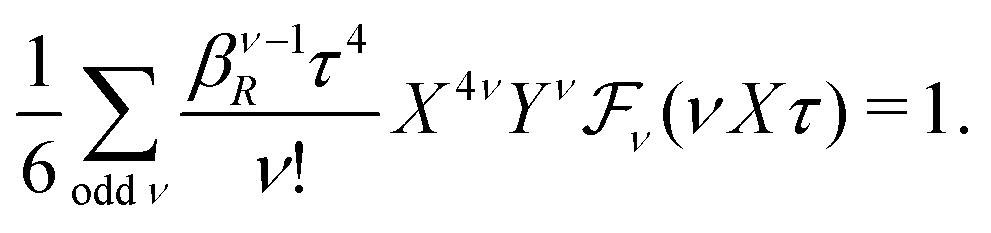 | (133) |
 when τ → 0, we have X = 1 + αX(τ) and Y = 1 + αY(τ), where the as yet unknown functions αX(τ) → 0 and αY(τ) → 0 when τ → 0. Hence
| Xl ∼ 1 + lαX(τ) and Yl ∼ 1 + lαY(τ) when τ → 0. | (134) |
We start with the Stillinger–Lovett condition (133). We first note that  when τ → 0. This implies that the term for ν = 5 in eqn (133) decays like −τ4lnτ in this limit. This factor decays faster than τ2 so the ν = 5 term can be skipped. Using eqn (131) we can see that the terms for ν > 5 decay like τ4, so they can also be skipped. Thus there remains only the terms for ν = 1 and 3.
The ν = 1 term in the left-hand side (lhs) of eqn (133) is
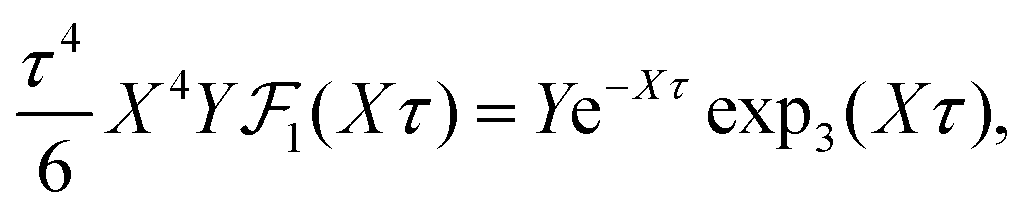
We now insert these terms into eqn (133), whereby we skip contributions that decay faster to zero than τ2 in order to extract the asymptote. In the ν = 3 term, the factor e−3Xτ(1 + 3Xτ) decays when τ → 0 like
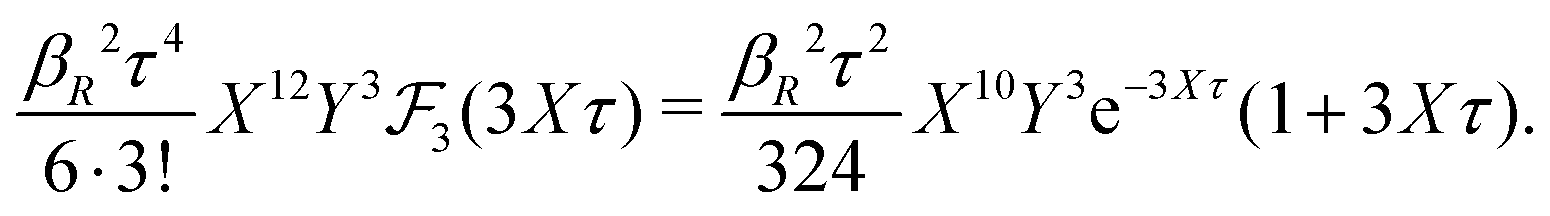
| e−3Xτ(1 + 3Xτ) ∼ 1 − (3Xτ)2/2 ∼ 1 − (3τ)2/2 − αX(τ)(3τ)2 ∼ 1 − (3τ)2/2, |
Now, e−Xτ
 exp3(Xτ) ∼ 1 − (Xτ)4/24 ∼ 1 − τ4/24, so [e−Xτexp3(Xτ)]−1 ∼ 1 + τ4/24, so we can finally conclude that
 | (135) |
We now proceed with the local electroneutrality condition (132). The ν = 1 term in the lhs of this equation is
Analogously to the previous arguments we find that τ2X12Y3 decays like τ2, so the entire ν = 3 term decays like up
to the order τ2. There are also contributions of the order τ2 from the terms with ν ≥ 5. The factor τ2X4νYν in these terms decays like τ2 and by using eqn (131) we see that the terms decay when τ → 0 like
The leading contribution from all terms with ν ≥ 5 is accordingly equal to βR2τ2s(βR2), where we have defined
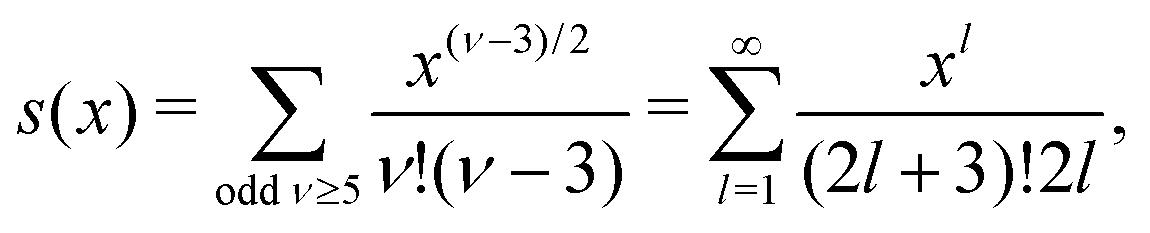 | (136) |
Now, from eqn (135) it follows that 1/Y decays like 1 + βR2τ2/324 and we have [e−Xτ(1 + Xτ)]−1 ∼ 1 + (Xτ)2/2 ∼ 1 + τ2/2. Thus we can finally conclude that
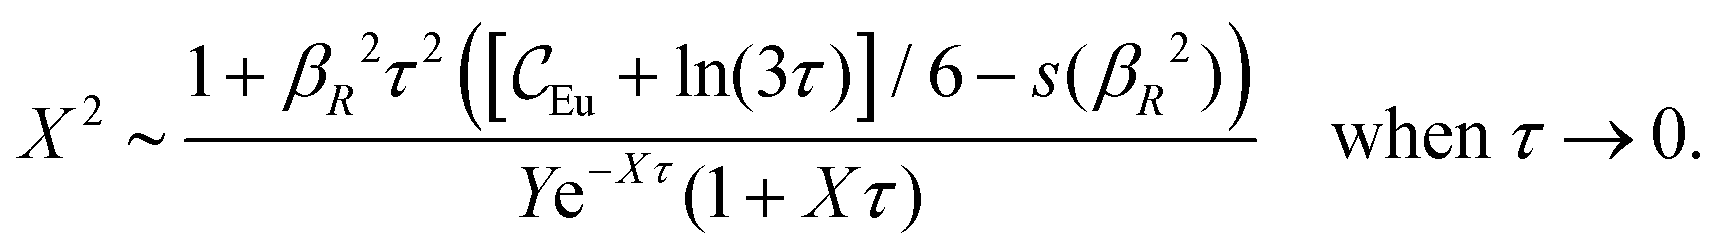
 | (137) |
Acknowledgements
I want to thank Andrés González de Castilla for giving me the inspiration to do this work, for interesting discussions on practical applications of the theory of electrolytes and for helpful comments on the manuscript of this paper. Gregor Trefalt is cordially thanked for sending me preprints and raw data for the measurements of the decay lengths in dilute electrolytes and for useful comments on the manuscript. I also want to thank Sture Nordholm for his constructive remarks on the paper.References
- M. Su and Y. Wang, Commun. Theor. Phys., 2020, 72, 067601 CrossRef.
- L. L. Lee, Molecular Thermodynamics of Electrolyte Solutions, World Scientific Publishing, Singapore, 2008 Search PubMed.
- L. M. Varela, M. García and V. Mosquera, Phys. Rep., 2003, 382, 1 CrossRef CAS.
- L. Lue, in Variational Methods in Molecular Modeling, ed. J. Wu, Springer, Singapore, 2017, p. 137 Search PubMed.
- B. Maribo-Mogensen, G. M. Kontogeorgis and K. Thomsen, Ind. Eng. Chem. Res., 2012, 51, 5353 CrossRef CAS.
- G. M. Kontogeorgis, B. Maribo-Mogensen and K. Thomsen, Fluid Phase Equilib., 2018, 462, 130 CrossRef CAS.
- P. Debye and E. Hückel, Phys. Z., 1923, 24, 185 CAS.
- K. S. Pitzer, J. Phys. Chem., 1973, 77, 268 CrossRef CAS.
- K. S. Pitzer and G. Mayorga, J. Phys. Chem., 1973, 77, 2300 CrossRef CAS.
- K. S. Pitzer, Acc. Chem. Res., 1977, 10, 371 CrossRef CAS.
- J. C. Rasiah, D. N. Card and J. P. Valleau, J. Chem. Phys., 1972, 56, 248 CrossRef.
- G. Hummer and D. M. Soumpasis, J. Chem. Phys., 1993, 98, 581 CrossRef CAS.
- J. G. Kirkwood, Chem. Rev., 1936, 19, 275 CrossRef CAS.
- J. G. Kirkwood and J. C. Poirier, J. Phys. Chem., 1954, 58, 591 CrossRef CAS.
- G. A. Martynov, Sov. Phys. - Usp., 1967, 10, 171 CrossRef.
- C. W. Outhwaite in Statistical Mechanics: A Specialist Periodical Report, ed. K. Singer, The Chemical Society, London, 1975, vol. 2, p. 188 Search PubMed.
- P. Keblinski, J. Eggebrecht, D. Wolf and S. R. Phillpot, J. Chem. Phys., 2000, 113, 282 CrossRef CAS.
- J. Ulander and R. Kjellander, J. Chem. Phys., 2001, 114, 4893 CrossRef CAS.
- F. Coupette, A. A. Lee and A. Härtel, Phys. Rev. Lett., 2018, 121, 075501 CrossRef CAS.
- Supplementary material for ref. 19 at http://link.aps.org/supplemental/10.1103/PhysRevLett.121.075501.
- J. Ennis, PhD thesis, Australian National University, 1993.
- J. Ennis, R. Kjellander and D. J. Mitchell, J. Chem. Phys., 1995, 102, 975 CrossRef CAS.
- J. Ulander and R. Kjellander, J. Chem. Phys., 1998, 109, 9508 CrossRef CAS.
- R. J. F. Leote de Carvalho and R. Evans, Mol. Phys., 1994, 83, 619 CrossRef.
- E. Waismann and J. L. Lebowitz, J. Chem. Phys., 1972, 56, 3086 CrossRef.
- E. Waismann and J. L. Lebowitz, J. Chem. Phys., 1972, 56, 3093 CrossRef.
- C. W. Outhwaite and V. C. L. Hutson, Mol. Phys., 1975, 29, 1521 CrossRef CAS.
- L. Blum. in Theoretical Chemistry, Advances and Perspectives, ed. H. Eyring and D. Henderson, Academic Press, New York, 1980, vol. 5, p. 1 Search PubMed.
- L. Blum, J. N. Herrera and J. F. Rojas-Rodríguez, Rev. Mex. Fis., 1995, 41, 618 CAS.
- C. W. Outhwaite, Chem. Phys. Lett., 1970, 5, 77 CrossRef CAS.
- C. W. Outhwaite and L. B. Bhuiyan, Condens. Matter Phys., 2019, 22, 23801 CrossRef.
- R. Kjellander, J. Phys. Chem., 1995, 99, 10392 CrossRef CAS.
- D. G. Hall, Z. Phys. Chem., 1991, 174, 89 CrossRef CAS.
- B. P. Lee and M. E. Fisher, Phys. Rev. Lett., 1996, 76, 2906 CrossRef CAS.
- B. P. Lee and M. E. Fisher, Europhys. Lett., 1997, 39, 611 CrossRef CAS.
- L. M. Varela, M. Perez-Rodriguez, M. Garcia, F. Sarmiento and V. Mosquera, J. Chem. Phys., 1998, 109, 1930 CrossRef CAS.
- L. M. Varela, M. Perez-Rodriguez, M. García and V. Mosquera, J. Chem. Phys., 2000, 113, 292 CrossRef CAS.
- L. M. Varela, J. M. Ruso, M. García and V. Mosquera, J. Chem. Phys., 2000, 113, 10174 CrossRef CAS.
- L. M. Varela, M. García and V. Mosquera, Physica A, 2003, 323, 75 CrossRef CAS.
- M. Ding, Y. Liang, B.-S. Lu and X. Xing, J. Stat. Phys., 2016, 165, 970 CrossRef CAS.
- Y. Avni, R. M. Adar and D. Andelman, Phys. Rev. E, 2020, 101, 010601 CrossRef CAS.
- R. Triolo, J. R. Grigera and L. Blum, J. Chem. Phys., 1976, 80, 1858 CrossRef CAS.
- L. Blum and J. S. Høye, J. Chem. Phys., 1977, 81, 1311 CrossRef CAS.
- T. Sun, J.-L. Lénard and A. S. Teja, J. Phys. Chem., 1994, 98, 6870 CrossRef CAS.
- B. Larsen, G. Stell and K. C. Wu, J. Chem. Phys., 1977, 67, 530 CrossRef CAS.
- M. C. Abramo, C. Caccamo and G. Pizzimenti, J. Chem. Phys., 1983, 78, 357 CrossRef CAS.
- G. Stell and S. F. Sun, J. Chem. Phys., 1975, 63, 5333 CrossRef CAS.
- T. Xiao and X. Song, J. Chem. Phys., 2011, 135, 104104 CrossRef.
- T. Xiao, Electrochim. Acta, 2015, 178, 101 CrossRef CAS.
- T. Xiao and X. Song, J. Chem. Phys., 2017, 146, 124118 CrossRef.
- J. Rasaiah, Chem. Phys. Lett., 1970, 7, 260 CrossRef CAS.
- J. C. Rasiah, J. Chem. Phys., 1972, 56, 3071 CrossRef.
- B. Larsen, J. Chem. Phys., 1978, 68, 4511 CrossRef CAS.
- P. Sloth and T. S. Sørensen, J. Phys. Chem., 1990, 94, 2116 CrossRef CAS.
- E. Gutiérrez-Valladares, M. Lukšič, B. Millán-Malo, B. Hribar-Lee and V. Vlachy, Condens. Matter Phys., 2011, 14, 33003 CrossRef.
- T. L. Croxton and D. A. McQuarrie, J. Phys. Chem., 1979, 83, 1840 CrossRef CAS.
- T. Ichiye and A. D. J. Haymet, J. Chem. Phys., 1990, 93, 8954 CrossRef CAS.
- D.-M. Duh and A. D. J. Haymet, J. Chem. Phys., 1992, 97, 7716 CrossRef CAS.
- C. S. Babu and T. Ichiye, J. Chem. Phys., 1994, 100, 9147 CrossRef CAS.
- T.-H. Chung and L. L. Lee, J. Chem. Phys., 2009, 130, 134513 CrossRef.
- J. W. Zwanikken, P. K. Jha and M. Olvera de la Cruz, J. Chem. Phys., 2011, 135, 064106 CrossRef.
- D. M. Burley, V. C. L. Hutson and C. W. Outhwaite, Mol. Phys., 1972, 23, 867 CrossRef CAS.
- C. W. Outhwaite, M. Molero and L. B. Bhuiyan, J. Chem. Soc., Faraday Trans., 1993, 89, 1315 RSC.
- A. O. Quiñones, L. B. Bhuiyan and C. W. Outhwaite, Condens. Matter Phys., 2018, 21, 23802 CrossRef.
- M. Su, Z. Xu and Y. Wang, J. Phys.: Condens. Matter, 2019, 31, 355101 CrossRef CAS.
- A. L. Kholodenko and A. L. Beyerlein, Phys. Rev. A: At., Mol., Opt. Phys., 1986, 34, 3309 CrossRef CAS.
- D. di Caprio, J. Stafiej and J. P. Badiali, J. Chem. Phys., 1998, 108, 8572 CrossRef CAS.
- R. R. Netz and H. Orland, Europhys. Lett., 1999, 45, 726 CrossRef CAS.
- R. R. Netz and H. Orland, Eur. Phys. J. E: Soft Matter Biol. Phys., 2000, 1, 67 CrossRef CAS.
- J.-M. Caillol, J. Stat. Phys., 2004, 115, 1461 CrossRef.
- D. N. Card and J. P. Valleau, J. Chem. Phys., 1970, 52, 6232 CrossRef CAS.
- J. P. Valleau and L. K. Cohen, J. Chem. Phys., 1980, 72, 5935 CrossRef CAS.
- J. P. Valleau, L. K. Cohen and D. N. Card, J. Chem. Phys., 1980, 72, 5942 CrossRef CAS.
- W. van Megen and I. K. Snook, Mol. Phys., 1980, 39, 1043 CrossRef CAS.
- P. Sloth, T. S. Sørensen and J. B. Jensen, J. Chem. Soc., Faraday Trans. 2, 1987, 83, 881 RSC.
- T. S. Sørensen, P. Sloth, H. B. Nielsen and J. B. Jensen, Acta Chem. Scand., Ser. A, 1988, 42, 237 CrossRef.
- B. R. Svensson and C. E. Woodward, Mol. Phys., 1988, 64, 247 CrossRef CAS.
- Z. Abbas, E. Ahlberg and S. Nordholm, Fluid Phase Equilib., 2007, 260, 233 CrossRef CAS.
- Z. Abbas, E. Ahlberg and S. Nordholm, J. Phys. Chem. B, 2009, 113, 5905 CrossRef CAS.
- J. Janecek and R. R. Netz, J. Chem. Phys., 2009, 130, 074502 CrossRef.
- R. Kjellander and J. Ulander, Mol. Phys., 1998, 95, 495 CrossRef CAS.
- A. McBride, M. Kohonen and P. Attard, J. Chem. Phys., 1998, 109, 2423 CrossRef CAS.
- B. Forsberg, J. Ulander and R. Kjellander, J. Chem. Phys., 2005, 122, 064502 CrossRef.
- P. Attard, Phys. Rev. E: Stat., Nonlinear, Soft Matter Phys., 1993, 48, 3604 CrossRef CAS.
- N. Bjerrum, Kgl. Dan. Vidensk. Selsk. Mat.-Fys. Medd., 1926, 7, 1 CAS.
- H. Yokoyama and H. Yamatera, Bull. Chem. Soc. Jpn., 1975, 48, 1770 CrossRef CAS.
- M. E. Fisher and Y. Levin, Phys. Rev. Lett., 1993, 71, 3826 CrossRef CAS.
- Y. Levin and M. E. Fisher, Physica A, 1996, 225, 164 CrossRef CAS.
- W. Ebeling and M. Grigo, Ann. Phys., 1980, 37, 21 CrossRef CAS.
- T. Cartailler, P. Turq, L. Blum and N. Condamine, J. Phys. Chem., 1992, 96, 6766 CrossRef CAS.
- Y. Zhou, S. Yeh and G. Stell, J. Chem. Phys., 1995, 102, 5785 CrossRef CAS.
- S. Yeh, Y. Zhou and G. Stell, J. Phys. Chem., 1996, 100, 1415 CrossRef CAS.
- D. M. Zuckerman, M. E. Fisher and B. P. Lee, Phys. Rev. E: Stat., Nonlinear, Soft Matter Phys., 1997, 56, 6569 CrossRef CAS.
- R. Kjellander, J. Chem. Phys., 2016, 145, 124503 CrossRef.
- R. Kjellander, J. Chem. Phys., 2018, 148, 193701 CrossRef.
- Z. Abbas, M. Gunnarsson, E. Ahlberg and S. Nordholm, J. Colloid Interface Sci., 2001, 243, 11 CrossRef CAS.
- N. F. Carnahan and K. E. Starling, J. Chem. Phys., 1969, 51, 635 CrossRef CAS.
- R. Kjellander, Soft Matter, 2019, 15, 5866 CAS.
- M. A. Gebbie, A. M. Smith, H. A. Dobbs, A. A. Lee, G. G. Warr, X. Banquy, M. Valtiner, M. W. Rutland, J. N. Israelachvili, S. Perkin and R. Atkin, Chem. Commun., 2017, 53, 1214 RSC.
- R. Kjellander and D. J. Mitchell, Chem. Phys. Lett., 1992, 200, 76 CrossRef CAS.
- R. Kjellander and D. J. Mitchell, J. Chem. Phys., 1994, 101, 603 CrossRef CAS.
- D. J. Mitchell and B. W. Ninham, Chem. Phys. Lett., 1978, 53, 397 CrossRef CAS.
- P. Kékicheff and B. W. Ninham, Europhys. Lett., 1990, 12, 471 CrossRef.
- A. M. Smith, P. Maroni, G. Trefalt and M. Borkovec, J. Phys. Chem. B, 2019, 123, 1733 CrossRef CAS.
- B. Stojimirović, M. Galli and G. Trefalt, Phys. Rev. Res., 2020, 2, 023315 CrossRef.
- R. Kjellander and R. Ramirez, J. Phys.: Condens. Matter, 2005, 17, S3409 CrossRef CAS.
- D. D. Carley, J. Chem. Phys., 1967, 46, 3783 CrossRef CAS.
- F. H. Stillinger and R. Lovett, J. Chem. Phys., 1968, 48, 3858 CrossRef CAS.
- L. Verlet and J.-J. Weis, Phys. Rev. A: At., Mol., Opt. Phys., 1972, 5, 939 CrossRef.
- W. R. Smith, D. J. Henderson, P. J. Leonard, J. A. Barker and E. W. Grundke, Mol. Phys., 2008, 106, 3 CrossRef CAS.
Footnotes |
| † In fact, κeff is evaluated in ref. 80 from the simulations via a route that implies that κeff satisfies Attard's approximate SCSL84 equation for κ [eqn (38) in the current work]. This is the reason why κeff from the simulations agrees with κ from the SCSL approximation; see the authors' remark about this agreement in the text below eqn (47) in ref. 80. Any difference between the two values is due numerical noise in the simulation. |
| ‡ An exception is charge-inversion invariant systems, for example, the restricted primitive model where anions and cations are identical apart from their sign of charge. In real systems, the anions and cations differ by more than the signs of their charges, so the systems are not charge-inversion invariant. |
| § In this work “exact relationship,” “exact equation” etc. mean that they are derived without any approximations in statistical mechanics for a given model, that is, for a given Hamiltonian that defines the system. |
| ¶ The term proportional to Λ in eqn (5) was originally derived in ref. 102. |
| || The function ϕCoul*(r) is, in fact, a Green's function for spatial propagation of electrostatic field the electrolyte,98 which is the proper way to define it. |
** The notation used here differs from that in the original DIT papers ref. 22, 23, 100 and 101, where the product  is denoted as E or is denoted as E or  and the present qeffj is denoted as qj*, while qj* in the present work denotes something different (see Section 7). and the present qeffj is denoted as qj*, while qj* in the present work denotes something different (see Section 7). |
| †† Examples of such terms include terms that decay like f(r)e−2κr/r2, where f(r) is a slowly varying function,23,101 and cross-terms between the various modes (cf.ref. 98). Among these terms there are also core–core correlation contributions, which in the restricted primitive model can be distinguished from the electrostatic contributions. In the approximation used in the present work, the core–core contributions are approximated by a hard sphere correlation term wcore, see eqn (52). |
‡‡ Eqn (24) can be formulated in several equivalent manners in DIT. One of them is an equation based on the static dielectric function (k), namely (iκ) = 0, where i is the imaginary unit. The decay modes are hence given by the zeros of (k) in complex Fourier space, which are poles of the Fourier transforms ![[w with combining tilde]](https://www.rsc.org/images/entities/i_char_0077_0303.gif) ij(k), ij(k), ![[small psi, Greek, tilde]](https://www.rsc.org/images/entities/i_char_e0e3.gif) i(k) and i(k) and ![[small rho, Greek, tilde]](https://www.rsc.org/images/entities/i_char_e0e4.gif) i(k).23,100,101 i(k).23,100,101 |
| §§ See footnote ‡‡ above. |
| ¶¶ There also exist other complex-valued solutions to eqn (33), but here we are only concerned with those two that are connected continuously with the two real solutions κ and κ′. |
| |||| The HNC data for κDa ≳ 1.5 in ref. 22 were not reliable and have been ignored in the plot. |
| *** In the present case βwel(r) is equal to the square bracket in eqn (107) in Appendix A. |
| ††† In absolute values, lnγel± give 8% of lnγ± and ϕel 3% of ϕ in this system. |
| ‡‡‡ Note that for any constant C > 0 we have Λ2ln(CΛ) = Λ2ln(Λ) + Λ2ln(C) ∼ Λ2ln(Λ) when Λ → 0. This means that any factor C can be included in the logarithm and the limiting law is still valid. For eqn (73) to be useful apart from at high dilution, one must therefore at least add the next order asymptotic term, which proportional to Λ2, that is, proportional to the ion concentration. That term, which depends on the ionic characteristics like the ionic size, specifies an appropriate C. No exact simple expression for that term is, however, presently known, but we will later derive an approximate expression for it, eqn (81). We may note that z4Λ2ln(Λ) = (βRτ)2ln(βRτ/z2), which means that for two systems with different ionic valencies but with the same value of βR, eqn (73) does not give the same asymptote as function of τ except in the limit of infinite dilution. This peculiarity occurs despite that the statistical mechanics in the RPM is determined solely by βR and τ and it can easily be eliminated by selecting C = z2. Eqn (73) is, however, derived for use in the infinite dilution limit only, where the value of C does not matter. A better selection of C is done in eqn (81), which is valid for a larger range of concentrations; see also footnote ¶¶¶. |
| §§§ The term −(βwelij)3/3! corresponds to the low concentration limit of the term (hij#)3/3! in eqn (103) of ref. 101 in the derivation of the exact limiting law for κ2/κD2. |
| ¶¶¶ Note that 1 + βR2τ2ln(τ)/6 = 1 + z4Λ2ln(κDa)/6 contains the hard core diameter a and is not a universal limiting law for κ2/κD2 valid for all symmetric electrolytes because it presumes that the ions are hard spheres. The universal law (73) instead contains the factor ln(κDB). |
| |||||| A favorable comparison between the experimental data and the exact asymptotic expression (73) was done in ref. 104 for the aqueous solutions. Such a comparison could not be done for the isopropanol solutions for reasons outlined in footnote ‡‡‡, but eqn (81) can be used for both kinds of solutions since it is expressed solely in terms of τ and βR. |
| **** The notation used here differs from that in ref. 22, 23, 100 and 101, where qj* denotes the effective charge qeffj of the present work. |
| †††† Both eqn (87) and (88) are mathematically equivalent to the equation (iκ) = 0, cf. footnote ‡‡ in Section 2. |
| This journal is © the Owner Societies 2020 |