 Open Access Article
Chemical short-range order in derivative Cr–Ta–Ti–V–W high entropy alloys from the first-principles thermodynamic study†
Damian
Sobieraj
 ab,
Jan S.
Wróbel
 *a,
Tomasz
Rygier
a,
Krzysztof J.
Kurzydłowski
c,
Osman
El Atwani
d,
Arun
Devaraj
e,
Enrique
Martinez Saez
d and
Duc
Nguyen-Manh
 *bf
*bf
aFaculty of Materials Science and Engineering, Warsaw University of Technology, ul. Wołoska 141, 02-507 Warsaw, Poland. E-mail: jan.wrobel@pw.edu.pl
bCCFE, United Kingdom Atomic Energy Authority, Abingdon OX14 3DB, UK. E-mail: duc.nguyen@ukaea.uk
cFaculty of Mechanical Engineering, Białystok University of Technology, ul. Wiejska 45C, 15-351 Białystok, Poland
dLos Alamos National Laboratory, Los Alamos, NM 87545, USA
ePhysical and Computational Sciences Directorate, Pacific Northwest National Laboratory, 902 Battelle Blvd, Richland, WA 99354, USA
fDepartment of Materials, University of Oxford, Oxford OX1 3PH, UK
First published on 8th October 2020
Abstract
The development of high-entropy alloys (HEAs) focuses on exploring compositional regions in multi-component systems with all alloy elements in equal or near-equal atomic concentrations. Initially it was based on the main idea that high mixing configurational entropy contributions to the alloy free energy could promote the formation of a single solid solution phase. By using the ab-initio based Cluster Expansion (CE) Hamiltonian model constructed for the quinary bcc Cr–Ta–Ti–V–W system in combination with Monte Carlo (MC) simulations, we show that the phase stability and chemical short-range order (SRO) of the equiatomic quinary and five sub-quaternary systems, as well as their derivative alloys, can dramatically change the order–disorder transition temperatures (ODTT) as a function of alloy compositions. In particular, it has been found, that the equiatomic quaternary Ta–Ti–V–W and Cr–Ta–Ti–W alloys had the lowest order–disorder transition temperature (500 K) among all the analysed equiatomic compositions. In all investigated alloy systems, the strongest chemical ordering has been observed between Cr and V, which led to the conclusion that decreasing the concentration of either Cr or V might be beneficial in terms of decreasing the ODTT. It also predicts that increasing concentration of Ti significantly decreases the ODTT. Our analysis of chemical SRO as a function of alloy composition allows to understand the microstructure evolution of HEAs as a function of temperature in excellent agreement with available experimental observations. Importantly, our free energy of mixing and SRO calculations predict that the origin of precipitates formed by Cr- and V-rich in the sub-quaternary Cr–Ta–V–W system is driven by the thermodynamics. The modelling results are in an excellent agreement with experimental observation of Cr and V segregation in the W0.38Ta0.36Cr0.15V0.11 alloy which in turns shows an exceptional radiation resistance.
1 Introduction
Fusion energy requires materials with extraordinary properties able to withstand exceptionally high temperatures and stress gradients, radiation damage, high concentrations of transmutation products and/or plasma exposures.1,2 The development of such materials poses many challenges that need to be addressed for fusion energy to become a viable power source.3,4 Tungsten (W) is the leading Plasma-Facing-Material (PFM) candidate for fusion DEMO device due to its high melting temperature, low erosion rates and small tritium retention.5,6 These advantages are unfortunately coupled with very low fracture toughness characterized by brittle transgranular and intergranular failure regimes, which severely restrict the useful operating temperature window and create a range of fabrication difficulties.7–9 Strategies such as different alloying elements (e.g. W–Cr, W–Re, W–Ta, W–Ti, W–V) or nanostructure engineered W are being investigated to improve the material processing and working properties to extreme irradiation environments.10–20 Despite these significant efforts from both experimental and modelling investigations, detailed studies of conventional binary alloys revealed several constrains and limitations. For example, some of W-based binary alloys were found to deteriorate the mechanical properties5,14,21 whereas for other systems such as W–Re, W–Os, transmutation induced precipitations were observed under neutron irradiation.22–25 Therefore, the development of new high temperature W-based alloys for plasma-facing materials is paramount to enable fusion as a viable energy source.Recently, a fundamentally new class of alloys, denoted as high-entropy alloys (HEAs) with no single dominant element, appears to reinvigorate the discovery of society-changing materials.26,27 Initially, the fundamental hypothesis behind the development of HEAs was that the configurational entropy of mixing in should tend to stabilize the solid solution based on simple underlying face-centered cubic (fcc) or body-centered cubic (bcc) crystal structures.28–32 Equiatomic compositions maximize this entropic term, promoting random solutions versus intermetallic phases or phase decomposition. The intermetallic phases might be desirable for certain applications but in general reduce ductility, and, thus, they are typically inadequate for structural components. Some of the HEAs, such us the fcc-based CrCoFeMnNi or the refractory bcc-based TiZrHfNbTa, show superior mechanical properties compared to traditional materials, displaying high hardness, high yield strengths, large ductility, excellent fatigue resistance and good fracture toughness.33–36 While accomplishments and progress established in the first generation of HEAs over the last sixteen years is remarkable, detailed thermodynamic analysis of the microstructural evolution in these materials suggests that the initial high-entropy assumption is, however, not always supported by experimental and predictive modelling results.30 The focus on configurational entropy frequently ignored essential contributions from the enthalpy of mixing to the phase stability.37,38 However, the configurational entropy can change with temperature due to small changes in short-range atomic ordering or by chemical partitioning between different alloy elements.17,39–48 The fundamental hypothesis also assumes that the maximum configurational entropy is achieved at high temperature or in the liquid state. However, even metallic liquids might not have random atomic position at the melting temperature due to contributions of chemical bonds between atoms to the enthalpy of fusion.49
The new generation of HEAs is now evolving to the more broadly defined multi-principal-element alloys or complex concentrated alloys which include materials with as few as three principal elements and where the maximum element concentration may be higher than 35 atom percent.50 In this paper, we call them simply as derivative HEAs when studying W-based refractory alloys which have been recently developed specifically in the context of high temperature for fusion materials applications.43,51,52 The derivative HEAs not only give a vast number of new alloys with an infinitesimal fraction of all possible combination of elemental mixtures but also allow to explore new physical, and chemical phenomena that relate to the materials properties. From an advanced nuclear reactor application point of view, the new generation of HEAs shows superior mechanical properties, exceptional radiation resistance and better oxidation compliance as well as swelling resistance at high temperatures compared to Ni-based superalloys.53–58 While investigating the enormous number of derivative HEAs compositions and their microstructures would be valuable, it also presents big challenges to match the explosion of new alloy bases. New high throughput experiments are needed as well as new fundamental models are important to quickly narrow the path between properties that sensibly depend on both alloy composition and designed microstructures. The computational alloy design paradigm is intended to aid in the discovery of novel HEAs by describing the microstructure and properties of metallic materials. It replaces the trial-and-error methodology, accelerates the discovery of new materials and dramatically decreases the time, effort and cost of developing new alloys.31,48,59–67
The main focus of this paper is the investigation of the thermodynamic properties for the bcc-based Cr–Ta–Ti–V–W derivative HEAs from first-principles calculations. We employ a combination of methods that allows investigating the phase stability at finite temperature for different compositions, namely density-functional theory (DFT), cluster expansion (CE) and canonical Monte-Carlo (MC) simulations.37,41–43,45,68 In a variance with other conventional methods such as special quasirandom structure (SQS) approaches or coherent potential approximation (CPA), which are more relevant for disordered substitutional alloys, our hybrid combination of ab-initio based CE Hamiltonian with MC simulations allows to investigate the dependence of configurational entropy in multi-component alloys as a function of temperature and composition and to integrate it into the free energy calculations by properly considering the contribution from the enthalpy of mixing. More importantly, by using statistical mechanics simulations, this approach, which uses many-body interactions, is able to clarify the important role of chemical short-range effect on the transformation of stable and ordered phases at low temperature into a fully disordered configuration at high temperature and therefore allows to predict the order–disorder transition temperature (ODTT) for different alloy compositions. Our previous study for a specific composition of four component Cr–Ta–V–W alloys also reveals that the present approach also predicts a strong segregation of Cr and V elements that is in an excellent agreement with experimental observations of Cr and V rich phase decomposition under irradiation.43 The new addition of Ti as the fifth component system is dictated by the fact that Ti plays a significant role in improving the sintered density through rapid and significant inter-diffusion, mass transport through the interfaces, and rearrangements of particles.51,52,69–71 As it will be shown in Section 4, increasing Ti concentration significantly decreases the ODTT in the derivative quinary Cr–Ta–Ti–V–W alloys. Last but not least, it is worth emphasizing that the low neutron activation properties of W, Ta, Ti, V and Cr also favor their selection for the development of materials for potential fusion plasma facing applications.72,73
This paper is organised as follows. Computational Methodology Section 2 describes in detail the DFT calculations (2.1), the cluster expansion (CE) formalism and its results (2.2) and the relationship between chemical short-range order and free energy of mixing for quinary alloys (2.3). A systematic discussion of the phase stability analysis for the Cr–Ta–Ti–V–W alloys is presented in Section 3 by comparing DFT and CE calculations of the enthalpy of formation for the binary (3.1), ternary, quaternary sub-systems (3.2) to the quinary (3.3) alloys. The finite-temperature results from the chemical SRO analysis, the free energy of mixing and the order–disorder temperature predictions for the five component alloys are shown in Section 4 for the equiatomic (4.1) and the derivative alloys (4.2). The sub-section (4.3) compares our present results with other available modelling data and experimental data with a particular interest of Ti alloying effects in the quinary alloys. Section 5 focuses on the quaternary Cr–Ta–V–W alloy system developed experimentally at the Los Alamos National Laboratory (LANL) (5.1) by comparing the phase decomposition phenomena in equiatomic (5.2) and a specific composition (5.3) for which a strongly radiation resistance effect has been recently discovered.43 Finally, a summary of main results and conclusions of this work are given in Section 6.
2 Computational methodology
2.1 DFT computational details
DFT calculations were performed using the projector augmented wave (PAW) method implemented in VASP.74–76 Exchange and correlation were treated in the generalized gradient approximation GGA-PBE.77 To accelerate DFT calculations, we used PAW potentials without semi-core p electron contribution. The results of DFT calculations with and without semi-core p electron contributions did not differ. Since the difference between enthalpies of mixing of anti-ferromagnetic and non-magnetic Cr-rich structures was small, the magnetism was not considered in this study. Total energies were calculated using the Monkhorst–Pack mesh78 of k points in the Brillouin zone, with k-mesh spacing of 0.2 Å−1. This corresponds to 14 × 14 × 14 k-point meshes for a two-atom bcc cubic. After initial analysis, the plane-wave cutoff energy used in the calculations was set to 400 eV. The total energy convergence criterion was set to 10−6 eV per cell, and force components were relaxed to 10−3 eV Å−1.2.2 Cluster expansion formalism for quinary alloys
In our study, we use the enthalpy of mixing to determine the stability of the system. We employ an approach similar to the approach already described for ternary alloys.41 We define the enthalpy of mixing obtained in DFT calculations of a K-component bcc alloy as a: | (1) |
![[small sigma, Greek, vector]](https://www.rsc.org/images/entities/char_e1c9.gif) ) is a total energy per atom of the considered alloy in a bcc structure represented by a vector of configurational variables σ, cp are the average concentrations of each components, and Ebcctot(p) are the total energies of pure elements in a bcc structure. The enthalpy of formation is calculated as the energy of the structure with respect to the energies of pure element ground states, namely bcc Cr, Ta, V, W and hexagonal closest packed (hcp) Ti.
) is a total energy per atom of the considered alloy in a bcc structure represented by a vector of configurational variables σ, cp are the average concentrations of each components, and Ebcctot(p) are the total energies of pure elements in a bcc structure. The enthalpy of formation is calculated as the energy of the structure with respect to the energies of pure element ground states, namely bcc Cr, Ta, V, W and hexagonal closest packed (hcp) Ti.
The enthalpy of mixing of an alloy can also be calculated using the Cluster Expansion method.79–82
 | (2) |
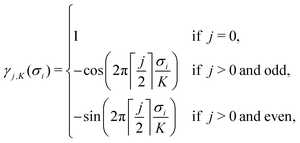
![[small sigma, Greek, vector]](https://www.rsc.org/images/entities/i_char_e1c9.gif) )〉 are the average correlation functions defined as a product of point functions of occupation variables on a specific cluster ω averaged over all the clusters ω′ that are equivalent by symmetry to cluster ω.83 Since clusters are defined by its size (a number of lattice points) and the relative positions of points, for clarity, each cluster ω is described by two parameters: |ω| and n, which refer to the cluster size and the label describing the distance between atoms, respectively (see Table 5 in Appendix). In a K-component system, a cluster function is defined as a product of orthogonal point functions γji,K(σi):
)〉 are the average correlation functions defined as a product of point functions of occupation variables on a specific cluster ω averaged over all the clusters ω′ that are equivalent by symmetry to cluster ω.83 Since clusters are defined by its size (a number of lattice points) and the relative positions of points, for clarity, each cluster ω is described by two parameters: |ω| and n, which refer to the cluster size and the label describing the distance between atoms, respectively (see Table 5 in Appendix). In a K-component system, a cluster function is defined as a product of orthogonal point functions γji,K(σi): | (3) |
 | (4) |
 denotes an operation, where we take the integer plus one value of noninteger value. The 2- and 3-body cluster correlation functions derived from the pair probabilities, are as follows:
 | (5) |
 | (6) |
In our study, we have developed the CE Hamiltonian for the quinary bcc Cr–Ta–Ti–V–W system (thus K = 5), and all the binary, ternary and quaternary bcc subsystems. The enthalpy of mixing for those structures using 2- and 3-body clusters can be written as:
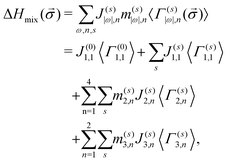 | (7) |
It should be noted that a summation over all possible decorations of clusters s in eqn (7) is different for point, pair and 3-body clusters. In a five-component (K = 5) system, besides the zero-point function (first term in the second line of eqn (7)), there are 4 non-zero point functions (second term in the second line), which means that there are 4 possible decorations of the point cluster. The cluster of two sites (|ω| = 2) can be decorated in (K − 1)|ω| = (5 − 1)2 = 16 ways, namely (s) = (1,1), (1,2), (1,3), (1,4), (2,1), (2,2),…,(4,4). Due to symmetry reasons (1,2) = (2,1), (1,3) = (3,1),…,(3,4) = (4,3), thus there are 10 required effective cluster interactions to describe the interactions in each 2-body cluster in quinary system (third line in eqn (7)). In a similar way, the number of required effective cluster interactions goes up to 40 for 3-body clusters (fourth line in eqn (7)). Considered decorations of clusters, multiplicity factors and concentration-independent effective cluster interactions are given in Table 5 in Appendix.
Mapping DFT energies to CE was performed using the ATAT package.84 Initial values of effective cluster interactions, derived by mapping to cluster expansion the DFT energies, provided a starting point for further refinement of the CE parameters, which was performed generating new structures. The resulting database for binary, ternary, quaternary and quinary alloys consisted of 682 structures (5 pure elements, 273 binary, 116 ternary, 266 quaternary and 22 quinary structures). The value of cross-validation85 error between DFT and CE formation enthalpies achieved during simulations was 10.2 meV per atom, proving that the final set of effective cluster interactions describes interatomic interactions in Cr–Ta–Ti–V–W system accurately.
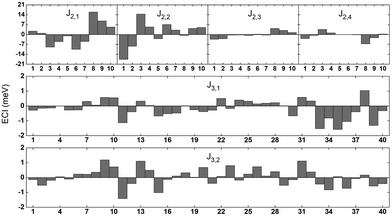
One hundred and twenty ECIs for a 5-component system obtained with the CE mapping are given in Fig. 1 and in Table 5 in Appendix. Forty 2-body and eighty 3-body interaction parameters were derived (pairs with up to fourth nearest neighbour and two smallest 3-body clusters were used). J2,1, J2,2, J2,3, J2,4 denote pairs with 1st, 2nd, 3rd and 4th nearest neighbour, respectively. Numbers 1–10 in Fig. 1 refer to ten possible decorations of pair correlation functions in a 5-element system, described in detail in Table 5 in Appendix. J3,1 and J3,2 denote 2 smallest 3-body clusters, while numbers 1–40 in Fig. 1 refer to all possible 3-body decorations of 3-body cluster functions in a 5-element system, described also in detail in Table 5 in Appendix. The strongest interactions have been observed between pairs with 1st and 2nd nearest neighbours. The influence of 4-body interactions on the parameters has also been checked. However, the overall cross-validation value for the whole 5-component system did not show a significant influence of 4-body interactions on the final results. Due to the large number of 4-body clusters that would have to be taken into consideration (55 for the smallest clusters alone), we decided not to include them in our calculations.
2.3 Chemical short-range order parameters
Monte Carlo simulations were performed using the ATAT package.84 Most of the simulations were carried out using a cell containing 2000 atoms in the form of 10 × 10 × 10 bcc unit cells. For each composition, simulations started from a disordered high-temperature state at 3000 K. The alloy was then quenched down to 100 K with a temperature step of ΔT = 100 K, with 2000 MC steps per atom at both thermalization and accumulation stages. The thermodynamic integration has been performed with 10 K temperature steps. In our study, we are using the Warren-Cowley SRO parameters, which have been formulated in ref. 86. The Warren–Cowley SRO parameters can be obtained from the pair probabilities as follows:87,88 | (8) |
 | (9) |
 | (10) |
 | (11) |
 | (12) |
The entropy of mixing (Smix), which indicates the effect of short-range ordering in reference to a random configuration, has been computed as:
| Smix = Srand − Sconf | (13) |
 | (14) |
From eqn (10)–(14), we can then calculate the free energy of mixing, either from thermodynamic integration or with the analytical expression:
| Fmix = Hmix − TSmix | (15) |
3 Phase stability at 0 K temperature
3.1 Binary subsystems in Cr–Ta–Ti–V–W system
Enthalpies of mixing were calculated using DFT and CE methods for all 682 bcc structures in the obtained Cr–Ta–Ti–V–W system database.17,41,92,93 The CE mapping was done for the whole 5-component system at once, not separately for each of the subsystems. Enthalpies of mixing for all binary structures in the database were analysed in order to determine the nature of the interactions between atoms in all possible binary configurations. Enthalpy of mixing values close to 0 eV per atom indicate the possibility of solid solution creation, negative values indicate a tendency to forming intermetallic phases, while positive enthalpy of mixing values indicate the tendency towards atoms segregation. Enthalpy of mixing results for all binary alloys in Cr–Ta–Ti–V–W systems are given in Fig. 2. To improve the agreement between DFT and CE energies for the Cr–Ti system, we have added more structures for that binary, which also improved overall agreement between DFT and CE results for the whole quinary Cr–Ta–Ti–V–W system.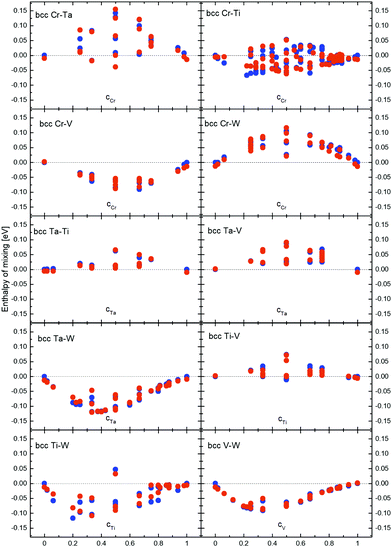 | ||
| Fig. 2 Enthalpy of mixing of binary alloys in Cr–Ta–Ti–V–W system obtained from DFT (blue dots) and Cluster Expansion (red dots) simulations. | ||
We observe (Fig. 2) that the Cr–Ta binary system shows several structures with positive enthalpy of mixing, with values up to 142 meV per atom for the CrTa structure. There are only few binary structures with negative enthalpies of mixing, with the most negative values of −39 meV per atom for CrTa. Several enthalpy of mixing values for structures with the same chemical composition can be found in our system and in Fig. 2, as they have different chemical configurations. For example, CrTa structures with Pm![[3 with combining macron]](https://www.rsc.org/images/entities/char_0033_0304.gif) m and Fd
m and Fd![[3 with combining macron]](https://www.rsc.org/images/entities/char_0033_0304.gif) m symmetry groups, have −39 meV per atom and 142 meV per atom enthalpy of mixing values, respectively. The Cr–Ti binary system presents structures with both negative and positive values of enthalpies of mixing in the whole concentration range. The highest observed values were up to 50 meV per atom, while the lowest one (−67 meV per atom) was observed for the Cr2Ti7 structure. It should be noted that the difference between DFT and CE for the Cr2Ti7 structure is relatively high (32 meV per atom), which could be reduced by adding 4-body interactions into our system.
m symmetry groups, have −39 meV per atom and 142 meV per atom enthalpy of mixing values, respectively. The Cr–Ti binary system presents structures with both negative and positive values of enthalpies of mixing in the whole concentration range. The highest observed values were up to 50 meV per atom, while the lowest one (−67 meV per atom) was observed for the Cr2Ti7 structure. It should be noted that the difference between DFT and CE for the Cr2Ti7 structure is relatively high (32 meV per atom), which could be reduced by adding 4-body interactions into our system.
All structures found in the Cr–V binary had negative enthalpy of mixing values, down to −100 meV per atom, while almost all Cr–W structures had positive enthalpy of mixing up to 130 meV per atom. Both Ta–Ti and Ta–V showed similar trends to Cr–W structures, with almost all structures having positive enthalpy of mixing, as high as 60 meV per atom and 90 meV per atom for Ta–Ti and Ta–V binary systems, respectively.
Most structures in the binary Ta–W and V–W systems have negative enthalpies of mixing. In particular, Ta–W structures were the most stable ones in the Cr–Ta–Ti–V–W system. The lowest values (−119 meV per atom and −118 meV per atom) were found for the TaW2 and the Ta3W5 structures, respectively. The value obtained for the Ta3W5 is in general agreement with the result (−117 meV per atom) obtained for the same structure in ref. 18. The general trend in Ta–W system agrees with experimental work done in ref. 94 (in this paper, the asymmetry of the enthalpy of mixing in Ta–W structures is also observed towards the Ta-rich side) and with theoretical calculations provided in ref. 17. In ref. 18, the enthalpy of mixing for several compositions in Ta–W binary system is analyzed. By comparing results obtained in ref. 18 we observed that they are in general agreement with our results (Fig. 2). The lowest enthalpy of mixing for the V–W system has been found for the VW2 structure (−91 meV per atom), and it is in general agreement with results obtained for the same structure in ref. 18, where the enthalpy of mixing value was −93 meV per atom.
All but one structure found for the Ti–W system had negative enthalpy of mixing, with values as low as −117 meV per atom for the TiW4 structure. The Ti–V binary presents positive enthalpies of mixing values for all configurations, with the highest one around 80 meV per atom.
It has been shown,95 that pairs of elements from different columns in the periodic table tend to have negative enthalpy of mixing and thus atoms are attracting each other, while pairs of elements from the same columns have positive enthalpy of mixing and a tendency towards segregation. Results presented in Fig. 2 are in general agreement with above conclusions, as we observe negative values of enthalpy of mixing for example for Ta–W which are in separate columns, while Ta–V have positive enthalpy of mixing and both elements are in the same column in the periodic table.
In Table 1 the most stable compounds, marked by ATAT package as ground states, predicted by the CE method and compared to DFT results for the quinary system are shown. Those structures have most negative enthalpies of mixing among all studied structures in the Cr–Ta–Ti–V–W system. There were 42 binary ground states predicted by ATAT. The largest number of stable compounds is 11 for the Ta–W system. Very low values of enthalpy of mixing were also observed for V–W, in which 10 stable compounds were found. Overall, the enthalpy of mixing trend and values in V–W system are consistent with theoretical calculations.17 For the Ti–W system, the number of predicted most stable compounds is 8. We did not find stable compounds in the Ta–V and Cr–W systems (Ta/V and Cr/W are column 5 and 6 elements, respectively) or in the Ta–Ti binary.
| Structure | Symmetry group | Enthalpy of mixing | Structure | Symmetry group | Enthalpy of mixing | ||
|---|---|---|---|---|---|---|---|
| DFT | CE | DFT | CE | ||||
| CrTa |
Pm![[3 with combining macron]](https://www.rsc.org/images/entities/char_0033_0304.gif) m m |
−0.039 | −0.039 | Ta3W2 |
R![[3 with combining macron]](https://www.rsc.org/images/entities/char_0033_0304.gif) m m |
−0.096 | −0.089 |
| Cr2Ti | I4/mmm | −0.059 | −0.044 | Ta3W4 | I4/mmm | −0.114 | −0.113 |
| Cr2Ti7 | C2/m | −0.067 | −0.035 | Ta3W5 | P4/mmm | −0.118 | −0.117 |
| Cr8Ti | I4/mmm | −0.026 | −0.011 | Ta4W | I4/m | −0.050 | −0.042 |
| Cr53Ti |
Pm![[3 with combining macron]](https://www.rsc.org/images/entities/char_0033_0304.gif) m m |
−0.005 | −0.013 | TiW2 |
P![[3 with combining macron]](https://www.rsc.org/images/entities/char_0033_0304.gif) m1 m1 |
−0.105 | −0.112 |
| CrV |
Pm![[3 with combining macron]](https://www.rsc.org/images/entities/char_0033_0304.gif) m m |
−0.086 | −0.088 | TiW4 |
R![[3 with combining macron]](https://www.rsc.org/images/entities/char_0033_0304.gif) m m |
−0.117 | −0.082 |
| CrV2 | I4/mmm | −0.063 | −0.059 | TiW15 |
Pm![[3 with combining macron]](https://www.rsc.org/images/entities/char_0033_0304.gif) m m |
−0.058 | −0.034 |
| Cr2V | I4/mmm | −0.090 | −0.074 | TiW53 |
Pm![[3 with combining macron]](https://www.rsc.org/images/entities/char_0033_0304.gif) m m |
−0.022 | −0.019 |
| Cr3V |
Fm![[3 with combining macron]](https://www.rsc.org/images/entities/char_0033_0304.gif) m m |
−0.070 | −0.065 | Ti2W |
P![[3 with combining macron]](https://www.rsc.org/images/entities/char_0033_0304.gif) m1 m1 |
−0.074 | −0.060 |
| Cr15V |
Pm![[3 with combining macron]](https://www.rsc.org/images/entities/char_0033_0304.gif) m m |
−0.024 | −0.030 | V2W2 | Imma | −0.076 | −0.076 |
| Cr53V |
Pm![[3 with combining macron]](https://www.rsc.org/images/entities/char_0033_0304.gif) m m |
−0.007 | −0.019 | V2W2 |
Fd![[3 with combining macron]](https://www.rsc.org/images/entities/char_0033_0304.gif) m m |
−0.076 | −0.077 |
| CrW53 |
Pm![[3 with combining macron]](https://www.rsc.org/images/entities/char_0033_0304.gif) m m |
0.000 | −0.006 | V2W7 |
P![[3 with combining macron]](https://www.rsc.org/images/entities/char_0033_0304.gif) m1 m1 |
−0.082 | −0.079 |
| TaW2 | I4/mmm | −0.119 | −0.109 | V3W2 |
R![[3 with combining macron]](https://www.rsc.org/images/entities/char_0033_0304.gif) m m |
−0.063 | −0.060 |
| TaW4 | I4/mmm | −0.088 | −0.070 | VW2 | I4/mmm | −0.091 | −0.078 |
| TaW15 |
Pm![[3 with combining macron]](https://www.rsc.org/images/entities/char_0033_0304.gif) m m |
−0.036 | −0.035 | VW3 |
Fm![[3 with combining macron]](https://www.rsc.org/images/entities/char_0033_0304.gif) m m |
−0.086 | −0.088 |
| TaW53 |
Pm![[3 with combining macron]](https://www.rsc.org/images/entities/char_0033_0304.gif) m m |
−0.015 | −0.019 | VW4 |
R![[3 with combining macron]](https://www.rsc.org/images/entities/char_0033_0304.gif) m m |
−0.079 | −0.076 |
| Ta2W2 | Imma | −0.107 | −0.110 | VW7 | C2/m | −0.056 | −0.054 |
| Ta2W3 |
R![[3 with combining macron]](https://www.rsc.org/images/entities/char_0033_0304.gif) m m |
−0.117 | −0.119 | VW15 |
Pm![[3 with combining macron]](https://www.rsc.org/images/entities/char_0033_0304.gif) m m |
−0.034 | −0.032 |
| Ta2W7 | Immm | −0.094 | −0.087 | VW53 |
Pm![[3 with combining macron]](https://www.rsc.org/images/entities/char_0033_0304.gif) m m |
−0.015 | −0.018 |
Most stable binary compounds in V–W and Ta–W were also compared with results in the literature ref. 17. Some of the compounds obtained in our study were previously found, such as W15Ta with a Pm![[3 with combining macron]](https://www.rsc.org/images/entities/char_0033_0304.gif) m symmetry group, TaW4 with a I4/mmm symmetry and TaW2 with a I4/mmm symmetry in the Ta–W binary system and VW2 with a I4/mmm symmetry group, VW3 with a Fm
m symmetry group, TaW4 with a I4/mmm symmetry and TaW2 with a I4/mmm symmetry in the Ta–W binary system and VW2 with a I4/mmm symmetry group, VW3 with a Fm![[3 with combining macron]](https://www.rsc.org/images/entities/char_0033_0304.gif) m symmetry, VW4 with a R
m symmetry, VW4 with a R![[3 with combining macron]](https://www.rsc.org/images/entities/char_0033_0304.gif) m symmetry, VW15 with a Pm
m symmetry, VW15 with a Pm![[3 with combining macron]](https://www.rsc.org/images/entities/char_0033_0304.gif) m symmetry, V2W2 with a Fd
m symmetry, V2W2 with a Fd![[3 with combining macron]](https://www.rsc.org/images/entities/char_0033_0304.gif) m symmetry and V3W2 with a R
m symmetry and V3W2 with a R![[3 with combining macron]](https://www.rsc.org/images/entities/char_0033_0304.gif) m symmetry group in the V–W binary system. Additional DFT calculations were performed for Laves C15 phases for Cr2Ti and Cr2Ta. The enthalpy of mixing values were −148 meV per atom and −129 meV per atom respectively, both lower than the values predicted for bcc Cr–Ti (−80 meV per atom) and Cr–Ta (−50 meV per atom) binary systems. We then compared stable compounds obtained from DFT and CE simulations to experimental phase diagrams for binary and ternary alloys. For Cr–Ti we have obtained a bcc Cr2Ti compound with −59 meV per atom enthalpy of mixing, while on the Cr–Ti phase diagram there is a Laves phase observed at this composition.96
m symmetry group in the V–W binary system. Additional DFT calculations were performed for Laves C15 phases for Cr2Ti and Cr2Ta. The enthalpy of mixing values were −148 meV per atom and −129 meV per atom respectively, both lower than the values predicted for bcc Cr–Ti (−80 meV per atom) and Cr–Ta (−50 meV per atom) binary systems. We then compared stable compounds obtained from DFT and CE simulations to experimental phase diagrams for binary and ternary alloys. For Cr–Ti we have obtained a bcc Cr2Ti compound with −59 meV per atom enthalpy of mixing, while on the Cr–Ti phase diagram there is a Laves phase observed at this composition.96
3.2 Ternary and quaternary systems
Enthalpies of mixing obtained from DFT and CE simulations for the most stable structures for each of the ten ternary systems in Cr–Ta–Ti–V–W system are given in Table S1 (ESI†). All ternary Ta–Ti–V structures have a positive enthalpy of mixing, with the lowest being TaTiV2 with 12 meV per atom. Ta–Ti–W was the only system in which we found stable ternary compounds marked by ATAT as ground states, namely TaTi2W2 structure with −91 meV per atom, Ta2Ti2W with −58 meV per atom, and TaTi2W with −69 meV per atom enthalpy of mixing.There are no quaternary and quinary compounds marked by ATAT package as ground states. Among the considered structures, the most stable quaternary phases predicted from each subsystem are given in Table S2 (ESI†). The Cr2TiV2W2 quaternary structure is shown in Fig. 3a. This structure has a R![[3 with combining macron]](https://www.rsc.org/images/entities/char_0033_0304.gif) m space group symmetry, which is the same as for the one presented in Fig. 11 in ref. 63 using Pearson notation HR7. Our CE database included 266 quaternary structures from 5 different quaternary subsystems found in Cr–Ta–Ti–V–W system. The most stable quaternary structure was found to be Cr2TiV2W2 with the enthalpy of mixing value of −67 meV per atom. Quaternary structures with a A2B2C2D chemical formula from ref. 63 were included in our database creation.
m space group symmetry, which is the same as for the one presented in Fig. 11 in ref. 63 using Pearson notation HR7. Our CE database included 266 quaternary structures from 5 different quaternary subsystems found in Cr–Ta–Ti–V–W system. The most stable quaternary structure was found to be Cr2TiV2W2 with the enthalpy of mixing value of −67 meV per atom. Quaternary structures with a A2B2C2D chemical formula from ref. 63 were included in our database creation.
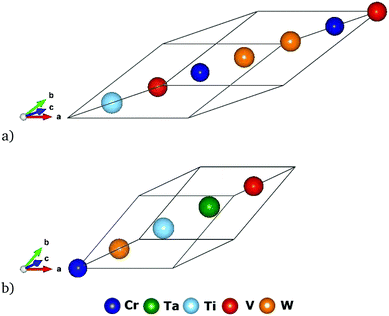 | ||
| Fig. 3 Quaternary and quinary structures with the lowest enthalpies of mixing: (a) Cr2TiV2W2 presented in Table S2 (ESI†) and (b) CrTaTiVW presented in Table S3 (ESI†). | ||
3.3 Quinary systems
In our CE model, there were 22 quinary structures, 20 of them equiatomic CrTaTiVW. The most stable structures for 3 different quinary compositions are given in Table S3 (ESI†). Five of the 22 quinary structures had negative enthalpy of mixing, with the lowest being −38 meV per atom for the equiatomic CrTaTiVW structure with the R![[3 with combining macron]](https://www.rsc.org/images/entities/char_0033_0304.gif) m symmetry group. The structure for the most stable quinary structure (equiatomic CrTaTiVW) is given in Fig. 3b. It can be concluded that the quinary structures tested with our CE database are in general less stable than binary (see Fig. 2 and Table 1), ternary (see Table S1, ESI†) and quaternary (see Table S2, ESI†) structures, as the lowest observed enthalpy of mixing for binary structures was −119 meV per atom for TaW2 with I4/mmm symmetry group, for ternary structures it was −91 meV per atom for TaTi2W2 with R
m symmetry group. The structure for the most stable quinary structure (equiatomic CrTaTiVW) is given in Fig. 3b. It can be concluded that the quinary structures tested with our CE database are in general less stable than binary (see Fig. 2 and Table 1), ternary (see Table S1, ESI†) and quaternary (see Table S2, ESI†) structures, as the lowest observed enthalpy of mixing for binary structures was −119 meV per atom for TaW2 with I4/mmm symmetry group, for ternary structures it was −91 meV per atom for TaTi2W2 with R![[3 with combining macron]](https://www.rsc.org/images/entities/char_0033_0304.gif) m symmetry group, for quaternary structures it was −67 meV per atom for Cr2TiV2W2 with R
m symmetry group, for quaternary structures it was −67 meV per atom for Cr2TiV2W2 with R![[3 with combining macron]](https://www.rsc.org/images/entities/char_0033_0304.gif) m symmetry group.
m symmetry group.
4 Finite-temperature stability of Cr–Ta–Ti–V–W alloys
4.1 Equiatomic compositions
Monte Carlo simulations for quinary and quaternary HEA at equiatomic concentrations of elements have been performed using the ATAT package for 6 equiatomic alloys – 1 quinary alloy from Cr–Ta–Ti–V–W system, and 5 quaternary alloys missing 1 different element. Simulation cells were 10 × 10 × 10 bcc unit cells, containing 2000 atoms. The purpose of these simulations was to determine the lowest temperatures at which random solid solutions are observed.We define the ODTT temperature as the temperature at which the alloy starts to become a fully disordered solid solution. In the present study it is calculated for each composition as the highest temperature at which the inflection points on the enthalpy of mixing as a function of temperature plot are present. It can also be calculated analysing the short-range order as a function of temperature. We have found the inflection points of the enthalpy of mixing to be the same as those observed on SRO plots. In order to find the optimal composition with the lowest ODTT we analysed the influence of single elements as well as pairs of elements on the ODTT.
The enthalpies of mixing of equiatomic quinary Cr–Ta–Ti–V–W alloy and 5 quaternary subsystems as a function of temperature are shown in Fig. 4. The lowest enthalpy of mixing below 1200 K has been observed for Cr–Ta–V–W alloy, while above 1200 K the lowest enthalpy of mixing has been noted for Cr–Ti–V–W alloy. The highest enthalpy of mixing values in the whole temperature range have been observed for Cr–Ta–Ti–V alloy. Cr–Ta–Ti–V is the only equiatomic alloy that has been found to have positive enthalpy of mixing (above 800 K) among all studied alloys. The lowest enthalpy of mixing value at 0 K has been calculated for quaternary equiatomic Cr–Ta–V–W alloy (−87 meV per atom) and is lower than the value of −67 meV per atom observed for the Cr2TiV2W2 structure – the most stable ordered quaternary structure (see Table S2, ESI†).
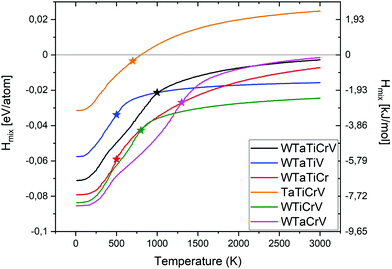 | ||
| Fig. 4 Enthalpy of mixing for quinary and quaternary equiatomic alloys with their order–disorder transition temperatures marked with a star. | ||
Table 2 summarises our predictions for the ODTT for equiatomic quinary and quaternary alloys compared to the average melting points of those alloys, calculated as:
 | (16) |
| Alloy | ODTT [K] | T avgm [K] |
|---|---|---|
| Cr–Ta–Ti–V–W | 1000 | 2362 |
| Cr–Ta–Ti–W | 500 | 2478 |
| Ta–Ti–V–W | 500 | 2488 |
| Cr–Ta–V–W | 1300 | 2535 |
| Cr–Ti–V–W | 800 | 2208 |
| Cr–Ta–Ti–V | 700 | 2103 |
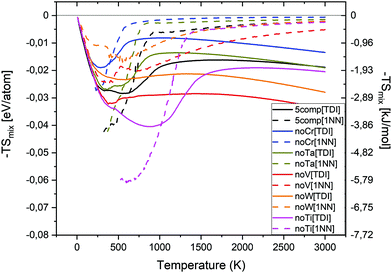
In order to investigate the phase stability at elevated temperatures, we computed the free energies of mixing of different alloys. In Fig. 5 the configurational entropy of mixing (TSmix) contribution to free energy of mixing as a function of temperature and composition is given. The TSmix contribution to the free energy of mixing was calculated using thermodynamic integration (TDI) from eqn (10), (11), (13) and (14) (see solid lines in Fig. 5) as well as from 1st nearest neighbours pair probabilities (1NN) using eqn (12)–(14) (see dashed lines in Fig. 5). The TSmix contribution to the free energy of mixing is very small at low temperatures, and higher at temperatures where the disordered configuration is preferred. The trends observed from TDI and 1NN are similar among the studied alloys at high temperature. However, the 1NN approximation is not valid at low temperature regions where the interactions beyond the 1NN should be included to reproduce the proper results from the TDI method.
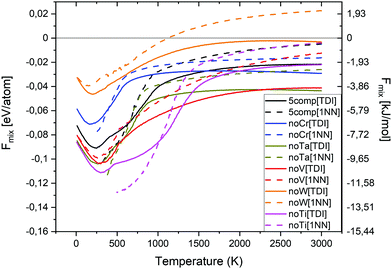
In Fig. 6, the free energy of mixing as a function of temperature and composition for equiatomic quinary and quaternary alloys is shown. The free energy of mixing was calculated using both TDI (eqn (10), (11) and (13)–(15)) (solid lines) as well as 1NN pair probabilities (eqn (12)–(15)) (dashed lines). The free energy of mixing values obtained from TDI were higher at elevated temperature in comparison with those obtained from 1NN. The highest free energy of mixing value for the whole temperature range, from both TDI and 1NN, was observed for quaternary Cr–Ta–Ti–V alloy. The lowest free energy of mixing value at temperatures below 1000 K was noted for equiatomic quaternary Cr–Ta–V–W alloy, while the equiatomic quaternary Cr–Ti–V–W alloy has the lowest free energy of mixing value at temperatures above 1000 K.
We have also derived the ODTT from the Fmix TDI calculations to compare them with our results from the Hmix and SRO plots. ODTT values obtained from Fmix were the same as those calculated from Hmix and SRO for Cr–Ta–Ti–W and Ta–Ti–V–W alloys (500 K), while being 100 K lower for Cr–Ta–Ti–V–W, Cr–Ta–V–W, Cr–Ti–V–W and Cr–Ta–Ti–V alloys (900 K, 1200 K, 700 K and 600 K, respectively).
In Fig. S1 (ESI†), we show the SRO values for 1st and 2nd shell, the average value and the first derivative of the average SRO parameter for the equiatomic quinary Cr–Ta–Ti–V–W alloy. The dashed vertical line represents the highest inflection point in the average SRO. We use this example to show, that the ODTT obtained from the enthalpy of mixing inflections points agree with the values obtained from the average SRO parameter derivatives. It can be seen in Fig. S1 (ESI†), that the inflection points at the highest temperature are found at 1000 K for all pair interactions. This is the same value that was obtained from enthalpy of mixing derivative (see Table 2).
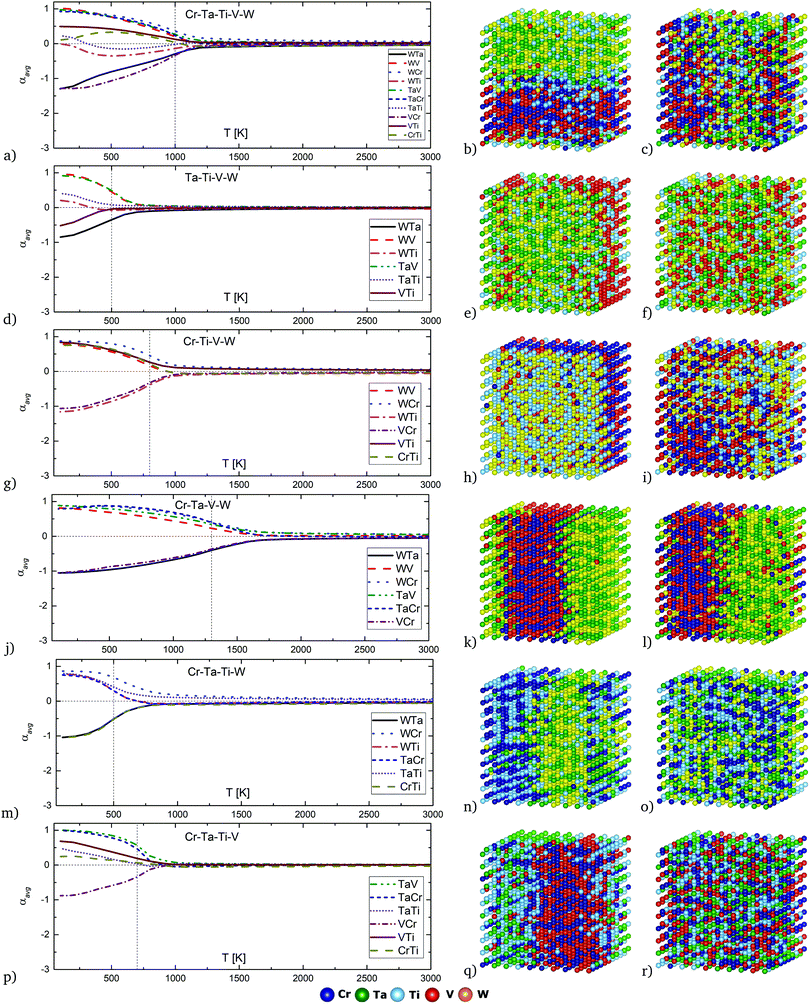
In Fig. S2 in the ESI† the SRO parameters for 1st and 2nd shells in all equiatomic quaternary and quinary alloys are given. It should be mentioned that the lack of ordering in the average SRO parameter does not always correspond to disorder in each shell. For example, for the CrTaTiV alloy, the average SRO parameter has a value close to 0 at around 800 K for all pairs (see Fig. 7m), while there is still some ordering observed in 1st and 2nd shell for some pairs (see Fig. S2k and S2l, ESI†).
Average chemical SRO parameters as a function of temperature for equiatomic quinary and quaternary alloys in Cr–Ta–Ti–V–W system are given in Fig. 7a, d, g, j, m and p for the equiatomic Cr–Ta–Ti–V–W, Ta–Ti–V–W, Cr–Ti–V–W, Cr–Ta–Ti–W, Cr–Ta–Ti–V and Cr–Ta–V–W alloys, respectively. Order–disorder transition temperatures determined from SRO and enthalpy of mixing plots are marked with vertical dashed lines. The structures obtained from Monte Carlo simulations at 400 K and 800 K for those compositions are depicted in Fig. 7b, e, h, k, n, q and Fig. 7c, f, i, l, o, r, respectively.
In the equiatomic quinary Cr–Ta–Ti–V–W alloy (Fig. 7a) the most negative SRO parameter values are observed for Ta–W and Cr–V pairs, which results in strong attraction between those elements and can be observed in Fig. 7b at 400 K and in Fig. 7c at 800 K. There is a visible segregation between Cr–V/Ta–W pairs, without any specific Ti atoms segregation.
In the equiatomic Ta–Ti–V–W alloy (Fig. 7d) the most negative SRO parameter is shown for the Ta–W pair. This can be seen at 400 K on Fig. 7e as W/Ta-rich areas. At 800 K (Fig. 7f) there is no significant attraction or segregation observed.
In the equiatomic Cr–Ti–V–W alloy (Fig. 7g) the most negative SRO parameter values are observed for Ti–W and Cr–V pairs. It results in clearly visible segregation between Ti–W/Cr–V layers at 400 K (Fig. 7h). The layer structure is not visible at 800 K (Fig. 7i).
In the equiatomic Cr–Ta–V–W alloy (Fig. 7j) the most negative SRO parameter values are observed for Ta–W and Cr–V pairs. The segregation between two pairs of atoms is the strongest among all analysed alloys. Structures obtained at 400 K (Fig. 7k) and 800 K (Fig. 7l) indicate the presence of layer structure even at elevated temperatures, with alternating Cr–V and Ta–W rich regions.
In the equiatomic Cr–Ta–Ti–W alloy (Fig. 7m) the most negative SRO parameter values are observed for Ta–W and Cr–Ti pairs. It results in strong segregation between Ta–W and Cr–Ti pairs and a layer structure at 400 K (Fig. 7n). The layer structure disappears at 800 K (Fig. 7o).
In the equiatomic Cr–Ta–Ti–V alloy (Fig. 7p) the Cr–V pair presents the most negative SRO parameter, which leads to Cr–V precipitates at 400 K (Fig. 7q). However, they are not so strongly visible at 800 K (Fig. 7r).
The previously defined ODTT is the temperature at which alloys starts to become fully disordered, but in most cases, there is still some ordering between atoms observed at those temperatures. For example, for equiatomic quaternary Cr–Ta–V–W alloy the ODTT calculated from the inflection points was found to have a value of 1300 K, while from the SRO parameter there is still some ordering observed up to 1700–1800 K. Trends for both ODTT calculated from Hmix and the observed temperature of disordering from the SRO for the different compositions are the same, with the ODTT values being lower in all cases.
The absence of ordering for Ta–W and Cr–V pairs in the quinary Cr–Ta–Ti–V–W alloy is estimated at around 1100 K. The ordering temperature strongly depends on chemical composition, as for example Ta–W pairs ordering disappears at around 700–800 K for Ta–Ti–V–W and Cr–Ti–V–W alloys, whereas for Cr–Ta–V–W alloy it disappears at around 1800 K. The lowest temperature of a disordered solid solution is observed in the Ta–Ti–V–W alloy, as short-range ordering vanishes at around 700 K, while the highest temperature of disordering is observed for the Cr–Ta–V–W alloy and has a value of around 1700 K. The structures shown in Fig. 7 reflect the degree of ordering in all studied quinary and quaternary alloys at 400 K and 800 K.
The investigation of SRO parameters for equiatomic quinary and quaternary systems led to a conclusion, that Ta–W and Cr–V pairs have the strongest influence on the ODTT, in the alloys those pairs are present. Hence, we checked how the SRO parameter for those specific pairs changes with different concentrations of elements in our system, and those results are presented in Sections 4.2.1 and 4.2.2 for Cr–V and Ta–W pairs, respectively. We have also analyzed the influence of specific elements on the SRO parameter for the Cr–Ti pair, as it has the most negative SRO value in the Cr–Ta–Ti–W system, which has an ODTT of 500 K.
4.2 Cr–Ta–Ti–V–W derivative alloys
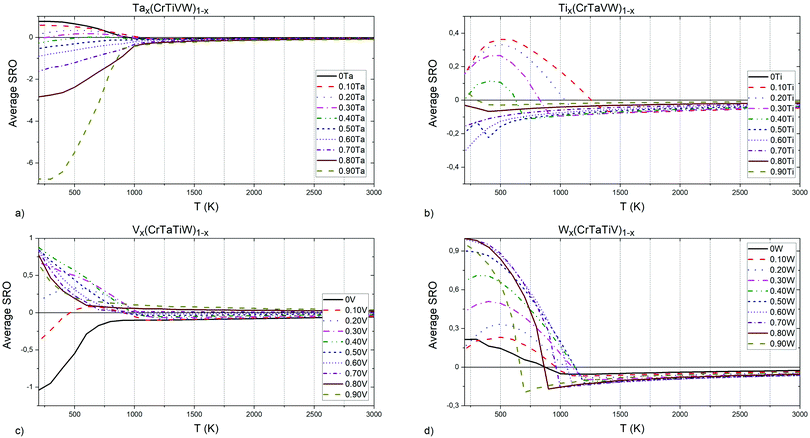 | ||
| Fig. 8 (a) Ta, (b) Ti, (c) V and (d) W elements concentrations influence on Cr–Ti pairs chemical short-range order parameter. | ||
In Tax(CrTiVW)1−x alloys (Fig. 8a), the highest attraction at low temperatures between Cr and Ti atoms is observed in an alloy containing 90 at% Ta, and the equiatomic concentration of Cr, Ti, V and W. The highest temperature for the absence of ordering between Cr and Ti atoms is shown by an alloy containing 10 at% Ta, whereas the lowest temperature is observed for an alloy containing 40 at% Ta. The temperature for the absence of ordering between Cr and Ti atoms decreases with increasing Ta below 40 at%, and increases with Ta above 40 at%.
In Tix(CrTaVW)1−x alloys (Fig. 8b), the highest ordering at low temperatures for Cr–Ti pairs is observed in an alloy containing 10 at% of Ti, and the equiatomic concentration of Cr, Ta, V and W. The alloy containing 10 at% of Ti presents the highest temperature for the absence of ordering between Cr and Ti atoms, whereas the lowest temperature is observed for an alloy containing 90 at% Ti. Overall, increasing Ti concentration decreases the temperature for the absence of ordering.
In Vx(CrTaTiW)1−x alloys (Fig. 8c), the highest ordering at low temperatures for Cr–Ti pairs is observed in an alloy containing 40 at% V, and the equiatomic concentration of Cr, Ta, Ti, and W, while the biggest attraction between Cr and Ti atoms is observed for an alloy without V. The highest temperature for absence of ordering between Cr and Ti atoms is observed for an alloy without V, whereas the lowest temperature is observed for an alloy containing 70 at% V. Between 0 and 70 at% V, the temperature for the absence of ordering between Cr and Ti atoms decreases with V content.
In Wx(CrTaTiV)1−x alloys (Fig. 8d), the highest ordering at low temperatures for Cr–Ti pairs is observed in an alloy containing 70 at% W, and the equiatomic concentration of Cr, Ta, Ti and V. The highest temperature for the absence of ordering between Cr and Ti atoms is noted for an alloy containing 50 at% W, whereas the lowest temperature is observed for alloys containing 0 at% and 10 at% W. The Cr–Ti ordering temperature decreases with decreasing W content below 50 at% as well as with increasing W content above 50 at%.
Based on these observations and the nature of the plots presented in Fig. 8, we conclude that short-range ordering for Cr–Ti pairs in Cr–Ta–Ti–V–W alloys strongly depends on the concentration of Ta (SRO values ranging from −7 to 1), while still being affected by Ti, V and W concentrations to a slightly lesser extent.
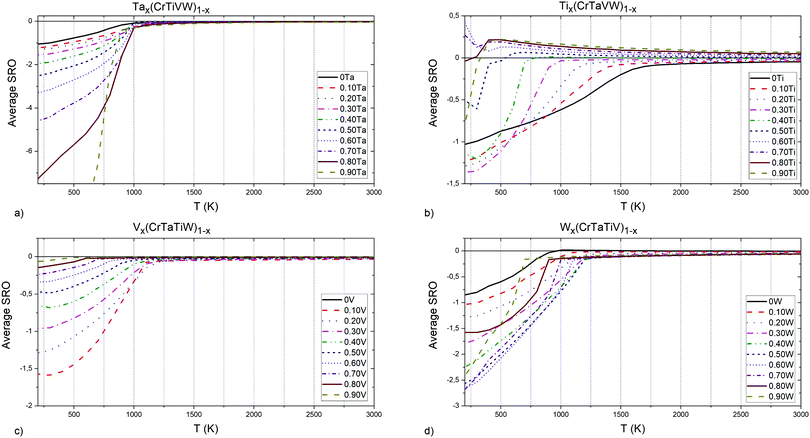 | ||
| Fig. 9 (a) Ta, (b) Ti, (c) V and (d) W elements concentrations influence on Cr–V pairs chemical short-range order parameter. | ||
In Tix(CrTaVW)1−x alloys (Fig. 9c), the highest attraction at low temperatures for Cr–V pairs is observed in an alloy containing 30 at% Ti, and the equiatomic concentration of Cr, Ta, V and W. An alloy without Ti atoms exhibits the highest temperature for the total absence of ordering between Cr and V atom, whereas the lowest temperature is observed for an alloy containing 50 at% Ti. The temperature for the absence of ordering between Cr and V atoms decreases with increasing Ti content below 50 at%, and increases with increasing Ti content above 50 at%.
In Vx(CrTaTiW)1−x alloys (Fig. 9d), the highest attraction at low temperatures for Cr–V pairs is observed in an alloy containing 10 at% V, and the equiatomic concentration of Cr, Ta, Ti and W. The highest temperature for the absence of ordering between Cr and V atoms is observed for an alloy containing 20 at% V, whereas the lowest temperature is observed for an alloy containing 90 at% V. With an increase of V content above 30 at%, the temperature for the absence of ordering between Cr and V atoms decreases.
In Wx(CrTaTiV)1−x alloys (Fig. 9a), the highest attraction at low temperatures for Cr–V pairs is observed in alloy containing 60 at% W, and equiatomic concentration of Cr, Ta, Ti and V. The highest temperature for the absence of ordering between Cr and V atoms is observed for an alloy containing 50 at% W, whereas the lowest temperature was found in alloys containing 90 at% W. The Cr-V ordering temperature decreases with decreasing W content below 30 at% as well as with increasing W content above 50 at%.
Based on these observations and the nature of the graphs presented in Fig. 9, we conclude that short-range ordering for Cr–V pairs in Cr–Ta–Ti–V–W alloys strongly depends on the concentration of Ta. The addition of W also results in much smaller ordering of Cr–V pairs. The lowest ordering for Cr–V pair is observed for an alloy containing 90 at% V, which is an effect of decreasing the Cr concentration.
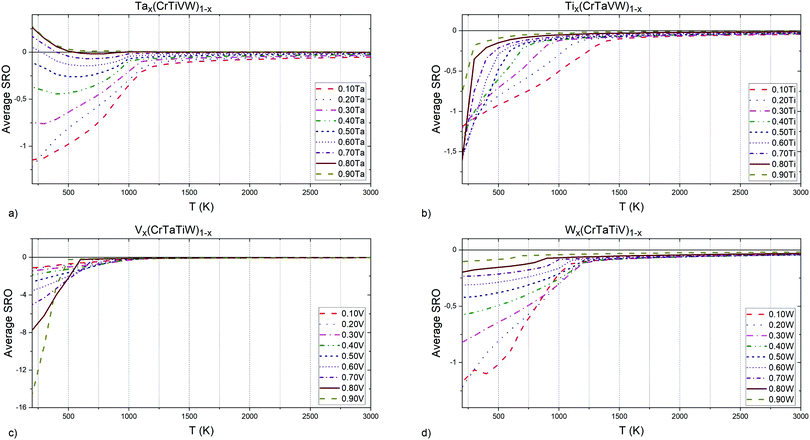 | ||
| Fig. 10 (a) Ta, (b) Ti, (c) V and (d) W elements concentrations influence on Ta–W pairs chemical short-range order parameter. | ||
In Tix(CrTaVW)1−x alloys (Fig. 10c), the highest attraction at low temperatures for Ta–W pairs is observed in an alloy containing 50 at% Ti, and the equiatomic concentration of Cr, Ta, V and W. The highest temperature for the absence of ordering between Ta and W atoms occurs in an alloy without Ti, whereas the lowest temperature is observed for an alloy containing 90 at% Ti. Overall, with the increase of Ti, the Ta–W disordering temperature decreases.
In Vx(CrTaTiW)1−x alloys (Fig. 10d), the highest attraction at low temperatures for Ta–W pairs is observed in an alloy containing 90 at% V, and the equiatomic concentration of Cr, Ta, Ti and W. An alloy containing 30 at% V exhibits the highest temperature for the total absence of ordering between Cr and V atoms, whereas the lowest temperature is observed for an alloy containing 90 at% V. With the increase of V content below 30 at%, the temperature for the absence of ordering between Ta and W atoms increases, while it decreases with increasing V concentration above 30 at%.
In Wx(CrTaTiV)1−x alloys (Fig. 10a), the highest attraction at low temperatures for Ta–W pairs is observed in an alloy containing 10 at% W, and the equiatomic concentration of Cr, Ta, Ti and V. The highest temperature for the absence of ordering between Ta and W atoms is seen for an alloy containing 40 at% W, whereas the lowest temperature is observed for alloys containing 90 at% W. For compositions larger or equal than 40 at% W the temperature of ordering between Ta and W atoms decreases with increasing W content.
Based on these observations (presented in Fig. 10), we conclude that short-range ordering for Ta–W pairs in Cr–Ta–Ti–V–W alloys very strongly depends on the concentration of V, especially below 500 K. The addition of Ti also results in much smaller Ta–W ordering.
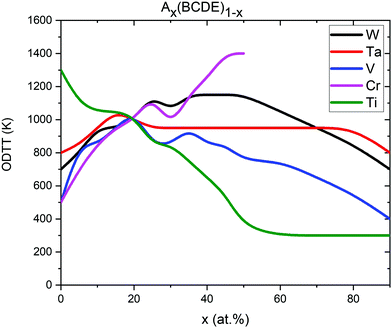
The ODTT was calculated using inflection points on the enthalpy of mixing plots (as it has been discussed in Fig. 4). The ODTT for the equiatomic quaternary compositions is shown in Fig. 11 at x = 0%. For example, the ODTT for equiatomic quaternary Cr–Ta–V–W alloy can be found at x = 0% for Ti in a Tix(CrTaVW)(1−x) alloy, and it is 1300 K, which is consistent with the values presented in Fig. 4 and Table 2. Values presented in Fig. 11 are also consistent with the values shown in Fig. S1 (ESI†) and Fig. 7, which also proves that the ODTT can be obtained using inflection points at both enthalpy of mixing and SRO.
The cross-point of all 5 lines at x = 20% represents the ODTT for the equiatomic quinary Cr–Ta–Ti–V–W alloy which is 1000 K.
The equiatomic quaternary Ta–Ti–V–W alloy that does not contain any Cr atoms shows an ODTT of 500 K in agreement with our results presented in Fig. 4. With increasing Cr concentration, the ODTT significantly increases to 800 K for 10 at% Cr, 1000 K for 20 at% Cr and up to 1400 K for 50 at% Cr. The opposite trend is observed for alloys containing Ti. The quaternary equiatomic Cr–Ta–V–W alloy has an ODTT of 1300 K. With the increase of Ti concentration the ODTT significantly decreases to 1000 K for 10 at% Ti, 800 K for 40 at% Ti and down to only 300 K for 50 at% and higher concentrations of Ti.
The quaternary equiatomic Cr–Ta–Ti–W alloy has a 500 K ODTT. With the increase of V concentration up to 20 at% the ODTT increases to 1000 K, while decreases with further addition of V down to 400 K at 90 at% V. Similar behavior can be observed for the concentration of W – the ODTT increases from 700 K for alloys without W up to 1100 K for 40 at% W and decreases with further addition of W down to 700 K for alloys containing 90 at% W. The influence of Ta on the ODTT is weak as it only changes the temperature in the 800–1000 K range for various Ta concentrations.
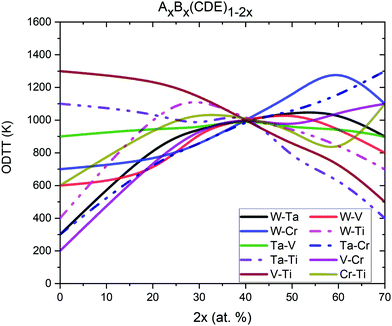
We then extended our analysis of the ODTT to understand the influence of pairs concentration for (AB)x(CDE)1−x for x = (0%, 5%, 10%, 15%…35%) pseudo-binary alloys, which required additional 80 MC simulations. In Fig. 12, the ODTT dependence on specific concentrations of element pairs is shown. As previously, the inflection points were calculated using the enthalpy of mixing.
The lowest ODTT was observed for alloys with the lowest concentrations of the Cr–V pair. The ternary equiatomic alloy Ta–Ti–W has an ODTT of only 200 K, and this temperature significantly increases with the increase of Cr–V concentration up to 1100 K for alloys containing 35 at% Cr and 35 at% V. A similar trend has been observed for Cr–Ta and Ta–W pairs – for an alloy without either of those pairs, the observed ODTT was 300 K, while it significantly increases with increasing Cr–Ta or Ta–W pairs concentrations. The ODTT was 1300 K and 900 K for alloys containing 70 at% Cr–Ta and 70 at% Ta–W pairs, respectively.
Increasing the concentration of Ti-W pair from 0 at% to 30 at% increases the ODTT from 400 K to 1100 K. Further increases of Ti–W concentration, up to 70 at%, decrease the ODTT back to 400 K. We also observe that increasing the concentration of the Ti–V pair may significantly decrease the ODTT – alloys without the Ti–V pair has ODTT = 1300 K, while alloys containing 70 at% Ti–V pair has ODTT at 500 K. The ODTT decreases almost linearly with increasing Ti–V concentration.
The V–W and Cr–Ti pairs concentrations do not show a significant influence on the ODTT. The results shown above are in agreement with our conclusion made based on Fig. 11 where we looked into the influence of a single element concentration – maintaining low concentration of the Cr–V pair by either removing Cr or V and increasing the concentration of Ti leads to the lowest ODTT.
The presence of Cr and V in the system causes the increase of ODTT since all structures found in the binary Cr–V system have strongly negative enthalpies of mixing (as shown in Fig. 2). By removing V from the system, there are only three possible pairs with Cr left in an alloy and none of those have as negative enthalpies of mixing as structures found in the Cr–V system, with most of them being positive. Removing Cr from the alloy results in V having three possible pairs, among which only V–W structures have negative enthalpies of mixing, but because of the competition between V and Ta in attracting W (see Fig. 7d), we are not observing strong attraction between V and W in the equiatomic Ta–Ti–V–W alloy.
The increase of Ti content in the system causes the decrease of ODTT since the majority of binaries including Ti possess enthalpies of mixing close to zero, which means that Ti does not form very stable compounds with other elements present in the system. The negative enthalpy of mixing of Ti–W structures does not cause a significant increase of ODTT since the attraction of Ti and W is minimized by the stronger attraction between Ta and W.
Based on the carried investigation, a common rule to select components to change the ODTT of HEAs could be proposed – in order to select components to minimize the probability of formation of brittle intermetallic phases in multi-component alloys, it is profitable to remove from the system the elements that form with other elements the binary structures with either very negative or very positive enthalpies of mixing and it is profitable to add those elements to the system which form binary structures with enthalpies of mixing close to zero.
4.3 Discussion related to other works
The W derivative alloys for the Cr–Ta–Ti–V–W system, namely Wx(TaTiVCr)1−x alloys, for nominal concentrations of W being x = (30%, 40%,…,90%) were investigated experimentally in ref. 51. Samples were synthesized using powder metallurgy processing followed by spark plasma sintering at 1600 °C. In that work, the electron probe micro-analyzer (EPMA) tool for W0.3(TaTiCrV)0.7 and W0.8(TaTiCrV)0.2 samples was given. Results of these analyses can be compared to our investigation carried out for Cr–Ti, Cr–V and Ta–W pairs in W derivative alloys, namely Fig. 8d, 9d and 10d. From Fig. 3a in ref. 51 it has been concluded that for the W0.3(TaTiCrV)0.7 alloy in the W-rich region the next most common element is Ta, which indicates strong attraction between W and Ta. It is in general agreement with our results presented in Fig. 10d, where it has been shown that the Ta–W pair has negative SRO values for the W0.3(TaTiCrV)0.7 alloy at temperatures even higher than 1900 K at which the sample was synthesized.51 Similar observations were made for the W0.8(TaTiCrV)0.2 alloy (Fig. 3b in ref. 51), in which the attraction between Ta and W was once again observed as a high concentration of Ta in W-rich regions. This observation is in general agreement with our results obtained for the W0.8(TaTiCrV)0.2 alloy in Fig. 10d, where we have predicted that the SRO parameter has negative values for the Ta–W pair even at temperatures above 1900 K.In ref. 97 the enthalpy of formation has been calculated for several W derivative alloys of the Cr–Ta–Ti–V–W system, namely Wx(CrTaTiV)1−x (for x = 30%, 37%, 44%, 52%, 59%, 67%), using the SQS method. In order to cross-check the results from ref. 97 we have decided to perform Monte Carlo simulations using 10 × 10 × 10 bcc simulation cells for the same derivatives using our cluster expansion model. We performed also DFT calculations for 3 × 3 × 3 SQS structures containing 54 atoms as in ref. 97. The temperature dependence of the formation enthalpies obtained from MC simulations is shown in Fig. S3 (ESI†). The comparison of formation energies of disordered structures from MC simulations at 3000 K and those from DFT calculations for SQS structures computed in this work and in ref. 97 is presented in Table 3. The values published in ref. 97 seem to be significantly lower than our values obtained both from MC simulations and DFT calculations for SQS structures. The enthalpies of formation obtained for some of the bcc structures in ref. 97 are even lower than those of C14 and C15 Laves phases predicted by the present DFT calculations.
| Method | W30 | W37 | W44 | W52 | W59 | W67 |
|---|---|---|---|---|---|---|
| MC@3000 K | 1 | −10 | −19 | −29 | −35 | −40 |
| DFT (SQS) ref. 97 | −87 | −97 | −109 | −130 | −152 | −166 |
| DFT (SQS) | 28 | 14 | −2 | −14 | −24 | −30 |
Recently, refractory high entropy Tix(WTaVCr)1−x alloys have been fabricated via spark plasma sintering for fusion plasma-facing materials.52 Alloys containing 0 at%, 4 at% and 7 at%, of Ti and close to equiatomic concentration of the rest of the elements have been synthesized at 1500 °C. The electron backscatter diffraction (EBSD) analysis of the fabricated samples can be directly compared to some of our SRO results presented in Sections 4.1 and 4.2, specifically SRO parameters at temperatures around 1750–1800 K for the equiatomic Cr–Ta–V–W alloy (see Fig. 7g). In Fig. 13a the SRO parameter for the equiatomic Cr–Ta–V–W alloy is given with magnified 1600–1900 K region. From our investigation we concluded that at these temperatures, the highest attraction is observed between Ta–W and Cr–V atoms, as only those pairs show negative SRO parameter values (around −0.1). It is in general agreement with ref. 52 (Fig. 3a), where in the V-rich region the next most commonly observed element was Cr, and in the W-rich region the next most common element was Ta. In Fig. 13b the SRO parameter for the Ti0.04(CrTaVW)0.96 alloy is given, with magnified 1600–1900 K region. It can be directly compared to Fig. 3b in ref. 52, where EPMA test results are given. Results presented there are in general agreement with our prediction of Cr–V pair attraction, as V is the next most common element observed in a Cr-rich region. In Fig. 13c the SRO parameter for the Ti0.07(CrTaVW)0.93 alloy is given, with a magnified 1650–1850 K region. For that alloy, we predicted an attraction between, among others, Cr and Ti atoms. Our predictions are in agreement with results presented in ref. 52 in Fig. 3c, where on EPMA test results it is shown that in Ti-rich regions the next most common element is Cr.
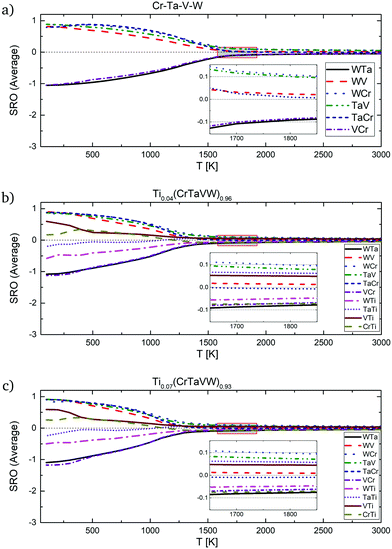 | ||
| Fig. 13 SRO parameters for pairs in (a) Cr–Ta–V–W equiatomic alloy, (b) Ti0.04(CrTaVW)0.96 and (c) Ti0.07(CrTaVW)0.93 alloys with highlighted 1600–1900 K region. | ||
Comparing Fig. 13a–c (see Table 4) we conclude that the SRO parameter for all the pairs in the three alloy systems becomes closer to 0 (disordered configuration) with an increase of Ti concentration. More precisely, in alloys with 0 at%, 4 at% and 7 at% Ti the SRO parameters for the Ta–V pair are 0.100, 0.081 and 0.074 respectively and for Cr–V are: −0.086, −0.070 and −0.064, respectively. In Ti0.04(CrTaVW)0.96 and Ti0.07(CrTaVW)0.93 alloys, the SRO for the Ta–Ti pair decreases from 0.063 to 0.059, respectively. Therefore, alloying with increasing Ti concentration into the quaternary system Cr–Ta–V–W leads to the decrease of the ODTT in consistence with the previous analysis of the dependence of the free energy of mixing with the Ti composition (see Fig. 11).
| Pair | CrTaVW | Ti0.04(CraTVW)0.96 | Ti0.07(CrTaVW)0.93 |
|---|---|---|---|
| Cr–Ta | −0.009 | −0.006 | −0.009 |
| Cr–Ti | −0.072 | −0.071 | |
| Cr–V | −0.086 | −0.070 | −0.064 |
| Cr–W | 0.107 | 0.098 | 0.098 |
| Ta–Ti | 0.063 | 0.058 | |
| Ta–V | 0.100 | 0.081 | 0.074 |
| Ta–W | −0.092 | −0.080 | −0.077 |
| Ti–V | 0.049 | 0.046 | |
| Ti–W | −0.049 | −0.049 | |
| V–W | 0.023 | 0.014 | 0.010 |
5 Phase decomposition in Cr–Ta–V–W alloys and comparison with experimental results
The main focus of this section is to link our theoretical predictions of Cr and V clustering formation in the Cr–Ta–V–W system with the recent experiment work carried out at the Los Alamos National Laboratory (LANL) for specific alloy compositions. These alloys have shown a high tolerance to radiation damage and sustainable mechanical properties after irradiation and they represent potential candidates for fusion material applications.435.1 Experimental observation of (Cr,V) precipitation in irradiated W0.38Ta0.36Cr0.15V0.11
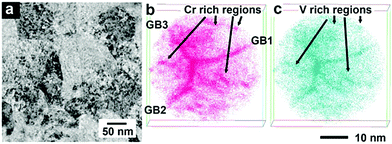
In this experimental work, the developed W0.38Ta0.36Cr0.15V0.11 alloy was sintered as a thin film using magnetron sputtering deposition. Atom Probe Tomography (APT) analysis revealed a layer structure in the as-deposited sample, with separated Cr/V-rich and W/Ta-rich regions. The sample was then irradiated in situ at the IVEM-Tandem Facility with 1 MeV Kr+2 and 1073 K, with a dpa rate of 0.0006 dpa s−1 up to 1.6 dpa. No dislocation loops were observed during irradiation, although precipitates were formed. APT analysis of irradiated samples showed that those precipitates were Cr- and V- rich. In Fig. 14 a bright field TEM image of the HEA sampled along with APT results are given, with clearly visible Cr/V rich grain boundaries. Next Section compares the free energy calculations between the equiatomic Cr–Ta–V–W (which has the layer structure between Cr/V-rich and W/Ta-rich regions, see Fig. 7k and l) and the derivative W0.38Ta0.36Cr0.15V0.11 alloys.5.2 (Cr,V)/(Ta,W) layer structure in equiatomic Cr–Ta–V–W
From our study, we concluded that the equiatomic Cr–Ta–V–W system becomes completely disordered at around 1700 K (see Fig. 7j), which is the highest temperature among all quaternary subsystems in our quinary Cr–Ta–Ti–V–W alloy. The ordering in this alloy is very strongly visible even at 800 K (see Fig. 7l). We investigated more thoroughly this specific quaternary system in order to understand what causes the ODTT to be so relatively high. Monte Carlo simulations for the quaternary Cr–Ta–V–W subsystem were carried out for a large simulation cell (30 × 30 × 30) containing 54![[thin space (1/6-em)]](https://www.rsc.org/images/entities/char_2009.gif) 000 atoms. Simulations were performed using the ATAT package, starting from the disordered state at 2500 K, followed by cooling to 100 K with temperature steps of 100 K. The 30 × 30 × 30 structure obtained at 300 K temperature is given in Fig. S4 (ESI†). Just like for the 10 × 10 × 10 system (see Fig. 7k) we observe strong clustering between Ta/W and Cr/V atoms and a layer structure. In the 30 × 30 × 30 bcc cell we also observe an ordering structure within the Cr/V cluster, identified as the CrV B2 phase with Pm
000 atoms. Simulations were performed using the ATAT package, starting from the disordered state at 2500 K, followed by cooling to 100 K with temperature steps of 100 K. The 30 × 30 × 30 structure obtained at 300 K temperature is given in Fig. S4 (ESI†). Just like for the 10 × 10 × 10 system (see Fig. 7k) we observe strong clustering between Ta/W and Cr/V atoms and a layer structure. In the 30 × 30 × 30 bcc cell we also observe an ordering structure within the Cr/V cluster, identified as the CrV B2 phase with Pm![[3 with combining macron]](https://www.rsc.org/images/entities/char_0033_0304.gif) m symmetry, which was already found by us in the binary Cr–V system and was marked as a ground state in our cluster expansion simulations (see Table 1).
m symmetry, which was already found by us in the binary Cr–V system and was marked as a ground state in our cluster expansion simulations (see Table 1).
In Fig. 15 the Hmix, Fmix and −TSmix values as a function temperature for the equiatomic quaternary Cr–Ta–V–W alloy are shown. Free energy of mixing values were calculated using both TDI and 1NN pair probabilities methods. The enthalpy of mixing contribution to the free energy of mixing is dominant at low temperatures, while the −TSmix term dominates at elevated temperatures, where the disorder configuration is preferred. The enthalpy of mixing value is close to 0 eV per atom at 3000 K.
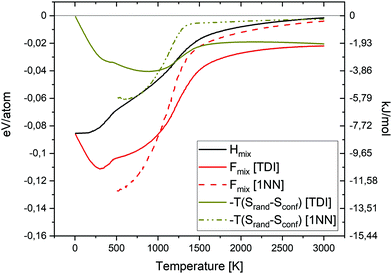 | ||
| Fig. 15 Enthalpy of mixing, entropy of mixing and free energy of mixing as a function of temperature for the equiatomic quaternary Cr–Ta–V–W alloy. | ||
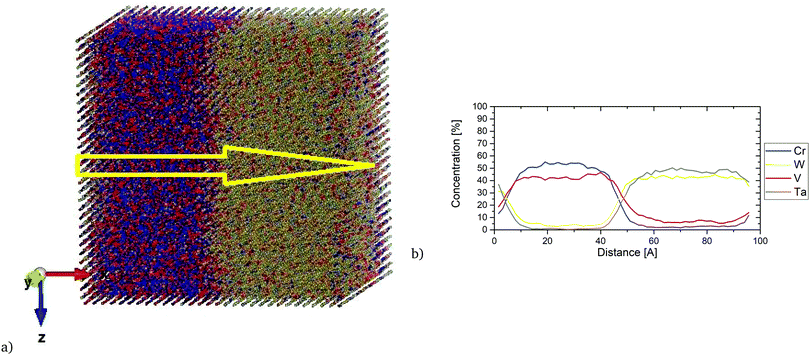
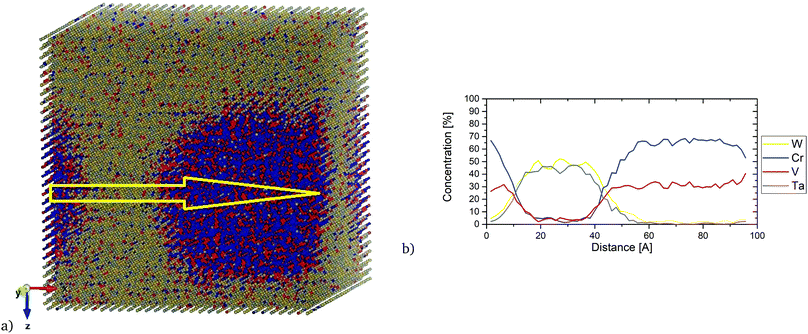
Fig. 16 shows the local concentration profile along the [100] direction in the equiatomic Cr–Ta–V–W alloy at 1100 K. We observe that with the increase of Cr concentration, the concentration of V increases, while the Ta and W concentrations decrease. Ta/W rich regions have also been observed to have very low concentrations of Cr and V. The layer structure in this equiatomic Cr–Ta–V–W alloy can be observed even at elevated temperatures.
5.3 (Cr,V)-rich segregation in W0.38Ta0.36Cr0.15V0.11 alloys
Interest in one specific composition W0.38Ta0.36Cr0.15V0.11 has been shown in ref. 43. In Fig. S5 (ESI†), SRO parameters are given for first and second nearest neighbours (eqn (8)), as well as average SRO parameters (eqn (9)), comparing the values with the equiatomic Cr–Ta–V–W alloy. The overall trend is the same regardless of whether it is first or second nearest neighbour – lowest SRO values for Cr–V and Ta–W pairs. Especially Cr–V pairs show a strongly negative SRO parameter, indicating very strong attraction between Cr and V, which was previously observed in the equiatomic Cr–Ta–V–W quaternary subsystem and Cr–Ta–Ti–V–W quinary system. It has also been observed that the SRO parameter for Ta–W pair is less negative in the case of W0.38Ta0.36Cr0.15V0.11 alloy than in the equiatomic Cr–Ta–V–W alloy. The ordering in W0.38Ta0.36Cr0.15V0.11 alloy vanishes between 1400 K and 1500 K, slightly lower than 1700 K for the equiatomic Cr–Ta–V–W alloy.In Fig. 17, the local concentration profile along the [100] direction in the W0.38Ta0.36Cr0.15V0.11 alloy is presented. It is found that inside the precipitates there was a very high concentration of Cr and V atoms with very low (up to 5%) concentration of W and Ta. The resulted concentration profile is in general agreement with the local concentration profile obtained experimentally.43
Fig. 18 shows the Hmix, Fmix and −TSmix values as a function of temperature for the quaternary W0.38Ta0.36Cr0.15V0.11 alloy. Free energy of mixing values were calculated using both TDI and 1NN pair probabilities methods.
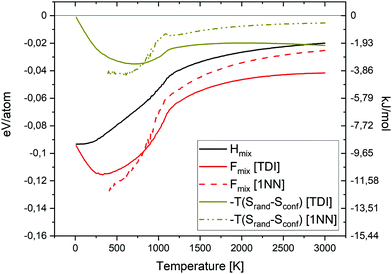 | ||
| Fig. 18 Enthalpy of mixing, entropy of mixing and free energy of mixing as a function of temperature for the W0.38Ta0.36Cr0.15V0.11 alloy. | ||
Fig. 19 shows a comparison of the free energy of mixing for the equiatomic quaternary Cr–Ta–V–W alloy and the quaternary W0.38Ta0.36Cr0.15V0.11 alloy. The free energy of mixing was calculated using TDI (solid lines), and 1NN contribution (dashed lines). From the TDI results we may conclude that at temperatures below 900 K, and above 1200 K, the free energy of mixing value is lower for the W0.38Ta0.36Cr0.15V0.11 alloy, while between 900 K and 1200 K it is lower for the equiatomic composition. The Fmix calculated from 1NN contribution is lower for the equiatomic Cr–Ta–V–W below 1100 K compared to the W0.38Ta0.36Cr0.15V0.11 system. At temperatures above 1000 K both TDI and 1NN methods present similar trends. At temperatures below 500 K the Smix values obtained using the 1NN method become negative, which highlights its approximate nature and can be only applied at high temperatures.37 Thus we conclude that the results obtained from TDI are more accurate in general.
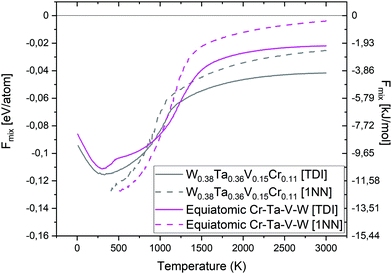 | ||
| Fig. 19 Free energy of mixing comparison between equiatomic Cr–Ta–V–W and W0.38Ta0.36Cr0.15V0.11 alloy from TDI and 1NN. | ||
Our prediction of lower mixing free energy calculations for the W0.38Ta0.36Cr0.15V0.11 alloy at the two different ranges of temperature shows that the phase segregation is, on one hand, strongly related to the stable configuration in this multi-component system. On the other hand, since the formation of Cr- and V-rich precipitates have also been observed experimentally for the same alloy composition, it clearly demonstrates that this phenomenon is thermodynamically driven. It is worth mentioning that the same kind of precipitates in this alloys can be seen without and with radiation.43 A recent computational study on relationship between the SRO-induced local segregation and radiation effects in CoCuFeNi HEAs has been reported.98 By using hybrid molecular dynamic and Monte-Carlo simulations, the study in question showed that the mobility of point defects created by irradiation can be changed and the system reaches a steady-state configuration of defect creation and annihilation with a tendency of copper segregation. For understanding of origin of the exceptional radiation resistance of the W-based HEAs under irradiation, a deeper investigation of kinetic properties of point defect migration and diffusion is crucial for clarifying additional mechanism for Cr and V segregation.
6 Discussion and conclusions
A DFT-based cluster expansion model has been developed for the quinary bcc Cr–Ta–Ti–V–W system with a cross-validation value of 10.2 meV per atom. The lowest enthalpies of mixing for binary systems have been observed for Ta–W, Ti–W and Cr–V systems.Monte-Carlo simulations based on a CE Hamiltonian have been carried out to analyse the short-range ordering in the quaternary and quinary alloys involving the Cr–Ta–Ti–V–W elements. The lowest order–disorder transition temperature predicted from the dependence of the free energy of mixing as a function of temperature for equiatomic compositions is observed for the Cr–Ta–Ti–W and Ta–Ti–V–W alloys and it is 500 K.
Our systematic study of the derivative Cr–Ta–Ti–V–W alloys shows that the most negative short-range order values are observed for the Ta–W and Cr–V pairs. Removing either Cr or V from the alloys significantly decreases the order–disorder transition temperature, while increasing the Ti concentration significantly decreases the order–disorder transition temperature. The physics origin of these phenomena is in the enthalpy of mixing of binaries formed by Cr/V and Ti. The presence of Cr and V in the system causes the increase of ODTT since all structures found in the binary Cr–V system have strongly negative enthalpies of mixing, while most binary structures containing Ti possess enthalpies of mixing close to zero and thus increased concentration of Ti results in the decrease of ODTT.
Increasing concentration of Cr–V, Ta–W and Cr–Ti pairs in the derivative alloys up to 40 at%, significantly increases the order–disorder transition temperature. Increasing the Ta–Ti and Ti–V concentration decreases the order–disorder transition temperature.
Theoretical short-range order results obtained for the derivative quinary Ti0.07(CrTaVW)0.93, Ti0.04(CrTaVW)0.96, W0.3(TaTiCrV)0.7 and W0.8(TaTiCrV)0.2 alloys are in general agreement with experimental results at high temperature presented in ref. 51 and 52 showing certain element-rich regions that are in line with our short-range order predictions for those concentrations.
The free energy of mixing for the equiatomic Cr–Ta–V–W alloy are higher than for the W0.38Ta0.36Cr0.15V0.11 composition below 800 K and above 1100 K. They are similar between 800 K and 1100 K. Theoretical analysis of local-concentration profiles at 1100 K are in agreement with atom-probe tomography analysis of samples synthesized as thin films using magnetron sputtering deposition. The present study shows that the thermodynamics play a key role in the formation of Cr- and V-rich precipitates and therefore explain experimental observation of this segregation phenomena in Cr–Ta–V–W alloys. Our prediction of the negative free energy of mixing shown in Fig. 19 for W0.38Ta0.36Cr0.15V0.11 alloy is strongly correlated with the chemical short-range order of the Cr–V pairs leading to the Cr/V segregation in the HEAs. The latter phenomenon is observed experimentally in W0.38Ta0.36Cr0.15V0.11 alloy after irradiation and thermal annealing at high temperature (see Fig. 14b and c). These results reveal that the short-range order maintains even under irradiation and the thermodynamically stabilised HEAs predicted in this study represent a steady-state configuration in a driven system.98 To correlate the experimental observation of Cr/V segregation with the properties of irradiation-created defects, a rate theory model in which the defect mobilities and their recombination probability should be taken into consideration, is currently developing to investigate the steady-state conditions of the long-term microstructural evolution of the HEAs under irradiation. A further systematic investigation of point defect (vacancy and interstitial) properties would be very desirable for understanding the micro-structural evolution and the origin of exceptional radiation resistance in W-based HEAs.
Finally, it is worth to highlight the benefits of DFT-based MC simulations for the design of high entropy alloys. One of the possible issues with those kinds of alloys for mechanical applications is their brittleness. The developed model enables to increase the ductility of alloys by designing the alloy compositions with decreased ODTT and thus avoiding the formation of brittle intermetallic phases. The DFT-based MC simulations allow to investigate the phase stability and chemical short-range order at different temperatures and composition ranges to further analyse alloys behaviour under distinct conditions. It could be used to find the optimal compositions for numerous applications e.g. fusion, where high radiation resistance is important.
Conflicts of interest
There are no conflicts to declare.A Appendix
Effective cluster interactions for Cr–Ta–Ti–V–W system together with the description of considered clusters are given in Table 5.| |ω| | n | (s) | Coordinates | m (s)|ω|,n | J (s)|ω|,n | |ω| | n | (s) | Coordinates | m (s)|ω|,n | J (s)|ω|,n |
|---|---|---|---|---|---|---|---|---|---|---|---|
| 1 | 1 | (0) | (½, ½, −½) | 1 | 12.179 | (4,1,2) | 24 | −0.258 | |||
| (1) | 1 | 54.547 | (2,2,2) | 12 | −0.388 | ||||||
| (2) | 1 | −17.909 | (3,2,2) | 24 | −0.288 | ||||||
| (3) | 1 | 59.666 | (4,2,2) | 24 | 0.501 | ||||||
| (4) | 1 | −51.130 | (2,3,2) | 12 | −0.175 | ||||||
| 2 | 1 | (1,1) | (½, ½, ½),(1, 0, 0) | 4 | 2.285 | (3,3,2) | 24 | 0.390 | |||
| (2,1) | 8 | 0.866 | (4,3,2) | 24 | 0.308 | ||||||
| (3,1) | 8 | −8.905 | (2,4,2) | 12 | 0.137 | ||||||
| (4,1) | 8 | −5.029 | (3,4,2) | 24 | 0.180 | ||||||
| (2,2) | 4 | −0.943 | (4,4,2) | 24 | 0.220 | ||||||
| (3,2) | 8 | −10.447 | (3,1,3) | 12 | 0.008 | ||||||
| (4,2) | 8 | −4.934 | (4,1,3) | 24 | −0.673 | ||||||
| (3,3) | 4 | 15.816 | (3,2,3) | 12 | 0.577 | ||||||
| (4,3) | 8 | 9.557 | (4,2,3) | 24 | 0.323 | ||||||
| (4,4) | 4 | 5.188 | (3,3,3) | 12 | −1.529 | ||||||
| 2 | 2 | (1,1) | (½, ½, ½),(½, ½, ½) | 3 | −17.608 | (4,3,3) | 24 | −0.826 | |||
| (2,1) | 6 | −8.283 | (3,4,3) | 12 | −1.586 | ||||||
| (3,1) | 6 | 14.425 | (4,4,3) | 24 | −1.063 | ||||||
| (4,1) | 6 | 5.287 | (4,1,4) | 12 | −0.402 | ||||||
| (2,2) | 3 | −2.982 | (4,2,4) | 12 | 1.033 | ||||||
| (3,2) | 6 | 7.100 | (4,3,4) | 12 | −1.321 | ||||||
| (4,2) | 6 | 3.058 | (4,4,4) | 12 | −0.331 | ||||||
| (3,3) | 3 | −0.664 | 3 | 2 | (1,1,1) | (½, ½, ½),(0, 0, 0),(½, −½, ½) | 12 | −0.146 | |||
| (4,3) | 6 | 4.228 | (2,1,1) | 24 | −0.528 | ||||||
| (4,4) | 3 | 4.951 | (3,1,1) | 24 | −0.185 | ||||||
| 2 | 3 | (1,1) | (½, ½, ½),(½, ½, ½) | 6 | −3.359 | (4,1,1) | 24 | 0.047 | |||
| (2,1) | 12 | −2.981 | (1,2,1) | 12 | −0.107 | ||||||
| (3,1) | 12 | −0.367 | (2,2,1) | 24 | 0.230 | ||||||
| (4,1) | 12 | −0.315 | (3,2,1) | 24 | 0.219 | ||||||
| (2,2) | 6 | −0.680 | (4,2,1) | 24 | 0.353 | ||||||
| (3,2) | 12 | 0.175 | (1,3,1) | 12 | 1.179 | ||||||
| (4,2) | 12 | −0.409 | (2,3,1) | 24 | 0.714 | ||||||
| (3,3) | 6 | 4.225 | (3,3,1) | 24 | −1.419 | ||||||
| (4,3) | 12 | 2.925 | (4,3,1) | 24 | −0.414 | ||||||
| (4,4) | 6 | 1.330 | (1,4,1) | 12 | 1.096 | ||||||
| 2 | 4 | (1,1) | (½, ½, ½),(0, 0, 1) | 12 | −2.940 | (2,4,1) | 24 | 0.480 | |||
| (2,1) | 24 | −0.552 | (3,4,1) | 24 | −1.027 | ||||||
| (3,1) | 24 | 3.591 | (4,4,1) | 24 | −0.136 | ||||||
| (4,1) | 24 | 1.040 | (2,1,2) | 12 | 0.096 | ||||||
| (2,2) | 12 | −0.141 | (3,1,2) | 24 | 0.321 | ||||||
| (3,2) | 24 | 0.017 | (4,1,2) | 24 | 0.010 | ||||||
| (4,2) | 24 | −0.212 | (2,2,2) | 12 | 0.679 | ||||||
| (3,3) | 12 | −6.531 | (3,2,2) | 24 | −0.397 | ||||||
| (4,3) | 24 | −2.363 | (4,2,2) | 24 | 0.071 | ||||||
| (4,4) | 12 | 0.295 | (2,3,2) | 12 | 0.792 | ||||||
| 3 | 1 | (1,1,1) | (½, ½, ½),(0, 0, 0),(½, ½, ½) | 12 | −0.288 | (3,3,2) | 24 | −0.177 | |||
| (2,1,1) | 24 | −0.163 | (4,3,2) | 24 | 0.224 | ||||||
| (3,1,1) | 24 | −0.140 | (2,4,2) | 12 | 0.719 | ||||||
| (4,1,1) | 24 | −0.008 | (3,4,2) | 24 | 0.096 | ||||||
| (1,2,1) | 12 | −0.283 | (4,4,2) | 24 | 0.394 | ||||||
| (2,2,1) | 24 | −0.270 | (3,1,3) | 12 | −0.526 | ||||||
| (3,2,1) | 24 | 0.300 | (4,1,3) | 24 | −0.155 | ||||||
| (4,2,1) | 24 | 0.055 | (3,2,3) | 12 | 1.105 | ||||||
| (1,3,1) | 12 | 0.570 | (4,2,3) | 24 | 0.369 | ||||||
| (2,3,1) | 24 | 0.547 | (3,3,3) | 12 | −0.443 | ||||||
| (3,3,1) | 24 | −1.138 | (4,3,3) | 24 | −0.836 | ||||||
| (4,3,1) | 24 | −0.403 | (3,4,3) | 12 | 0.064 | ||||||
| (1,4,1) | 12 | 0.318 | (4,4,3) | 24 | −0.730 | ||||||
| (2,4,1) | 24 | 0.020 | (4,1,4) | 12 | −0.082 | ||||||
| (3,4,1) | 24 | −0.689 | (4,2,4) | 12 | 0.159 | ||||||
| (4,4,1) | 24 | −0.530 | (4,3,4) | 12 | −0.579 | ||||||
| (2,1,2) | 12 | −0.487 | (4,4,4) | 12 | −0.419 | ||||||
| (3,1,2) | 24 | 0.001 |
Acknowledgements
D. S., J. S. W. and T. R. acknowledge the financial support from the Foundation for Polish Science Grant HOMING (No. Homing/2016-1/12). The HOMING programme is co-financed by the European Union under the European Regional Development Fund. The simulations were carried out mostly with the support of the Interdisciplinary Centre for Mathematical and Computational Modelling (ICM), University of Warsaw, under grant No. GB79-6 and with the partial support of the Poznan Supercomputing and Networking Center PCSS under Grant No. 274. D.S. thanks UKAEA for its hospitality in CCFE where part of this work has been performed. The work at CCFE has been carried out within the framework of the EUROfusion Consortium and has received funding from the Euratom research and training programme 2014–2020 under Grant Agreement No. 633053 and funding from the RCUK Energy Programme (Grant No. EP/T012550/1) for 2019–2020. The views and opinions expressed herein do not necessarily reflect those from the European Commission. D. N.-M. and J. S. W. acknowledge the support from high performing computing facility MARCONI (Bologna, Italy) provided by EUROfusion. D. N.-M. also acknowledges the support from the Institute of Materials (IMS) at Los Alamos (New Mexico) for the IMS Rapid Response 2018 visit to the Los Alamos Naional Laboratory (LANL). EM acknowledges support by the U.S. Department of Energy, Office of Science, Office of Fusion Energy Sciences, and Office of Advanced Scientific Computing Research through the Scientific Discovery through Advanced Computing (SciDAC) project on Plasma-Surface Interactions under Award No. DE-SC0008875.References
- J. Knaster, A. Moeslang and T. Muroga, Nat. Phys., 2016, 12, 424–434 Search PubMed.
- D. Stork and S. Zinkle, Nucl. Fusion, 2017, 57, 092001 CrossRef.
- E. E. Bloom, J. Nucl. Mater., 1988, 258-263, 7–17 CrossRef.
- A. F. Rowcliffe, L. M. Garrison, Y. Yamamoto, L. Tan and Y. Katoh, Fusion Eng. Des., 2018, 135, 290–301 CrossRef CAS.
- M. Reith, S. L. Dudarev, S. M. Gonzalez de Vicente, J. Aktaa, T. Ahlgren, S. Antusch, D. E. J. Armstrong, M. Balden, N. Baluc, M. F. Barthe, W. W. Basuki, M. Battabyal, C. S. Becquart, D. Blagoeva, H. Boldyryeva, J. Brinkmann, M. Celino, L. Ciupinski, J. B. Correiam, A. De Backer, C. Domain, E. Gaganidze, C. García-Rosales, J. Gibson, M. R. Gilbert, S. Giusepponi, B. Gludovatz, H. Greuner, K. Heinola, T. Höschen, A. Hoffmann, F. Holstein, N. Koch, W. Krauss, H. Li, S. Lindig, J. Linke, C. Linsmeier, P. López-Ruiz, M. H. J. Matejicek, T. P. Mishra, M. Muhammedl, A. Muñoz, M. Muzyk, K. Nordlund, D. Nguyen-Manh, J. Opschoor, N. Ordás, T. Palacios, G. Pintsuk, G. Pippan, J. Reiser, J. Riesch, S. G. Roberts, L. Romaner, M. Rosinski, J. Sanchez, W. Schulmeyer, H. Traxler, A. Ureña, J. van der Laan, L. Veleva, S. Wahlberg, W. M. T. Weber, T. Weitkamp, S. Wurster, M. A. Yar, J. H. You and A. Zivelonghi, J. Nucl. Mater., 2013, 432, 482–500 CrossRef.
- R. G. Abernethy, Mater. Sci. Technol., 2017, 33, 388–399 CrossRef CAS.
- Y. Li, T. W. Morgan, J. A. W. Van Dommelen, S. Antusch, M. Reith, J. P. M. Hoefnagels, D. Terentyev, G. De Temmerman, K. Verbeken and M. G. D. Geers, Nucl. Fusion, 2020, 60, 046029 CrossRef CAS.
- B. Gludovatz, S. Wurster, A. Hoffmann and R. Pippan, Int. J. Refract. Met. Hard Mater., 2010, 28, 674–678 CrossRef CAS.
- D. Rupp and S. M. Weygand, Philos. Mag., 2010, 90, 4055 CrossRef CAS.
- O. El-Atwani, J. A. Hinks, G. Greaves, J. P. Allain and S. A. Maloy, Mater. Res. Lett., 2017, 5, 343–349 CrossRef CAS.
- O. El-Atwani, J. A. Hinks, G. Greaves, S. Gonderman, T. Qiu, M. Efe and J. P. Allain, Sci. Rep., 2015, 4, 4716 CrossRef.
- W. Dai, S. Liang, Y. Luo and Q. Yang, Int. J. Refract. Met. Hard Mater., 2015, 50, 240–246 CrossRef CAS.
- A. Xu, C. Beck, D. E. J. Armstrong, K. Rajan, G. D. W. Smith, P. A. J. Bagot and S. G. Roberts, Acta Mater., 2015, 87, 121–127 CrossRef CAS.
- M. Reith, J. Reister, B. Dafferner and S. Baumgärtner, Fusion Sci. Technol., 2012, 61, 381–384 CrossRef.
- S. Telu, A. Patra, M. Sankaranarayana, R. Mitra and S. K. Pabi, Int. J. Refract. Met. Hard Mater., 2013, 36, 191–203 CrossRef CAS.
- D. Nguyen-Manh, M. Muzyk, M. Y. Lavrentiev and S. L. Dudarev, J. Mater. Sci., 2012, 47, 7385–7398 CrossRef CAS.
- M. Muzyk, D. Nguyen-Manh, K. J. Kurzydłowski, N. L. Baluc and S. L. Dudarev, Phys. Rev. B, 2011, 84, 104115 CrossRef.
- M. Muzyk, D. Nguyen-Manh, J. Wróbel, K. J. Kurzydłowski, N. L. Baluc and S. L. Dudarev, J. Nucl. Mater., 2013, 442, S680–S683 CrossRef CAS.
- L. Romaner, C. Ambrosch-Draxl and R. Pippan, Phys. Rev. Lett., 2010, 104, 195503 CrossRef.
- Y. Ma, Q. F. Han, Z. Y. Zhou and Y. L. Liu, J. Nucl. Mater., 2016, 468, 105–112 CrossRef CAS.
- K. Arshad, W. Guo, J. Wang, M. Y. Zhao, Y. Yuan, Y. Zhang, B. Wang, Z. J. Zhou and G. H. Lu, Int. J. Refract. Met. Hard Mater., 2015, 50, 59–64 CrossRef CAS.
- X. Hu, C. M. Parish, K. Wang, T. Koyanagi, B. P. Eftink and Y. Katoh, Acta Mater., 2019, 165, 51–61 CrossRef CAS.
- M. J. Lloyd, R. G. Abernethy, M. R. Gilbert, I. Griffiths, P. A. J. Bagot, D. Nguyen-Manh, M. P. Moody and D. E. J. Armstrong, Scr. Mater., 2019, 173, 96–100 CrossRef CAS.
- M. J. Lloyd, R. G. Abernethy, D. E. J. Armstrong, P. A. J. Bagot, M. P. Moody, E. Martinez and D. Nguyen-Manh, Eur. Phys. J. B, 2019, 92, 241 CrossRef CAS.
- C. H. Huang, L. Gharaee, Y. Zhao, P. Erhart and J. Marian, Phys. Rev. B, 2017, 96, 094108 CrossRef.
- B. Cantor, I. T. H. Chang, P. Knight and A. J. B. Vincent, Mater. Sci. Eng., A, 2004, 375–377, 213–218 CrossRef.
- J. W. Yeh, S. K. Chen, S. J. Lin, J. Y. Gan, T. S. Chin, T. T. Shun, C. H. Tsau and S. Y. Chang, Adv. Eng. Mater., 2004, 6, 299–303 CrossRef CAS.
- Y. Zhang, T. T. Zou, Z. Tang, M. C. Gao, K. A. Dahmen, P. K. Liaw and Z. P. Lu, Prog. Mater. Sci., 2014, 61, 1–93 CrossRef CAS.
- E. J. Pickering and N. G. Jones, Int. Mater. Rev., 2016, 61, 183–202 CrossRef CAS.
- D. B. Miracle and O. N. Senkov, Acta Mater., 2017, 122, 448–511 CrossRef CAS.
- Z. Leong, J. S. Wróbel, S. L. Dudarev, R. Goodall, I. Todd and D. Nguyen-Manh, Sci. Rep., 2017, 7, 39803 CrossRef CAS.
- M. C. Gao, D. B. Miracle, D. Maurice, X. Yan, Y. Zhang and J. A. Hawk, J. Mater. Res., 2018, 33, 3138–3155 CrossRef CAS.
- E. P. George, W. A. Curtin and C. C. Tasan, Acta Mater., 2020, 188, 435–474 CrossRef CAS.
- L. Lilensten, J.-P. Couzinie, J. Bourgon, L. Perriere, G. Dirras, F. Prima and I. Guillot, Mater. Res. Lett., 2017, 5, 110–116 CrossRef CAS.
- G. Dirras, L. Lilensten, P. Djemia, M. Laurent-Brocq, D. Tingaud, J.-P. Couzinie, L. Perriere, T. Chauveau and I. Guillot, Mater. Sci. Eng., A, 2016, 654, 30–38 CrossRef CAS.
- O. N. Senkov, G. B. Wilks, J. M. Scott and D. B. Miracle, Intermetallics, 2011, 19, 698–706 CrossRef CAS.
- A. Fernández-Caballero, M. Fedorov, J. S. Wróbel, P. M. Mummery and D. Nguyen-Manh, Entropy, 2019, 21, 68 CrossRef.
- S. Gorsse, J.-P. Couzinie and D. B. Miracle, C. R. Phys., 2018, 19, 721–736 CrossRef CAS.
- D. Nguyen-Manh, V. Vitek and A. P. Horsfield, Prog. Mater. Sci., 2007, 55, 255–298 CrossRef.
- L. J. Santodonato, Y. Zhang, M. Feygenson, C. M. Parish, M. C. Gao, R. J. K. Weber, J. C. Neuefeind, Z. Tang and P. K. Liaw, Nat. Commun., 2015, 6, 5964 CrossRef.
- J. S. Wróbel, D. Nguyen-Manh, M. Y. Lavrentiev, M. Muzyk and S. L. Dudarev, Phys. Rev. B, 2015, 91, 024108 CrossRef.
- A. Fernández-Caballero, J. S. Wróbel, P. M. Mummery and D. Nguyen-Manh, J. Phase Equilib. Diffus., 2017, 38, 391–403 CrossRef.
- O. El-Atwani, N. Li, M. Li, A. Devaraj, J. K. S. Baldwin, M. M. Schneider, D. Sobieraj, J. S. Wróbel, D. Nguyen-Manh, S. A. Maloy and E. Martinez, Sci. Adv., 2019, 5, eaav2002 CrossRef CAS.
- Q.-J. Li, H. Sheng and E. Ma, Nat. Commun., 2019, 10, 3563 CrossRef.
- M. Fedorov, J. S. Wróbel, A. Fernández-Caballero, K. J. Kurzydłowski and D. Nguyen-Manh, Phys. Rev. B, 2020, 101, 174416 CrossRef CAS.
- S. N. Khan, J. B. Staunton and G. M. Stocks, Phys. Rev. B, 2016, 93, 054206 CrossRef.
- P. Singh, A. V. Smirnov and D. D. Johnson, Phys. Rev. B, 2016, 91, 224204 CrossRef.
- K. Jin, B. C. Sales, G. M. Stocks, G. D. Samolyuk, M. Daene, W. J. Weber, Y. Zhang and H. Bei, Sci. Rep., 2016, 6, 20159 CrossRef CAS.
- D. B. Miracle, G. B. Wilks, A. G. Dahlman and J. E. Dahlman, Acta Mater., 2011, 59, 7840–7854 CrossRef CAS.
- D. B. Miracle, Nat. Commun., 2019, 10, 7665 Search PubMed.
- O. A. Waseem and H. J. Ryu, Sci. Rep., 2017, 7, 1926 CrossRef.
- O. A. Waseem, J. Lee, H. M. Lee and H. J. Ryu, Mater. Chem. Phys., 2018, 210, 87–94 CrossRef CAS.
- T. Egami, M. Ojha, O. Khorgolkhuu, D. M. Nicholson and G. M. Stocks, JOM, 2015, 67, 2343–2349 CrossRef.
- C. Nui, C. R. LaRosa, J. Miao, M. J. Mills and M. Ghazisaeidi, Nat. Commun., 2018, 9, 1636 CrossRef.
- B. Gludovatz, A. Hohenwarter, K. V. S. Thurston, H. Bei, Z. Wu, E. P. George and R. O. Ritchie, Nat. Commun., 2016, 7, 10602 CrossRef CAS.
- T. M. Butler, K. J. Chaput, J. R. Dietrich and O. N. Senkov, J. Alloys Compd., 2017, 729, 1004–1019 CrossRef CAS.
- S.-q. Xia, Z. Wang, T.-f. Yang and Y. Zhang, J. Iron Steel. Res., 2015, 22, 879–885 CrossRef.
- N. A. P. Kiran Kumar, C. Li, K. J. Leonad, H. Bei and S. J. Zinkle, Acta Mater., 2016, 113, 230–244 CrossRef.
- I. Toda-Caraballo, J. S. Wróbel, D. Nguyen-Manh, P. Pérez and P. E. J. Rivera-Díaz-del-Castillo, JOM, 2017, 69, 2137–2149 CrossRef.
- M. C. Troparevsky, J. R. Morris, P. R. C. Kent, A. R. Lupini and G. M. Stocks, Phys. Rev. X, 2015, 5, 011041 Search PubMed.
- F. Granberg, K. Nordlund, M. W. Ullah, K. Jin, C. Lu, H. Bei, L. M. Wang, F. Djurabekova, W. J. Weber and Y. Zhang, Phys. Rev. Lett., 2016, 116, 135504 CrossRef CAS.
- F. Körmann, Y. Ikeda, B. Grabowski and M. H. F. Sluiter, npj Comput. Mater., 2017, 3, 36 CrossRef.
- M. Widom, J. Mater. Res., 2018, 33, 2881–2898 CrossRef CAS.
- S. Huang, F. Tian and L. Vitos, J. Mater. Res., 2018, 33, 2938–2953 CrossRef CAS.
- S. Mu, Z. Pei, X. Liu and G. M. Stocks, J. Mater. Res., 2018, 33, 2857–2880 CrossRef CAS.
- J. M. Rickman, H. M. Chan, M. P. Harmer, J. A. Smeltzer, C. J. Marvel, A. Roy and G. Balasubramanian, Nat. Commun., 2019, 10, 2618 CrossRef CAS.
- H. S. Oh, S. J. Kim, K. Odbadrakh, W. H. Ryu, K. N. Yoon, F. Körmann, Y. Ikeda, C. C. Tasan, D. Raabe, T. Egami, E. S. Park and S. Mu, Nat. Commun., 2019, 10, 2090 CrossRef.
- I. Toda-Caraballo, J. S. Wróbel, S. L. Dudarev, D. Nguyen-Manh and P. E. J. Rivera-Díaz-del-Castillo, Acta Mater., 2015, 97, 156–169 CrossRef CAS.
- D. L. Smith, H. M. Chung, B. A. Loomis and H. C. Tsai, J. Nucl. Mater., 1996, 233–277, 356–363 CrossRef.
- E. W. Collings and H. L. Gegel, Physics of Solid Solution Strengthening, Plenum Press, New York and London, 1975 Search PubMed.
- M. Tane, S. Akita, T. Nakano, K. Hagihara, Y. Umakoshi, M. Niinomi and H. Nakajima, Acta Mater., 2008, 56, 2856–2863 CrossRef CAS.
- M. R. Gilbert and J.-C. Sublet, Nucl. Fus., 2011, 51, 043005 CrossRef.
- M. R. Gilbert, S. L. Dudarev, D. Nguyen-Manh, S. Zheng, L. W. Packer and J. C. Sublet, J. Nucl. Mater., 2013, 442, S555–S760 CrossRef.
- G. Kresse and J. Furthmiiller, Phys. Rev. B, 1996, 54, 11169 CrossRef CAS.
- G. Kresse and J. Furthmiiller, Comput. Mater. Sci., 1996, 6, 15–50 CrossRef CAS.
- J. Hafner, J. Comput. Chem., 2008, 29, 2044–2078 CrossRef CAS.
- J. P. Perdew, K. Burke and M. Ernzerhof, Phys. Rev. Lett., 1997, 77, 3865 CrossRef.
- H. J. Monkhorst and J. D. Pack, Phys. Rev. B: Solid State, 1976, 13, 5188 CrossRef.
- J. M. Sanchez, F. Ducastelle and D. Gratias, Physica A, 1984, 128, 238–251 CrossRef.
- J. M. Sanchez, J. Phase Equilib. Diffus., 2017, 38, 238–251 CrossRef CAS.
- Q. Wu, B. He, T. Song, J. Gao and S. Shi, Comput. Mater. Sci., 2016, 125, 243–254 CrossRef.
- R. Chinnappan, B. K. Panigrahi and A. van de Walle, Calphad, 2016, 54, 125–133 CrossRef CAS.
- J. W. D. Connolly and A. R. Williams, Phys. Rev. B, 1983, 27, 5169 CrossRef CAS.
- A. van de Walle, M. Asta and G. Ceder, Calphad, 2002, 26, 539–553 CrossRef CAS.
- A. van de Walle and G. Ceder, J. Phase Equilibria, 2002, 23, 348 CrossRef CAS.
- D. de Fontaine, J. Appl. Crystallogr., 1971, 4, 15–19 CrossRef CAS.
- B. E. Warren, X-ray Diffraction, Dover, New York, 1990 Search PubMed.
- J. M. Cowley, Phys. Rev., 1950, 77, 669 CrossRef CAS.
- I. Mirebeau, M. Hennion and G. Parette, Phys. Rev. Lett., 1984, 53, 687–690 CrossRef CAS.
- M. Y. Lavrentiev, S. L. Dudarev and D. Nguyen-Manh, J. Nucl. Mater., 2009, 386–388, 22–25 CrossRef CAS.
- M. E. J. Newman and G. T. Barkema, Monte Carlo Methods in Statistical Physics, Clarendon Press, Oxford, 1999 Search PubMed.
- D. Nguyen-Manh, M. Y. Lavrentiev and S. L. Dudarev, J. Comput.-Aided Mater. Des., 2007, 14, 159–169 CrossRef CAS.
- D. Nguyen-Manh, M. Y. Lavrentiev and S. L. Dudarev, C. R. Phys., 2008, 9, 379–388 CrossRef CAS.
- S. C. Singhal and W. L. Worrell, Metall. Mater. Trans. B, 1973, 4, 895–898 CAS.
- G. L. W. Hart, V. Blum, M. J. Walorski and A. Zunger, Nat. Mater., 2005, 4, 391–394 CrossRef CAS.
- J. L. Murray, ASM International, Metals Park, OH, 1987, pp. 68–78 Search PubMed.
- X.-J. Yao, X.-F. Shi, Y.-P. Wang, G.-Y. Gan and B.-Y. Tang, Fusion Eng. Des., 2018, 137, 35–42 CrossRef CAS.
- L. Koch, F. Granberg, T. Brink, D. Utt, K. Albe, F. Djurabekova and K. Nordlund, J. Appl. Phys., 2017, 122, 105106 CrossRef.
Footnote |
| † Electronic supplementary information (ESI) available. See DOI: 10.1039/d0cp03764h |
| This journal is © the Owner Societies 2020 |

