
 Open Access Article
 This Open Access Article is licensed under a
 Creative Commons Attribution 3.0 Unported Licence
Quantum-assisted diamagnetic deflection of molecules†
Yaakov Y.
Fein
 ,
Armin
Shayeghi
,
Filip
Kiałka
,
Philipp
Geyer
,
Stefan
Gerlich
and
Markus
Arndt
*
,
Armin
Shayeghi
,
Filip
Kiałka
,
Philipp
Geyer
,
Stefan
Gerlich
and
Markus
Arndt
*
Faculty of Physics, University of Vienna, Vienna, Austria. E-mail: markus.arndt@univie.ac.at
First published on 22nd June 2020
Abstract
We measure the diamagnetic deflection of anthracene and adamantane in a long-baseline matter-wave interferometer. From the nanometer-level deflection we extract the magnetic susceptibilities of the molecules which we compare with calculations and previous results. Adamantane yields an isotropic average mass susceptibility of −8.0 ± 1.1 m3 kg−1, consistent with expectations, while anthracene yields a higher-than-anticipated value of −13.6 ± 1.3 m3 kg−1. We attribute the high anthracene value to the planar aromatic molecule's magnetic anisotropy and partial alignment in the molecular beam, and estimate the magnitude of the effect on the observed deflection.
Introduction
Beam deflection studies have been successfully employed in investigations of a wide range of properties,1–7 dating back to early atomic beam experiments.8–10 In classical beam deflectometry, an inhomogeneous electric or magnetic field is applied to an atomic or molecular beam in free flight and the resulting deflection and/or broadening of the beam profile encodes information about the corresponding electronic property. Deflection can also be used in other contexts, such as a means of state selection for aligning molecules11 or in the sorting of isomers.12,13 Deflectometry can be augmented by performing the measurements within a matter-wave interferometer, taking advantage of the improved spatial resolution afforded by interference fringes imprinted into the density of the beam. Quantum-assisted deflectometry has been used to probe permanent and induced electric dipole moments of a range of molecular species.14–19 The technique has recently been extended to probing magnetic properties,20 as illustrated by the diamagnetic deflection of alkaline earth atoms.21Observing the diamagnetic deflection in a beam deflection experiment is challenging due to the smallness of the effect and requires either very strong magnetic fields or excellent spatial resolution. We achieve the latter by introducing an inhomogeneous magnetic field within our long-baseline matter-wave interferometer which causes a shift of the interference fringes proportional to the molecules’ susceptibility. The fringes have a spatial period of 266 nm and can be monitored on the nanometer level, yielding a sensitivity to forces as small as 10−26 N. Monitoring the fringe deflection rather than a classical beam profile shift allows us to resolve the small diamagnetic deflection.
Beam deflectometry is an interesting technique for measuring susceptibilities because the beams are dilute, and particle properties can thus be studied in the absence of bulk phenomena or other interactions. Established techniques for measuring magnetic susceptibility,22 such as nuclear magnetic resonance, SQUID magnetometry, and the Faraday and Guoy scales, are typically only compatible with bulk samples. The relative sensitivity of these techniques can be better than 1%, while the fundamental sensitivity of our technique is limited by the phase sensitivity of the interferometer. Relative uncertainties as small as 1% were achieved in similar experiments measuring the electric polarizability of fullerenes in our setup.18 A similar sensitivity in quantum-assisted magnetic deflectometry experiments should be achievable with a stronger or tunable deflection magnet combined with slower molecular beams.
In this work we use quantum-assisted magnetic deflection to measure the diamagnetic susceptibility of two hydrocarbons, anthracene (C14H10) and adamantane (C10H16). To our knowledge this is the first demonstration of the magnetic deflection of a beam of diamagnetic molecules. In the case of anthracene, we measure a deflection significantly larger than would be expected from the calculated isotropic average susceptibility. Anthracene has a significant magnetic anisotropy, since a magnetic field perpendicular to the plane of the rings induces a stronger response than along any other axis. This may play a role in the deflection experiments since it has been shown that supersonic expansions of planar molecules prefer to align edge-on to the direction of travel,23,24 leading to an over-sampling of the high-susceptibility axis. A sensitivity to magnetic anisotropy is particularly intriguing, since it has been proposed as a measure of aromaticity,25 a hallmark of organic chemistry which still eludes a definitive quantitative definition.26 We rule out systematic error by benchmarking the technique with adamantane, a non-aromatic Td symmetric molecule, and obtain the expected isotropic value of the susceptibility.
Experimental details
The magnetic deflection experiments described here are conducted in the Long-baseline Universal Matter-wave Interferometer (LUMI).27 LUMI is a three-grating interferometer that relies on the Talbot–Lau effect, a near-field wave phenomenon that produces a periodic modulation in the density of a molecular beam behind a grating. In a symmetric configuration where the gratings are spaced by L and have equal periods d, the density modulation is a self-image of the second grating with periodicity d, as illustrated in Fig. 1. The first grating prepares transverse coherence of the matter wave such that diffraction occurs at the second grating. A third grating is employed as a transmission mask which is transversely scanned in front of an integrating detector to detect the sinusoidal modulation of the flux. To achieve high-contrast modulation for a given velocity class, the gratings should be separated by approximately an integer multiple of the Talbot length LT = d2/λdB, where λdB = h/mv is the de Broglie wavelength of the molecule, with m the molecular mass and v the longitudinal beam velocity. In these experiments the gratings are implemented by three nano-fabricated silicon nitride structures, which must be precisely aligned to each other28 and with respect to gravity29 to achieve maximal visibility of the sinusoidal visibility fringes.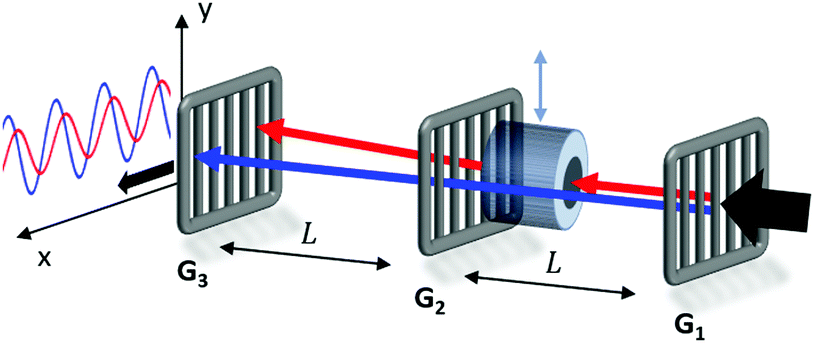 | ||
| Fig. 1 Experimental setup showing the three nano-fabricated gratings G1–G3 spaced by L = 0.98 m and the removable deflection magnet before G2. The beam enters from the right from a pulsed supersonic source and is detected by electron impact ionization, quadrupole mass selection, and ion counting. Reference measurements taken without the deflection magnet are shown in blue, while deflection measurements are shown in red. | ||
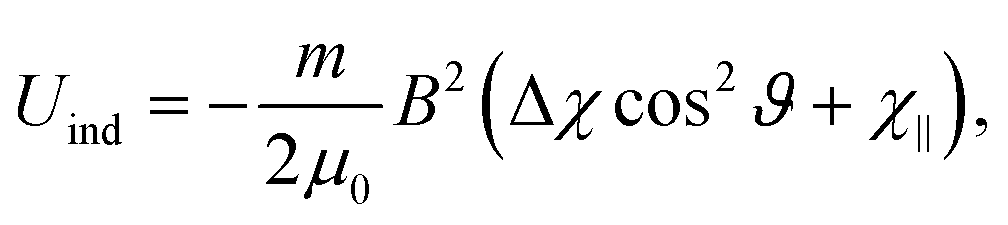
Magnetic deflection is performed in this interferometric setup by introducing a magnetic field which shifts the interference fringes by an amount proportional to the induced magnetic moment of the molecules. To achieve a near-constant transverse force that does not cause phase averaging of the fringes, we use a constant (B·∇)Bx produced by a modified Halbach array of permanent magnets.20,21 The force on an induced magnetic moment due to a (B·∇)Bx field is given by
 | (1) |
![[small chi, Greek, macron]](https://www.rsc.org/images/entities/i_char_e0d8.gif) in eqn (1) is valid for atoms21 or spherical top molecules with χ11 = χ22 = χ33, or even anisotropic molecules when all susceptibility tensor components are equally sampled during the deflection. The magnetic susceptibility can be extracted in a straightforward way from the fringe deflection, taking into account the finite slope of the (B·∇)Bx region and fringe fields.21
in eqn (1) is valid for atoms21 or spherical top molecules with χ11 = χ22 = χ33, or even anisotropic molecules when all susceptibility tensor components are equally sampled during the deflection. The magnetic susceptibility can be extracted in a straightforward way from the fringe deflection, taking into account the finite slope of the (B·∇)Bx region and fringe fields.21
The deflection magnet can be moved in and out of the beamline, allowing us to take reference phase measurements with no applied field. After traversing the interferometer, the molecules are ionized by electron bombardment and mass filtered in a quadrupole before counted by a conversion dynode and electron multiplier.
In these experiments, the molecular beams are produced by supersonic expansions from a heated Even–Lavie valve.30 We used nozzle diameters of 50–100 μm, and a skimmer and two differential pumping stages help in beam formation and gas-load management. Anthracene was seeded in helium at 0.8 bar,‡ with the valve held at 483 K, while adamantane was expanded in neon at 1.0 bar at 453 K. The time-of-flight spectrum of the beam was measured directly by triggering a fast counting card with the valve trigger pulse. The collected signal was gated to a temporal window centered around the pulse arrival, which reduced both the collected dark counts and the width of the velocity distribution (see ESI† for further details).
A significant experimental challenge for both the anthracene and adamantane measurements was a distinct loss of interference visibility and signal correlated with the repetition rate and pulse length of the supersonic pulses. We speculate that this is due to collisional decoherence31 from the co-propagating noble gas beam. Obtaining data with a high signal to noise ratio thus required a significant tradeoff between flux and visibility. To achieve this, moderate pulse lengths of 25.5 and 30 μs and repetition rates of 100 and 20 Hz were used for anthracene and adamantane respectively.
Computational details
Theoretical values for the susceptibility tensors of anthracene and adamantane were calculated at the PBE0/def2TZVPP level of theory32,33 using Gaussian 16,34 employing magnetic field dependent gauge-independent atomic orbitals.35 To determine any temperature dependence of the susceptibilities, values for the ground-state geometries were compared with values calculated for ten vibrationally excited geometries of each molecule. These geometries were determined by ab initio molecular dynamics simulations at the PBE0/def2SVP level of theory32,33 using NWChem.36 The molecular dynamics simulations were run in 1 fs time steps for approximately 100 ps while the temperature was controlled using a stochastic velocity rescaling thermostat.37 Anthracene was simulated at 500 K and adamantane at 450 K, approximately corresponding to the valve temperatures in the respective experiments. Some vibrational cooling can be expected during the expansion, so these temperatures represent an upper bound for the temperature dependence. The vibrationally-averaged susceptibility components agree with the ground-state geometry susceptibility values to better than 2%, indicating a weak temperature dependence.The calculated susceptibility values for anthracene and adamantane are summarized in Table 1, along with several previously calculated and measured values. The mass susceptibility tensor χ is given in the molecular fixed body frame, with χ11 corresponding to the long body axis and χ22 to the out-of-plane axis (![[x with combining circumflex]](https://www.rsc.org/images/entities/i_char_0078_0302.gif) b and ŷb in Fig. 2). The isotropic average susceptibility is defined as = tr(χ)/3.
b and ŷb in Fig. 2). The isotropic average susceptibility is defined as = tr(χ)/3.
| Molecule | χ calc.11 | χ calc.22 | χ calc.33 |
calc.
|
exp.
|
|---|---|---|---|---|---|
|
a This work.
b From ref. 38, with two different computational methods.
c From ref. 39, also with two different computational methods.
d As discussed in the main text, the experimental anthracene susceptibility is not exactly the isotropic value due to alignment effects.
|
|||||
| Anthracene | −5.1a | −18.3a | −4.7a | −9.4a | −13.6 ± 1.3d |
| −5.2b | −19.0b | −4.5b | −9.6b | −9.2c | |
| −5.7b | −18.7b | −5.0b | −9.8b | ||
| −9.1c | |||||
| −9.2c | |||||
| Adamantane | −8.8a | −8.8a | −8.9a | −8.9a | −8.0 ± 1.1a |
| −9.8c | — | ||||
| −8.7c | 8.7c | ||||
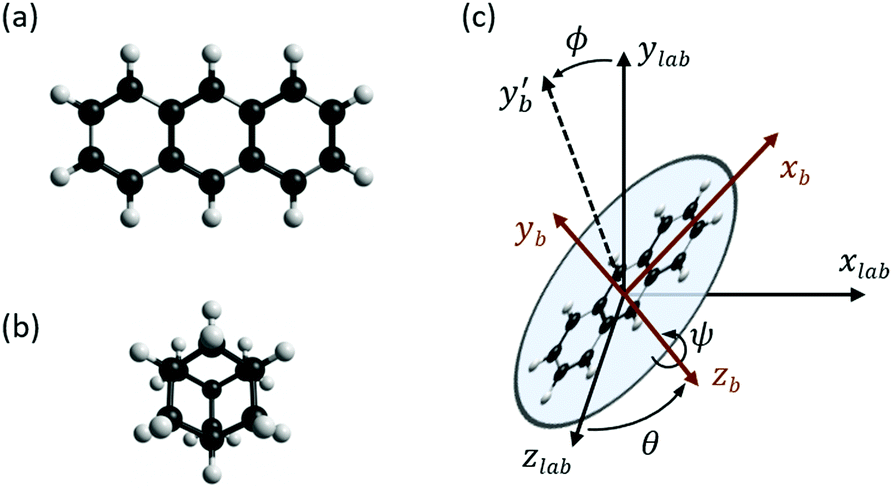 | ||
| Fig. 2 (a) Ground-state geometry of anthracene (C14H10). (b) Ground-state geometry of adamantane (C10H16). (c) Euler angles used for estimating the effect of supersonic alignment of anthracene. The ‘b’ subscripts denote body frame coordinates, and the yb′ axis is the intermediate body y axis. The anthracene molecular plane is in the x–z body plane with the long axis along b, and the three Euler angles ϕ, θ, ψ defined in the z–y–z convention. The molecular beam travels along ẑlab and the magnetic field points along lab. | ||
Our calculations indicate that the in-plane susceptibility components of anthracene have, on average, a 3.8 times smaller susceptibility than the out-of-plane component. The calculated susceptibility components agree well with previously calculated values,38 and the isotropic value also agrees well with the measured bulk literature value.39 Adamantane, on the other hand, yields a tensor with nearly equal components. Its calculated isotropic value also agrees well with both previous theory and bulk experimental values.39 The isotropic average mass susceptibilities of anthracene and adamantane are expected to be similar, which makes adamantane an ideal benchmark system for the anthracene measurements.
Results and discussion
Deflection measurements
Interference and deflection results for anthracene and adamantane are shown in Fig. 3, with the extracted susceptibilities given in Table 1. The mean measured deflection of 14.9 ± 1.4 nm for anthracene implies a susceptibility of −13.6 ± 1.3 m3 kg−1, nearly 50% higher than the calculated isotropic value. The deflection uncertainty is the standard error of the means of the measured reference and deflection phases added in quadrature, which also dominates the susceptibility uncertainty. We attribute the high anthracene value to a partial alignment of the molecular beam with respect to the magnetic field, as described in the following sections.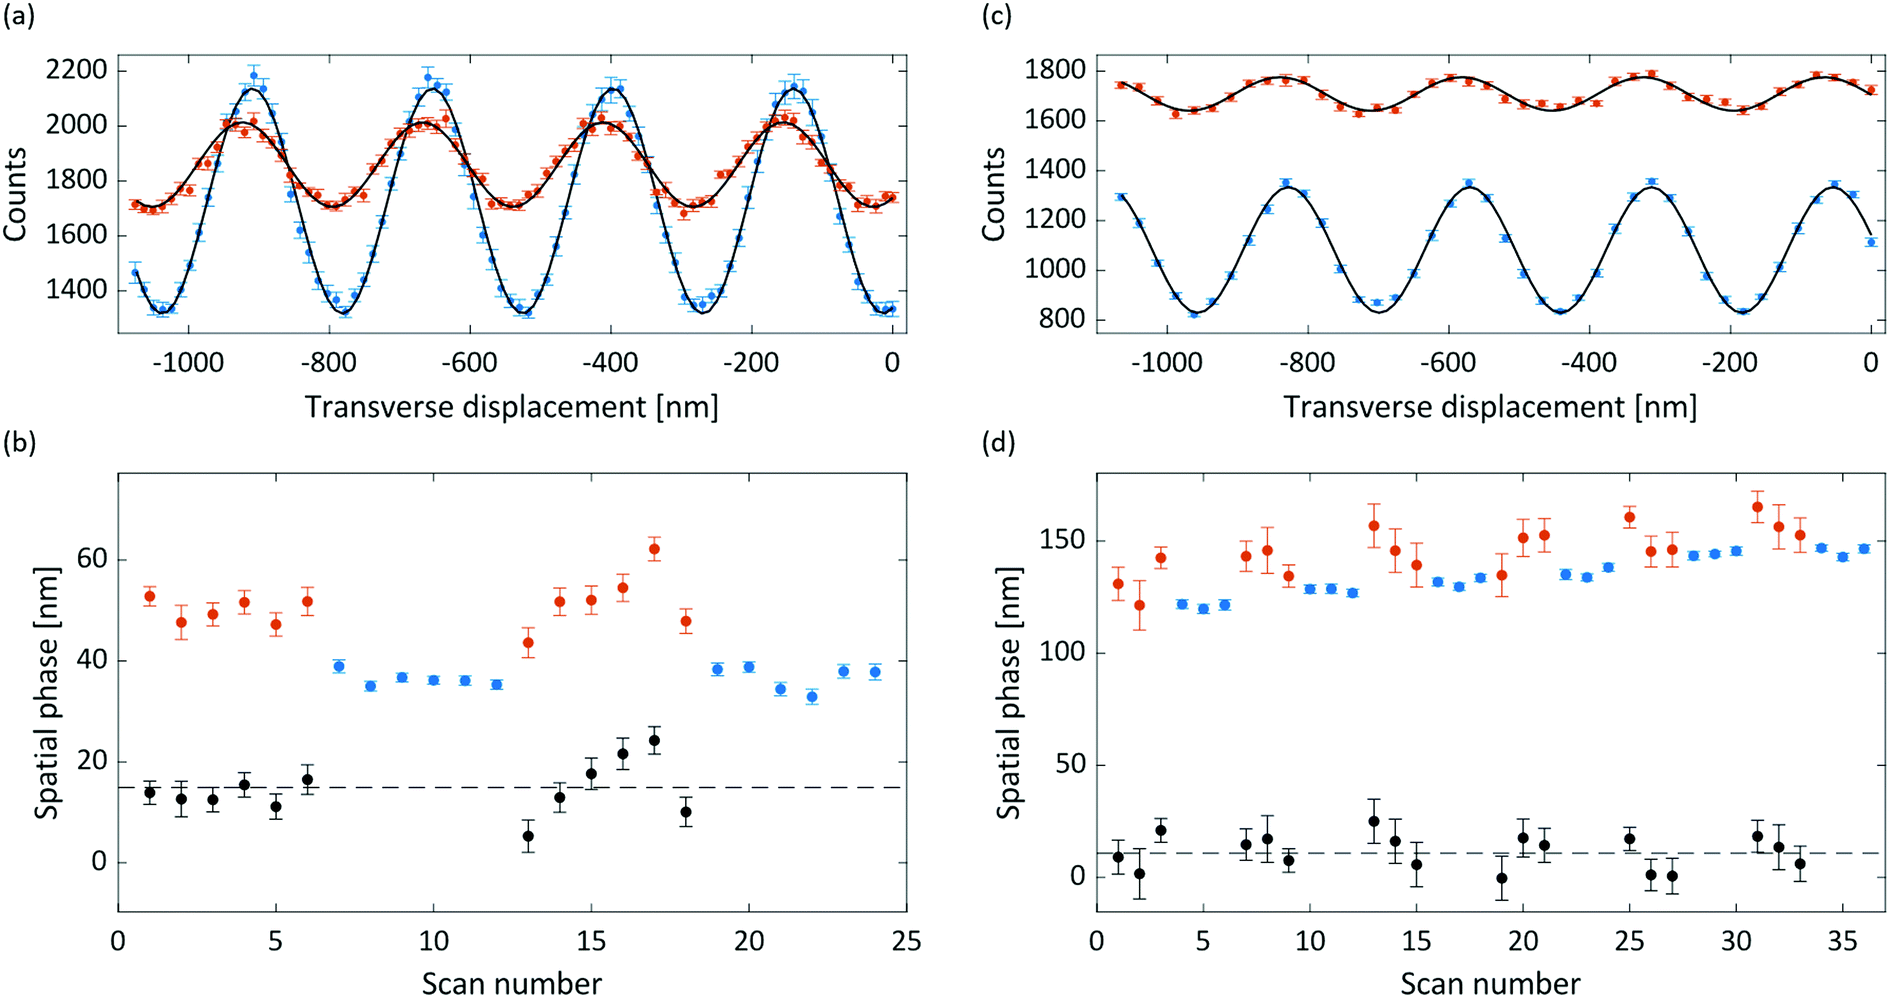 | ||
| Fig. 3 (a) Deflection of anthracene, with reference data in blue and deflected data in red. Each point represents the average of 12 runs, with the error bars the standard error of the mean. The reference data was integrated for 1 second per position step, and the deflection data for 2 seconds, which accounts for the different baselines. Data is shown with a dark rate of 200 counts per s subtracted, with sine fits shown in black. (b) The extracted phase of the individual runs, in the sequence they were measured. Blue is reference data, red is deflection data, and black is the pairwise difference of each set of deflection data with the subsequent reference data points. The dashed black line is the inverse squared error weighted mean of the difference, and error bars correspond to 68% confidence intervals of the fitted phases. (c) As in (a), for adamantane, showing the average of 18 runs. The reference data was integrated for 1 second and the deflection data for 3 seconds, which accounts for the different baselines. A 15 counts per s dark rate has been subtracted. (d) As in (b), for adamantane. | ||
The measured deflection of 14.8 ± 1.9 nm for adamantane yields a susceptibility of −8.0 ± 1.1 m3 kg−1. The extracted susceptibility is consistent with the calculated isotopic value, as expected for a molecule with equal susceptibility tensor components. The phase drift visible in Fig. 3(d) amounts to a rate of about 0.4 nm min−1, which we attribute to a small grating instability. It is corrected for in the data analysis, as described in the ESI.†
Both the anthracene and adamantane data show a marked decrease of interference visibility upon insertion of the deflection magnet. We attribute this to a combination of inhomogeneity in the (B·∇)Bx field, velocity averaging of the non-monochromatic beam, and the presence of permanent magnetic moments (discussed below). This visibility reduction, together with the reduction in flux due to the magnet delimiters, necessitated longer integration times for the deflection measurements than for the reference measurements.
Alignment mechanisms
Planar aromatic molecules like anthracene typically feature a non-zero magnetic anisotropy25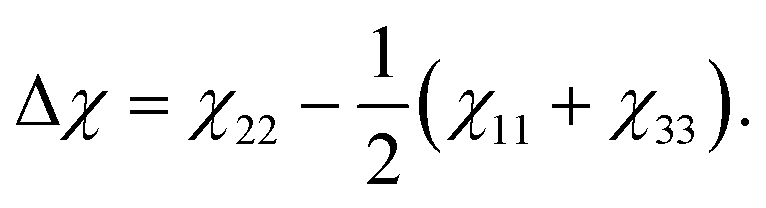 | (2) |
If the molecules are preferentially aligned with their high-susceptibility axis (χ22) parallel to the transverse magnetic field as they traverse the deflection region, then the measured deflection will be larger than for an isotropic molecule with the same . Molecular beam alignment, typically by means of electric or optical fields, is a well-established field of research.40 Here we expect the primary source of alignment in our setup to be the supersonic expansion itself, but we briefly discuss the effect of the magnetic field region. Other potential alignment mechanisms are discussed in the ESI.†
The influence of this alignment on the deflection can be estimated by performing an angular average of the susceptibility tensor that is restricted to the angular space available to edge-aligned molecules. This is conveniently performed by transforming the susceptibility tensor from the fixed body frame to a lab frame and averaging over the Euler angles as defined in Fig. 2. The molecular plane is in the x–z body plane such that the high-susceptibility component is along ŷb, the molecular beam travels along ẑlab, and B = Blab. Averaging over ϕ and θ while keeping ψ = 0 yields for the average susceptibility tensor in the lab frame
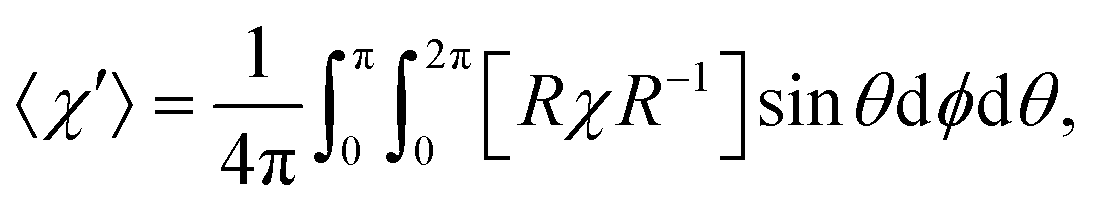 | (3) |
in eqn (1), as this is the averaged susceptibility component in the direction of B.
Numerically solving the integral with the computed susceptibility components yields 〈χ′〉11 = 1.23, which would yield a 23% higher deflection compared to the isotropic case. This value can be taken as an upper bound for the degree of enhancement since it assumes 100% edge-on alignment. Expansion of benzene under similar source conditions as in our experiments demonstrated about 80% population of edge-on modes,24 in which a “frisbee” propensity function is used to quantify the level of edge-on alignment. A similarly high level of alignment could reasonably be expected in our system. Supersonic edge-on alignment could thus explain the bulk of the observed enhancement in the anthracene deflection when the error bars are considered.
 | (4) |
In principle there is also a contribution to the potential due to rotational magnetic moments,48 −μrot·B. There are a range of moments corresponding to the range of rotational states occupied at a given rotational temperature, which will tend to compete rather than contribute to a single alignment direction. Additionally, as with the induced moment term, this potential is several orders of magnitude away from the rotational energy, and thus should not play a significant role in alignment. Although unlikely to contribute to alignment, rotational moments, together with 13C nuclear spins, are sufficient in magnitude to contribute to a reduction in interference visibility.21
Conclusions
Quantum-assisted magnetic deflectometry is a new technique for studying magnetic properties of isolated molecules. Here we demonstrate the diamagnetic deflection of molecular beams of anthracene and adamantane. The enhanced deflection of anthracene is consistent with a partial alignment of the molecular beam due to supersonic expansion coupled with anthracene's magnetic anisotropy. This is further corroborated by observing the expected isotropic deflection for adamantane. It may be interesting to study the scaling of such alignment effects in other acenes, such as tetracene and pentacene, or in clusters of anthracene, beams of which are readily produced with an Even–Lavie valve.49 The scheme can also be extended to probe conformational and electronic changes in molecules, for example by employing a tunable magnetic field gradient to detect the excitation of triplet states, or measuring susceptibility changes induced by photo-switching.Conflicts of interest
There are no conflicts to declare.Acknowledgements
We would like to acknowledge useful discussions with Benjamin Stickler and Denis Sabirov. This project has received funding from the European Research Council (ERC, Grant No. 320694) under the European Union's Horizon 2020 Research and Innovation Program (Grant No. 320694), and the Austrian Science Fund (FWF) within programs P-30176 and W-1210-N25. The computational results presented were obtained using the Vienna Scientific Cluster (VSC) within Grant No. 70918. A. S. acknowledges funding by the FWF within the Lise-Meitner Grant No. M 2364.References
- K. Bonin and V. Kresin, Electric-Dipole Polarizabilities of Atoms, Molecules and Clusters, World Scientific, 1997 Search PubMed.
- S. Heiles and R. Schäfer, Dielectric Properties of Isolated Clusters: Beam Deflection Studies, Springer, Heidelberg, 2014 Search PubMed.
- I. Billas, J. Magn. Magn. Mater., 1997, 168, 64–84 CrossRef CAS.
- D. Gerion, A. Hirt, I. M. L. Billas, A. Châtelain and W. A. de Heer, Phys. Rev. B: Condens. Matter Mater. Phys., 2000, 62, 7491–7501 CrossRef CAS.
- P. Dugourd, I. Compagnon, F. Lepine, R. Antoine, D. Rayane and M. Broyer, Chem. Phys. Lett., 2001, 336, 511–517 CrossRef CAS.
- U. Rohrmann and R. Schafer, Phys. Rev. Lett., 2013, 111, 133401 CrossRef PubMed.
- D. Cox, D. Trevor, R. Whetten, E. Rohlfing and A. Kaldor, J. Chem. Phys., 1986, 84, 4651–4656 CrossRef CAS.
- W. Gerlach and O. Stern, Z. Phys., 1922, 8, 110–111 CrossRef.
- H. Scheffers and J. Stark, Phys. Z., 1934, 35, 625–627 CAS.
- I. Estermann and O. Stern, Nature, 1934, 133, 911 CrossRef.
- L. Holmegaard, J. H. Nielsen, I. Nevo, H. Stapelfeldt, F. Filsinger, J. Küpper and G. Meijer, Phys. Rev. Lett., 2009, 102, 023001 CrossRef PubMed.
- F. Filsinger, J. Kupper, G. Meijer, J. L. Hansen, J. Maurer, J. H. Nielsen, L. Holmegaard and H. Stapelfeldt, Angew. Chem., Int. Ed., 2009, 48, 6900–6902 CrossRef CAS PubMed.
- J. Tüxen, S. Gerlich, S. Eibenberger, M. Arndt and M. Mayor, Chem. Commun., 2010, 46, 4145–4147 RSC.
- M. Berninger, A. Stefanov, S. Deachapunya and M. Arndt, Phys. Rev. A: At., Mol., Opt. Phys., 2007, 76, 013607 CrossRef.
- M. Gring, et al. , Phys. Rev. A: At., Mol., Opt. Phys., 2010, 81, 031604(R) CrossRef.
- L. Mairhofer, S. Eibenberger, J. P. Cotter, M. Romirer, A. Shayeghi and M. Arndt, Angew. Chem., Int. Ed., 2017, 56, 10947–10951 CrossRef CAS PubMed.
- S. Eibenberger, S. Gerlich, M. Arndt, J. Tüxen and M. Mayor, New J. Phys., 2011, 13, 043033 CrossRef.
- Y. Y. Fein, P. Geyer, F. Kiałka, S. Gerlich and M. Arndt, Phys. Rev. Res., 2019, 1, 033158 CrossRef.
- F. Buyvol-Kot, A. Kalinin, O. Kornilov, J. P. Toennies and J. A. Becker, Solid State Commun., 2005, 135, 532–537 CrossRef CAS.
- L. Mairhofer, S. Eibenberger, A. Shayeghi and M. Arndt, Entropy, 2018, 20, 516 CrossRef.
- Y. Y. Fein, A. Shayeghi, L. Mairhofer, F. Kiałka, P. Rieser, P. Geyer, S. Gerlich and M. Arndt, Phys. Rev. X, 2020, 10, 011014 CAS.
- P. Marcon and K. Ostanina, Progress in Electromagnetics Research Symposium, 2012.
- F. Pirani, D. Cappelletti, M. Bartolomei, V. Aquilanti, M. Scotoni, M. Vescovi, D. Ascenzi and D. Bassi, Phys. Rev. Lett., 2001, 86, 5035–5038 CrossRef CAS PubMed.
- F. Pirani, M. Bartolomei, V. Aquilanti, M. Scotoni, M. Vescovi, D. Ascenzi, D. Bassi and D. Cappelletti, J. Chem. Phys., 2003, 119, 265–276 CrossRef CAS.
- W. H. Flygare, Chem. Rev., 1974, 74, 653–687 CrossRef CAS.
- J. A. N. F. Gomes and R. B. Mallion, Chem. Rev., 2001, 101, 1349–1383 CrossRef CAS PubMed.
- Y. Y. Fein, P. Geyer, P. Zwick, F. Kiałka, S. Pedalino, M. Mayor, S. Gerlich and M. Arndt, Nat. Phys., 2019, 15, 1242–1245 Search PubMed.
- K. Hornberger, S. Gerlich, H. Ulbricht, L. Hackermüller, S. Nimmrichter, I. Goldt, O. Boltalina and M. Arndt, New J. Phys., 2009, 11, 043032 CrossRef.
- Y. Y. Fein, F. Kiałka, P. Geyer, S. Gerlich and M. Arndt, New J. Phys., 2020, 22, 033013 CrossRef.
- U. Even, EPJ Tech. Instrum., 2015, 2, 17 CrossRef.
- K. Hornberger, S. Uttenthaler, B. Brezger, L. Hackermüller, M. Arndt and A. Zeilinger, Phys. Rev. Lett., 2003, 90, 160401 CrossRef PubMed.
- C. Adamo and V. Barone, J. Chem. Phys., 1999, 110, 6158–6170 CrossRef CAS.
- F. Weigend and R. Ahlrichs, Phys. Chem. Chem. Phys., 2005, 7, 3297–3305 RSC.
- M. J. Frisch, et al., Gaussian 16, Rev. C.01, 2016 Search PubMed.
- J. R. Cheeseman, G. W. Trucks, T. A. Keith and M. J. Frisch, J. Chem. Phys., 1996, 104, 5497–5509 CrossRef CAS.
- M. Valiev, et al. , Comput. Phys. Commun., 2010, 181, 1477–1489 CrossRef CAS.
- G. Bussi, D. Donadio and M. Parrinello, J. Chem. Phys., 2007, 126, 014101 CrossRef PubMed.
- A. Ligabue, U. Pincelli, P. Lazzeretti and R. Zanasi, J. Am. Chem. Soc., 1999, 121, 5513–5518 CrossRef CAS.
- M. Kumar and R. Gupta, Diamagnetic Susceptibility of Organic Compounds, Oils, Paraffins and Polyethylenes, Springer-Verlag, Berlin Heidelberg, 2008 Search PubMed.
- C. Vallance, Phys. Chem. Chem. Phys., 2011, 13, 14427–14441 RSC.
- M. P. Sinha, C. D. Caldwell and R. N. Zare, J. Chem. Phys., 1974, 61, 491–503 CrossRef CAS.
- D. P. Pullman, B. Friedrich and D. R. Herschbach, J. Chem. Phys., 1990, 93, 3224–3236 CrossRef CAS.
- V. Aquilanti, D. Ascenzi, D. Cappelletti and F. Pirani, J. Phys. Chem., 1995, 99, 13620–13626 CrossRef CAS.
- S. S. Andrews, J. Chem. Educ., 2004, 81, 877 CrossRef CAS.
- E. Gershnabel and I. S. Averbukh, J. Chem. Phys., 2011, 134, 054304 CrossRef CAS PubMed.
- U. Even, J. Jortner, D. Noy, N. Lavie and C. Cossart-Magos, J. Chem. Phys., 2000, 112, 8068–8071 CrossRef CAS.
- V. Kumarappan, C. Z. Bisgaard, S. S. Viftrup, L. Holmegaard and H. Stapelfeldt, J. Chem. Phys., 2006, 125, 194309 CrossRef PubMed.
- J. R. Eshbach and M. W. P. Strandberg, Phys. Rev., 1952, 85, 24–34 CrossRef CAS.
- P. Haslinger, N. Dörre, P. Geyer, J. Rodewald, S. Nimmrichter and M. Arndt, Nat. Phys., 2013, 9, 144–148 Search PubMed.
Footnotes |
| † Electronic supplementary information (ESI) available. See DOI: 10.1039/d0cp02211j |
| ‡ Relative to vacuum, i.e. 0.2 bar below atmospheric pressure. |
| This journal is © the Owner Societies 2020 |