 Open Access Article
Creative Commons Attribution 3.0 Unported Licence
Unraveling the mechanism of biomimetic hydrogen fuel production – a first principles molecular dynamics study†
Rakesh C.
Puthenkalathil
a,
Mihajlo
Etinski
 b and
Bernd
Ensing
 *a
*a
aVan't Hoff Institute for Molecular Sciences, and Amsterdam Center for Multiscale Modeling, University of Amsterdam, Science Park 904, 1098 XH Amsterdam, The Netherlands. E-mail: b.ensing@uva.nl
bFaculty of Physical Chemistry, University of Belgrade, Studentski trg 12-16, 11000 Belgrade, Serbia
First published on 10th March 2020
Abstract
The Fe2(bdt)(CO)6 [bdt = benzenedithiolato] complex, a synthetic mimic of the [FeFe] hydrogenase enzyme can electrochemically convert protons into molecular hydrogen. Molecular understanding of the cascade of reaction steps is important for the design of more efficient catalysts. In this study, we investigate the reaction mechanism of the hydrogen production catalysis in explicit solution of acetonitrile using first principles molecular dynamics simulations. We have characterized all reduction and protonation intermediates taking part in the catalytic cycle. Free energy surfaces of the activated reaction steps are calculated using metadynamics. We find that the second protonation leading to molecular hydrogen formation is the rate limiting step. Direct protonation of the bridging hydride by a proton from the solution to form H2 is the most favorable reaction pathway. However, also a bdt sulfur atom can become protonated, leading to a possible proton trap state that reduces the catalytic efficiency. Our calculations validate the ECEC mechanism proposed using cyclic voltammetry.
1 Introduction
Molecular hydrogen is a promising alternative source of sustainable energy1 and the development of inexpensive catalysts for hydrogen fuel production is therefore a research topic of paramount importance. A particularly interesting route to developing efficient catalysts using earth abundant metals is inspired by enzymes that catalyse hydrogen formation. Hydrogenases form a class of enzymes found in nature, which can reduce protons to form molecular hydrogen.2 Hydrogenases are classified into three main categories based on the metal content in the enzyme:3 [NiFe] hydrogenase, [FeFe] hydrogenase and Fe hydrogenase. Diiron hydrogenase is considered to be the most active enzyme for proton reduction with a turnover frequency of the order of ∼10![[thin space (1/6-em)]](https://www.rsc.org/images/entities/char_2009.gif) 000 s−1.4 The active part of the enzyme is called the H-cluster (see Fig. 1). The H-cluster consists of a Fe2S2 unit linked to a Fe4S4 cubane cluster via a cysteine.3 The Fe2S2 group contains CO and CN ligands and the two S atoms of Fe2S2 unit are coordinated by an azadithiolato ligand.
000 s−1.4 The active part of the enzyme is called the H-cluster (see Fig. 1). The H-cluster consists of a Fe2S2 unit linked to a Fe4S4 cubane cluster via a cysteine.3 The Fe2S2 group contains CO and CN ligands and the two S atoms of Fe2S2 unit are coordinated by an azadithiolato ligand.
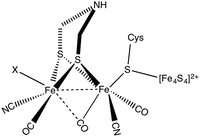 | ||
| Fig. 1 Chemical structure of the H-cluster, which is the active site of the [FeFe] hydrogenase enzyme. | ||
A large variety of structural and functional mimics of [FeFe] hydrogenase have been synthesized,5 of which the majority fall in one of the following three classes: those with an aromatic bridging ligand (e.g. benzenedithiolato (bdt)),6–11 with an alkylic bridging ligand (e.g. ethanedithiolato (edt) and propanedithiolato (pdt))12–14 and those with a bridging azodithiolato (adt) ligand15–18 (see Fig. 2). Catalysts with the aromatic bridgeheads are particularly interesting because they can undergo a reversible two-electron reduction at an electrode potential of −1.3 V (vs. the Fc+/Fc0 electrode). This is 0.37 V more than that of the aliphatic (pdt) bridgehead ligand, which undergoes an irreversible reduction at −1.67 V. The two-electron reduced intermediate has a pKa less than 23 and can be protonated using weak acids. Derivatives of complex 1 have been used on electrodes for the hydrogen evolution reaction. The reaction proceeds through a bridging hydride intermediate of the diiron catalyst, which is different from that of the natural hydrogenase enzyme, in which the reaction intermediate is a terminal hydride. It is speculated that this difference in the reaction pathway could be the reason for the lower activity of the synthetic mimics.19
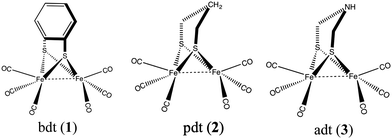 | ||
| Fig. 2 Most common hydrogenase structural mimics with bridging ligands (1) benzenedithiolato, (2) propanedithiolato, and (3) azodithiolato. | ||
More complex ligands (instead of CO) have been used in the synthesis of mimics over the last decade, which led to improvement of the catalytic activity,20 however still none of them are as active as the natural enzymes. In addition, design of a diiron hydrogenase inspired catalyst that is soluble and stable in water solvent is particularly challenging and a topic of intense research. A detailed understanding of the mechanism of proton reduction is crucial for improving the performance of synthetic catalysts.
Computational methods have been used to study the mechanism of [FeFe] hydrogenase enzyme and mimics.6,21–26 This includes optimising the structures of possible intermediates taking part in the reaction cycle and calculating their reduction potentials and acidities. Most of these studies aimed at unraveling the catalytic mechanism of the catalyst or the enzyme are performed either at the density functional theory (DFT) level of theory augmented with the COSMO implicit solvation model,26,27 or using classical molecular dynamics25 or a hybrid quantum chemical/forcefield (i.e. QM/MM) approach.28 While recent studies have provided interesting insights into the catalytic cycle of the diiron complex 1,6,26 we still lack a complete understanding of the reaction mechanism and the redox properties of the intermediates.
Fig. 3 depicts the proposed reaction mechanism for proton reduction, catalysed by compound 1. Cyclic voltammetry and computational studies confirm that 1 undergoes a two electron reduction to form 12−. The protonation of 12− will yield 1H− and further reduction of the 1H− intermediate results in hydrogen evolution in the presence of an acid with pKa < 23.6
In our present work, we performed an extensive theoretical study using first principles molecular dynamics simulations of complex 1 explicitly solvated in acetonitrile. The geometries and electronic structures of all the different intermediates in the proposed reaction mechanism are discussed. Energy barriers for protonation and hydrogen formation are calculated using the metadynamics enhanced sampling method.29,30 Prediction of formal (integer valued) oxidation states from the quantum chemical calculations is not straightforward.31 Population analyses32–34 can give useful information about the charge distribution in the complex, however the computed partial charges generally do not provide a clear insight into the formal oxidation state of metal centers or larger complexes. Instead here, we determine the oxidation states using so-called maximally localized Wannier functions.35,36 This approach provides a clear understanding of the reaction mechanism, including the free energy barriers of the important reaction steps and the oxidation states of the intermediates.
2 Methods
All DFT-MD simulations were carried out using the mixed Gaussian and plane wave method as implemented in the CP2K package.37 We used the PBE exchange correlation functional38 augmented with Grimme's D339 dispersion correction and the DZVP-MOLOPT40 Gaussian basis set with a plane wave cut off of 300 Ry. GTH-type pseudo potentials41,42 were used to represent the valence-core interactions.The molecular system contained complex 1 solvated in 40 acetonitrile molecules in a cubic supercell with a length of 16.2163 Å subject to periodic boundary conditions. The density was determined from a classical molecular dynamics simulation in the NPT ensemble. All following DFT-MD simulations were performed in the NVT ensemble with a CSVR43 thermostat with a time constant of 50 fs maintaining an average temperature of 298.15 K. All DFT-MD simulations of reaction intermediates of complex 1 were carried out in the electronic low-spin state, which we established to be the ground-state with DFT geometry optimisation calculations (see Fig. 1 and Tables S1–S6 in the ESI† for details). A DFT optimised neutral structure was solvated in acetonitrile solvent and equilibrated with DFT-MD. After the equilibration run, electrons and protons were subsequently added to the system to create the relevant catalysis intermediates. DFT-MD simulations were carried out for 7 ps for each of the intermediates described in the Results section, of which the first 2 ps were used for equilibration.
Wannier center analysis44 as implemented in CP2K was used to track the changes in the oxidation states. An electron counting technique was used to assign the oxidation state, as follows.45–47 For a closed shell calculation, each Wannier center corresponds to two electrons. If the Wannier center is either inside the atom or very close to one of the atoms in a covalent bond, we assign the Wannier center to that atom. If the Wannier center is at the middle of a covalent bond, we assign one electron to each of the atoms. For an open shell system, the same scheme is used but with each Wannier center corresponding to only one electron.
Metadynamics as implemented in PLUMED48 was used for the free energy calculations of the protonation reactions. We used Gaussian potentials with a height of 0.5 kJ mol−1 and widths of 0.1 Å, with a deposit interval of 50 fs. Avogadro49 was used for setting up the initial structures. The VMD50 tool was used for visualisation.
3 Results and discussions
Below, we will discuss first the characterisation of the different intermediates taking part in the reaction mechanism shown in Fig. 3, including the calculation of the formal oxidation states. In the following section, we present the first protonation reaction step and the calculation of the pKa. The final section presents the energy barriers for the hydrogen formation.3.1 Characterisation of compound 1 in different oxidation and protonation states in acetonitrile solution
Each of the six reactant, intermediate, and product species occurring in the catalytic cycle starting from compound 1, shown in Fig. 3, was simulated and characterized in an equilibrium NVT DFT-MD simulation at T = 298.15 K. Representative snapshots of the diiron complexes from these simulations are shown in Fig. 4 for the unprotonated species and in Fig. 5 for the protonated complexes.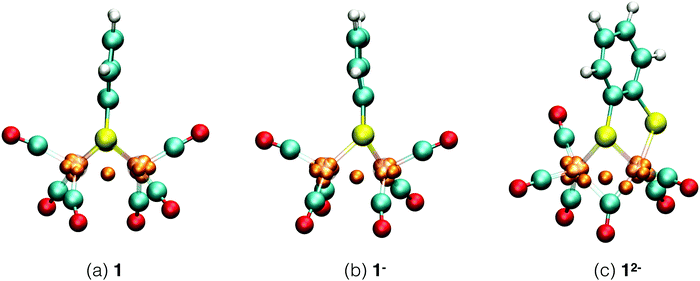 | ||
| Fig. 4 Simulation snapshots of Fe2(bdt)(CO)6 in acetonitrile solution in the fully oxidized (a), singly reduced (b), and doubly reduced (c) states. Solvent molecules are omitted for clarity. Color scheme: Fe atoms are transparant purple, S yellow, C cyan, O red, H white, and Wannier centers are orange. In the closed-shell systems, 1 and 12−, each Wannier center represents two electrons. In the open-shell system, 1−, the one-electron spin-up centers are shown; a figure of the down-spin centers is provided in the ESI.† | ||
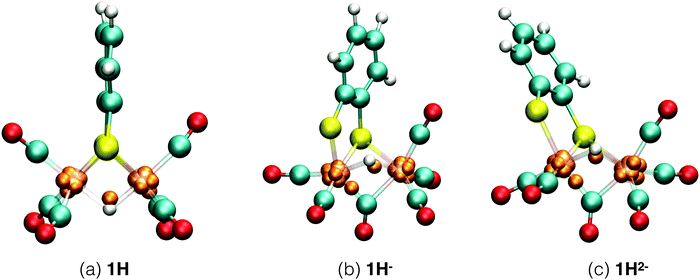 | ||
| Fig. 5 Simulation snapshots of protonated Fe2(bdt)(CO)6 in acetonitrile solution in the fully oxidized (a), singly reduced (b), and doubly reduced (c) states. Solvent molecules are omitted for clarity. In the closed-shell system, 1H−, each Wannier center represents two electrons. In the open-shell systems, 1H and 1H2−, the one-electron spin-up centers are shown; the figures of the down-spin centers are provided in the ESI.† | ||
Starting from the neutral complex in Fig. 4a, the complex maintains its highly symmetric structure, known from static DFT geometry optimisations, throughout the simulation. The complex appears particularly stable, with none of the four Fe–S bonds showing elongated vibrations and all CO groups remaining in terminal positions, rather than a bridging configuration. Average bond lengths and angles are in agreement with crystallographic data. We use the Wannier center analysis to obtain formal charges and oxidation states of the ligands and iron centers. In Fig. 4, the Wannier centers that contribute to the electron count of the iron ions are shown as orange balls. In the neutral complex, seven Wannier centers are located at each iron and one Wannier center is seen in the middle between the irons. For this closed shell calculation, each Wannier center represents two electrons, and the iron core pseudo-potential has a positive charge of 16, so that the formal oxidation state of each iron is +1. The two sulfur atoms each have a formal charge of −1 and the carbonyl ligands are neutral. This Wannier center analysis assignment is in agreement with experimental results.51–54
Reduction of 1 is a two electron reduction process and the 1− intermediate reduces instantaneously further to 12−, which makes it difficult to characterise the singly reduced species experimentally. One electron reduction of complex 1 changes the geometry of the complex. A detailed study of this intermediate11 shows all the CO ligands in terminal positions and an elongated Fe–S bond. A previous computational study6 suggested a bridging CO ligand for this intermediate. The energy difference between the two isomers is about 3 kJ mol−1.11Fig. 4b shows the structure of the 1− intermediate in acetonitrile solution taken from our DFT-MD simulation. We observe that Fe–S bond cleavage occurs instantaneously after the first one electron reduction. All CO groups remain in terminal positions during the simulation, in agreement with experimental observations.11 Since this is now an open shell calculation (the spin multiplicity of the complex is 2), one Wannier center represents one electron. The number of Wannier centers for the two Fe atoms are 8 and 7 respectively in the spin up configuration, and 7 and 7 for the spin down configuration. There is one Wannier center in the middle of the two Fe atoms for each spin; we assign one electron to each Fe center. This yields a total of 16 and 15 electrons respectively and the calculated oxidation states are thus 0 and +1. This again matches very well with experiments.51–53
The second reduction gives the 12− intermediate, which is seen to deform even further from the symmetric initial neutral complex as seen in Fig. 4c. In the simulation, Fe–S bond breaking and simultaneous rearrangement of a terminal carbonyl group to the bridging position takes place instantaneously. After this initial reconstruction, the structure remains stable throughout the remainder of the simulation. The Wannier center analysis shows eight centers (representing 2 electrons each) at each Fe atom. The calculated oxidation state of the two Fe atoms is therefore 0.
The 1H complex is formed when the 1− intermediate is protonated by the presence of an acid with a pKa ≤ 12.7. Mirmohades et al.11 characterized 1H experimentally and our simulation results are in agreement with their study. 1H has a symmetric structure similar to 1, where the Fe–S bonds are intact and all the CO ligands are at terminal positions. The hydride is at a bridging position in between the two iron atoms, as shown in Fig. 5a. The oxidation state is calculated as HFeII–FeI. There is one Wannier center located at the H atom at each spin state making a total of two electrons at the hydrogen, which yields a formal charge of 1− for the hydrogen, a clear confirmation of the bridging hydride species. Second protonation of this intermediate is only favorable at a lower pH and the pathway toward molecular hydrogen formation is through further reduction of this intermediate to the more active HFeI–FeI complex.53
For the protonated doubly reduced complex, 1H−, we characterise the two most favorable isomers: a bridging hydride intermediate and a sulfur protonated intermediate. The geometry of the 1H− bridging hydride intermediate is shown in Fig. 5b. Note that it has both a bridging carbonyl ligand and a bridging hydride. The formal charge of each the two Fe ions is +1 according to our Wannier center analysis. The HFeI–FeI intermediate is postulated to be an important intermediate in the catalytic cycle.51–53
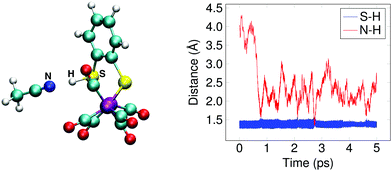
The doubly reduced complex may also be protonated at one of the sulfur atoms, instead of at an iron. This 1SH− species (Fe0–Fe0) forms a hydrogen bond with a solvent acetonitrile nitrogen atom during the simulation, see Fig. 6 for an illustrative snapshot. In case of the bridging hydride isomer, no hydrogen bond formation between the hydride and the solvent was observed. Although less favorable than the bridging hydride isomer, no tautomerization via proton transfer was observed during the DFT-MD simulations.
Cyclic voltammetry studies of 1 have shown that one electron reduction of 1H− takes place to form 1H2− and this reduction leads to formation of molecular hydrogen.6 The structure of 1H2− shown in Fig. 5b is similar to that of 1H−. During the initial stage of the DFT-MD simulation after reduction of 1H−, we observe another CO group moving to the bridging position. There are thus temporary two bridging CO groups and a bridging hydride and no bridging sulfur atoms. But this structure is not very stable and rearranges to a single bridging CO and a bridging sulfur. A previous computational study also reported a bridging ligand and a bridging hydride6 for this 1H2− intermediate. There are no experimental data on the structure and properties of this intermediate. Wannier center analysis shows that the oxidation states of the irons are Fe0–FeI, where Fe0 is the oxidation state of the Fe atom bonded to both the S atoms. Protonation of this intermediate results in H2 production. Fig. 7 provides an overview of the iron oxidation states in each of the intermediates taking part of the catalytic cycle.
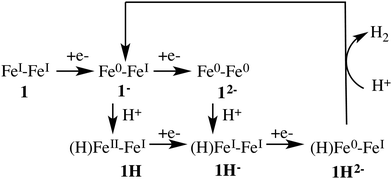 | ||
| Fig. 7 Iron oxidation states for each species in the catalytic cycle determined with the Wannier center analysis. | ||
3.2 Free energies of the protonation reactions
The protonation reaction free energies of reaction steps 1− + H+ → 1H and 12− + H+ → 1H− (see also Fig. 3) are directly related to the pKa values of the protonated species through eqn (1): | (1) |
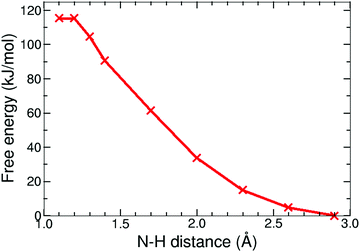 | ||
| Fig. 9 Free energy profile of the protonation reaction, 12− + H+ → 1H−, in acetonitrile computed with constrained DFT-MD simulations. | ||
In Section 3.1, we noted that the 12− intermediate can also be protonated at one of the sulfur atoms of the bdt ligand, forming the 1SH− complex (see Fig. 6), which is a tautomer of the bridging hydride isomer of 1H−. For completeness, we also performed a DFT-MD simulation starting from a configuration with a protonated acetonitrile molecule closer to a sulfur atom. An immediate transfer of the proton from the solvent molecule to the bdt sulfur occurs. Sulfur protonation has been a topic of research using computational methods,21,57 but there is no experimental characterisation of this intermediate to the best of our knowledge. The bridging hydride is the most stable isomer.56,57
3.3 Metadynamics simulation of the H2 formation
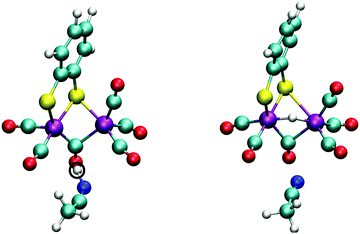
The final reaction step in the catalytic cycle is the formation of molecular hydrogen by (second) protonation of the, now, 1H2− intermediate. We investigated two possible pathways for this step: (1) direct protonation of the bridging hydride by proton donation from a donor in the solvent, and (2) a two-step process via a doubly protonated intermediate that has a protonated sulfur atom and a bridging hydride. Because the protonation reaction and subsequent H2 release involves forming and breaking of three or more bonds, computing the free energy profile along a single reaction coordinate with constrained DFT-MD cannot be done. Instead, we use metadynamics in combination with DFT-MD to compute the free energy landscapes as a function of two reaction coordinates, or collective variables.The metadynamics simulation was preceded by a DFT-MD equilibration simulation starting from a protonated solvent acetonitrile molecule close to the complex' bridging hydride. No spontaneous proton transfer was observed, suggesting that this reaction is activated and a rare event on the picosecond time scale of our simulations. For the metadynamics simulation of the direct protonation mechanism, we employed two collective variables to describe the reaction: (1) the difference of the distance between the bridging hydride and the center of mass of the two iron atoms, d(C–H1), and the distance between the bridging hydride and the second proton, d(H1–H2); and (2) the difference of the distance between the solvent nitrogen atom and the (second) proton, d(N–H2), and the distance between the bridging hydride and the second proton, d(H1–H2). The metadynamics simulation is stopped after the reactant free energy well is estimated and the barrier is crossed, and the formed H2 molecule diffuses into the solvent. The resulting free energy surface is shown in Fig. 11, and the free energy barrier is 20 kJ mol−1.
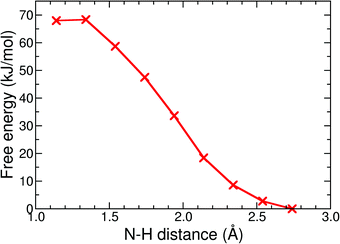
The alternative two-step mechanism of the H2 formation reaction proceeds by first forming a doubly protonated intermediate by protonation of a sulfur atom. The metadynamics result of this first step is shown in Fig. 12. The two collective variables were: (1) the distance between the sulfur atom and the (second) proton, d(S–H), and (2) the distance between the acetonitrile nitrogen atom and the proton, d(N–H). The protonation reaction of the sulfur atom has a free energy barrier of 10 kJ mol−1, which is thus significantly less than the direct protonation of the bridging hydride to form H2.
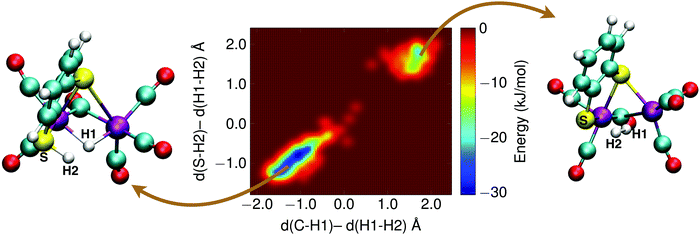
With the sulfur protonated, the second step is the internal rearrangement of the proton transfer from the sulfur atom to the bridging hydride form H2. The computed free energy profile for this reaction is shown in Fig. 13. The two collective variables are: (1) the difference of the distance between the bridging hydride and the center of mass of the two iron atoms, d(C–H1), and the distance between the hydride and the proton, d(H1–H2), and (2) the difference of the distance between the sulfur atom and the proton, d(S–H2), and the distance between the hydride and the proton, d(H1–H2). This rearrangement has a relatively high free energy barrier of 28 kJ mol−1.
With the second step of the two-step mechanism having a higher barrier than the direct mechanism, the latter is the preferred mechanism. We note however, that the first step of the two-step mechanism, i.e. protonation of the sulfur atom, has the lowest barrier and is moreover a highly exergonic process, which makes formation of the doubly protonated intermediate very likely. The role of this intermediate is still unknown. We speculate that the sulfur protonation forms a trap, which makes the overall catalytic process less efficient. Control of the protonation could therefore provide a strategy to improve the catalyst, for example by replacing the chalcogen atoms26 or via other modifications of the bridgehead ligand.
4 Conclusions
The Fe2(bdt)(CO)6 (1) complex is a robust catalyst for electrochemical production of molecular hydrogen by reduction of protons. In this study, we simulated with first principles molecular dynamics the reaction mechanism of the catalyst in the presence of protons in explicit acetonitrile solvent. We characterized the structures of the relevant intermediates and computed the oxidation states of the iron ions using the Wannier center analysis. Acidity constants were computed using constrained DFT-MD simulations and reaction free energies surfaces were obtained with metadynamics simulations.We found that the second protonation leading to H2 formation and recovery of the initial catalyst state is the rate limiting step in the catalytic cycle. The most favorable pathway is through direct protonation of the bridging hydride from the solution to form molecular hydrogen. We also discovered that protonation of a bdt sulfur atom is more favorable than protonation of the bridging hydride. As this second protonation at the sulfur of the doubly reduced intermediate neutralizes the net negative charge of the complex, this is likely to lower the efficiency of the protonation of the hydride and formation of H2. Further research is necessary to investigate how sulfur protonation affects the performance of the catalyst and if it can be avoided.
Conflicts of interest
There are no conflicts of interest to declare.Acknowledgements
The work is funded by Foundation for Fundamental Research on Matter (FOM), part of the Netherlands Organisation for Scientific Research (NWO) and Shell Global Solutions International B. V. as a part of Computational sciences for energy research programme (No. 15CSER062). Authors also acknowledge the SURF Cooperative for the computer resources provided for the calculations. M. E. acknowledges the Ministry of Education, Science, and Technological Development of the Republic of Serbia for the financial support (Contract No. 172040). Numerical simulations were partly run on the PARADOX-IV supercomputing facility at the Scientific Computing Laboratory of the Institute of Physics Belgrade, supported in part by the Ministry of Education, Science, and Technological Development of the Republic of Serbia under project no. ON171017.References
- D. Das and T. Vezirou, Int. J. Hydrogen Energy, 2001, 26, 13–28 CrossRef CAS.
- W. Lubitz, H. Ogata, O. Rüdiger and E. Reijerse, Chem. Rev., 2014, 114, 4081–4148 CrossRef CAS PubMed.
- J. W. Peters, G. J. Schut, E. S. Boyd, D. W. Mulder, E. M. Shepard, J. B. Broderick, P. W. King and M. W. Adams, Biochim. Biophys. Acta, Mol. Cell Res., 2015, 1853, 1350–1369 CrossRef CAS PubMed.
- C. Madden, M. D. Vaughn, I. Dez-Pérez, K. A. Brown, P. W. King, D. Gust, A. L. Moore and T. A. Moore, J. Am. Chem. Soc., 2012, 134, 1577–1582 CrossRef CAS PubMed.
- G. A. Felton, C. A. Mebi, B. J. Petro, A. K. Vannucci, D. H. Evans, R. S. Glass and D. L. Lichtenberger, J. Organomet. Chem., 2009, 694, 2681–2699 CrossRef CAS.
- G. A. N. Felton, A. K. Vannucci, J. Chen, L. T. Lockett, N. Okumura, B. J. Petro, U. I. Zakai, D. H. Evans, R. S. Glass and D. L. Lichtenberger, J. Am. Chem. Soc., 2007, 129, 12521–12530 CrossRef CAS PubMed.
- J.-F. Capon, F. Gloaguen, P. Schollhammer and J. Talarmin, J. Electroanal. Chem., 2004, 566, 241–247 CrossRef CAS.
- J.-F. Capon, F. Gloaguen, P. Schollhammer and J. Talarmin, J. Electroanal. Chem., 2006, 595, 47–52 CrossRef CAS.
- F. Gloaguen, D. Morvan, J.-F. Capon, P. Schollhammer and J. Talarmin, J. Electroanal. Chem., 2007, 603, 15–20 CrossRef CAS.
- E. S. Donovan, J. J. McCormick, G. S. Nichol and G. A. N. Felton, Organometallics, 2012, 31, 8067–8070 CrossRef CAS.
- M. Mirmohades, S. Pullen, M. Stein, S. Maji, S. Ott, L. Hammarström and R. Lomoth, J. Am. Chem. Soc., 2014, 136, 17366–17369 CrossRef CAS PubMed.
- F. Gloaguen, J. D. Lawrence and T. B. Rauchfuss, J. Am. Chem. Soc., 2001, 123, 9476–9477 CrossRef CAS PubMed.
- S. J. Borg, T. Behrsing, S. P. Best, M. Razavet, X. Liu and C. J. Pickett, J. Am. Chem. Soc., 2004, 126, 16988–16999 CrossRef CAS PubMed.
- S. Borg, M. Bondin, S. Best, M. Razavet, X. Liu and C. Pickett, Biochem. Soc. Trans., 2005, 33, 3–6 CrossRef CAS PubMed.
- B. E. Barton, M. T. Olsen and T. B. Rauchfuss, J. Am. Chem. Soc., 2008, 130, 16834–16835 CrossRef CAS PubMed.
- M. T. Olsen, B. E. Barton and T. B. Rauchfuss, Inorg. Chem., 2009, 48, 7507–7509 CrossRef CAS PubMed.
- M. T. Olsen, T. B. Rauchfuss and S. R. Wilson, J. Am. Chem. Soc., 2010, 132, 17733–17740 CrossRef CAS PubMed.
- M. E. Carroll, B. E. Barton, T. B. Rauchfuss and P. J. Carroll, J. Am. Chem. Soc., 2012, 134, 18843–18852 CrossRef CAS PubMed.
- S. Gao, Y. Liu, Y. Shao, D. Jiang and Q. Duan, Coord. Chem. Rev., 2020, 402, 213081 CrossRef CAS.
- R. Becker, S. Amirjalayer, P. Li, S. Woutersen and J. N. H. Reek, Sci. Adv., 2016, 2, e1501014 CrossRef PubMed.
- Z. Cao and M. B. Hall, J. Am. Chem. Soc., 2001, 123, 3734–3742 CrossRef CAS PubMed.
- M. Bruschi, G. Zampella, P. Fantucci and L. D. Gioia, Coord. Chem. Rev., 2005, 249, 1620–1640 CrossRef CAS.
- C. Greco, G. Zampella, L. Bertini, M. Bruschi, P. Fantucci and L. De Gioia, Inorg. Chem., 2007, 46, 108–116 CrossRef CAS PubMed.
- C. Greco and L. De Gioia, Inorg. Chem., 2011, 50, 6987–6995 CrossRef CAS PubMed.
- B. Ginovska-Pangovska, M.-H. Ho, J. C. Linehan, Y. Cheng, M. Dupuis, S. Raugei and W. J. Shaw, Biochim. Biophys. Acta, Bioenerg., 2014, 1837, 131–138 CrossRef CAS PubMed.
- M. Etinski, I. M. Stanković, R. C. Puthenkalathil and B. Ensing, New J. Chem., 2020, 44, 932–941 RSC.
- A. Klamt and G. Schuurmann, J. Chem. Soc., Perkin Trans. 2, 1993, 799–805 RSC.
- M. Bruschi, C. Greco, M. Kaukonen, P. Fantucci, U. Ryde and L. DeGioia, Angew. Chem., Int. Ed., 2009, 48, 3503–3506 CrossRef CAS PubMed.
- A. Laio and M. Parrinello, Proc. Natl. Acad. Sci. U. S. A., 2002, 12562–12566 CrossRef CAS PubMed.
- B. Ensing, M. De Vivo, Z. Liu, P. Moore and M. L. Klein, Acc. Chem. Res., 2006, 39, 73–81 CrossRef CAS PubMed.
- M. Jansen and U. Wedig, Angew. Chem., Int. Ed., 2008, 47, 10026–10029 CrossRef CAS PubMed.
- R. S. Mulliken, J. Chem. Phys., 1955, 23, 1833–1840 CrossRef CAS.
- P.-O. Löwdin, Phys. Rev., 1955, 97, 1474–1489 CrossRef.
- I. Mayer, Chem. Phys. Lett., 1983, 97, 270–274 CrossRef CAS.
- G. H. Wannier, Phys. Rev., 1937, 52, 191–197 CrossRef CAS.
- N. Marzari and D. Vanderbilt, Phys. Rev. B: Condens. Matter Mater. Phys., 1997, 56, 12847–12865 CrossRef CAS.
- J. VandeVondele, M. Krack, F. Mohamed, M. Parrinello, T. Chassaing and J. Hutter, Comput. Phys. Commun., 2005, 167, 103–128 CrossRef CAS.
- J. P. Perdew, K. Burke and M. Ernzerhof, Phys. Rev. Lett., 1996, 77, 3865–3868 CrossRef CAS PubMed.
- S. Grimme, J. Antony, S. Ehrlich and H. Krieg, J. Chem. Phys., 2010, 132, 154104 CrossRef PubMed.
- J. VandeVondele and J. Hutter, J. Chem. Phys., 2007, 127, 114105 CrossRef PubMed.
- S. Goedecker, M. Teter and J. Hutter, Phys. Rev. B: Condens. Matter Mater. Phys., 1996, 54, 1703–1710 CrossRef CAS PubMed.
- C. Hartwigsen, S. Goedecker and J. Hutter, Phys. Rev. B: Condens. Matter Mater. Phys., 1998, 58, 3641–3662 CrossRef CAS.
- G. Bussi, D. Donadio and M. Parrinello, J. Chem. Phys., 2007, 126, 014101 CrossRef PubMed.
- N. Marzari, A. A. Mostofi, J. R. Yates, I. Souza and D. Vanderbilt, Rev. Mod. Phys., 2012, 84, 1419–1475 CrossRef CAS.
- P. H.-L. Sit, F. Zipoli, J. Chen, R. Car, M. H. Cohen and A. Selloni, Chem. – Eur. J., 2011, 17, 12136–12143 CrossRef CAS PubMed.
- P. Vidossich and A. Lledos, Dalton Trans., 2014, 43, 11145–11151 RSC.
- P. Vidossich, G. Ujaque and A. Lledos, Chem. Commun., 2012, 48, 1979–1981 RSC.
- G. A. Tribello, M. Bonomi, D. Branduardi, C. Camilloni and G. Bussi, Comput. Phys. Commun., 2014, 185, 604–613 CrossRef CAS.
- M. D. Hanwell, D. E. Curtis, D. C. Lonie, T. Vandermeersch, E. Zurek and G. R. Hutchison, J. Cheminf., 2012, 4, 17 CAS.
- W. Humphrey, A. Dalke and K. Schulten, J. Mol. Graphics, 1996, 14, 33–38 CrossRef CAS PubMed.
- D. Chong, I. P. Georgakaki, R. Mejia-Rodriguez, J. Sanabria-Chinchilla, M. P. Soriaga and M. Y. Darensbourg, Dalton Trans., 2003, 4158–4163 RSC.
- C. Orain, F. Quentel and F. Gloaguen, ChemSusChem, 2014, 7, 638–643 CrossRef CAS PubMed.
- X. Li, M. Wang, L. Chen, X. Wang, J. Dong and L. Sun, ChemSusChem, 2012, 5, 913–919 CrossRef CAS PubMed.
- J. A. Cabeza, M. A. Martnez-Garca, V. Riera, D. Ardura and S. Garca-Granda, Organometallics, 1998, 17, 1471–1477 CrossRef CAS.
- M. Kılıç and B. Ensing, Phys. Chem. Chem. Phys., 2014, 16, 18993–19000 RSC.
- N. Leidel, C.-H. Hsieh, P. Chernev, K. G. V. Sigfridsson, M. Y. Darensbourg and M. Haumann, Dalton Trans., 2013, 42, 7539–7554 RSC.
- R. J. Wright, W. Zhang, X. Yang, M. Fasulo and T. D. Tilley, Dalton Trans., 2012, 41, 73–82 RSC.
Footnote |
| † Electronic supplementary information (ESI) available: DFT energies and bond lengths for different multiplicities using different functionals and basis sets, average bond lengths of complex 1 intermediates from DFT-MD simulations, total spin (S2) and Wannier center positions in spin-polarised complexes, and simulation snapshots. See DOI: 10.1039/c9cp06770a |
| This journal is © the Owner Societies 2020 |


