
Quantum mechanical molecular dynamics simulations of polaron formation in methylammonium lead iodide perovskite†
Hiroki
Uratani
 a,
Chien-Pin
Chou
b and
Hiromi
Nakai
*abc
a,
Chien-Pin
Chou
b and
Hiromi
Nakai
*abc
aDepartment of Chemistry and Biochemistry, School of Advanced Science and Engineering, Waseda University, 3-4-1, Okubo, Shinjuku-ku, Tokyo 169-8555, Japan. E-mail: nakai@waseda.jp
bWaseda Research Institute for Science and Engineering (WISE), 3-4-1 Okubo, Shinjuku-ku, Tokyo 169-8555, Japan
cElements Strategy Initiative for Catalysts and Batteries (ESICB), Kyoto University, Katsura, Kyoto 615-8245, Japan
First published on 27th November 2019
Abstract
We investigated the atomistic and dynamical mechanism of polaron formation in methylammonium lead iodide perovskite (MAPbI3), which is a representative perovskite solar cell absorber, through the quantum mechanical molecular dynamics simulations. The simulations were conducted on the spatial scale of several nanometres, which can describe charge localization and the associated structural deformation, using the divide-and-conquer-type density-functional tight-binding method, which enables a quantum chemical treatment of systems comprising thousands of atoms. We found that both the structural parts of MAPbI3, namely, the inorganic framework (PbI3−) and the MA cations, involve the structural deformation associated with polaron formation. We elucidated that in the process of polaron formation, charge localization is invoked by thermal structural fluctuation, and a further structural deformation is caused by the relaxation of the charge carrier. Finally, importance of the two structural parts, PbI3− and MA, was examined from the energetical viewpoint.
1 Introduction
The opto-electronic applicability of lead halide perovskite (LHP) materials was first recognized in the context of utilization for photovoltaics, called perovskite solar cells (PSCs), which realized an exceptionally high photoconversion efficiency.1,2 Recently, the field of LHP application has grown to include other types of devices, such as light-emitting diodes3 and phototransistors.4 LHPs have the general formula APbX3, where A and X denote monovalent cations and halide anions, respectively. The most typical and first LHP used in PSCs is methylammonium lead iodide perovskite (MAPbI3), where an organic molecular cation—methylammonium (CH3NH3+, MA+)—is chosen as cation A.1 From structural viewpoint, LHP has two components. One is an inorganic framework, which is formally PbX3−, composed of corner-sharing PbX6 octahedra. Because the density of states (DOS) around the valence band maximum (VBM) and conduction band minimum (CBM) is dominated by the PbX3− framework, the charge carriers are located on this structural part. The other is a sublattice constructed by the A cations, which fill the vacancies and compensate for the net negative charge of the PbX3− framework. While the A cations have no significant contribution to DOS around the band edge, their indirect effect on the electronic structure through their electrostatic or structural role has been recognized.5The unique properties of charge carriers in LHPs, such as long diffusion length, long lifetime, and low electron–hole recombination rate,6–11 have been considered to be key to the remarkable performance of LHP-based opto-electronic devices such as PSCs. Therefore, the physics underlying these properties, particularly polarons, i.e., charges wearing structural deformation caused by the polarization potential,12 has been extensively studied experimentally and theoretically. The polaron formation process, which is a structural motion responding the additional (negative or positive) charge coupled with its electronic state, is a fundamental knowledge needed to unveil the above-mentioned charge carrier properties. However, the understanding in this regard is still limited. In particular, some researchers have proposed the importance of rotational motion of organic molecular cations such as MA+,13–17 while others have focused on the role of structural deformation in the PbX3− frameworks18–20 rather than the organic molecular cations. This issue has been focused on in conjunction with the recent progress in the opto-electronic applications of LHPs using various cations such as formamidinium (FA+), Cs+, and Rb+.21–23
A commonly used model of polarons was proposed by Fröhlich.24 In this picture, the lattice is polarized by the Coulomb potential of the charge carrier to produce the polarization potential. This polarization potential acts back on the charge carrier toward self-consistency. Zheng and Wang25 constructed a model Hamiltonian, which includes the polarization potential as the screened Coulomb potential, as well as the effects of the thermal disorder of the MA+ and the PbI3− lattice as artificial stochastic potential fluctuation. An electronic wavefunction was propagated based on this Hamiltonian. Their simulations were performed with a sufficiently large spatial scale to describe the whole electronic wavefunctions of polarons, whose radii are estimated to be several nanometres.20,26 The simulations indicated that not only the polarization potential but also the thermal disorder significantly affect the spatial distribution of the wavefunction, the polaron binding energy, and the transport properties. Note that their model Hamiltonian approach cannot describe atomic motions, although nanoscale simulations can be performed.
In contrast, from the atomistic viewpoint, the mechanism of polaron formation has been investigated for several years using first-principles density functional theory (DFT) calculations, which are frequently combined with molecular dynamics (MD) simulations. Neukirch et al.27 compared the stable geometries of MAPbI3 and CsPbI3 between neutral and charged states, using zero-dimensional cluster models. Yin et al.28 used DFT-based MD simulations to analyse the structural dynamics of LHP clusters, which are monomers or dimers of PbX6 octahedral units, with the existence of charge carriers. For bulk LHPs, Miyata et al.20 compared their time-resolved spectroscopy measurements with DFT calculations in the negatively or positively charged state. In addition, DFT-based MD simulations in the presence of charge carriers were reported by Ambrosio et al.29,30 These studies20,27–30 clarified the relationship between charge localization and explicit atomic motions: for example, modulations in Pb–X bond length and the rotation of MA+.
In the present study, we investigated the polaron formation mechanism from both nanoscale and atomistic viewpoints. To capture both real atomic motions and spatial size of the polarons simultaneously, we performed QM-MD simulations of the polaron formation process in MAPbI3 with large model systems, which is beyond the reach of the conventional DFT technique. To overcome the computational burden arising from the system size, we employed a combined approach of divide-and-conquer (DC) method31–38 and density functional tight-binding (DFTB) method,39–42 referred to as DC–DFTB,43–45 which is a linear scaling QM technique. Its parallelized implementation, that is, DCDFTBMD code,45 can perform QM-MD simulations of systems containing thousands of atoms by using parallel computation resources.
The rest of this paper is organized as follows. In Section 2, we summarize the theoretical aspect of the DC–DFTB technique. Next, in Section 3, we explain the numerical details of the simulations. The results are reported and discussed in Section 4. On the basis of the simulations, we evaluate the extent of charge localization (Section 4.1). Next, we discuss the relationship between charge localization and structural deformation (Section 4.2). Moreover, the process of structural deformation is discussed in detail by focusing on the early stage of polaron formation (Section 4.3). From the energetical viewpoint, the importance of the role of PbI3− framework and MA cations is discussed (Section 4.4). Finally, the conclusion is presented in Section 5.
2 Theoretical background
In this section, we briefly summarize the theoretical aspects of the DC–DFTB method. For further details, please refer to the previous literature,43–45 as well as its background, DC31–38 and DFTB39–42 methods.DFTB is a well-established semiempirical quantum chemical calculation scheme, which has been adopted for a wide range of systems, as briefly reviewed elsewhere.46 The theoretical framework is grounded on the Taylor expansion of Kohn–Sham equations with respect to charge density fluctuation δρ around reference density ρ0, which is a superposition of the unperturbed atomic charge density. There are three major types of DFTB: DFTB1,39,40 DFTB2,42 and DFTB3.47 DFTB2, which was employed in this study, is commonly applied for semiconducting solid materials.17,48–50 In the framework of DFTB2, the total energy E is expressed as42,51
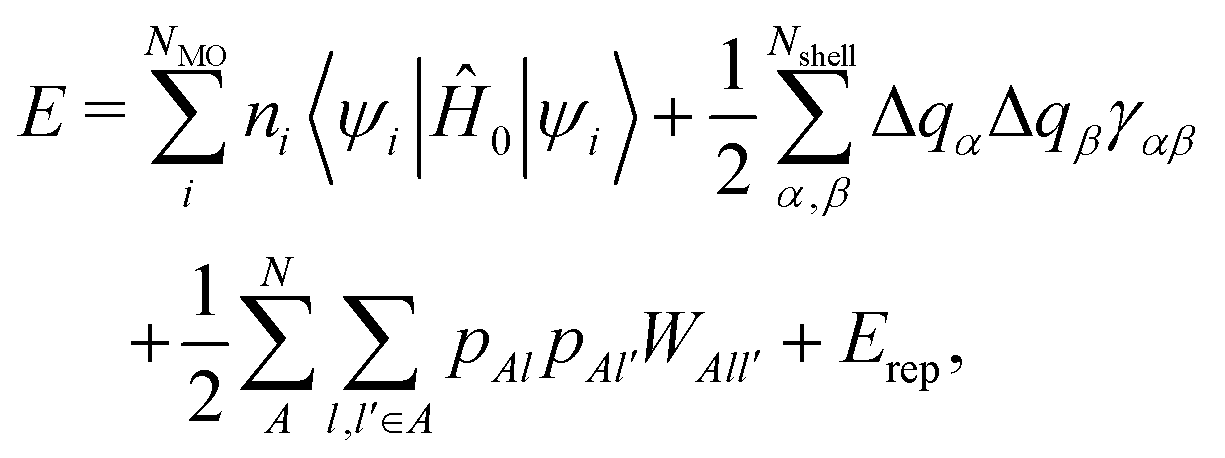 | (1) |
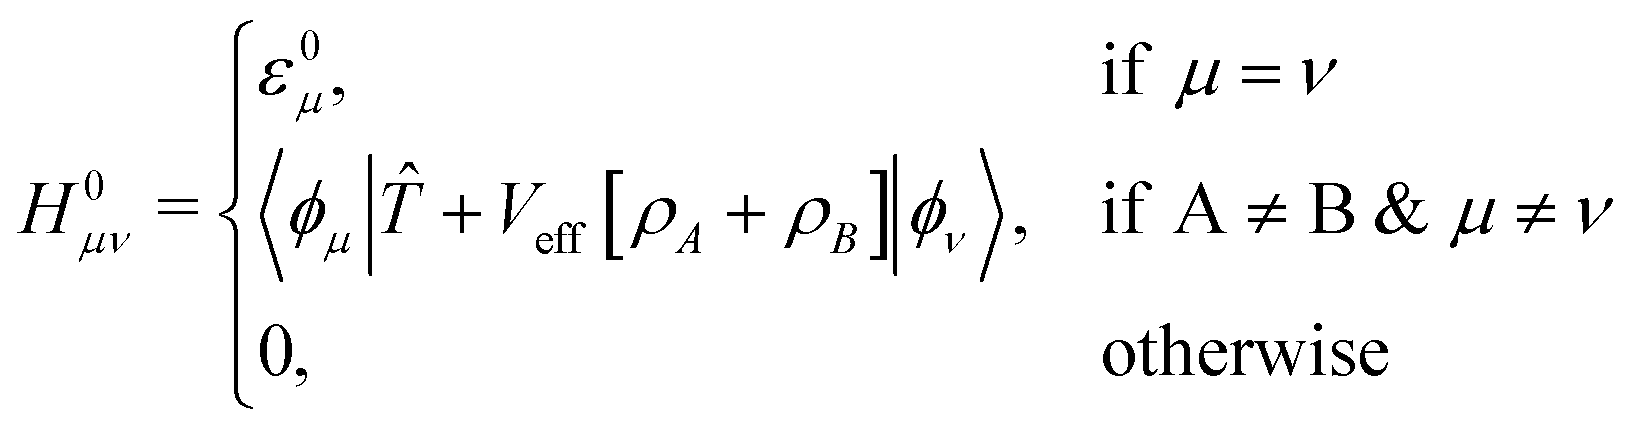
ψ i is expanded by a set of pseudo-atomic orbitals, ϕμ, which is obtained by solving a Kohn–Sham-like equation for an isolated atom:
[![[T with combining circumflex]](https://www.rsc.org/images/entities/i_char_0054_0302.gif) + Veff[ρA] + Vconf]ϕμ = εμϕμ, + Veff[ρA] + Vconf]ϕμ = εμϕμ, | (2) |
and Veff[ρA] denote the kinetic operator and the exchange–correlation potential with respect to the atomic charge density ρA calculated with Perdew–Burke–Ernzerhof formalism of generalized gradient approximation (GGA–PBE),52 respectively. Artificial atom-centred potentials (confinement potentials) Vdconf and Vconf are applied for the calculations of charge density ρA and pseudo-atomic orbital ϕμ, respectively, to mimic the localized electronic states of the atoms in molecules or solids. In general, the shape of Vconf is optimized for each element in a semi-empirical manner.
Through the variational principles, the set of i-th MO coefficients, Ci, is obtained by solving the following generalized eigenvalue problem:
| HCi = εMOiSCi, | (3) |
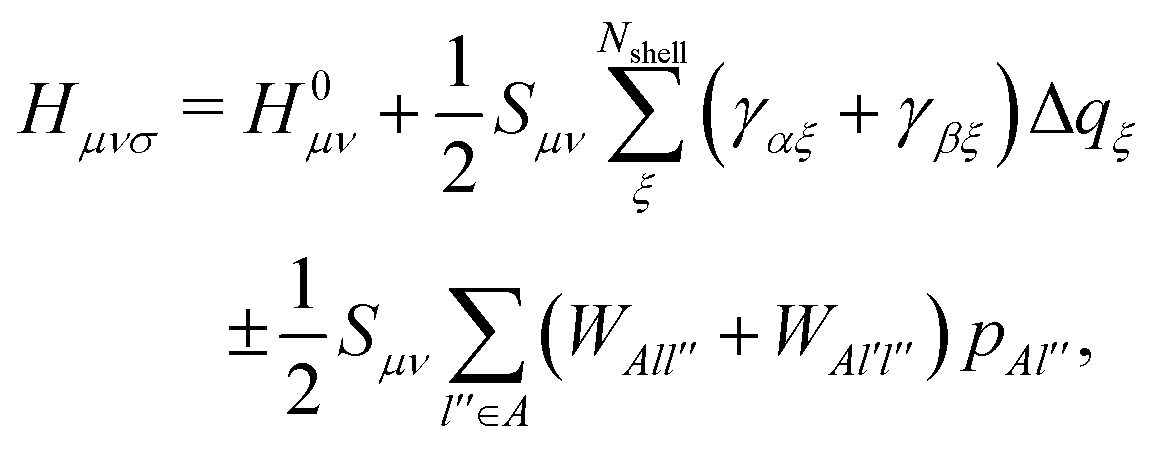 | (4) |
Elements of H0 and S matrices are described as
| Sμν = 〈ϕμ|ϕν〉, | (5) |
 | (6) |
In DFTB, the computational cost for calculating each matrix element is small, and the dimension of the matrix is reduced by utilizing the minimal basis set. For this reason, generally, DFTB is a computationally economical method compared to Kohn–Sham DFT. However, because of O(N3) scaling (here, N is the number of pseudo-atomic orbitals) of DFTB computational time, which arises from the diagonalizations of N × N matrices, huge systems are still inaccessible. The target system size can be extended using the DC scheme, where the system is divided into small subsystems and solved separately. For each subsystem, Kohn–Sham-like equations (eqn (3)) are solved with including neighbouring (within the given radius rb) subsystems as the “buffer region”. The common Fermi level among the subsystems is determined to conserve the total number of electrons. The charge density (in the case of DFTB, the set of Mulliken charges) of the whole system is determined on the basis of direct sum of subsystem density matrices, with the factor of 1/2 for inter-subsystem matrix elements to avoid double-counting. In the DC scheme, the exact (in the sense of without using DC) charge density and energy are reproduced with a sufficiently large rb and delocalized states among the subsystems can be treated. Because each subsystem is solved independently, the scaling of the DC method is O(N), and it is suitable for parallel computation. For this reason, combining DFTB with the DC scheme, huge scale calculations are made computationally feasible.
3 Computational details
3.1 Details of parameter fitting
The shape of Vconf is subjected to optimization for each element. For the MAPbI3 system, H, Pb, C, I, and N are needed to be parametrized. We adopted the Vconf proposed in the previous studies for H, C, N, and I.54,55Vconf for Pb was newly constructed. We employed the modified Woods–Saxon potential56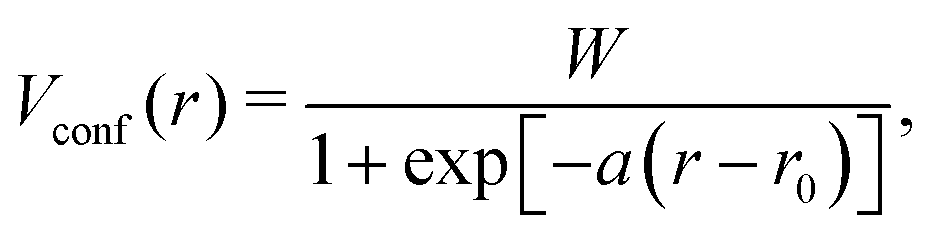 | (7) |
In addition, the repulsive potential Erep was parametrized. Erep is defined for each element pair as a function of interatomic distance, which is typically described by a set of spline functions. As done for Vconf, we used the previously reported Erep for element pairs among H, C, N, and I.54,55 For the Pb–I pair, we constructed a new repulsive potential. In this study, we adopted the fourth-order spline function form, which is piecewisely defined as
| c0 + c1(R − R0) + c2(R − R0)2 + c3(R − R0)3 + c4(R − R0)4, | (8) |
| exp[−a1R + a2] + a3 | (9) |
To obtain the set of optimized parameters and solve eqn (2), the ADPT program package was utilized. The program was developed previously and its source code is hosted at Bitbucket under LGPLv3 license.57,58 All reference GGA–PBE calculations were conducted with VASP code,59–62 treating the core electrons by using the projector augmented-wave method.63
Using the obtained parameter set, the vibrational density of states (VDOS) was calculated and is shown in Fig. 1, with the GGA–PBE result as a comparison. These VDOSs were obtained by the Fourier transform of velocity autocorrelation functions calculated from MD runs. The DFTB–MD and GGA–PBE–MD runs for VDOS calculations were performed for 15 ps with a time step of 0.25 fs without any geometrical constraint, using 2 × 2 × 2 supercells, whose building block is the optimized tetragonal cell with each method. Prior to the production runs, the equilibration runs were performed at room temperature in the reported scheme.19 Note that these computational conditions were employed only for VDOS calculations and not for the polaron formation simulations described in detail in the next section. Fig. 1 shows that the VDOS calculated with DFTB (blue) agrees with that obtained using GGA–PBE (grey), indicating that DFTB calculations with our constructed parameter set well-reproduce the GGA–PBE results in terms of structural dynamics.
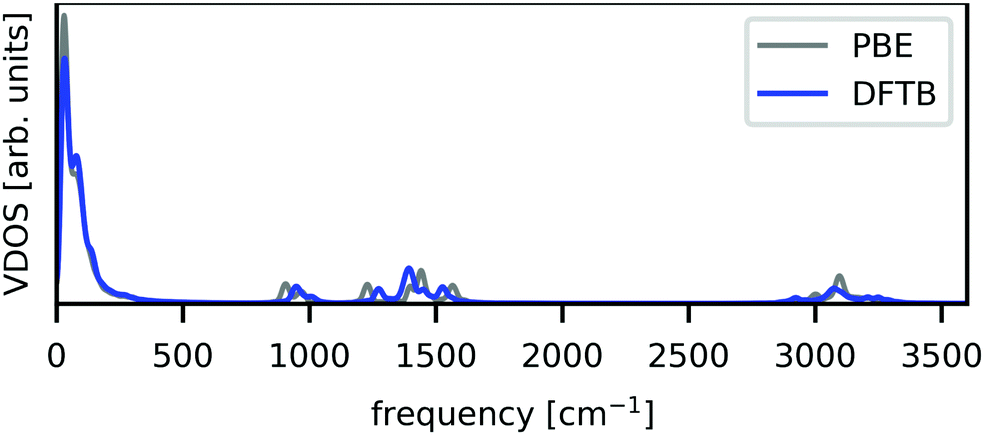 | ||
| Fig. 1 Calculated VDOS from unconstrained NVE-MD runs. GGA–PBE and DFTB results are shown by grey and blue lines, respectively. | ||
3.2 Calculation setup
All DFTB calculations, with or without the DC technique, were performed in the orbitally resolved DFTB242 level under the periodic boundary condition, using the above-mentioned parameter set, unless otherwise noted. As the building block of the simulation cell, the tetragonal unit cell of MAPbI3, which includes four formula units (48 atoms), was optimized with DFTB without DC, as implemented in DFTB+ code64 using the Γ-centred 6 × 6 × 6 k-point mesh. In this process, both the atomic coordinates and cell parameters were optimized. A slight deviation from the perfect tetragonal unit cell shape was eliminated in the reported manner,19 which essentially does not affect the cell length (change in the length was smaller than 0.001 Å). The simulation cells were constructed by repeating the optimized unit cell of MAPbI3 four times along each dimension. They contained 3072 atoms and had lattice parameters of a = b = 36.83 Å, c = 53.79 Å, and α = β = γ = 90°.DC–DFTB–MD calculations were conducted using the DCDFTBMD program.43–45 To adopt the DC technique, each unit cell was treated as a subsystem; one simulation cell contained 64 subsystems. For each subsystem, the neighbouring subsystems within 8 Å were included as buffer regions. Fig. 2 compares the averaged wall clock time for one SCC cycle with and without DC in this system in the neutral state. Using the sufficiently large number of CPU cores, DC–DFTB has the advantage of the order of magnitude compared to DFTB without DC, enabling MD simulations of this system within a feasible computation time.
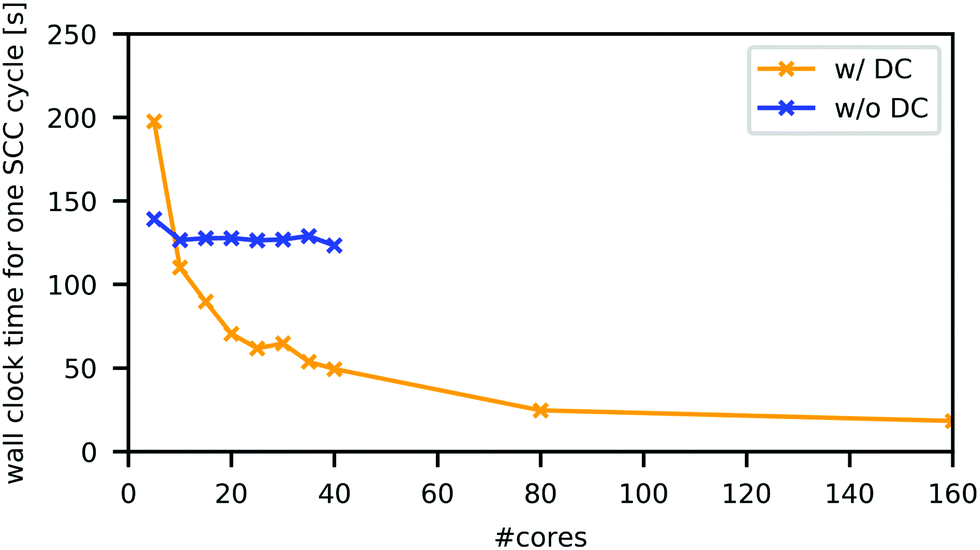 | ||
| Fig. 2 Averaged wall clock time for one SCC cycle with (orange) and without (blue) DC technique on Intel Xeon Gold 6148 (40 cores per computation node). Calculations without DC were parallelized with OpenMP. DC calculations were performed with MPI/OpenMP hybrid parallelization, where five OpenMP threads and #cores/5 MPI processes were used. | ||
Prior to the simulations of the polaron formation process, the system was equilibrated in the charge-neutral state with an NVT run of over 6 ps at 298.15 K, followed by an NVE run of over 2 ps. Then, the polaron formation process for a negative (positive) charge was initiated by resetting the net system charge −1 (+1) and restarting an NVE run. Spin-polarized calculations were conducted in the charged systems. Time steps of 2 and 4 fs were adopted for the NVE and NVT runs, respectively, with constraints of C–H and N–H bond lengths using the RATTLE method.65
4 Results and discussion
4.1 Spatial distribution of charge carriers
Throughout this paper, the atomic spin population for each atom is defined as its up spin Mulliken charge minus down spin one; here, the number of up spin electrons is larger than that of down spin ones. The atomic spin population obtained for a snapshot, as depicted in Fig. 3, shows that the negative (positive) charge is located on Pb (I) atoms. The results are consistent with the orbital nature of VBM and CBM, where the p-orbitals of I atoms and those of Pb atoms have a dominant contribution, respectively.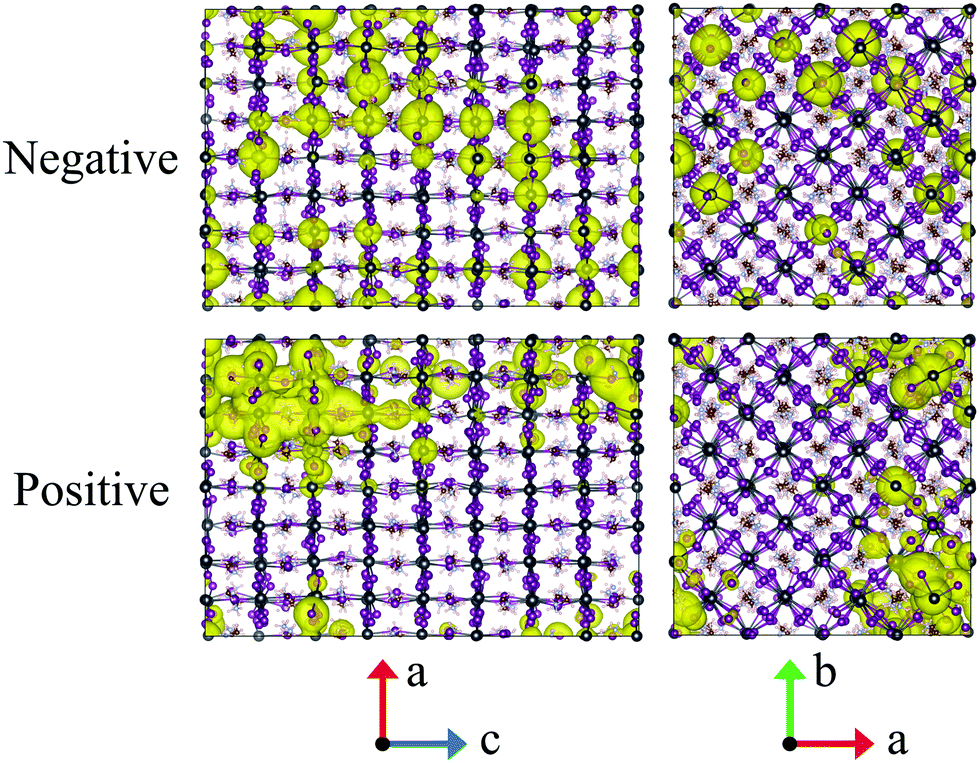 | ||
| Fig. 3 Atomic spin population corresponding to a negative (positive) charge is shown as a yellow iso-surface for a snapshot. For visualization, the atomic spin population values are converted into density at each spatial grid point by multiplying the atom-centred Slater functions. The pink, grey, brown, purple, and blue spheres indicate H, Pb, C, I, and N atoms, respectively. | ||
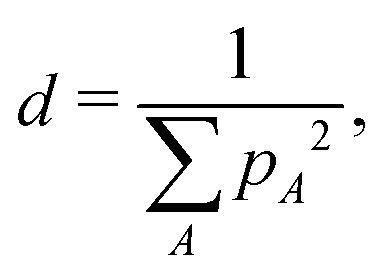
The radius of the charge carrier was estimated as follows. The number of atoms d, over which an electron or a hole is delocalized, was evaluated as
 | (10) |
| V = Vcelld/n, | (11) |
 | ||
| Fig. 4 Time course change of negative (blue) and positive (red) charge carrier radii. Averaged values are shown with dashed lines. | ||
4.2 Structural dynamics
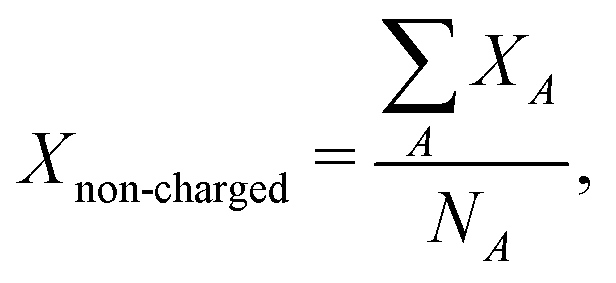
Fig. 5a and b show a comparison of the time-course changes in the averaged Pb–I bond lengths in the region where the charge is localized (charged region) and the rest (non-charged region). The averaged values in the charged and non-charged regions are defined as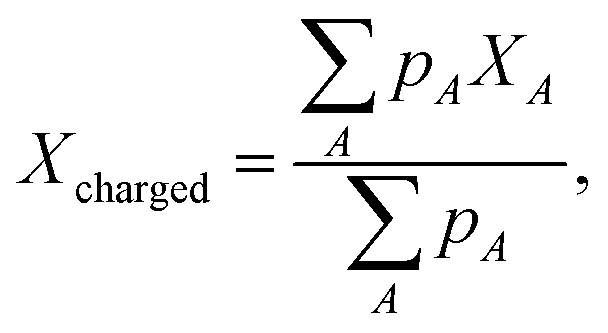 | (12) |
 | (13) |
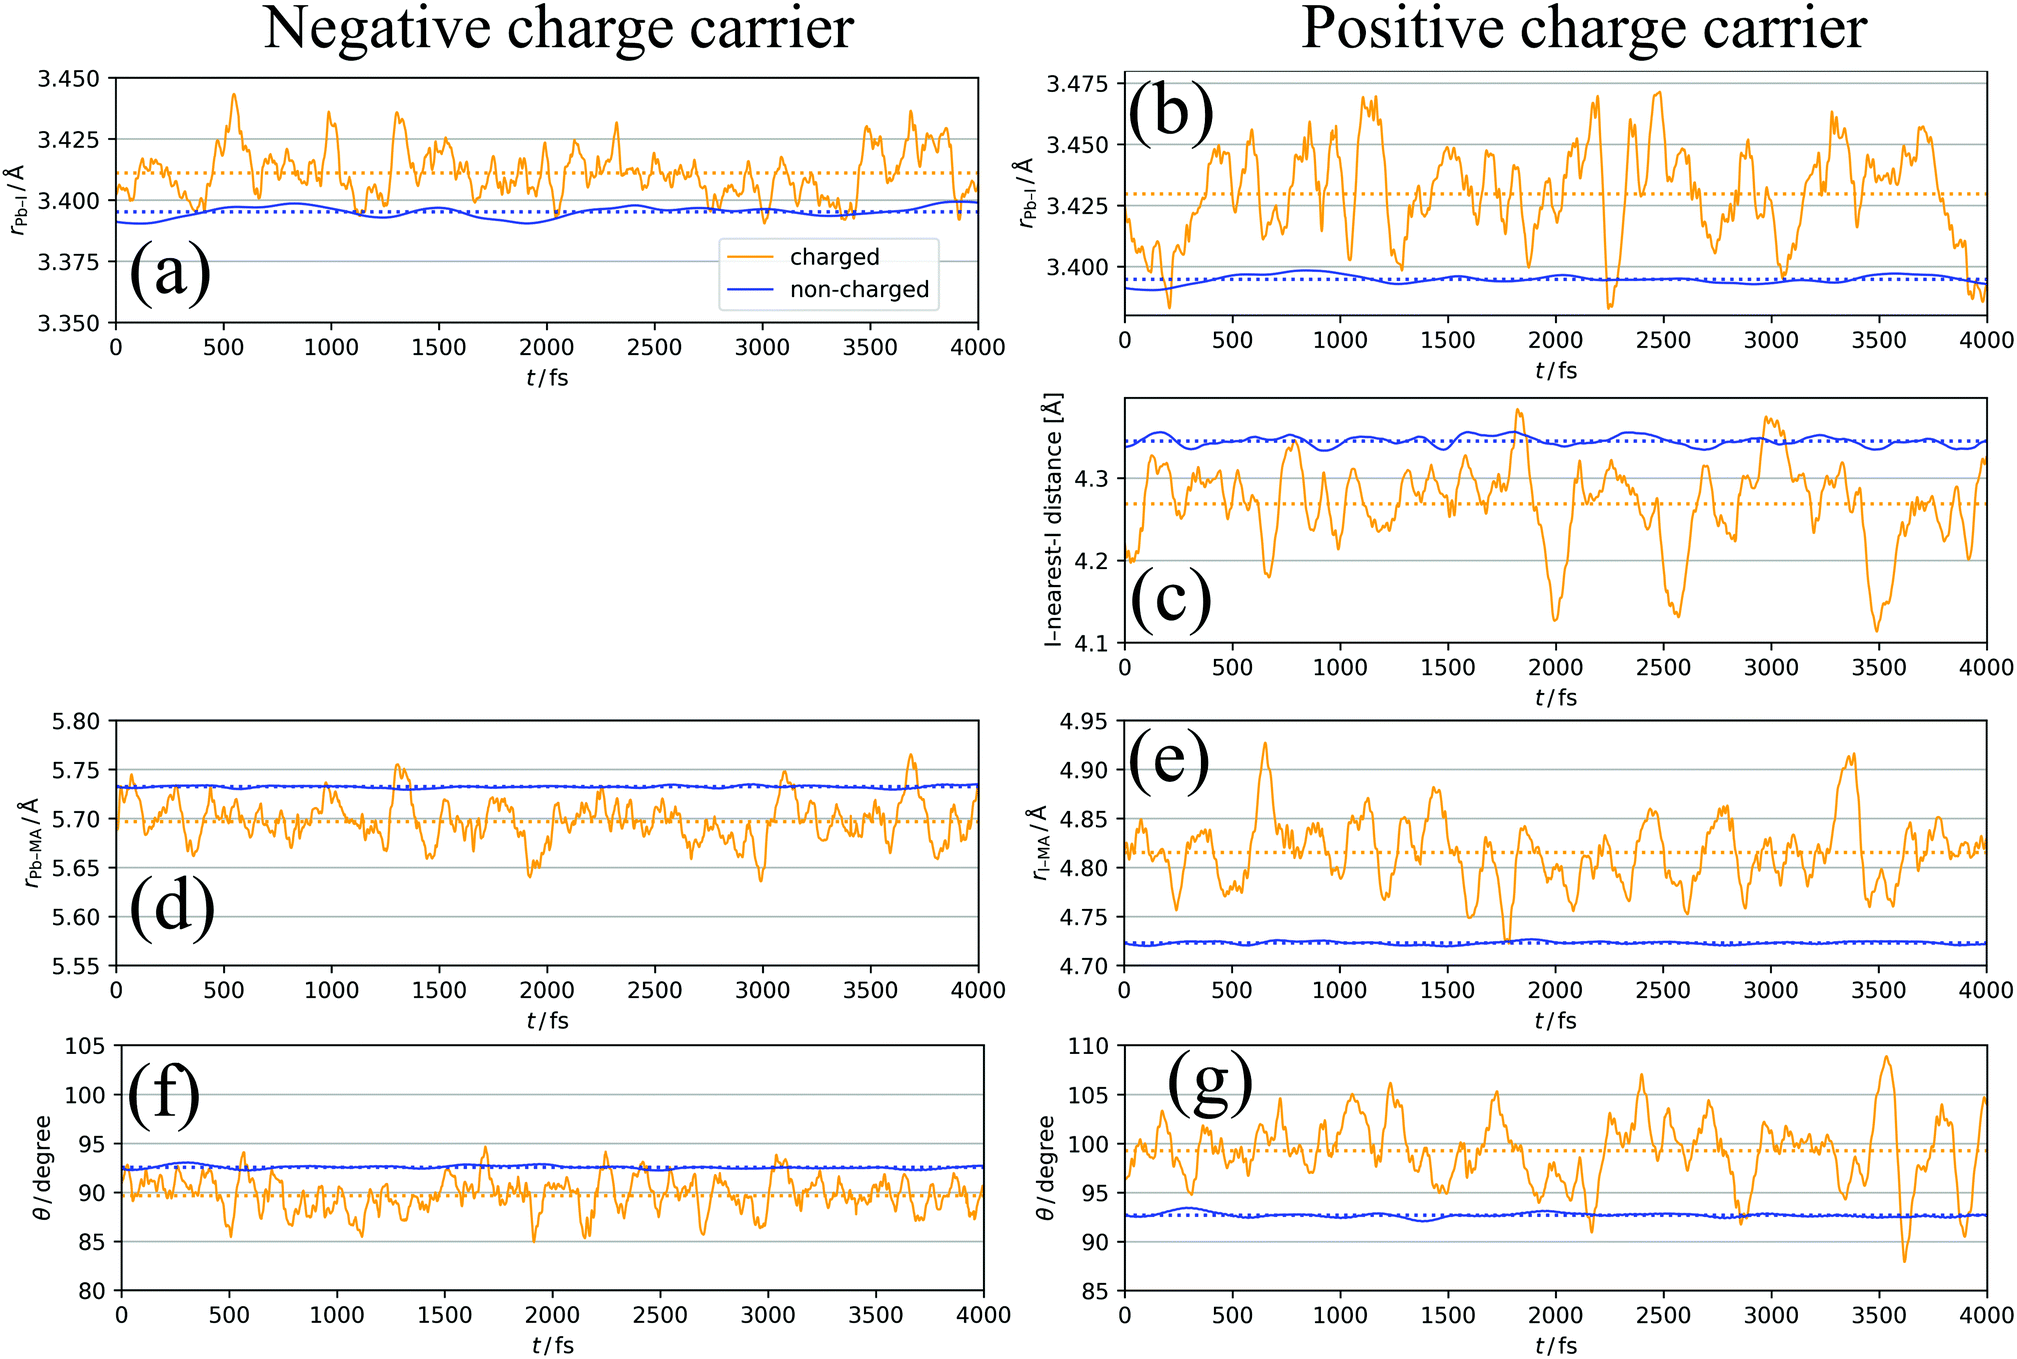 | ||
| Fig. 5 Time course changes of (a) Pb–I distance for negative charge, (b) Pb–I distance for positive charge, (c) I-nearest I distance for positive charge, (d) Pb–MA distance for negative charge, (e) I–MA distance for positive charge, (f) angle of MA cations θ for negative charge, (g) angle of MA cations for positive charge. θ is defined as the angle between C → N vector and MA → Pb/I vector. Orange and blue lines indicate the values in charged and non-charged regions, respectively. Averaged values are shown in dashed lines. | ||
In Fig. 5a, XA is defined as the average length of six Pb–I bonds around atom A, which is a Pb atom (Fig. 6a). In Fig. 5b, the average length of two I–Pb bonds around atom A, which is an I atom (Fig. 6b), is used as XA. From Fig. 5a and b, a longer Pb–I bond length is observed in the charged region compared to that in the non-charged region. From the electrostatic viewpoint, the elongation of Pb–I distance, which is observed in both cases of negative and positive excess charges, can be considered as the result of coulombic repulsion between the negative (positive) excess charge and I− (Pb2+). In addition, because CBM has antibonding nature between the atomic orbitals of Pb and I,66 the CBM energy level is deepened with the Pb–I distance, stabilizing the negative excess charge.
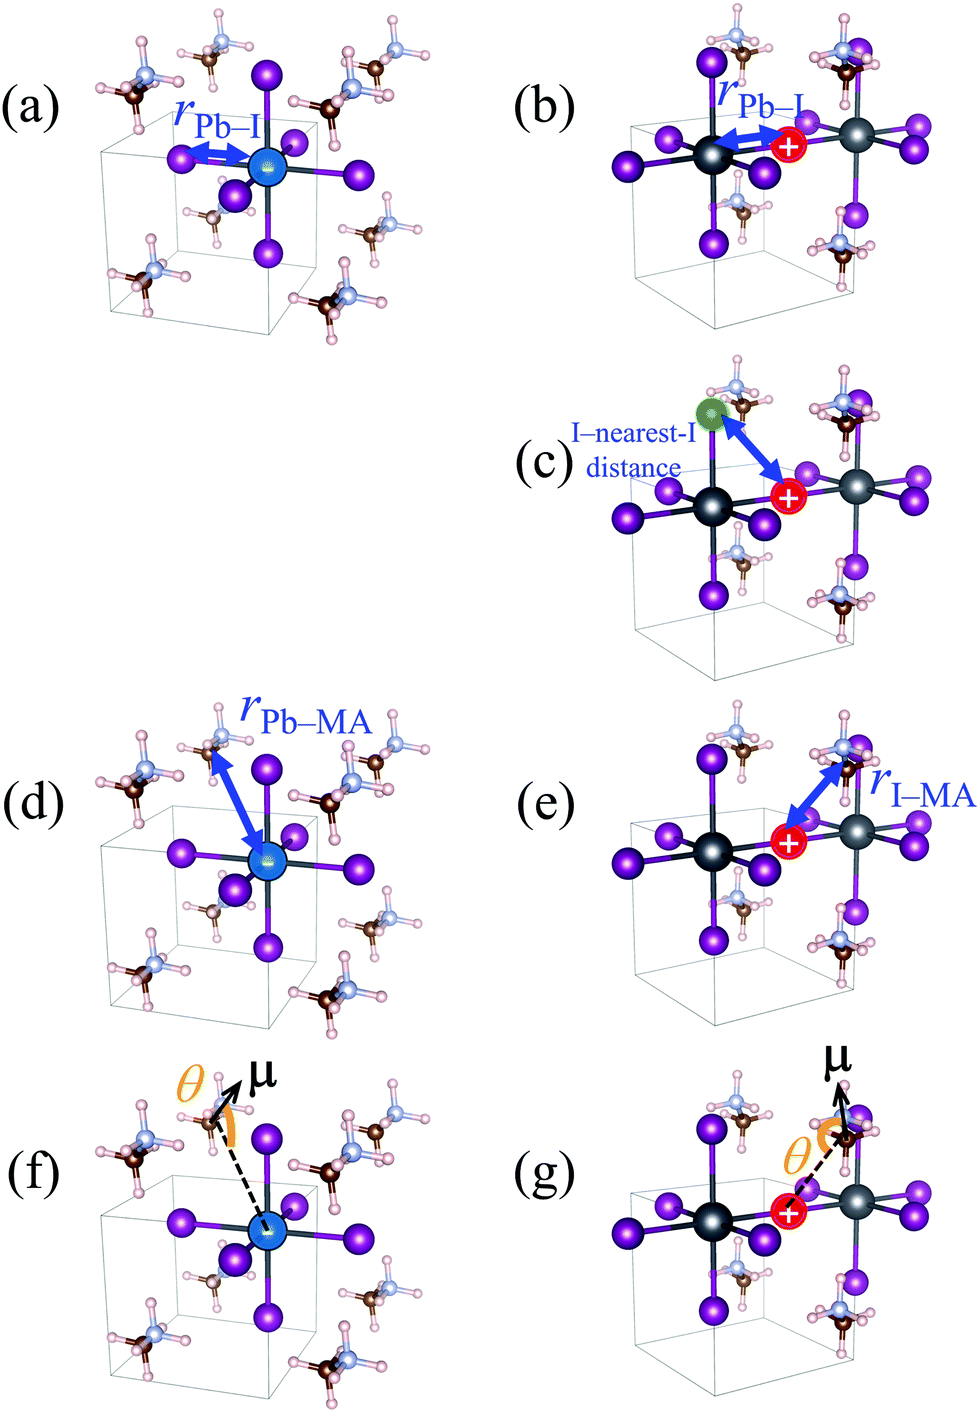 | ||
| Fig. 6 Schematic illustration of the definition of structural quantities under discussion. (a) and (b) Pb–I distance in the case of negative and positive charges, respectively. (c) I–nearest-I distance in the case of positive charge. The iodine atom indicated by green circle is the closest one to the iodine atom indicated by red circle, in each snapshot. (d) Pb–MA distance in the case of negative charge. (e) I–MA distance in the case of positive charge. (f) and (g) Angle of MA cation θ in the case of negative and positive charges, respectively. μ is the C → N vector of the MA cation, which approximates the electrostatic dipole moment of the MA cation. | ||
In the case of the positive excess charge, the distance between I atom and its nearest-neighbour I atom is shorter in the charged region than that in the non-charged region (Fig. 5c). Here, XA is defined as the distance between atom A, which is an I atom, and its nearest-neighbour I atom (Fig. 6c). This behaviour is considered to originate from the antibonding interaction between the p-orbitals of these I atoms, which raises the VBs near the VBM.
Fig. 5d shows the time-course change of the averaged Pb–MA distance in the case of negative excess charge, where XA is defined as the averaged distance between atom A, which is a Pb atom, and the neighbouring eight MA cations (Fig. 6d). The position of an MA cation is defined as the geometrical centre. As indicated in Fig. 5d, the Pb–MA distance in the charged region is shorter than that in the non-charged region. Similarly, Fig. 5e shows the averaged I–MA distance in the case of positive excess charge, where XA is the averaged distance between atom A, which is an I atom, and the neighbouring four MA cations (Fig. 6e). Fig. 5e indicates that the longer I–MA distance tends to be observed in the charged region compared to the non-charged region. Because the excess negative (positive) charge is located on the Pb (I) atoms, these tendencies are suggested to originate from the coulombic interaction between the excess negative (positive) charge and MA cations.
Fig. 5f (5g) compares the angle θ of MA cations in charged and non-charged regions for the case of excess negative (positive) charge. The angle θ, which is used as XA here, is defined as the averaged angle between the MA → Pb (MA → I) vectors and the C → N vectors in the corresponding MA cations (Fig. 6f and g). Note that the direction of C → N vector is approximately equal to that of the electric dipole moment of the MA cation. The average is taken over the nearest eight (four) MA cations around the Pb (I) atom. In the presence of negative excess charge (Fig. 5f), θ in the charged region is smaller than that in the non-charged region. Hence, in the charged region, the MA cations tend to direct their electric dipole moment to the neighbouring Pb atom, on which the negative excess charge is populated. On the other hand, in the case of positive excess charge (Fig. 5g), a larger θ is observed in the charged region compared to the non-charged region. These tendencies can be interpreted as the minimization of charge–dipole interaction energy between the excess negative (positive) charge and the electric dipole moment of the MA cations. Therefore, the dipolar rotation of the MA cations is suggested to occur in the polaron formation process.
4.3 Early stage of polaron formation: disorder and relaxation effects
Fig. 7a–g show the structural deformation in the early stage (until 100 fs from the charge injection) of polaron formation; for one-hundred 100 fs trajectories, in other words, the 100 fs trajectories starting from one-hundred different initial snapshots, the same analyses as that conducted in the previous subsection were performed and the results were averaged. These initial snapshots were obtained from the neutral NVE run, which is described in Section 3.2. The first initial snapshot was obtained at 500 fs from the beginning of the NVE run, and the others were subsequently sampled every 100 fs. For example, the Pb–I bond length shown in Fig. 7a and b has the following tendencies.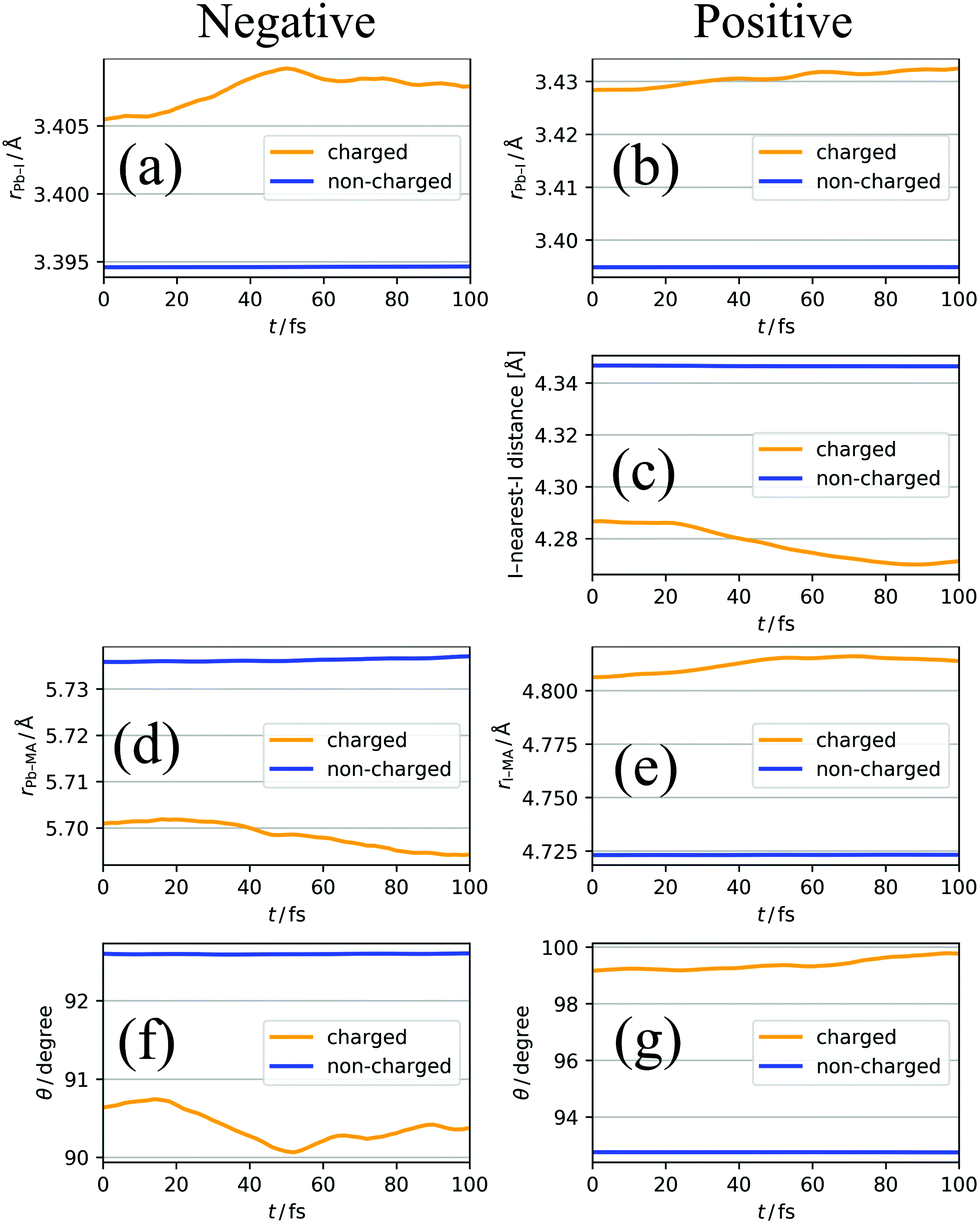 | ||
| Fig. 7 Averaged time course changes of (a) Pb–I distance for negative charge, (b) Pb–I distance for positive charge, (c) I–nearest-I distance for positive charge, (d) Pb–MA distance for negative charge, (e) I–MA distance for positive charge, (f) angle of MA cations θ for negative charge, (g) angle of MA cations for positive charge. θ is defined as the angle between C → N vector and MA → Pb/I vector. Orange and blue lines indicate the values in charged and non-charged regions, respectively. | ||
1. At t = 0, that is, the time of the excess negative (positive) charge injection, the Pb–I bond length in the charged region is larger than that in the non-charged region.
2. The Pb–I bond length in the charged region further increases as the time t passes (while the Pb–I bond length in the non-charged region does not change significantly).
The former (1) suggests that the excess charge is localized by thermal fluctuation in the structure; the injected charge localizes in the region where Pb–I bond length is already long. On the other hand, the latter (2) indicates that the excess charge affects the lattice structure, resulting in further elongation of Pb–I bonds at t > 0. Similar tendencies are found for the I–nearest-I distance (Fig. 7c), the Pb (I)–MA distance (Fig. 7d and e), and the angle of MA (Fig. 7f and g). These results suggest that, in the polaron formation process, the charge carriers are first localized by the thermal structural fluctuation, and after that, further structural deformation is caused by the relaxation of the charge carriers. Hereafter, we call the former (1) effect and the latter (2) effect as disorder effect and relaxation effect, respectively. Note that this finding, obtained from the QM-MD simulations, is consistent with that of a model Hamiltonian study by Zheng and Wang.25 In their Hamiltonian, the effects of the rotation of MA cations and the lattice vibration of the PbI3− framework were mimicked by artificial potential fluctuations and the polarization potential described by screened Coulomb potential. They compared the resulting wavefunction and its time evolution with turning on and off each (thermal disorder and polarization potential) effect, and concluded that both effects are relevant to polaron formation.
4.4 Energetic contribution for polaron formation: PbI3− framework versus MA cations
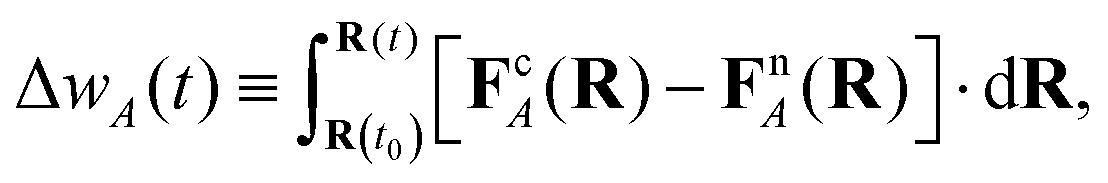
In this section, we examine the importance of each structural part, i.e., the PbI3− framework and the MA cations, regarding polaron formation, from the energetical viewpoint. Because we showed that polaron formation can be understood as a process involving two effects, that is, disorder and relaxation, in what follows, we discuss these effects separately.| Ed = 〈Ecarrier(R)〉neutral − Ecarrier(R0), | (14) |
To separately evaluate the contribution of the PbI3− framework and the MA cations for Ed, we utilize the atomic decomposition scheme of the total energy in the spirit of the energy density analysis.67 The first term in the energy expression (eqn (1)), which corresponds to the orbital interaction contribution, can be decomposed into the atomic contribution  :
:
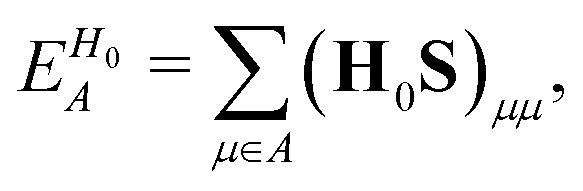 | (15) |
 | (16) |
 | (17) |
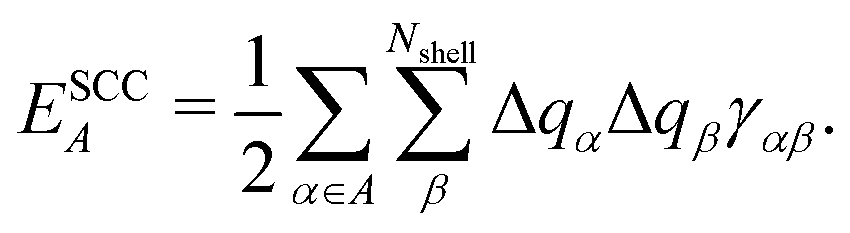
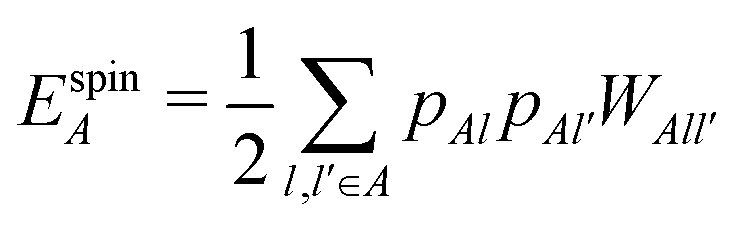
 , ESCCA, and EspinA. Tables 1 and 2 show the contribution of the PbI3− framework and MA cations with respect to each term, indicating that
  contribution of the PbI3− framework is the largest. This result implies that the disorder effect is mainly attributed to orbital interaction in the PbI3− framework.
|
|
E A SCC | E spinA | |
|---|---|---|---|
| PbI3− | 102.7 ± 2.1% | −25.9 ± 2.2% | 2.0 ± 0.1% |
| MA+ | 3.0 ± 0.4% | 18.2 ± 1.6% | 0.0 ± 0.0% |

|
|
E SCCA | E spinA | |
|---|---|---|---|
| PbI3− | 50.3 ± 2.1% | 5.3 ± 2.6% | 1.4 ± 0.1% |
| MA+ | 9.0 ± 0.5% | 34.0 ± 1.9% | 0.0 ± 0.0% |

 | (18) |
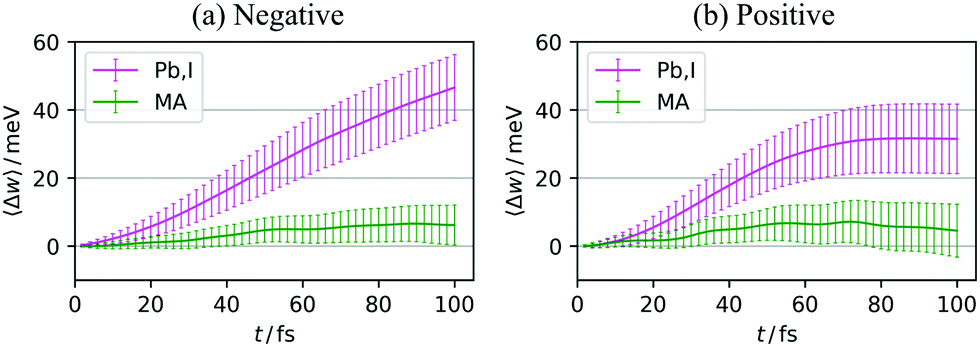 | ||
| Fig. 8 〈Δw〉 of the PbI3− framework (magenta) and MA cations (green) in the case of (a) negative and (b) positive charge carriers. The error bars indicate 95% confidence interval. | ||
5 Conclusion
Using the DC–DFTB scheme, we performed the full-QM-level MD simulations of the polaron formation process in MAPbI3 with 3072 atom supercells. The simulations provided comparable results with a nanoscale model Hamiltonian study,25 and also gave atomic-scale information as well as the first-principles studies.20,27–29We found that the structural dynamics of both PbI3− framework and MA cations involve the polaron formation process in MAPbI3. For the PbI3− framework, elongation of Pb–I bonds was observed. Particularly in the case of positive polarons, the distances between I atoms and their nearest-neighbour I atoms decreased. For the MA cations, both translational and rotational motions were observed. With respect to translational motion, the distance between Pb (I) atom and the neighbouring MA cation increased (decreased) in the case of negative (positive) polaron formation. The rotational motion was characterized by a change in the angle between the dipole moment of an MA cation and the corresponding MA → Pb (MA → I) vector. In the case of negative polaron, the angle decreased, indicating that the dipole moment was directed toward the Pb atoms, where the excess negative charge was located. On the other hand, in the case of positive polaron, the angle increased, indicating that the dipole moment reoriented to avoid the I atoms, on which the excess positive charge was populated.
In addition, we clarified that the polaron formation process, which is characterized by the above-mentioned structural deformations, underwent two steps. The first step, called the disorder effect, was the charge localization and its stabilization by thermal disorder of the structure. The second one, called relaxation effect, was the further structural deformation caused by the injected charge.
For each of these two steps, we evaluated the energetical contribution of the PbI3− framework and MA cations. These analyses were performed with the atomic energy decomposition scheme and the decomposition of the reorganization energy into the work that each atom does, for the disorder effect and relaxation effect, respectively. The results suggested that for both effects, the PbI3− framework had the primary contribution, implying that the nature of polarons in LHPs is, to a significant extent, determined by the inorganic frameworks. This conclusion can be one possible explanation of the reason why the carrier diffusion length, carrier lifetime, and electron–hole recombination rate are not significantly dependent on the cation species,69 while the dipolar rotation of MA cations themselves is actually observed in our present study.
Conflicts of interest
There are no conflicts to declare.Acknowledgements
This study was supported by the Japan Society for Promotion of Science (JSPS) Grant-in-Aid for Scientific Research (S) No. 18H05264 and Grant-in-Aid for JSPS Research Fellow No. 18J21325. Financial support was also received from the Ministry of Education, Culture, Sports, Science and Technology, Japan, as “Priority Issue on Post-K computer”. Computational resources were provided by Research Center for Computational Science, National Institutes of Natural Sciences, Okazaki, Japan. H. U. is indebted to the Research Fellowship for Young Scientists from JSPS.Notes and references
- A. Kojima, K. Teshima, Y. Shirai and T. Miyasaka, J. Am. Chem. Soc., 2009, 131, 6050–6051 CrossRef CAS PubMed.
- J.-H. Im, C.-R. Lee, J.-W. Lee, S.-W. Park and N.-G. Park, Nanoscale, 2011, 3, 4088 RSC.
- S. D. Stranks and H. J. Snaith, Nat. Nanotechnol., 2015, 10, 391–402 CrossRef CAS PubMed.
- X. Y. Chin, D. Cortecchia, J. Yin, A. Bruno and C. Soci, Nat. Commun., 2015, 6, 7383 CrossRef CAS PubMed.
- J. M. Frost and A. Walsh, Acc. Chem. Res., 2016, 49, 528–535 CrossRef CAS PubMed.
- S. D. Stranks, G. E. Eperon, G. Grancini, C. Menelaou, M. J. P. Alcocer, T. Leijtens, L. M. Herz, A. Petrozza and H. J. Snaith, Science, 2013, 342, 341–344 CrossRef CAS.
- G. Xing, N. Mathews, S. Sun, S. S. Lim, Y. M. Lam, M. Grätzel, S. Mhaisalkar and T. C. Sum, Science, 2013, 342, 344–347 CrossRef CAS PubMed.
- C. Wehrenfennig, G. E. Eperon, M. B. Johnston, H. J. Snaith and L. M. Herz, Adv. Mater., 2014, 26, 1584–1589 CrossRef CAS PubMed.
- Y. Zhao, A. M. Nardes and K. Zhu, J. Phys. Chem. Lett., 2014, 5, 490–494 CrossRef CAS PubMed.
- H. Oga, A. Saeki, Y. Ogomi, S. Hayase and S. Seki, J. Am. Chem. Soc., 2014, 136, 13818–13825 CrossRef CAS PubMed.
- Q. Dong, Y. Fang, Y. Shao, P. Mulligan, J. Qiu, L. Cao and J. Huang, Science, 2015, 347, 967–970 CrossRef CAS PubMed.
- G. D. Mahan, Many-Particle Physics, Plenum Press, New York, 1990 Search PubMed.
- J. M. Frost, K. T. Butler, F. Brivio, C. H. Hendon, M. van Schilfgaarde and A. Walsh, Nano Lett., 2014, 14, 2584–2590 CrossRef CAS PubMed.
- J. Ma and L.-W. Wang, Nano Lett., 2015, 15, 248–253 CrossRef CAS PubMed.
- C. Quarti, E. Mosconi and F. De Angelis, Phys. Chem. Chem. Phys., 2015, 17, 9394–9409 RSC.
- S. Liu, F. Zheng, N. Z. Koocher, H. Takenaka, F. Wang and A. M. Rappe, J. Phys. Chem. Lett., 2015, 6, 693–699 CrossRef CAS PubMed.
- F. Bi, S. Markov, R. Wang, Y. Kwok, W. Zhou, L. Liu, X. Zheng, G. Chen and C. Yam, J. Phys. Chem. C, 2017, 121, 11151–11158 CrossRef CAS.
- O. Yaffe, Y. Guo, L. Z. Tan, D. A. Egger, T. Hull, C. C. Stoumpos, F. Zheng, T. F. Heinz, L. Kronik, M. G. Kanatzidis, J. S. Owen, A. M. Rappe, M. A. Pimenta and L. E. Brus, Phys. Rev. Lett., 2017, 118, 136001 CrossRef PubMed.
- H. Uratani and K. Yamashita, J. Phys. Chem. C, 2017, 121, 26648–26654 CrossRef CAS.
- K. Miyata, D. Meggiolaro, M. T. Trinh, P. P. Joshi, E. Mosconi, S. C. Jones, F. De Angelis and X.-Y. Zhu, Sci. Adv., 2017, 3, e1701217 CrossRef PubMed.
- N. Pellet, P. Gao, G. Gregori, T.-Y. Yang, M. K. Nazeeruddin, J. Maier and M. Grätzel, Angew. Chem., Int. Ed., 2014, 53, 3151–3157 CrossRef CAS PubMed.
- D. P. McMeekin, G. Sadoughi, W. Rehman, G. E. Eperon, M. Saliba, M. T. Hörantner, A. Haghighirad, N. Sakai, L. Korte, B. Rech, M. B. Johnston, L. M. Herz and H. J. Snaith, Science, 2016, 351, 151–155 CrossRef CAS PubMed.
- O. A. Syzgantseva, M. Saliba, M. Grätzel and U. Rothlisberger, J. Phys. Chem. Lett., 2017, 8, 1191–1196 CrossRef CAS PubMed.
- H. Fröhlich, Adv. Phys., 1954, 3, 325–361 CrossRef.
- F. Zheng and L.-w. Wang, Energy Environ. Sci., 2019, 12, 1219–1230 RSC.
- X.-Y. Zhu and V. Podzorov, J. Phys. Chem. Lett., 2015, 6, 4758–4761 CrossRef CAS PubMed.
- A. J. Neukirch, W. Nie, J. C. Blancon, K. Appavoo, H. Tsai, M. Y. Sfeir, C. Katan, L. Pedesseau, J. Even, J. J. Crochet, G. Gupta, A. D. Mohite and S. Tretiak, Nano Lett., 2016, 16, 3809–3816 CrossRef CAS PubMed.
- J. Yin, P. Maity, M. D. Bastiani, I. Dursun, O. M. Bakr, J.-L. Brédas and O. F. Mohammed, Sci. Adv., 2017, 3, e1701793 CrossRef PubMed.
- F. Ambrosio, J. Wiktor, F. De Angelis and A. Pasquarello, Energy Environ. Sci., 2018, 11, 101–105 RSC.
- F. Ambrosio, D. Meggiolaro, E. Mosconi and F. De Angelis, ACS Energy Lett., 2019, 4, 2013–2020 CrossRef CAS.
- W. Yang, Phys. Rev. Lett., 1991, 66, 1438–1441 CrossRef CAS PubMed.
- W. Yang and T.-S. Lee, J. Chem. Phys., 1995, 103, 5674–5678 CrossRef CAS.
- T. Akama, M. Kobayashi and H. Nakai, J. Comput. Chem., 2007, 28, 2003 CrossRef CAS PubMed.
- M. Kobayashi, T. Yoshikawa and H. Nakai, Chem. Phys. Lett., 2010, 500, 172–177 CrossRef CAS.
- M. Kobayashi, T. Kunisada, T. Akama, D. Sakura and H. Nakai, J. Chem. Phys., 2011, 134, 034105 CrossRef PubMed.
- M. Kobayashi and H. Nakai, in Linear-Scaling Techniques in Computational Chemistry and Physics, ed. R. Zaleśny, M. G. Papadopoulos, P. G. Mezey and J. Leszczynski, Springer, Dordrecht, 2011, ch. 5, pp. 97–127 Search PubMed.
- M. Kobayashi and H. Nakai, Phys. Chem. Chem. Phys., 2012, 14, 7629–7639 RSC.
- T. Yoshikawa and H. Nakai, in Fragmentation: Toward Accurate Calculations on Complex Molecular Systems, ed. M. S. Gordon, Wiley, New York, 2017, ch. 10, pp. 297–323 Search PubMed.
- W. M. C. Foulkes and R. Haydock, Phys. Rev. B: Condens. Matter Mater. Phys., 1989, 39, 12520–12536 CrossRef PubMed.
- D. Porezag, T. Frauenheim, T. Köhler, G. Seifert and R. Kaschner, Phys. Rev. B: Condens. Matter Mater. Phys., 1995, 51, 12947–12957 CrossRef CAS PubMed.
- G. Seifert, D. Porezag and T. Frauenheim, Int. J. Quantum Chem., 1996, 58, 185–192 CrossRef CAS.
- M. Elstner, D. Porezag, G. Jungnickel, J. Elsner, M. Haugk, T. Frauenheim, S. Suhai and G. Seifert, Phys. Rev. B: Condens. Matter Mater. Phys., 1998, 58, 7260–7268 CrossRef CAS.
- H. Nishizawa, Y. Nishimura, M. Kobayashi, S. Irle and H. Nakai, J. Comput. Chem., 2016, 37, 1983–1992 CrossRef CAS PubMed.
- Y. Nishimura and H. Nakai, J. Comput. Chem., 2018, 39, 105–116 CrossRef CAS.
- Y. Nishimura and H. Nakai, J. Comput. Chem., 2019, 40, 1538–1549 CrossRef CAS.
- M. Wahiduzzaman, A. F. Oliveira, P. Philipsen, L. Zhechkov, E. van Lenthe, H. A. Witek and T. Heine, J. Chem. Theory Comput., 2013, 9, 4006–4017 CrossRef CAS PubMed.
- M. Gaus, Q. Cui and M. Elstner, J. Chem. Theory Comput., 2011, 7, 931–948 CrossRef CAS PubMed.
- L. Pizzagalli, J.-L. Demenet and J. Rabier, Phys. Rev. B: Condens. Matter Mater. Phys., 2009, 79, 045203 CrossRef.
- A. N. Enyashin and A. L. Ivanovskii, Chem. Phys. Lett., 2011, 509, 143–147 CrossRef CAS.
- S. Sarkar, S. Pal and P. Sarkar, J. Mater. Chem., 2012, 22, 10716–10724 RSC.
- C. Köhler, G. Seifert, U. Gerstmann, M. Elstner, H. Overhof and T. Frauenheim, Phys. Chem. Chem. Phys., 2001, 3, 5109–5114 RSC.
- J. P. Perdew, K. Burke and M. Ernzerhof, Phys. Rev. Lett., 1996, 77, 3865–3868 CrossRef CAS PubMed.
- J. C. Slater and G. F. Koster, Phys. Rev., 1954, 94, 1498–1524 CrossRef CAS.
- M. Gaus, A. Goez and M. Elstner, J. Chem. Theory Comput., 2013, 9, 338–354 CrossRef CAS PubMed.
- M. Kubillus, T. Kubař, M. Gaus, J. Řezáč and M. Elstner, J. Chem. Theory Comput., 2015, 11, 332–342 CrossRef CAS PubMed.
- H. A. Witek, C. Köhler, T. Frauenheim, K. Morokuma and M. Elstner, J. Phys. Chem. A, 2007, 111, 5712–5719 CrossRef CAS PubMed.
- C.-P. Chou, Y. Nishimura, C.-C. Fan, G. Mazur, S. Irle and H. A. Witek, J. Chem. Theory Comput., 2016, 12, 53–64 CrossRef CAS PubMed.
- Bitbucket repository, https://bitbucket.org/solccp/adpt_core.
- G. Kresse and J. Hafner, Phys. Rev. B: Condens. Matter Mater. Phys., 1993, 47, 558–561 CrossRef CAS PubMed.
- G. Kresse and J. Hafner, Phys. Rev. B: Condens. Matter Mater. Phys., 1994, 49, 14251–14269 CrossRef CAS PubMed.
- G. Kresse and J. Furthmüller, Comput. Mater. Sci., 1996, 6, 15–50 CrossRef CAS.
- G. Kresse and J. Furthmüller, Phys. Rev. B: Condens. Matter Mater. Phys., 1996, 54, 11169–11186 CrossRef CAS PubMed.
- P. E. Blöchl, Phys. Rev. B: Condens. Matter Mater. Phys., 1994, 50, 17953–17979 CrossRef PubMed.
- B. Aradi, B. Hourahine and T. Frauenheim, J. Phys. Chem. A, 2007, 111, 5678–5684 CrossRef CAS PubMed.
- H. C. Andersen, J. Comput. Phys., 1983, 52, 24–34 CrossRef CAS.
- M. G. Goesten and R. Hoffmann, J. Am. Chem. Soc., 2018, 140, 12996–13010 CrossRef CAS PubMed.
- H. Nakai, Chem. Phys. Lett., 2002, 363, 73–79 CrossRef CAS.
- R. A. Marcus and N. Sutin, Biochim. Biophys. Acta, Rev. Bioenerg., 1985, 811, 265–322 CrossRef CAS.
- H. Zhu, M. T. Trinh, J. Wang, Y. Fu, P. P. Joshi, K. Miyata, S. Jin and X.-Y. Zhu, Adv. Mater., 2017, 29, 1603072 CrossRef PubMed.
Footnote |
| † Electronic supplementary information (ESI) available. See DOI: 10.1039/c9cp04739e |
| This journal is © the Owner Societies 2020 |