
The effect of grain size on the hydration of BaZr0.9Y0.1O3−δ proton conductor studied by ambient pressure X-ray photoelectron spectroscopy†
Angelique
Jarry
*ab,
Gregory S.
Jackson
c,
Ethan J.
Crumlin
 d,
Bryan
Eichhorn
b and
Sandrine
Ricote
*c
d,
Bryan
Eichhorn
b and
Sandrine
Ricote
*c
aMaterials Science and Engineering, University of Maryland, College Park, MD 20742, USA. E-mail: ajarry@umd.edu
bChemistry and Biochemistry, University of Maryland, College Park, MD 20742, USA
cDepartment of Mechanical Engineering, Colorado School of Mines, Golden, CO 80401, USA. E-mail: sricote@mines.edu
dAdvanced Light Source, Lawrence Berkeley National Laboratories, Berkeley, CA 94720, USA
First published on 3rd December 2019
Abstract
Three BaZr0.9Y0.1O3−δ (BZY10) pellets were prepared using different sintering processes, resulting in samples with different grain sizes, from 0.3 to 5 microns. Ambient pressure X-ray photoelectron spectra were recorded in argon, steam and oxygen atmospheres (100 mTorr) in the 300–500 °C temperature range. Deconvolution of O 1s peaks reveals 4 distinct contributions: sub-surface lattice oxide, termination layer oxides, OH− and gas-phase steam in wet environments. The OH− contribution of the O 1s peak includes sub-surface incorporation of protonic defects in the lattice related to hydration as well as surface hydroxylation and molecular water adsorption. The OH− concentration increases with grain size and with decreasing the analysis depth. These results suggest that grain boundaries associated with the larger grains adsorbed water more effectively. Thus, larger grains, which increase proton conductivity in BZY10, may also enhance catalytic activity for carbonaceous fuel oxidation by facilitating increased hydration and surface carbon removal.
1. Introduction
Yttrium-doped barium zirconate (BaZr1−xYxO3−δ, BZY) is one of the most studied high-temperature proton-conductors.1–4 BZY perovskites exhibit mixed conductivity, with predominantly electronic conduction in oxidizing atmosphere and predominantly ionic (protonic defect and oxygen vacancy) conduction at lower oxygen partial pressures (PO2) below 10−6 atm.5–8 Isotope exchange measurements9 and electromotive force measurements (EMF)10 have distinguished the protonic defect contribution from the oxygen vacancy contribution of the total conductivity. Up to 600 °C BZY ionic conductivity is dominated by proton conduction, with only 1.5 and 4.5% of oxide ion conduction at 600 °C for BaZr0.9Y0.1O3−δ (BZY10) and BaZr0.8Y0.2O3−δ (BZY20) respectively.10Protonic defects  are incorporated into high-temperature proton-conducting materials according to the Stotz–Wagner hydration reaction (R1),11–13 which is exothermic with ΔH° ≈ −80 kJ mol−1.1,7,14,15Fig. 1 illustrates how surface vacancies
  provide a site for dissociative H2O adsorption and incorporation of
  into the near surface lattice.
 | (R1) |
 | ||
| Fig. 1 Illustration of the Stotz–Wagner hydration reaction, which shows proton-defect incorporation into the BZY10 lattice. | ||
In support of conductivity measurements, the presence of bulk protonic defects can be determined by thermogravimetric measurements,1,7,15–17 high temperature X-ray diffraction,18–21 proton-NMR,22 hydrogen probe,23 and Raman profilometry.24 While all the former techniques provide bulk measurements, ambient-pressure X-ray photoelectron spectroscopy (AP-XPS)25,26 offers the unique opportunity to observe surface and near-surface chemistry, up to tens of nanometers,26,27 during hydration of the high-temperature proton conductors. Furthermore, modulating the X-ray source photon energy can allow depth profiling near the surface to assess variation in interfacial chemistry as a function of depth. Our group has successfully used AP-XPS to investigate composition effect on surface chemistry of epitaxial thin films of BaCexZr0.9−xY0.1O3−δ (x = 0; 0.2; 0.9) perovskites.26 These hydration studies of BZY10 thin film led to the following conclusions:26
• Major changes upon hydration were only observed in the O 1s and Y 3d core-level spectra.
• Hydration is associated with surface secondary phase growth with oxygen under coordinated yttrium and/or yttrium hydroxide.
• The presence of sulfur (common contaminant in BaCO3) in high-temperature oxidative environments leads to the formation of surface SO42−, which rapidly desorbs from the BZY10 surface.
Measured values of protonic conductivity in BZY10 materials varies over 2 order of magnitudes (∼10−5 to ∼10−3 S cm−1 at 400 °C),2 and this wide variation in conductivities was explained by differences in ceramic processing leading to (i) barium non-stoichiometry,28,29 (ii) increased disorder in the grain-boundary region,30 (iii) presence of impurity or dopant segregation at the grain-boundaries,31–34 (iv) cross substitution of yttrium on the A-site,35 and (v) intrinsic positive charge at the grain boundary due to preferential oxygen segregation and associated proton depletion in the space charged layers.36–41
In this work, three BaZr0.9Y0.1O3−δ (BZY10) specimens were prepared with different ceramic processing techniques and investigated by AP-XPS to correlate the extent of hydration to grain microstructure. O 1s peaks are deconvoluted into four contributions, including one peak (with the second to the highest binding energy) corresponding to surface hydroxylation and adsorbed molecular water (designated OH−). This contribution appeared under humid conditions and its importance was analyzed as a function of temperature and analysis depth to reveal significant insights into how grain structure and operating conditions impact BZY10 surface activity.
2. Experimental
The three BZY10 samples were prepared as followed:• spark plasma sintering: 5 min at 1700 °C (SPS),41
• solid-state reaction without sintering aid, sintered at 1700 °C for 24 h (SSR),7
• solid-state reaction without sintering aid, conventionally sintered at 1720 °C and annealed at high temperature 2200 °C (HT).42
The information about the precursors used for the synthesis, as well as the obtained XRD patterns are summarized in Table S1 and Fig. S1 of the ESI.†
In this study, none of the BZY10 samples contain sintering aids such as Ni. The microstructure of the three samples is reported in detail elsewhere7,42,43 and summarized below in the Results section.
AP-XPS spectra at elevated sample temperatures were collected at Beamline 9.3.2 at Lawrence Berkeley National Laboratory's (LBNL) Advanced Light Source (ALS).44 BZY10 pellets were held by spring-loaded tips onto an Al2O3 plate heater. A thermocouple onto the sample surface, as illustrated in Fig. 2, provided a control temperature for the heater power. The surface of the samples was cleaned with a pretreatment at 500 °C under ultra-high vacuum (UHV) to remove adventitious carbon and to dehydrate the sample.
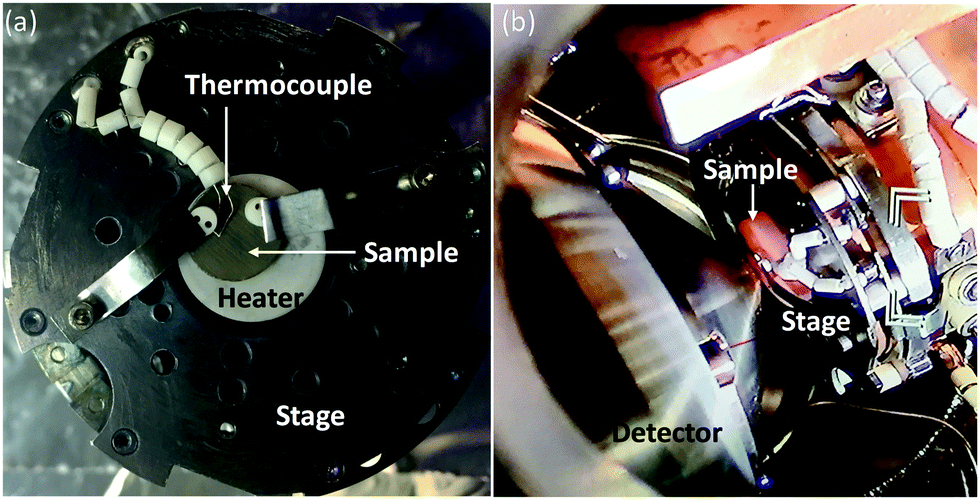 | ||
| Fig. 2 SSR BZY10 sample on the sample holder (a) outside and (b) inside the AP-XPS chamber. | ||
AP-XPS spectra were recorded at T = 300 °C and 500 °C in the following gas conditions: 100 mTorr of Ar, 100 mTorr H2O, and 100 mTorr O2. Different XPS source excitation beam energies, within the range of Beamline 9.3.2 (800 eV, 710 eV, 630 eV, 490 eV and 300 eV), were used to explore a range of near-surface depths with a spot-size of ∼0.8 mm (allowing for a statistical number of grains and grain boundaries). Table 1 summarizes the different core-electron spectra recorded for each condition. The sample was heated at about 5 °C min−1 to the test temperature and held at constant T for 20 min before collecting XPS spectra. Spectra were fitted in Casa-XPS software (Casa Software Ltd, UK, http://www.casaxps.com/) using a combined Gaussian–Lorentzian line shape and a Shirley background. Similarly to our previous work,26 the Ba 4d peak of barium perovskite at 88.9 eV was used for peak calibration. Spectra fitting and normalization are described in detail elsewhere.26
| Beam energy (eV) | Low resolution survey spectrum (eV) | High resolution spectra |
|---|---|---|
| 300 | 0–150 | Ba 4d |
| 490 | 0–390 | C 1s, Ba 4d, Y 3d, Zr 3d |
| 630 | 0–600 | O 1s, Ba 4d |
| 710 | 0–600 | O 1s, C 1s, Ba 4d, Y3d, Zr 3d |
| 800 | 0–700 | O 1s, C 1s, Ba 4d, Y 3d, Zr 3d |
Greater analysis depths can be obtained at higher beam energies. Fig. 3 represents a perovskite structure with the analysis depth for the different elements as a function of the beam energy. The stoichiometry was determined as already explained in ref. 26 (Page S2, ESI†). Beam energies were chosen to provide at least three different inelastic mean free paths (IMFP, i.e., measurement depths) for each element.
 | ||
| Fig. 3 Inelastic mean free path (IMFP) values in Angstrom (Å) calculated with Tanuma, Powell, Penn formula (TPP-2M26) for Ba 4d, Zr 3d, Y 3d and O 1s with incident photon energy of 300 eV (green), 490 eV (blue), 630 eV (red), 710 eV (orange), 800 eV (black) and 1487 eV (purple). Higher beam energies can obtain useful distinctive signal for each elements at higher depths normal to the surface, and comparison of spectra at different energies provides information of near-surface chemistry information as a function of depth. | ||
3. Results
3.1. Microstructural and chemical characterizations of the samples
The grain size ranges from 0.3–0.8 microns, ≈1 micron, ≈2–5 microns for the SPS, SSR and HT samples respectively as illustrated in Fig. 4. It is important to note that the microstructures for the SPS and SSR samples were observed on thermally etched surfaces and that the surfaces of the samples were polished before the AP-XPS measurements. | ||
| Fig. 4 Secondary electron micrographs of the thermally etched surfaces of the samples (a) SPS,43 (b) SSR and (c) fractured cross section the HT sample42 (by permission of Elsevier LDT). | ||
The conductivity and chemical compositions have been previously studied for the SPS and HT samples.43,45 Both samples exhibited similar bulk conductivity in 3% moist 5% H2.43 The bulk and grain boundary chemical compositions were also determined by atom–probe tomography.45 Both samples exhibited barium and yttrium segregation and an associated slight depletion of zirconium and oxygen at the grain boundaries. It is important to note that secondary phases such as barium oxide and yttrium oxide may be present at the grain-boundaries. The ratio for Ba, Zr, Y and O between the grain boundaries and the bulk are summarized in Table 2.
| [Ba]GB/[Ba]bulk | [Zr]GB/[Zr]bulk | [Y]GB/[Y]bulk | [O]GB/[O]bulk | |
|---|---|---|---|---|
| HT sample | 1.25 (±0.03) | 0.98 (±0.01) | 1.18 (±0.04) | 0.97 (±0.01) |
| SPS sample | 1.15 (±0.02) | 0.97 (±0.01) | 1.20 (±0.04) | 0.98 (±0.01) |
3.2. AP-XPS results
 | ||
| Fig. 5 AP-XPS wide scan elemental survey spectra collected with photon energy of 710 eV under 100 mTorr of Ar at 500 °C for the SPS, the SSR and the HT samples. | ||
Several impurities are visible on the survey spectra:
• Sulphur (161–169 eV): very little amounts are detected for the three samples and the contribution disappears at temperature under oxidative environment (desorption of SO42−). This trend is very similar to what was observed on BZY thin films.26
• Silicon (152–154 eV): the surface of the samples was polished with SiC discs. Silicon is also a common impurity in zirconia.
• Molybdenum: the doublet in the 228–233 eV energy range corresponds to the Mo 3d peaks. This impurity segregates to the surface of the samples at temperature.
These impurity peaks do not interfere with the spectral analysis of the important O 1s and Y 3d peaks. Although their presence may impact the surface chemistry to some extent, similar impurity amounts for the three samples suggest that these effects are relatively similar for all the tests.
| Sample | Expected | SPS | SSR | HT |
|---|---|---|---|---|
| Zr on B-site | 0.90 | 0.92 (±0.05) | 0.95 (±0.05) | 0.92 (±0.05) |
| Y on B-site | 0.10 | 0.08 (±0.01) | 0.05 (±0.01) | 0.08 (±0.01) |
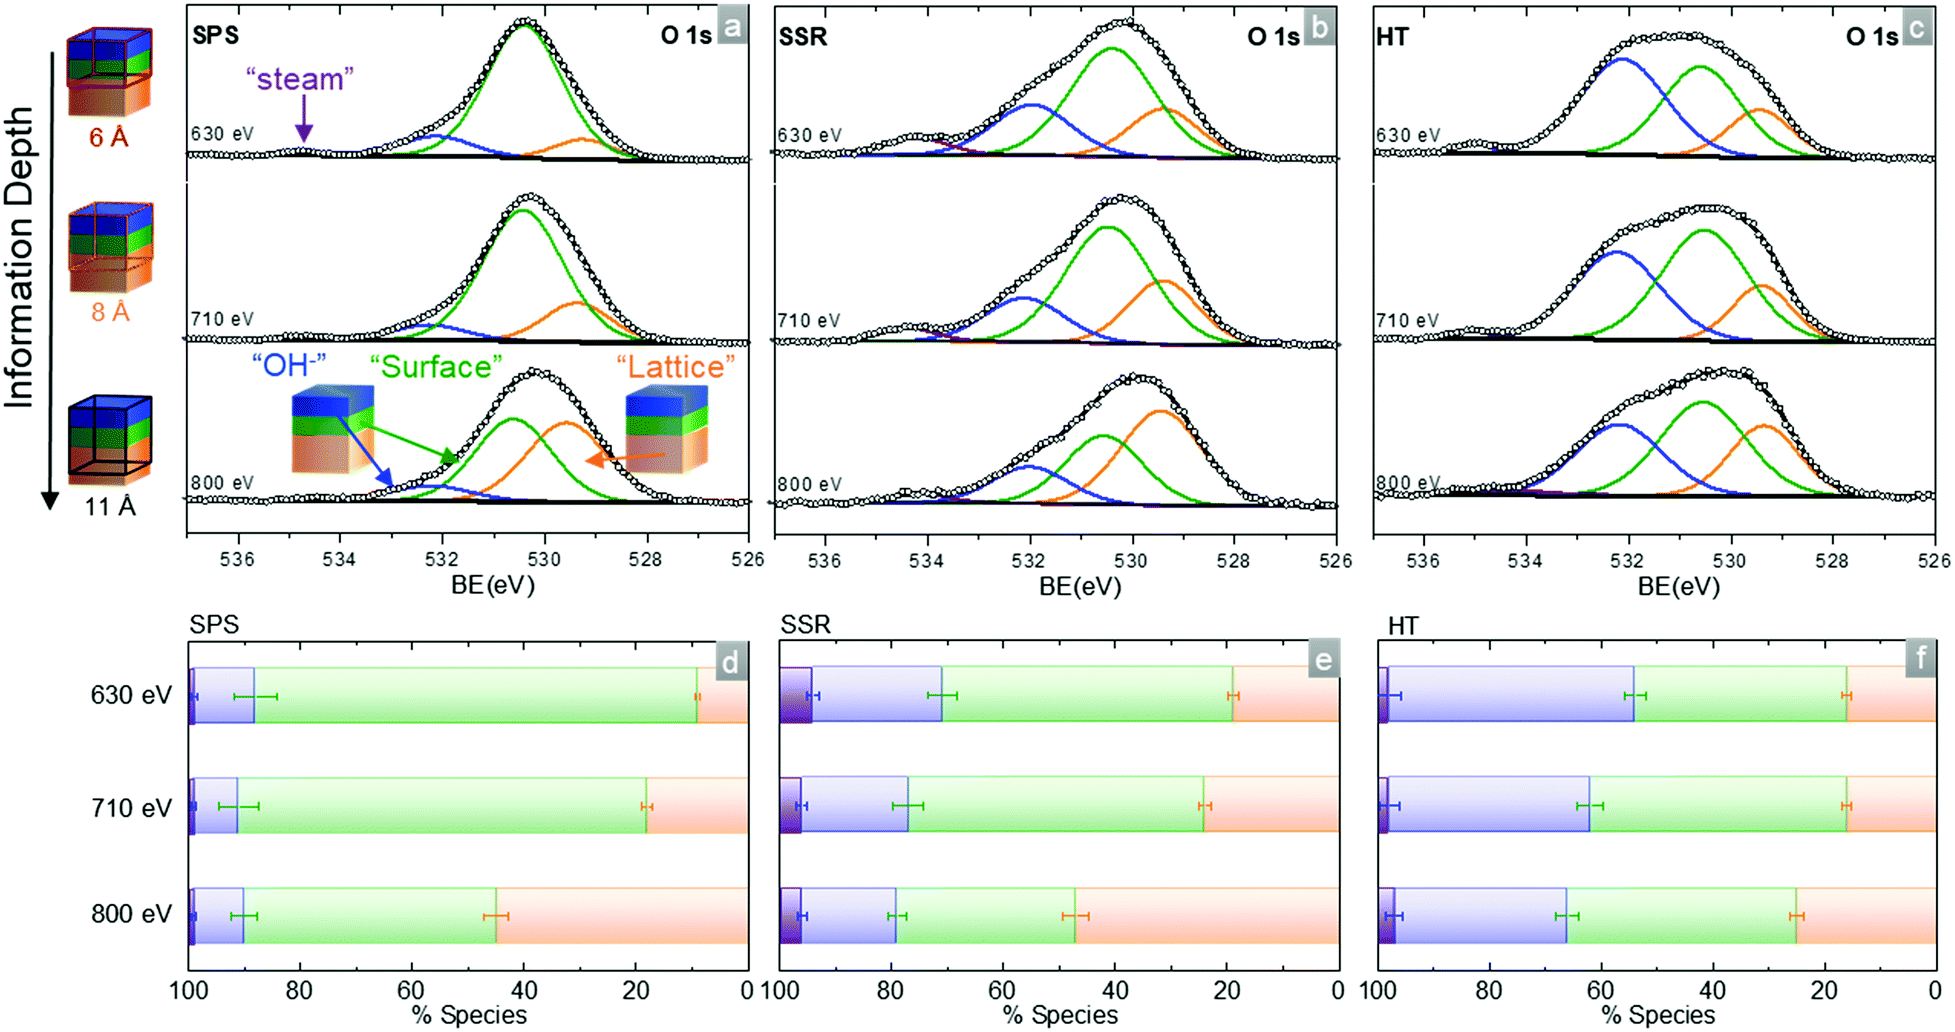
Fig. 6 compares the O 1s peak for the three samples at a photon energy of 710 eV for each of the gas compositions at 500 °C. Based on previous references,50–53 the O 1s peak can be deconvoluted into four contributions:26
 | ||
| Fig. 6 O 1s in situ AP-XPS spectra of the BaZr0.9Y0.1O3−δ (a) SPS, (b) SSR and (c) HT pellets with incident X-ray energy of 710 eV as a function of environment (100 mTorr of Ar, H2O or O2) and temperature (300 °C and 500 °C). The “lattice” component shown in orange represents the perovskite structure in the near surface regions while the “surface” component shown in green is for partially hydrated surface secondary phases with “OH−” corresponding to the hydration/adsorbed species (blue). The “steam” component is represented in purple. White circles represent the measured data, black lines correspond to the sum of fits, and grey lines are for the background. (d–f) Represent the variation in the relative contributions of “lattice”, “surface”, “OH−” and “steam” components to the total O 1s. Error bars are estimated using Monte Carlo simulations as the 95% confidence intervals.52 | ||
(1) low binding energy, ∼528.6–529.1 eV: oxygen in the perovskite lattice structure, abbreviated as O2−,
(2) medium binding energy at ∼530–530.3 eV: under-coordinated oxygen in the surface termination layer associated with partially hydrated surface secondary phases and/or adsorbates,
(3) high binding energy, at 531.5–532 eV: surface hydroxylation and molecular water adsorption (denoted “OH−”),
(4) highest binding energy, at ∼533.5–534 eV: water vapor at the surface (denoted “steam”).54
Regarding the OH− contribution, a minimal contribution for all three samples is observed under argon at 500 °C. The small OH− signal suggests residual hydration from the sample preparation in ambient air. Under 100 mTorr H2O at 300 °C, the OH− contribution is significantly larger and its intensity decreases with increasing the temperature to 500 °C. This is due to the exothermicity of the hydration reaction that leads to a drop in the concentration of protonic defects with increasing the temperature.1,7 After the treatment for 2.5 hours in oxygen at 500 °C, the sample is almost fully dehydrated, with an OH− contribution similar to the one observed under argon at 500 °C.
For the lattice O2− contribution, by comparison with the OH−, for all samples, the contribution follows the expected inverse tendency, being maximal at 500 °C under argon and oxygen, and minimal in humid atmosphere, where the samples are hydrated. One should notice that the lattice O2− signal is however significantly smaller under oxygen than under argon. This is another indication that the hydration process might be accompanied by a surface degradation process leading to the formation of secondary phases. This hypothesis is reinforced by the behavior of the medium binding energy component that gradually increases, from under argon at 500 °C to humid environment at 300 °C and then at 500 °C, while decreasing but remaining high under oxygen at 500 °C. This indicates that the medium binding energy contribution is most likely associated with secondary phases formation rather than oxygen vacancies/under-coordinated oxygen at the surface. As no significant changes in the Ba, Zr, Y stoichiometry ratio or XPS core-level spectra were observed under the different environments, the correlation with the Ba/Y grain boundaries segregation effects was not apparent.
The O 1s spectra for the three samples at 300 °C under steam (maximal hydration) presented in Fig. 7 were collected using three different photon energies. With increasing photon energy, the relative contribution of the “lattice” increases while the two other contributions decrease. This is in line with our previous work26 where the hydroxylation was also more important at the very surface of the samples. This is also in agreement with the hypothesis of surface secondary phase formation (green contribution) under moist environments.
 | ||
| Fig. 7 O 1s in situ AP-XPS spectra of the BaZr0.9Y0.1O3−δ (a) SPS, (b) SSR and (c) HT pellets as a function of the incident X-ray energy (630 eV, 710 eV, 800 eV) at 300 °C at a p(H2O) of 100 mTorr. The collection of O 1s at three different photon energies provides information from the surface to higher depth into the samples, 6 Å, 8 Å and 11 Å respectively, according to the IMFP calculation for O 1s. The “lattice” component shown in orange represents the perovskite structure in the near-surface regions while the “surface” component shown in green is for partially hydrated surface secondary phases with “OH−” corresponding to the hydration/adsorbed species (blue). The “steam” component is represented in purple. White circles represent the measured data, black lines correspond to the sum of fits, and grey lines are for the background. (d–f) Represent the variations in the relative contributions of “lattice”, “surface”, “OH−” and “steam” components to the total O 1s. Error bars are estimated using Monte Carlo simulations as the 95% confidence intervals.52 | ||
The use of ‘hydroxylation’ instead of ‘hydration’ indicates the hypothesis that the OH− contribution arises only in part from protonic defects incorporated into the lattice (reaction (R1)). Even for a fully hydrated sample, the observed OH− contribution to the O 1s is far too large considering the 1.5% of intrinsic oxygen vacancies of the bulk BaZr0.9Y0.1O3−δ. A plausible explanation for this excess resides in the peak overlaps between the species present at the BaZr0.9Y0.1O3−δ surface. Yttrium hydroxide is formed from water molecules adsorbed at the BZY10 surface. The O 1s binding energies corresponding to hydroxylation, adsorbed molecular water or hydration cannot be distinguished in our spectra. To simplify the notation these three different species are comprised in the “OH−” contribution.
4. Discussion
The above results show that the hydroxylation contribution increases from the SPS to the SSR and finally to the HT sample. This phenomenon can potentially be explained by a variety of phenomena such as changes in one or more of the following:(1) chemical composition of the grain interiors and/or boundaries,
(2) sample histories,
(3) grain sizes and morphologies of the surface.
Regarding the first hypothesis, former chemical analyses performed on the HT and SPS samples45 confirm similar grain interior/grain boundary composition ratios between the two samples (see Table 2), with barium and yttrium segregation and zirconium and oxygen depletion at the grain boundaries. Despite the similar chemical compositions, the HT sample exhibits significantly higher hydroxylation than the SPS sample. This allows us to conclude that a bulk chemical variation between samples cannot be at the origin of the effect we observed with AP-XPS.
All samples were polished and pre-heated/dehydrated following the same procedure before the AP-XPS experiments (inside the analysis chamber, 500 °C, ultra-high vacuum for several hours). We assume that the samples surface compositions were modified evenly. This rules out sample history/surface termination as a possible cause for the phenomenon we observed.
The SEM images (Fig. 4) highlight that the grain size and surface morphology of each sample is distinct. These differences appear to correlate with variations in the O 1s. Table 4 summarizes the percentage of the hydroxyl contribution to the total O 1s area as a function of the average grain size (0.3–0.8, 1 and 2–5 microns for the SPS, SSR and HT samples respectively), for the different beam energies in steam at 300 °C. It is clear that the hydroxylation contribution increases with grain size and is larger at the surface compared to the near surface/lattice (lower beam energy/IMFP).
| Grain size (μm) | % OH− contribution (IMFP ∼ 6 Å) | % OH− contribution (IMFP ∼ 8 Å) | % OH− contribution (IMFP ∼ 11 Å) |
|---|---|---|---|
| 0.3–0.8 | 10.8 | 7.8 | 8.9 |
| 1 | 22.7 | 18.7 | 17.2 |
| 2–5 | 44 | 36.3 | 31.3 |
Thus, it appears that hydration due to water adsorption and incorporation is favored in the sample with the larger grains. Even though the synthesis methods between thin films and pellets are very different and result in different termination layers, a grain-boundary-free epitaxial thin film can be essentially considered has an infinite grain with very low surface roughness. In our previous study on such epitaxial BZY10 thin film,26 the OH− contribution of hydration was no more than 7% at an IMFP of 8 Å. Thus, we cannot ascribe the hydroxylation contribution increase to the grain size alone. As discussed earlier, the main difference between the samples studied here is their grain size and associated grain boundaries and surface morphology. Therefore our hypothesis is that the grain-boundaries/surface morphology for larger grains favor hydroxylation via molecular water adsorption, as illustrated in Fig. 8. It was already mentioned that the yttrium segregates to the grain boundaries as reported in Table 2 and previous studies.36–38,41 In this work, we demonstrate that this segregation results in the formation of a high amount of stable yttrium hydroxides that effectively trap the protons. In addition, the gaseous contribution of steam (534–535 eV) is observed on the three studied BZY samples (see purple contribution in Fig. 6 and 7), which was not the case for the thin films.26 This gaseous contribution must be connected to the presence of grain-boundaries/higher roughness of the surface. These two observations are in agreement with the sketch presented in Fig. 8.
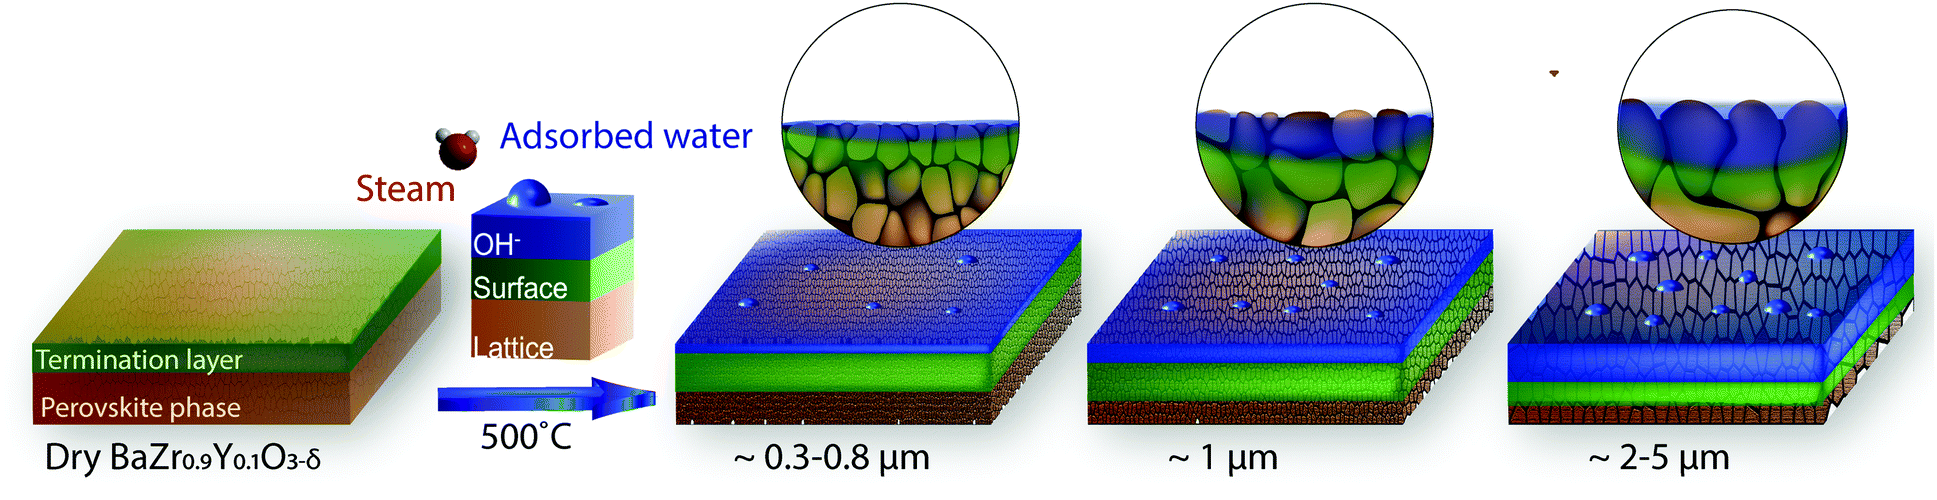 | ||
| Fig. 8 Schematic representations of the grain size effects on barium perovskites BaZr0.9Y0.1O3−δ surface chemistry. The “lattice” component for the perovskite structure in the near surface regions is shown in brown orange while the “surface” component for partially hydrated surface secondary phases on the pellet is shown in green with the blue corresponding to the hydration/water adsorption. At temperature, under partial pressure of water, larger grains favor hydration via filling of the oxygen vacancies and adsorption of water at the surface. | ||
Impedance spectroscopy measurements43 revealed very similar bulk conductivities for the samples while the larger grain one exhibited higher protonic conductivity across the grain boundaries and overall better performance. It is assumed that larger grains enhance conductivity of BZY because space-large layers at grain boundaries inhibit ionic transport and thus increase resistivity.43 As this study highlights, there is a clear affinity for grain boundaries of larger grains to adsorb water and form OH− near the surface. This increased water adsorption and OH− formation may positively impact conductivity/performance by enhancing the resistance of an electrode to surface carbon build-up. Indeed, it was shown that Ni-BZY anodes are significantly less prone to coking than Ni-YSZ in the presence of methane and water steam.4 In that work, a mechanism for coke removal in BZY fuel cell operation suggested that high levels of OH− adsorption on the BZY surface encouraged formation of COOH on the Ni nanoparticles (COOH(Ni)) to mitigate coke formation, hence, resulting in a significant improvement of the fuel cell operation performance. The present study is in line with that work and suggests that larger grains may be beneficial not only by improving the conductivity level but also by promoting surface carbon removal. We propose that this unique combination of effects is at the origin of the exceptional performance of the larger BZY grains.
5. Conclusions
Ambient-pressure X-ray photoelectron spectroscopy was used at Beamline 9.3.2 at the Advanced Light Source to correlate the extent of near-surface hydration with the grain size and associated grain boundaries. Three BaZr0.9Y0.1O3−δ (BZY10) pellets were prepared using different sintering processes: spark plasma sintering, solid state reaction followed with conventional sintering, with and without a final high temperature annealing step. The grain size of the samples ranges from 0.3 to 5 microns. AP-XPS spectra were recorded in argon, steam and oxygen atmospheres (100 mTorr) at 300 °C and 500 °C. The analysis of the O 1s peak in the different gas atmospheres and two temperatures gave two significant insights: the OH− contribution is found to increase with increasing the grain size, and to decrease with increasing the analysis depth.Previous work focused on the chemical composition and conductivity measurements of two of the present samples: SPS and HT.42 Very similar bulk values were obtained for the samples while the sample with larger grains exhibits higher protonic conductivity across the grain boundary.43 This confirms that the change in hydroxylation between the samples seems to be related mainly to the grain size and associated grain boundaries. The hypothesis proposed to explain this observation is that grain boundaries for the larger grains facilitate adsorption of molecular water, based on the presence of gaseous steam and higher OH− contribution to the O 1s.
Conflicts of interest
There are no conflicts of interest to declare.Acknowledgements
This work was supported by the Colorado School of Mines Foundation via the Angel Research Fund, the Office of Naval Research (ONR) and The Advanced Light Source (ALS) funded by the U.S. Department of Energy, Office of Science, and Office of Basic Energy Sciences under award DESC0001160 and Contract No. DE-AC02-05CH11231 respectively.References
- K. D. Kreuer, Annu. Rev. Mater. Res., 2003, 33, 333 CrossRef CAS.
- E. Fabbri, D. Pergolesi and E. Traversa, Chem. Soc. Rev., 2010, 39, 4355 RSC.
- A. Løken, S. Ricote and S. Wachowski, Crystals, 2018, 8, 365 CrossRef.
- C. Duan, R. J. Kee, H. Zhu, C. Karakaya, Y. Chen, S. Ricote, A. Jarry, E. Crumlin, D. Hook, R. Braun, N. P. Sullivan and R. O’Hayre, Nature, 2018, 557, 217 CrossRef CAS PubMed.
- N. Bonanos, Solid State Ionics, 1992, 53–56, 967 CrossRef CAS.
- F. W. Poulsen, J. Solid State Chem., 1999, 143, 115 CrossRef CAS.
- S. Ricote, N. Bonanos and G. Caboche, Solid State Ionics, 2009, 180, 990 CrossRef CAS.
- H. Zhu, S. Ricote, C. Duan, R. P. O’Hayre, D. S. Tsvetkov and R. J. Kee, J. Electrochem. Soc., 2018, 165, F581 CrossRef CAS.
- S. Ricote, N. Bonanos, M. C. Marco De Luca and G. Caboche, J. Power Sources, 2009, 193, 189 CrossRef CAS.
- D. Han, Y. Noda, T. Onishi, N. Hatada, M. Majima and T. Uda, Int. J. Hydrogen Energy, 2016, 41, 14897 CrossRef CAS.
- V. S. Stotz and C. Wagner, Ber. Bunsenges. Phys. Chem., 1960, 70, 781 Search PubMed.
- T. Norby and Y. Larring, Curr. Opin. Solid State Mater. Sci., 1997, 2, 593 CrossRef CAS.
- T. Schober, W. Schilling and H. Wenzl, Solid State Ionics, 1996, 86–88, 653 CrossRef CAS.
- T. Schober and H. G. Bohn, Solid State Ionics, 2000, 127, 351 CrossRef CAS.
- C. Kjølseth, L.-Y. Wan, R. Haugsrud and T. Norby, Solid State Ionics, 2010, 151, 1740 CrossRef.
- D. Han, K. Shinoda and T. Uda, J. Am. Ceram. Soc., 2014, 97, 643 CrossRef CAS.
- E. Fabbri, D. Pergolesi, S. Licoccia and E. Traversa, Solid State Ionics, 2010, 181, 1043 CrossRef CAS.
- C. Hiraiwa, D. Han, A. Kuramitsu, A. Kuwabara, H. Takeuchi, M. Majima and T. Uda, J. Am. Ceram. Soc., 2013, 96, 879 CrossRef CAS.
- A. K. E. Andersson, S. M. Selbach, C. S. Knee and T. Grande, J. Am. Ceram. Soc., 2014, 97, 2654 CrossRef CAS.
- R. Sazinas, M.-A. Einarsrud and T. Grande, J. Mater. Chem. A, 2017, 5, 5846 RSC.
- G. Hudish, A. Manerbino, W. G. Coors and S. Ricote, J. Am. Ceram. Soc., 2018, 101, 298 CrossRef.
- Y. Yamazaki, F. Blanc, Y. Okuyama, L. Buannic, J. C. Lucio-Vega, C. P. Grey and S. M. Haile, Nat. Mater., 2013, 12, 647 CrossRef CAS PubMed.
- P. Berger, A. Sayir and M.-H. Berger, 28th International Conference on Advanced Ceramics and Composites A: Ceramic Engineering and Science Proceedings, ed. E. Lara-Curzio and M. J. Readey, John Wiley & Sons, Inc., Hoboken, NJ, USA, 2004, vol. 25, issue 3.
- A. Slodczyk, P. Colomban, S. Willemin, O. Lacroix and B. Sala, J. Raman Spectrosc., 2009, 40, 513 CrossRef CAS.
- Q. Chen, F. El Gabaly, F. Aksoy Akgul, Z. Liu, B. S. Mun, S. Yamaguchi and A. Braun, Chem. Mater., 2013, 25, 4690 CrossRef CAS.
- A. Jarry, S. Ricote, A. Geller, C. Pellegrinelli, X. Zhang, D. Stewart, I. Takeuchi, E. Wachsman, E. J. Crumlin and B. Eichhorn, ACS Appl. Mater. Interfaces, 2018, 10, 37661 CrossRef CAS PubMed.
- S. Axnanda, E. J. Crumlin, B. Mao, S. Rani, R. Chang, P. G. Karlsson, M. O. M. Edwards, M. Lundqvist, R. Moberg, P. Ross, Z. Hussain and Z. Liu, Sci. Rep., 2015, 5, 9788 CrossRef CAS PubMed.
- F. M. M. Snijkers, A. Buekenhoudt, J. Cooymans and J. J. Luyten, Scr. Mater., 2004, 50, 655 CrossRef CAS.
- P. Babilo, T. Uda and S. M. Haile, J. Mater. Res., 2007, 22, 1322 CrossRef CAS.
- F. Iguchi, N. Sata, T. Tsurui and H. Yugami, Solid State Ionics, 2007, 178, 691 CrossRef CAS.
- W. D. Kingery, J. Am. Ceram. Soc., 1974, 57, 74 CrossRef CAS.
- M. F. Yan, R. M. Cannon and H. K. Bowen, J. Appl. Phys., 1983, 54, 764 CrossRef CAS.
- S. B. Desu and D. A. Payne, J. Am. Ceram. Soc., 1990, 73, 3398 CrossRef CAS.
- M. Shirpour, B. Rahmati, W. Sigle, P. A. van Aken, R. Merkle and J. Maier, J. Phys. Chem. C, 2012, 116, 2453 CrossRef CAS.
- A. K. Azad, C. Savaniu, S. Tao, S. Duval, P. Holtappels, R. M. Ibberson and J. T. S. Irvine, J. Mater. Chem., 2008, 18, 3414 RSC.
- C. Kjølseth, H. Fjeld, Ø. Prytz, P. I. Dahl, C. Estournes, R. Haugsrud and T. Norby, Solid State Ionics, 2010, 181, 268 CrossRef.
- M. Shirpour, R. Merkle, C. T. Lin and J. Maier, Phys. Chem. Chem. Phys., 2012, 14, 730 RSC.
- M. Shirpour, R. Merkle and J. Maier, Solid State Ionics, 2012, 216, 1 CrossRef CAS.
- J.-S. Kim, J.-H. Yang, B.-K. Kim and Y.-C. Kim, Solid State Ionics, 2015, 275, 19 CrossRef CAS.
- A. Lindman, E. E. Helgee and G. Wahnström, Solid State Ionics, 2013, 252, 121 CrossRef CAS.
- S. Ricote, N. Bonanos, H. J. Wang and B. A. Boukamp, Solid State Ionics, 2012, 213, 36 CrossRef CAS.
- S. B. C. Duval, P. Holtappels, U. F. Vogt, E. Pomjakushina, K. Conder, U. Stimming and T. Graule, Solid State Ionics, 2007, 178, 1437 CrossRef CAS.
- S. Ricote, N. Bonanos, A. Manerbino, N. P. Sullivan and W. G. Coors, J. Mater. Chem. A, 2014, 2, 16107 RSC.
- M. E. Grass, P. G. Karlsson, F. Aksoy, M. Lundqvist, B. Wannberg, B. S. Mun, Z. Hussain and Z. Liu, Rev. Sci. Instrum., 2010, 81, 053106 CrossRef PubMed.
- D. R. Clark, PhD thesis, Colorado School of Mines, 2015.
- R. Hempehnann, C. Karmonik, T. Matzke, M. Cappadonia, U. Stimming, T. Springer and M. A. Adams, Solid State Ionics, 1995, 77, 152 CrossRef.
- R. Hempelmann, M. Soetratmo, O. Hartmann and R. Wäppling, Solid State Ionics, 1998, 107, 269 CrossRef CAS.
- M. E. Bjorketun, P. G. Sundell and G. Wahnstrom, Faraday Discuss., 2007, 134, 247 RSC.
- R. Glöckner, M. S. Islam and T. Norby, Solid State Ionics, 1999, 122, 145 CrossRef.
- E. J. Crumlin, E. Mutoro, W. T. Hong, M. D. Biegalski, H. M. Christen, Z. Liu, H. Bluhm and Y. Shao-Horn, J. Phys. Chem. C, 2013, 117, 16087 CrossRef CAS.
- E. Mutoro, E. J. Crumlin, M. D. Biegalski, H. M. Christen and Y. Shao-Horn, Energy Environ. Sci., 2011, 4, 3689 RSC.
- K. A. Stoerzinger, W. T. Hong, E. J. Crumlin, H. Bluhm, M. D. Biegalski and Y. Shao-Horn, J. Phys. Chem. C, 2014, 118, 19733 CrossRef CAS.
- E. J. Crumlin, E. Mutoro, Z. Liu, M. E. Grass, M. D. Biegalski, Y.-L. Lee, D. Morgan, H. M. Christen, H. Bluhm and Y. Shao-Horn, Energy Environ. Sci., 2012, 5, 6081 RSC.
- S. Yamamoto, H. Bluhm, K. Andersson, G. Ketteler, H. Ogasawara, M. Salmeron and A. Nilsson, J. Phys.: Condens. Matter, 2008, 20, 184025 CrossRef.
Footnote |
| † Electronic supplementary information (ESI) available. See DOI: 10.1039/c9cp04335g |
| This journal is © the Owner Societies 2020 |