 Open Access Article
Creative Commons Attribution 3.0 Unported Licence
Plasma-enhanced direct conversion of CO2 to CO over oxygen-deficient Mo-doped CeO2†
Li
Wang
 *a,
Xiaomin
Du
a,
Yanhui
Yi
 b,
Hongyang
Wang
a,
Masaud
Gul
a,
Yimin
Zhu
a and
Xin
Tu
 *c
*c
aCollege of Environmental Sciences and Engineering, Dalian Maritime University, Dalian, 116026, P. R. China. E-mail: liwang@dlmu.edu.cn
bState Key Laboratory of Fine Chemicals, School of Chemical Engineering, Dalian University of Technology, Dalian 116012, P. R. China
cDepartment of Electrical Engineering and Electronics, University of Liverpool, Liverpool, L69 3GJ, UK. E-mail: xin.tu@liv.ac.uk
First published on 9th November 2020
Abstract
Plasma CO2 splitting to CO over oxygen-deficient Mo-doped CeO2 under mild conditions was investigated for the first time, showing ∼20 times higher CO2 conversion compared to pure CeO2, which can be attributed to the increased oxygen vacancies (VO) and the formation of Ce3+–VO–Mo on the catalyst surface. Importantly, VO sites showed excellent catalytic stability.
Converting CO2 to value-added fuels and chemicals has been considered as a promising route in CO2 utilization. Significant efforts have been devoted to the chemical transformation of CO2, including thermal catalysis,1 photocatalysis,2,3 electrocatalysis,4,5 and plasma catalysis.6,7 Direct splitting of CO2 to CO without using any reductant is attractive for CO2 conversion, as CO is an important chemical feedstock for the synthesis of a range of chemicals and fuels. However, this reaction has to overcome a strong thermodynamic barrier (CO2 → CO + 1/2O2, ΔH298K = 280 kJ mol−1 = 2.9 eV molecule−1) to break the C
![[double bond, length as m-dash]](https://www.rsc.org/images/entities/char_e001.gif) O bond, since CO2 is very stable. Ultrahigh temperatures (2000 K) are often required to activate CO2 (Fig. S1, ESI†).
O bond, since CO2 is very stable. Ultrahigh temperatures (2000 K) are often required to activate CO2 (Fig. S1, ESI†).
In recent years, using non-thermal plasmas (NTPs) for the activation of inert molecules with strong chemical bonds (e.g., CO2, CH4 and N2) under mild conditions has attracted significant interest, including CO2 reforming with CH4 to oxygenates,8,9 CO2 hydrogenation to methanol,10 and ammonia synthesis.11 NTP is rich in energetic electrons with a typical energy of 1–10 eV, which is sufficient to activate reactants into chemically reactive species, enabling thermodynamically unfavorable reactions (e.g. CO2 splitting) to proceed at ambient conditions.
Up until now, studies on plasma CO2 splitting to CO mainly focused on the optimization of operating parameters,12–16 and only a few catalysts (e.g., Ni/SiO2, NiO/TiO2 and Rh/TiO2) have been evaluated (Table S1, ESI†).17–20 Recently, surface oxygen vacancies (VO) have been suggested to be the active sites in plasma-catalytic CO2 splitting to CO. Mei et al. reported that higher CO2 conversion was achieved when coupling plasma with BaTiO3, which can be explained by the formation of more VO sites on the surfaces of BaTiO3 compared with TiO2.20 Chen et al. found the VO on Ni/TiO2 contributed to the enhanced CO2 dissociation.18 In fact, the coupling of catalysts and plasma is a promising strategy to improve CO2 conversion and energy efficiency. However, the knowledge in selection of appropriate catalysts for highly efficient CO2 splitting to CO using NTP was still very limited until now.
Herein, CO2 splitting to CO over M-doped CeO2 catalysts (M = Fe, Co, Ni, Cu, Cr, V, Mn or Mo) has been carried out in a dielectric barrier discharge (DBD) reactor (Fig. S2–S5, ESI†). CeO2 not only serves as a support to anchor and disperse the metal oxide particles but also generates VO active sites through the interaction with metal oxides. Significant differences were observed among the M-doped CeO2 catalysts in terms of CO2 conversion, and the Mo-doped CeO2 exhibited the best activity in CO2 conversion (Fig. S3, ESI†). Therefore, Mo-doped CeO2 has been selected for further studies.
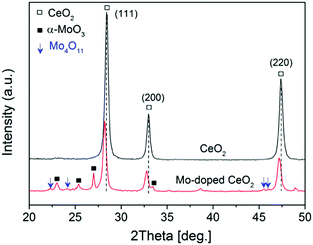
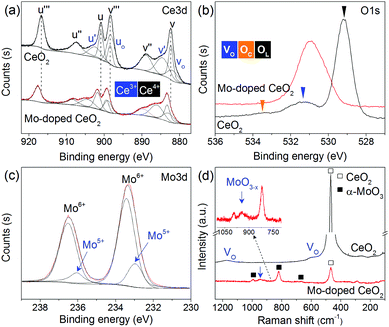
Comprehensive catalyst characterization was carried out to understand the physicochemical properties of Mo-doped CeO2. As shown in Fig. 1, the X-ray diffraction (XRD) pattern of CeO2 exhibits characteristic peaks of a cubic fluorite phase (JCPDS, 34-0394). For Mo-doped CeO2, small peaks of α-MoO3 (JCPDS, 05-0508) and Mo4O11 (JCPDS, 05-0337) are observed, revealing the coexistence of Mo(VI) and Mo(V) species. Notably, the characteristic peaks of CeO2 downshift compared to pure CeO2, which suggests that Mo doping leads to the expansion of the CeO2 unit cell. Usually, inserting Mo ions into CeO2 induces shrinkage of the CeO2 unit cell since the radius of Mo ions is much smaller than that of Ce ions, resulting in upshifting of CeO2 peaks, rather than downshifting. Thus, Mo ions do not insert into the CeO2 unit cell, and there might be other reasons responsible for this downshift. X-ray photoelectron spectroscopy (XPS) was employed to analyze surface properties of Mo-doped CeO2. The deconvoluted Ce 3d XPS spectra are presented in Fig. 2(a). The peaks labeled as v, v′′, v′′′ and u, u′′, u′′′ are assigned to 3d5/2 and 3d3/2 electrons of Ce4+, respectively, while the peaks of v′, u′ and vo, uo correspond to 3d5/2 and 3d3/2 electrons of Ce3+, respectively.21 Clearly, Ce3+ exists in CeO2 and Mo-doped CeO2, suggesting the formation of VO in both samples. More importantly, the proportion of Ce3+ in Mo-doped CeO2 is 40.2%, higher than that in CeO2 (30.0%) (Fig. S6 and S7, ESI†). This finding suggests that Mo doping induces partial transformation of Ce4+ to Ce3+ and creates more VO on Mo-doped CeO2. As reconfirmed by the O 1s XPS spectra in Fig. 2(b) and Fig. S6 (ESI†), a higher surface VO (30.4%) is achieved in the Mo-doped CeO2 in comparison to pure CeO2 (21.0%). Furthermore, the transformation of Ce4+ to Ce3+ leads to the expansion of the CeO2 unit cell since the ion radius of Ce3+ (1.23 Å) is higher than that of Ce4+ (0.97 Å),22 which explains the reason for the downshifting of CeO2 peaks in Fig. 1. More interestingly, the binding energies of Ce 3d shift significantly towards higher values after Mo doping, revealing that the electron density of the surface CeO2 species is lower in Mo-doped CeO2 compared with pure CeO2, which might be induced by the electron transfer from Ce to Mo, due to the higher electronegativity of Mo. These results suggest different properties of VO sites in the form of Ce3+–VO in CeO2 and Ce3+–VO–Mo in Mo-doped CeO2, as well as the strong interaction between Mo and CeO2, which agrees with the results of H2-temperature programmed reduction (H2-TPR), scanning electron microscopy (SEM) and transmission electron microscopy (TEM) (Fig. S8–S11, ESI†). Fig. 2(c) shows the deconvoluted Mo 3d spectra, in which the Mo-doped CeO2 sample exhibits typical doublet peaks of Mo6+ with an energy gap of ca. 3.1 eV, indicating the formation of MoO3 in Mo-doped CeO2.23 The two smaller peaks observed, however, are identified to be 3d3/2 and 3d5/2 electrons of Mo(V), demonstrating the formation of the non-stoichiometric MoO3−x,23 which is consistent with the Mo4O11 species confirmed by the XRD analysis (Fig. 1). Fig. 2(d) shows the Raman spectra of CeO2 and Mo-doped CeO2. For pure CeO2, the intense band at 465 cm−1 is well-indexed to the typical F2g modes of a cubic CeO2 fluorite structure, and the weak bands at 262, 597 and 1171 cm−1 are assigned to VO, reconfirming the XPS results in Fig. 2(a and b).23 For Mo-doped CeO2, the emerging Raman bands at 673, 824 and 997 cm−1 are assigned to MoO3 crystallites.24 However, the band at 955 cm−1 is associated with Mo suboxides (MoO3−x).24,25 These results indicate that the valence state of Mo in suboxides is Mo5+. Moreover, the presence of Mo5+ and Ce3+ indicates that more VO sites are created through the strong interaction between Mo and CeO2, as well as the calcining atmosphere with deficient oxygen and rich energetic Ar species, which agrees with the results reported by Chen et al.18
Fig. 3 shows the effect of different operating conditions on CO2 conversion. Clearly, no reaction occurred without plasma (catalyst only, 400 °C). The conversion of CO2 was 3.8% in the plasma reaction without a catalyst (plasma only). In the plasma reaction coupled with pure CeO2, the CO2 conversion dropped to 1.2%, which suggests that pure CeO2 is unfavorable for CO2 splitting to CO despite CeO2 being O-deficient. Using Mo-doped CeO2 instead of CeO2, however, results in a significant increase of CO2 conversion by a factor of 9 at 400 °C. In addition, the Mo-doped CeO2 showed stable CO2 conversion for at least 10 h (Fig. S12, ESI†). Interestingly, the reaction performance can be further improved by using a lower reaction temperature (30 °C) and an additive gas (Ar or N2). This promotional effect was more pronounced when adding N2. The highest CO2 conversion of 23.2% and energy efficiency of 14.3% were achieved in the plasma splitting of CO2 with N2 addition over Mo-doped CeO2 at 30 °C (Table S1, ESI†), while the corresponding formation rate of CO and O2 was 24.9 mmol h−1 and 12.4 mmol h−1, respectively (Table S2, ESI†). The optimal energy efficiency achieved in this study is comparable to that reported in previous works (Table S1, ESI†).
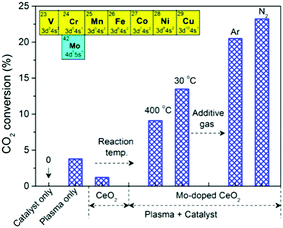 | ||
Fig. 3 Effect of reaction temperature and additive gas on CO2 conversion (CO2 flow rate 40 ml min−1, SEI 20 kJ L−1, molar ratio 4![[thin space (1/6-em)]](https://www.rsc.org/images/entities/char_2009.gif) : :![[thin space (1/6-em)]](https://www.rsc.org/images/entities/char_2009.gif) 1 and 30 °C for CO2/Ar and CO2/N2; catalyst only 400 °C). 1 and 30 °C for CO2/Ar and CO2/N2; catalyst only 400 °C). | ||
Regarding surface reactions, the improved activity over Mo-doped CeO2, on one hand, is mainly attributed to the increased formation of VO (Fig. 2 and Fig. S6, ESI†), since VO serve as adsorption centers for CO2 dissociative adsorption,17,26i.e., CO2 + VO → OL/OC + CO. On the other hand, the promoted performance originates from the different properties of VO in the forms of Ce3+–VO and Ce3+–VO–Mo due to strong interaction between Mo and CeO2 and the higher electronegativity of Mo compared with Ce (Fig. 1, 2 and Fig. S8, ESI†), which leads to a stronger binding strength of CO2 with the VO of Ce3+–VO–Mo. As discussed above, VO is the active site for CO2 activation; thus, the stability of VO greatly influences the subsequent catalytic cycle. It is well recognized that oxygen can be produced in plasma CO2 splitting, and the produced O species could poison the catalyst through filling VO sites to form stable lattice oxygen species, resulting in termination of the catalytic cycle.
Therefore, the spent Mo-doped CeO2 catalysts were further characterized by XPS, Raman, XRD and H2-TPR (Fig. 4). Interestingly, compared with the fresh catalyst, the spent Mo-doped CeO2 catalysts show an increased amount of Ce3+ and MoO3−x, which can be confirmed by the higher intensities of Ce3+ peaks and the Raman band at ∼950 cm−1 in Fig. 4(a and b), respectively. The enhancement effect is more pronounced for the catalyst used at 400 °C. Correspondingly, more VO sites were created in the high-temperature reaction (Table S3, ESI†). In addition, the color of the catalyst changed from gray/blue (MoO3−x) to yellow (MoO3−y) with x > y after the reaction at 30 °C, while no visible changes were observed on the phase structure of Mo-doped CeO2 before and after the reaction (30 °C), as shown in Fig. 4(c). These results indicate that some O atoms from CO2 splitting are adsorbed onto the catalyst, as seen by the slightly increased H2 consumption in Fig. 4(d). Even so, the VO concentration of Mo-doped CeO2 used at 30 °C remained at a similar level with that of the fresh sample (Table S3, ESI†). These findings suggest that VO-rich Mo-doped CeO2 is stable after the plasma reaction, and high-temperature reactions facilitate the formation and recovery of VO sites, resulting from accelerating recombinative desorption of adsorbed O atoms.27
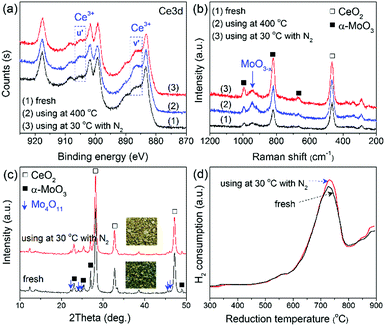 | ||
| Fig. 4 (a) XPS spectra, (b) Raman spectra, (c) XRD patterns, (d) H2-TPR profiles of Mo-doped CeO2 before and after reaction. | ||
In addition to surface reactions, gas-phase reactions also play a crucial role in the plasma-catalytic process. In a pure CO2 DBD, CO2 splitting to CO mainly proceeds through the electron impact dissociation of CO2 (CO2 + e → CO + O + e), which can be confirmed by plasma chemical kinetic modeling,28 as well as the formation of CO bands and O atomic lines detected by optical emission spectra of CO2 DBD (Fig. 5(a)). As shown in Fig. 5(a), the presence of strong N2 (C3Πu → B3Πg, B3Πg → A3Σ+u) molecular bands and Ar atomic lines suggests the formation of excited nitrogen species (N2*) and metastable Ar species (Ar*).29,30 These species create an additional reaction route for CO2 dissociation (N2* (or Ar*) + CO2 → CO + O + N2 (or Ar)), supported by the increased intensity of O atomic lines and CO bands when adding N2 or Ar, which contributes to the enhanced CO2 conversion. Furthermore, 150 ppm NOx was detected by Fourier transform infrared (FTIR) in the case of N2 addition (Fig. S13, ESI†), revealing that N2 can be regarded as an alternative scavenger of O species.12 The elimination of partial O species can effectively limit the reverse reaction, i.e., O + CO + M → CO2 + M, and thus enhance the CO2 conversion. This could explain why adding N2 has a stronger promotion on the CO2 conversion compared with Ar.
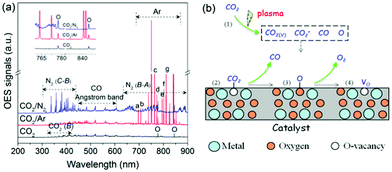 | ||
| Fig. 5 (a) Emission spectra of CO2 plasma, (b) possible pathways of plasma-catalytic CO2 splitting over VO-rich catalyst. | ||
Interaction between reactive species in the gas phase and catalyst is also crucial in plasma-catalytic reactions.31 Compared to plasma only, packing Mo-doped CeO2 into the discharge zone decreased the current (Fig. S14, ESI†), lowering the contribution of the gas-phase reactions. In this case, the CO2 conversion, however, was still improved, which might be attributed to the interaction between active species and VO-rich Mo-doped CeO2, accelerating VO recovery. Therefore, a possible reaction mechanism is proposed in Fig. 5(b). Firstly, CO2 is activated to species of CO2+, CO2(v), CO and O radicals as shown in Fig. 5(a) (step 1). Then, the energetic CO2-species are adsorbed on the VO sites to decrease their internal energy (step 2). After that, the VO sites have the potential to grasp the O atom of the adsorbed CO2 molecule, which weakens the C![[double bond, length as m-dash]](https://www.rsc.org/images/entities/char_e001.gif) O bond, producing adsorbed CO and O (step 3). Subsequently, the adsorbed CO desorbs as the final CO product. While the adsorbed O mainly desorbs from VO sites in the form of O2 through reacting with the active O radicals produced in the gas phase (Og + Oad–VO → O2,g + VO), i.e., Eley–Rideal (E–R) mechanism. Meanwhile, VO sites recover completing the catalytic cycle (step 4). Using isotope trace analysis, we demonstrated the desorption of Nad through an E–R reaction in plasma-catalytic NH3 decomposition.31 Therefore, the desorption of Oad through E–R reaction is also expected. Note that, too strong of a CO2–VO bond makes it easy to split the CO2 molecule, but the corresponding desorption of adsorbed O is difficult. By contrast, too weak of a CO2–VO bond means it could be hard to split CO2, although the adsorbed O can easily desorb from the catalyst surface. Therefore, a catalyst with a proper binding strength between VO sites and CO2 benefits the conversion of CO2 and favors the catalytic cycle.
O bond, producing adsorbed CO and O (step 3). Subsequently, the adsorbed CO desorbs as the final CO product. While the adsorbed O mainly desorbs from VO sites in the form of O2 through reacting with the active O radicals produced in the gas phase (Og + Oad–VO → O2,g + VO), i.e., Eley–Rideal (E–R) mechanism. Meanwhile, VO sites recover completing the catalytic cycle (step 4). Using isotope trace analysis, we demonstrated the desorption of Nad through an E–R reaction in plasma-catalytic NH3 decomposition.31 Therefore, the desorption of Oad through E–R reaction is also expected. Note that, too strong of a CO2–VO bond makes it easy to split the CO2 molecule, but the corresponding desorption of adsorbed O is difficult. By contrast, too weak of a CO2–VO bond means it could be hard to split CO2, although the adsorbed O can easily desorb from the catalyst surface. Therefore, a catalyst with a proper binding strength between VO sites and CO2 benefits the conversion of CO2 and favors the catalytic cycle.
In conclusion, plasma-catalytic CO2 splitting over M-doped CeO2 catalysts (M = Fe, Co, Ni, Cu, Cr, V, Mn or Mo) has been investigated. Mo-doped CeO2 exhibited the best activity; this is attributed to the increased oxygen vacancies created by strong interaction between Mo and CeO2, as well as the calcining atmosphere being oxygen-deficient and rich in Ar metastable species. Furthermore, oxygen vacancies were stable during the reaction, which is ascribed to the interaction between active O produced in the gas phase and the adsorbed O on the oxygen vacancy site, resulting in desorbing as O2 molecules and recovering oxygen vacancy sites. These findings suggest that introducing proper doping on CeO2 offers a potential route to tune properties of oxygen vacancy in CeO2. Additionally, adding N2 and Ar into the plasma process enhanced the CO2 conversion, especially when adding N2. This promotional effect is mainly attributed to the new reaction routes induced by the presence of metastable species. We found that N2 can be used as an O scavenger to forward the chemical equilibrium and inhibit the reverse reaction to form CO2.
This work was financially supported by the NSFC (No. 21908016), the Liaoning Natural Science Foundation (No. 2019-MS-023 and 2018011143-301), the key Science and Technology Project List of Ministry of Transport of the People's Republic of China (No. 2018-ZD4-027). X. Tu acknowledges the funding from the European Union's Horizon 2020 research and innovation programme under the Marie Sklodowska-Curie grant agreement no. 823745 and the State Key Laboratory of Electrical Insulation and Power Equipment at Xi’an Jiaotong University (No. EIPE19207), China.
Conflicts of interest
There are no conflicts to declare.Notes and references
- J. Zhong, X. Yang, Z. Wu, B. Liang, Y. Huang and T. Zhang, Chem. Soc. Rev., 2020, 49, 1385 RSC.
- S. Xie, Q. Zhang, G. Liu and Y. Wang, Chem. Commun., 2016, 52, 35 RSC.
- Y. Lan, Y. Xie, J. Chen, Z. Hu and D. Cui, Chem. Commun., 2019, 55, 8068 RSC.
- D. U. Nielsen, X. Hu, K. Daasbjerg and T. Skrydstrup, Nat. Catal., 2018, 1, 244 CrossRef CAS.
- X. Yuan, Y. Luo, B. Zhang, C. Dong, J. Lei, F. Yi, T. Duan, W. Zhu and R. He, Chem. Commun., 2020, 56, 4212 RSC.
- A. George, B. Shen, M. Craven, Y. Wang, D. Kang, C. Wu and X. Tu, Renewable Sustainable Energy Rev., 2021, 135, 109702 CrossRef CAS.
- A. Bogaerts, X. Tu, J. C. Whitehead, G. Centi, L. Lefferts, O. Guaitella, F. A. Jury, H. H. Kim, A. B. Murphy, W. F. Schneider, T. Nozaki, J. C. Hicks, A. Rousseau, F. Thevenet, A. Khacef and M. Carreon, J. Phys. D: Appl. Phys., 2020, 53, 443001 CrossRef CAS.
- D. Li, V. Rohani, F. Fabry, A. P. Ramaswamy, M. Sennour and L. Fulcheri, Appl. Catal., B, 2020, 261, 118228 CrossRef CAS.
- L. Wang, Y. Yi, C. Wu, H. Guo and X. Tu, Angew. Chem., Int. Ed., 2017, 56, 13679 CrossRef CAS.
- L. Wang, Y. Yi, H. Guo and X. Tu, ACS Catal., 2018, 8, 90 CrossRef CAS.
- Y. Wang, M. Craven, X. Yu, J. Ding, P. Bryant, J. Huang and X. Tu, ACS Catal., 2019, 9, 10780 CrossRef CAS.
- R. Snoeckx, S. Heijkers, K. V. Wesenbeeck, S. Lenaerts and A. Bogaerts, Energy Environ. Sci., 2016, 9, 999 RSC.
- D. Mei and X. Tu, J. CO2 Util., 2017, 19, 68 CrossRef CAS.
- D. Mei, X. Zhu, Y. He, J. D. Yan and X. Tu, Plasma Sources Sci. Technol., 2015, 24, 015011 CrossRef CAS.
- K. V. Laer and A. Bogaerts, Plasma Processes Polym., 2017, 14, 1600129 CrossRef.
- D. Ray and C. Subrahmanyam, RSC Adv., 2016, 6, 39492 RSC.
- K. Zhang, G. Zhang, X. Liu, A. N. Phan and K. Luo, Ind. Eng. Chem. Res., 2017, 56, 3204 CrossRef CAS.
- G. Chen, V. Georgieva, T. Godfroid, R. Snyders and M. Delplancke-Ogletree, Appl. Catal., B, 2016, 190, 115 CrossRef CAS.
- L. F. Spencer and A. D. Gallimore, Plasma Sources Sci. Technol., 2013, 22, 015019 CrossRef.
- D. Mei, X. Zhu, C. Wu, B. Ashford, P. T. William and X. Tu, Appl. Catal., B, 2016, 182, 525 CrossRef CAS.
- C. Anandan and P. Bera, Appl. Surf. Sci., 2013, 283, 297 CrossRef CAS.
- W. Wang, Q. Zhu, F. Qin, Q. Dai and X. Wang, Chem. Eng. J., 2018, 333, 226 CrossRef CAS.
- K. Murugappan, E. M. Anderson, D. Teschner, T. E. Jones, K. Skorupska and Y. Román-Leshkov, Nat. Catal., 2018, 1, 960 CrossRef CAS.
- B. Liu, L. France, C. Wu, Z. Jiang, V. L. Kuznetsov, H. A. Al-Megren, M. Al-Kinany, S. A. Aldrees, T. Xiao and P. P. Edwards, Chem. Sci., 2015, 6, 5152 RSC.
- K. Chen, S. Xie, A. T. Bell and E. Iglesia, J. Catal., 2001, 198, 232 CrossRef CAS.
- L. Liang, X. Li, Y. Sun, Y. Tan, X. Jiao, H. Ju, Z. Qi, J. Zhu and Y. Xie, Joule, 2018, 2, 1004 CrossRef CAS.
- P. G. Dickens and M. B. Sutcliffe, Trans. Faraday Soc., 1964, 60, 1272 RSC.
- R. Aerts, T. Martens and A. Bogaerts, J. Phys. Chem. C, 2012, 116, 23257 CrossRef CAS.
- Y. Horikawa, T. Hayashi and K. Sasaki, Jpn. J. Appl. Phys., 2012, 51, 126301 Search PubMed.
- J. B. Boffard, G. A. Piech, M. F. Gehrke, L. W. Anderson and C. C. Lin, Phys. Rev. A: At., Mol., Opt. Phys., 1999, 59, 2749 CrossRef CAS.
- L. Wang, Y. Zhao, C. Y. Liu, W. M. Gong and H. C. Guo, Chem. Commun., 2013, 49, 3787 RSC.
Footnote |
| † Electronic supplementary information (ESI) available. See DOI: 10.1039/d0cc06514e |
| This journal is © The Royal Society of Chemistry 2020 |

