 Open Access Article
Creative Commons Attribution 3.0 Unported Licence
Far-red switching DNA probes for live cell nanoscopy†
Jonas
Bucevičius
 ,
Tanja
Gilat
and
Gražvydas
Lukinavičius
 *
*
Chromatin Labeling and Imaging Group, Department of NanoBiophotonics, Max Planck Institute for Biophysical Chemistry, Am Fassberg 11, 37077 Göttingen, Germany. E-mail: grazvydas.lukinavicius@mpibpc.mpg.de
First published on 27th October 2020
Abstract
Herein we present DNA probes composed of Hoechst 33258 and spontaneously blinking far-red hydroxymethyl silicon-rhodamine (HMSiR). The best performing probe, 5-HMSiR-Hoechst, contains the 5′-regioisomer, shows ∼400-fold fluorescence increase upon DNA binding and is compatible with wash-free single molecule localization and 3D stimulated emission depletion microscopy of chromatin nanostructures in living cells.
Highlighting the main information carrier in the DNA of mammalian cells has a long history. The first reports of fluorescent DNA labelling and microscopy imaging date back to 1968, when the Swedish cytologist and geneticist Torbjörn Caspersson used quinacrine mustard, an intercalating covalent DNA binder, with fluorescent chromosome banding.1 Around the same time, Lammler and Schutze stained nuclei in animal tissues2 with Hoechst 33258, a UV-excitable minor grove binder patented by Hoechst AG in 1967.3 Due to its favourable properties – high affinity and specificity towards DNA, minimal perturbations to DNA structure and high contrast of images – Hoechst is still among the most widely used DNA dyes today.4,5 However, for long-term imaging of living cells and organisms, excitation with less phototoxic visible light is desired.6 Therefore in 2014, Nakamura et al. exploited Hoechst as a targeting moiety for delivering red shifted fluorophores to DNA.7 A year later, we introduced SiR–Hoechst as the first far-red fluorescent dye compatible with live-cell stimulated emission depletion (STED) microscopy.8 Subsequent isomeric tuning of the attached rhodamines enhanced the staining intensity and cell permeability of the DNA probes of such design.9,10 These developments aimed at improving DNA dyes compatible with the ensemble fluorescence microscopy methods, such as STED microscopy, but not for single molecule localization microscopy (SMLM) methods, which can obtain higher spatial resolution.11–14 To the best of our knowledge, there is no far-red DNA probe that is compatible with SMLM and living cell imaging available so far, and there are only several such probes that operate in other spectral regions.
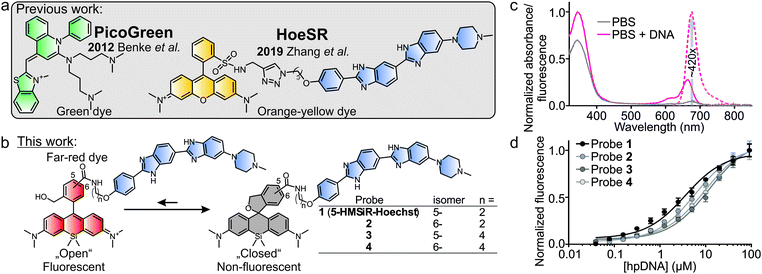
Early work exploited unmodified Hoechst 33258 and DAPI for SMLM, but the required excitation with UV light limited their application in living cells.15 The commercial cyanine dye, PicoGreen, is excitable with a blue laser, minimally perturbs DNA structure and works in living cells (Fig. 1a). Thanks to the >1000-fold fluorescence increase upon DNA binding, it yields images with low background fluorescence.16 However, stable blinking events in SMLM experiment required a special “cocktail” containing ascorbic acid, oxygen scavenging system in Leibowitz medium pH 7.2. Later, a yellow cell membrane permeable sulforhodamine Hoechst conjugate (HoeSR) was used for imaging living HeLa cells and resolved heterochromatin structures down to 70 nm (Fig. 1a).17 The main advantage of a red-shifted stain is the decreased phototoxicity and enhanced signal-to-background ratio because of lower sample autofluorescence.
Herein, we present new far-red DNA probes for SMLM in genetically unmodified living cells, which is composed of Hoechst and hydroxymethyl silicon-rhodamine (HMSiR) (Fig. 1b). Previous studies demonstrated that HMSiR halo-tag ligands do not require special buffers or cellular growth media and are cell-permeable.18,19 We optimized our probe and found that consistent with our previous results, 5′-isomer HMSiR-Hoechst conjugates stain the nucleus of living cells more efficiently than 6′-regioisomer HMSiR-Hoechst conjugates.9 Furthermore, we demonstrate that a shorter linker (two –CH2– units) between HMSiR and Hoechst leads to highly efficient quenching of the fluorescence in the unbound state, increases affinity for DNA and allows no-wash SMLM imaging of DNA in living cells. 5-HMSiR-Hoechst allowed recording time-lapse SMLM movies and observation of directly labelled DNA dynamics in living cells at nanoscale.
The pure 5′- and 6′-regioisomers of the dye were obtained by adapted synthesis versions described previously18 (Schemes S1 and S2, ESI†). With the fluorophores in hand, we have synthesized four DNA probes containing the bisbenzimide core which is exploited as a DNA-targeting ligand for several classes of Hoechst-based dyes.7,9 We followed the general synthesis procedure consisting of three steps: alkylation of Hoechst 33258 with Boc-protected 4-bromobutan-1-amine or Boc-protected 2-bromoethane-1-amine, Boc protection group removal and coupling to the in situ prepared NHS ester of the HMSiR dye (Scheme S3, ESI†). The average yield of convergent synthesis starting from Hoechst 33258 was ∼24%.
In vitro characterization demonstrated that the free probe has absorbance maximum at ∼340 nm (Hoechst peak) and shows almost no fluorescence at both Hoechst and HMSiR maxima. Upon DNA binding, the absorbance at ∼340 nm slightly increases, absorbance at ∼665 nm (HMSiR peak) increases ∼8-fold and the fluorescence at ∼675 nm is boosted by >400-fold while exciting at HMSiR peak (Fig. 1c and Fig. S1, ESI†). Importantly, the estimated extinction coefficient for probe–DNA complex at HMSiR absorption maximum is significantly lower compared to the free dye in ethanol + 0.1% TFA (Table S1, ESI†), suggesting that only a small fraction of the spiroether is “opened” after binding DNA. Next, we evaluated the binding affinity of the new DNA probes by performing titration with the hairpin target DNA (hpDNA). All binding curves could be fitted to a single-site binding model (Fig. 1d). Short linker (two –CH2– units) containing probes 5-HMSiR-Hoechst (1) and 2 showed slightly higher affinity compared to longer linker (four –CH2– units) containing probes 3 and 4 (Fig. 1d and Table S2, ESI†). In agreement with our previous study,9 5-HMSiR-Hoechst (1) or 3 and DNA complex fluorescence lifetime could be fitted to the single exponent model, while the corresponding 6′-isomer probes 2 and 4 demonstrated bi-exponential fluorescence decay (Fig. S2 and Table S2, ESI†) resulting from the dual binding mode to the target DNA.
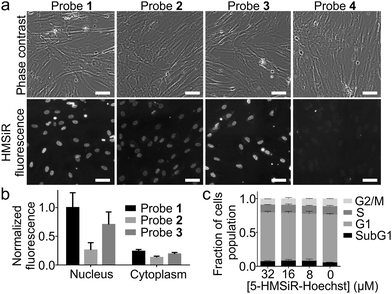
Next, we stained human fibroblasts with 100 nM probes and imaged them using a wide-field fluorescent microscope without washing step. Probes 1–3 stained nuclear DNA and produced good signal to background ratio (Fig. 2a and b). Probe 4, containing long linker and 6′-isomer of HMSiR, showed no DNA staining (Fig. 2a). This observation is consistent with our previous observation – stronger DNA staining signal is produced by rhodamine 5′-isomers compared to 6′-isomers. We observed that linker shortening lead to beneficial effects: increased affinity for the target DNA, stronger fluorescence quenching of the unbound probe and enhanced cell permeability (Table S2, ESI†).
Hoechst itself and its derivatives are known to inhibit DNA topoisomerase which results in cell cycle perturbations.20 Thus we performed 24 h treatment of HeLa cells with all probes and found no influence at high concentrations which by far exceed the typical concentrations used for imaging experiments (Fig. 2c and Fig. S3, ESI†). Finally, based on all in vitro and in cellulo data we have identified probe 1 (5-HMSiR-Hoechst) as the best performing stain.
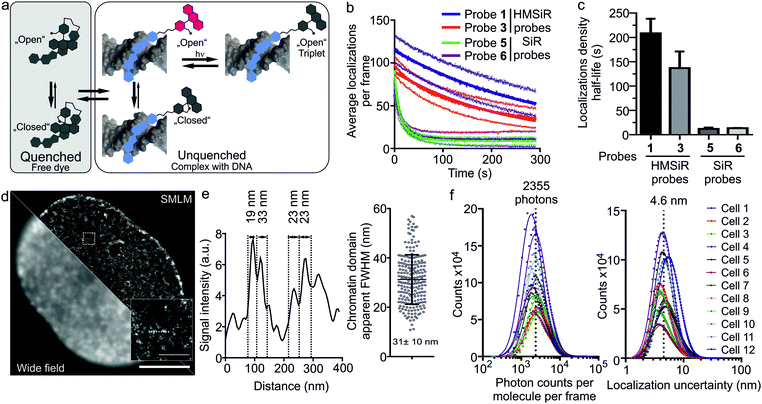
The design of the new probes exploits a fluorescence “OFF–ON” transformation upon binding to DNA. We hypothesize that the free probes remain in the dark state because of two fluorescence quenching mechanisms: HMSiR propensity towards intramolecular spirocyclization leading to formation of non-absorbing spiroether (“closed” form) and the remaining fluorescent form quenching via the intermolecular interaction with bisbenzimide core. Upon binding to DNA, intermolecular quenching is relieved and spiroether ring opening (“open” form) can lead to the appearance of the fluorescence and “blinking” behaviour (Fig. 3a). Such dual-quenching mechanism should lead to extremely low background fluorescence, allowing no-wash total internal reflection fluorescence (TIRF) SMLM measurements in living cells at relatively high probe concentrations.
Indeed, we were able to perform all imaging experiments at 100 nM. Based on our wide-field imaging data, we expected that the first frames would contain too dense population of the switched “ON” 5-HMSiR-Hoechst molecules, which can be rapidly switched “OFF” by intense excitation laser. This transition is most likely due to the triplet state accumulation (Fig. 3a). In agreement, we observed too high density of emitters in the first few hundred frames followed by resolvable single molecule “blinking” events (Fig. S4, S5 and Video S1, ESI†).
The observed “blinking” can stem from two mechanisms: the spiroether formation equilibrium and the intramolecular quenching modulated by the binding–unbinding of fluorescent probe to the target DNA. To elucidate which mechanism is predominant, we measured the blinking of the probes 5 and 6 based on the classical carboxyl derivative of silicon rhodamine (SiR) and containing short or long linker respectively (Fig. S6a, ESI†). Both SiR probes demonstrated blinking that lasted only up to 20 seconds, approximately 10-fold less compared to the corresponding HMSiR probes 1 and 3. This resulted in a poor quality of the reconstructed images (Fig. S6b and S7, ESI†). Affinity towards target DNA of SiR (5–6) and HMSiR probes (1–4) are closely similar suggesting that the reversible binding and probe exchange make little contribution to the “blinking” events (Table S1 and Fig. S8, ESI†). Most likely, the poor blinking of SiR probes is due to the significant fraction of fluorophores bleaching without recovery (Fig. S7b, ESI†). In addition, this underlines the importance of the spiroether – alcohol equilibrium for the long lasting switching events (Fig. 3b and c).
The recorded movie of blinking fluorophores was processed with SVI Huygens Localizer software. The positions of the emitters were determined by fitting each fluorescence event to the 2D Gaussian distribution and allowed by reconstruction of a super-resolution image revealing structural DNA arrangement in the nucleus at nanoscale (Fig. 3d). The measured chromatin domain FWHM equal to 31 ± 10 nm (Fig. 3e) is in a good agreement with the results obtained by ChromEMT method (∼24 nm).21 The quantification analysis of SMLM imaging revealed that the average number of photons detected per dye molecule per frame is ∼2300 (Fig. 3f) and the average uncertainty of molecular localizations is 4.6 nm (Fig. 3f). This is ∼4-fold better compared to the previously reported yellow HoeSR dye.17 The staining of nuclei in living HeLa and U-2 OS cell lines yielded similar quality of the reconstruction images (Fig. S9, ESI†). Finally, we took advantage of long lasting blinking of the 5-HMSiR-Hoechst probe and were able to reconstruct movie showing fast chromatin dynamics (Video S2, ESI†).
In addition, we found that at high concentration 5-HMSiR-Hoechst (1) probe can be used for 3D STED nanoscopy, although the brightness is low (Table S2, ESI†) and high excitation laser power is required. We have not observed the probe “blinking” most likely because STED is a scanning microscopy method and the time required to scan full frame is significantly longer compared to the HMSiR switching time. This allowed localization of the probe to heterochromatin region at the periphery of the nucleus (Fig. S10a and Video S3, ESI†). We obtained the increase in z-axis resolution down to ∼175 nm which is ∼4-fold better compared to standard confocal resolution (∼700 nm) (Fig. S10b, ESI†).
In summary, we have designed and synthesized a series of hydroxymethyl silicon-rhodamine 5′-/6′-regioisomers and Hoechst conjugates with variable linker lengths. The best performing DNA stain, 5-HMSiR-Hoechst, consisted of 5′-regioisomer linker via short linker. Its good DNA binding constant (KD = 3.5 ± 0.3 μM) and up to 400-fold increased fluorescence turn on after binding to the target DNA, enabled wash-free TIRF SMLM and 3D STED imaging of the nucleus DNA in live cells. Therefore, 5-HMSiR-Hoechst demonstrates excellent potential for providing structure-related information of chromatin in future studies.
The authors are grateful to Dr Vladimir Belov, Jan Seikowski, Jens Schimpfhauser and Jürgen Bienert for the NMR/ESI-MS measurements of numerous probes. They also acknowledge Dr Peter Lenart and Dr Antonio Politi (Live-cell Imaging Facility) for the opportunity to perform live-cell TIRF SML imaging. The authors are grateful to Dr Georgij Kostiuk and Dr Rūta Gerasimaitė for help with FWHM measurements. The authors thank Dr Stefan Stoldt for help with 3D STED imaging. JB and GL are grateful to the Max Planck Society for a Nobel Laureate Fellowship. The authors acknowledge Jaydev Jethwa and Dr Rūta Gerasimaitė for critical reading of the manuscript. Open Access funding provided by the Max Planck Society.
Conflicts of interest
There are no conflicts to declare.Notes and references
- T. Caspersson, S. Farber, G. E. Foley, J. Kudynowski, E. J. Modest, E. Simonsson, U. Wagh and L. Zech, Exp. Cell Res., 1968, 49, 219–222 CrossRef CAS.
- G. Lammler and H. R. Schutze, Naturwissenschaften, 1969, 56, 286 CrossRef CAS.
- Ag Hoechst, Meister Lucius and Brüning, Patent OA2583A, 1967.
- J. Bucevičius, G. Lukinavičius and R. Gerasimaitė, Chemosensors, 2018, 6, 18 CrossRef.
- S. Bhaduri, N. Ranjan and D. P. Arya, Beilstein J. Org. Chem., 2018, 14, 1051–1086 CrossRef CAS.
- S. Waldchen, J. Lehmann, T. Klein, S. van de Linde and M. Sauer, Sci. Rep., 2015, 5, 15348 CrossRef.
- A. Nakamura, K. Takigawa, Y. Kurishita, K. Kuwata, M. Ishida, Y. Shimoda, I. Hamachi and S. Tsukiji, Chem. Commun., 2014, 50, 6149–6152 RSC.
- G. Lukinavicius, C. Blaukopf, E. Pershagen, A. Schena, L. Reymond, E. Derivery, M. Gonzalez-Gaitan, E. D'Este, S. W. Hell, D. Wolfram Gerlich and K. Johnsson, Nat. Commun., 2015, 6, 8497 CrossRef CAS.
- J. Bucevicius, J. Keller-Findeisen, T. Gilat, S. W. Hell and G. Lukinavicius, Chem. Sci., 2019, 10, 1962–1970 RSC.
- J. Bucevičius, G. Kostiuk, R. Gerasimaitė, T. Gilat and G. Lukinavičius, Chem. Sci., 2020, 11, 7313–7323 RSC.
- T. Klein, S. Proppert and M. Sauer, Histochem. Cell Biol., 2014, 141, 561–575 CrossRef CAS.
- B. Huang, M. Bates and X. Zhuang, Annu. Rev. Biochem., 2009, 78, 993–1016 CrossRef CAS.
- S. W. Hell, Science, 2007, 316, 1153–1158 CrossRef CAS.
- S. J. Sahl, S. W. Hell and S. Jakobs, Nat. Rev. Mol. Cell Biol., 2017, 18, 685–701 CrossRef CAS.
- A. T. Szczurek, K. Prakash, H. K. Lee, D. J. Zurek-Biesiada, G. Best, M. Hagmann, J. W. Dobrucki, C. Cremer and U. Birk, Nucleus, 2014, 5, 331–340 CrossRef.
- A. Benke and S. Manley, ChemBioChem, 2012, 13, 298–301 CrossRef CAS.
- X. Zhang, Z. Ye, X. Zhang, H. Man, Z. Huang, N. Li and Y. Xiao, Chem. Commun., 2019, 55, 1951–1954 RSC.
- S. N. Uno, M. Kamiya, T. Yoshihara, K. Sugawara, K. Okabe, M. C. Tarhan, H. Fujita, T. Funatsu, Y. Okada, S. Tobita and Y. Urano, Nat. Chem., 2014, 6, 681–689 CrossRef CAS.
- R. Tachibana, M. Kamiya, A. Morozumi, Y. Miyazaki, H. Fujioka, A. Nanjo, R. Kojima, T. Komatsu, T. Ueno, K. Hanaoka, T. Yoshihara, S. Tobita and Y. Urano, Chem. Commun., 2020 10.1039/D0CC05126H.
- A. Y. Chen, C. Yu, A. Bodley, L. F. Peng and L. F. Liu, Cancer Res., 1993, 53, 1332–1337 CAS.
- H. D. Ou, S. Phan, T. J. Deerinck, A. Thor, M. H. Ellisman and C. C. O'Shea, Science, 2017, 357(6349), eaag0025 CrossRef.
Footnote |
| † Electronic supplementary information (ESI) available: Synthesis, schemes and characterisation of compounds, Fig. S1–S9, Tables S1 and S2, molecular biology, biochemical and microscopy methods. Videos S1–S3. See DOI: 10.1039/d0cc06759h |
| This journal is © The Royal Society of Chemistry 2020 |


![[thin space (1/6-em)]](https://www.rsc.org/images/entities/char_2009.gif) 000 cells,
000 cells, 