Dual luminescent lanthanide coordination polymers for ratiometric sensing and efficient removal of Hg2+†
Peiyao
Lv
,
Ying
Cao
,
Zi
Liu
,
Rong
Wang
,
Baoxian
Ye
and
Gaiping
Li
 *
*
College of Chemistry, Zhengzhou University, Zhengzhou, 450001, PR China. E-mail: lgpingzy@zzu.edu.cn; Fax: +86 0371 67763654; Tel: +86 0371 67781757
First published on 26th November 2019
Abstract
In this work, we report a new fluorescence ratiometric method for Hg2+ assay based on the dual-ligand fluorescent probe GMP–Tb–luminol coordination polymers (CPs), which can be excited at the same wavelength and reveal characteristic luminescence of Tb3+ and luminol with spectrally distinguishable emission peaks. The addition of Hg2+ leads to the decrease of Tb3+ luminescence due to the higher coordination between Hg2+ and GMP, which inhibits energy transfer from GMP to Tb3+. Meanwhile, the fluorescence of luminol increases because of the aggregation-induced emission phenomenon. Therefore, a ratiometric fluorescent sensor for Hg2+ assay can be constructed by measuring the ratio of fluorescence intensity of luminol at 430 nm (I430) to that of Tb3+ at 548 nm (I548). Under the optimal conditions, the fluorescence intensity ratio I430/I548 exhibits a good linear relationship versus the concentration of Hg2+ in the range from 5 nM to 130 μM with a low detection limit of 1.3 nM. Additionally, the probe can also adsorb Hg2+ in water with high efficiency, which makes Hg2+ removal in water possible. The proposed method has been successfully used for the determination of Hg2+ in tap water, indicating its potential applications in the detection of Hg2+ pollution in environmental water.
1. Introduction
Mercury ions (Hg2+) are among the most toxic heavy metal ions, and among all the hazardous heavy metals, the limit of mercury prescribed by the World Health Organization (WHO) is the lowest due to its significant toxicity.1–3 Besides, its non-biodegradability makes it a persistent contaminant with long-lasting severe effects on organisms and the environment.4–6 Therefore, the development of highly selective functional materials to determine and simultaneously remove Hg2+ is urgently needed for environmental protection.Fluorescence is a desired technique for Hg2+ assay owing to its unique properties, such as multiparametric nature, high sensitivity, easy operation, rapid response, diversity of emerging novel probes, and so on.7–9 However, the sometimes complicated synthesis procedure, which is time consuming, and consumption of toxic organic reagents, as well as the poor water-solubility of the probes, have often hindered its practical applications.10–13 Recently, lanthanide coordination polymer (Ln-CP) based fluorescent sensors have gained increasing attention because of their appealing advantages, including excellent optical properties, facile preparation, tailorability of the structure and components, and the adaptive inclusion ability for enwrapping guest materials.14–17 Particularly, the lattermost is conveniently used for encapsulation of quantum dots or fluorescent dyes as an internal calibration to prepare dual-emission probes for ratiometric assay.18,19 These ratiometric sensors give response signals by self-calibration of two different emission intensities, and this can largely eliminate the fluctuations arising from the instrument and environment in the luminescence intensity measurement.20,21 Therefore, they can provide more accurate results than traditional turn-on or turn-off type sensors with the change in single-wavelength-intensity, and thus are more desirable for practical applications.
Although it is easy to incorporate fluorophores into Ln CPs through the self-assembly process to prepare dual-emission probes, the doped materials are often not covalently linked with the central metal ions, and this may lead to instability of the probe, particularly for long-duration or complicated sample measurements.22,23 Hence, the quest to prepare a stable Ln CP-based dual-emission probe for ratiometric assay is of significant importance. A convenient strategy is to introduce a suitable cofactor ligand with appropriate luminescence and coordination properties to construct a stable dual-emission probe, and luminol was recently proven to be a suitable candidate.24,25
In this work, we chose GMP and luminol as two bridging ligands to coordinate with Tb3+ to form GMP–Tb–luminol CPs through self-assembly, where GMP served as the antenna ligand to switch on the Tb3+ luminescence via energy transfer. Under single wavelength irradiation, the obtained GMP–Tb–luminol emitted characteristic fluorescence of luminol and Tb3+ with good separate peaks. In the presence of Hg2+, the fluorescence of Tb3+ was quenched, while that of luminol increased. This phenomenon makes ratiometric assay for Hg2+ feasible, and the possible sensing mechanism was speculated. Very interestingly, we found that the proposed probe could also efficiently remove Hg2+ from water simultaneously.
2. Experimental
2.1 Chemicals
Guanine monophosphate (GMP) was obtained from Sangon Biotech Co., Ltd. (Shanghai, China). Mercuric nitrate (Hg(NO3)2), terbium nitrate pentahydrate (Tb(NO3)3·5H2O), N-2-hydroxyethylpiperazine-N′-ethanesulfonic acid (HEPES), luminol and metal salts were provided by Aladdin Co., Ltd. (Shanghai, China). All chemicals were of analytical grade and were used without further purification. The ultrapure water (18.2 MΩ cm) used in all the experiments was from a Thermo Scientific Barnstead Gen Pure water purification system (Thermo Fisher Scientific Co. Ltd., Shanghai, China). HEPES buffer (100 mM) was prepared through dissolving HEPES in ultrapure water, and the pH value was adjusted with NaOH (1.0 M).2.2 Instruments
The fluorescence spectra were collected on a 970CRT fluorescence spectrometer (Shanghai, China) with a xenon lamp as the excitation source. The morphologies of the products were characterized by using scanning electron microscopy (SEM, Sigma 500, Gemini, Japan). A Lambda 35 UV-vis spectrometer (Pgeneral Instrument, Beijing, China) was used to record the UV-vis absorption spectra. The removal efficiency was evaluated by measuring residual Hg2+ in the supernatant using an atomic fluorescence spectrometer (AFS-933).2.3 Synthesis of fluorescent probes
GMP–Tb was firstly synthesized through a facile self-assembly process.23 Briefly, Tb(NO3)3 (1 mL, 10 mM) was added to 1 mL HEPES buffer (0.1 M, pH 7.4) containing GMP (10 mM), and stirred for 3 h at room temperature. The product was centrifuged (10![[thin space (1/6-em)]](https://www.rsc.org/images/entities/char_2009.gif) 000 rpm, 5 min) and washed three times with ultrapure water. Then, GMP–Tb was re-dispersed in 1 mL HEPES buffer. GMP–Tb–luminol was prepared by adding luminol (10 mM, 10 μL) and stirring for 10 min. Finally, the obtained GMP–Tb–luminol mixture was stored at 4 °C prior to use.
000 rpm, 5 min) and washed three times with ultrapure water. Then, GMP–Tb was re-dispersed in 1 mL HEPES buffer. GMP–Tb–luminol was prepared by adding luminol (10 mM, 10 μL) and stirring for 10 min. Finally, the obtained GMP–Tb–luminol mixture was stored at 4 °C prior to use.
2.4 Fluorescence assay of Hg2+
In the case of Hg2+ assay, Hg2+ stock solution was added to the GMP–Tb–luminol mixture (500 μL, sensor 1) with different concentrations (0, 0.005, 0.2, 10, 25, 40, 50, 80, 100 and 130 μM), and mixed well. After leaving the mixture to stand for 6 min at room temperature, fluorescence emission spectra were recorded under 310 nm excitation. After sensing, the mixture was centrifuged, and the residual Hg2+ in the supernatant was measured by AFS to evaluate the removal efficiency (Scheme 1).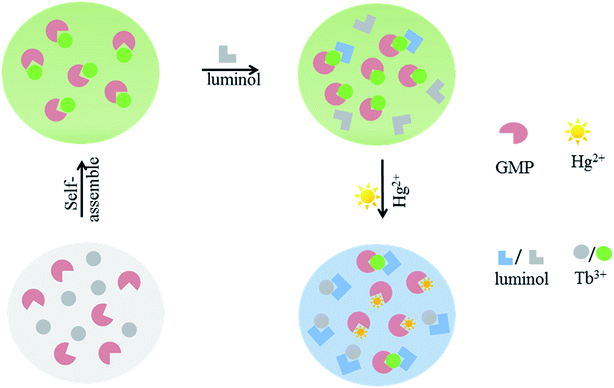 | ||
| Scheme 1 Schematic illustration of the principle of the fluorescence sensor for determination of Hg2+ using GMP–Tb–luminol. | ||
For the determination of Hg2+ in tap water, Hg2+ stock solution was spiked with tap water to prepare three samples with different concentrations of Hg2+, and the standard addition method was employed.
In a control experiment, GMP–Tb–luminol was separated by centrifugation and then washed three times with deionized water to remove non-coordinated luminol in the mixture. Then, it was re-dispersed by sonication in HEPES buffer (0.1 M, pH 7.4) to prepare sensor 2.
3. Results and discussion
3.1 Synthesis and characterization of GMP–Tb–luminol
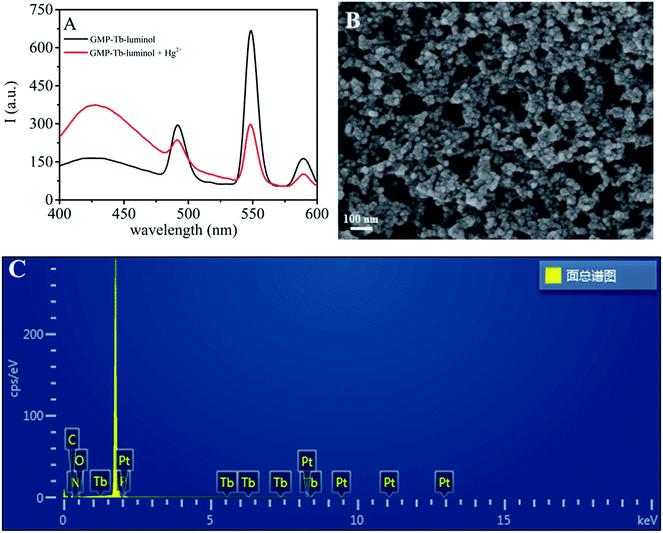
As an excellent bridging ligand, GMP can coordinate with lanthanide ions through its nucleobase and phosphate group to form coordination polymers (CPs) in the nanoregime, while serving as the antenna ligand to efficiently sensitize the green emission of Tb3+.26–28 As shown in Fig. S1A and B† in the ESI,† GMP–Tb was formed by spontaneous self-assembly of GMP and Tb3+ in HEPES buffer, and emitted the typical fluorescence of Tb3+ with three peaks centered at 492, 548 and 590 nm.Luminol, an aromatic amine compound widely used in the chemiluminescence and electrochemiluminescence fields due to its unique luminescent properties, can also coordinate with lanthanide ions to form CPs.24,25,29–31 And more interestingly, the luminescence of luminol increased evidently after coordination with Tb3+ owing to the aggregation induced emission (AIE) phenomenon.24,25,32,33 As presented in Fig. S2,† the fluorescence of luminol increased with increasing the concentration of Tb3+, accompanied by a red shift of the emission peak from 420 nm to 430 nm. As shown in Fig. 1 (black line), when we added luminol to the GMP–Tb suspension, a new broad peak at 430 nm emerged as compared to that of GMP–Tb alone. Similarly, the depurated products obtained by centrifugation and washed three times with ultrapure water revealed the characteristic emission peaks of both luminol (430 nm) and Tb3+ (492, 548 and 590 nm) (Fig. 2, red curve). These phenomena indicated that luminol was converted into GMP–Tb readily as a cofactor ligand by coordination with Tb3+, and thus dual-ligand, dual-emission GMP–Tb–luminol CPs were obtained. The obtained GMP–Tb–luminol (Fig. 1B) showed a similar morphology to that of GMP–Tb (Fig. S1A†). The chemical compositions of GMP–Tb (Fig. S1C†) and GMP–Tb–luminol (Fig. 1C) were analyzed using an energy-dispersive X-ray (EDX) spectrometer. The peaks of C, H, O, N, P and Tb were observed in the spectra of GMP–Tb and GMP–Tb–luminol, which indicated that Tb3+, GMP and luminol were present in GMP–Tb–luminol. Furthermore, the formation of the GMP–Tb–luminol CPs was also confirmed by UV-vis and FT-IR characterizations (Fig. S3A and B†). All of these results demonstrated that dual ligand, dual emission GMP–Tb–luminol CPs were obtained.
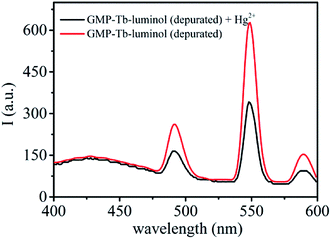 | ||
| Fig. 2 Fluorescence spectra (λex = 310 nm) of GMP–Tb–luminol (depurated) and GMP–Tb–luminol (depurated) + Hg2+ (40 μM) in HEPES buffer (0.1 M, pH 7.4). | ||
3.2 The response of GMP–Tb–luminol towards Hg2+ and the possible mechanism
The dual-emission probe GMP–Tb–luminol can be effectively excited in the spectral range from 300 to 340 nm, and the obviously distinguishable emission peaks make it suitable for designing a ratiometric sensor. As reported previously, Hg2+ could complex with GMP,34 and served as an efficient quencher to switch off the luminescence of Tb3+ in GMP–Tb CPs.35 Similarly, when we added Hg2+ to the GMP–Tb–luminol mixture (sensor 1), Tb3+ luminescence decreased, while the fluorescent peak at 430 nm attributed to luminol increased significantly. This phenomenon could be explained by the complexation between Hg2+ and GMP, which inhibited the energy transfer from GMP to Tb3+ and thus weakened the fluorescence of Tb3+. Meanwhile, some binding sites of Tb3+ were liberated in this process, and hence residual luminol in the mixture readily coordinated with Tb3+, leading to the enhanced luminescence via the AIE phenomenon.As proof of this mechanism, we compared the fluorescence spectra of the GMP–Tb–luminol mixture (sensor 1) and depurated GMP–Tb–luminol (sensor 2) in the presence of 40 μM Hg2+. It could be seen that Tb3+ emission in both cases decreased significantly upon exposure to Hg2+ (Fig. 1 and 2). However, the luminescence of luminol in the case of sensor 2 remains unchanged, which is different from that of sensor 1, since there is no residual free luminol in the solution. These results further confirmed the proposed mechanism as noted above about the fluorescence response of GMP–Tb–luminol towards Hg2+. By using the ratio of emission intensity of luminol at a wavelength of 430 nm (I430) to that of Tb3+ at 548 nm (I548) (I430/I548) as the response signal for construction of a ratiometric sensor for Hg2+, it is clear that sensor 1 exhibited better properties for signal amplification with higher sensitivity.
3.3 Ratiometric fluorescence sensing of Hg2+
After addition of Hg2+ to GMP–Tb–luminol, the fluorescence spectra were monitored every 2 min under 310 nm excitation. The luminescence of Tb3+ decreased gradually with increasing time, accompanied by the increase of the fluorescence of luminol. As summarized in Fig. S4 in the ESI,† the emission intensity ratio I430/I548 showed an obvious enhancement in the first 6 min followed by a plateau, indicating that the reaction is complete within 6 min. Thus, the equilibrium time after injection of Hg2+ was set at 6 min.As stated above, the residual free luminol in sensor 1 is beneficial for response signal enhancement via the AIE phenomenon. With this in mind, the effect of luminol concentration on the response signal was investigated. As expected, the response signal I430/I548 became enlarged when we increased the concentration of luminol. The maximum was achieved with the concentration of luminol at 50 μM, and additional luminol was less efficient for response signal enhancement (Fig. S5, ESI†). Subsequently, we also tested the effect of irradiation wavelength on the response signal, as illustrated in Fig. S6 in the ESI.† By comparing the change of the response signal before and after addition of Hg2+, the optimal excitation wavelength was set to 310 nm.
The sensitivity of sensor 1 was demonstrated by detecting changes in the fluorescence intensity ratio I430/I548 upon addition of different concentrations of Hg2+. As presented in Fig. 3A, with increasing concentration of Hg2+, an increase in the emission intensity of luminol at 430 nm occurred, accompanied by a reduction of Tb3+ luminescence. A linear relationship is obtained by plotting the emission intensity ratio I430/I548versus the concentration of Hg2+ in the range from 5 nM to 130 μM. The linear equation is I430/I548 = 0.306C/μM + 0.0281 (R2 = 0.99, Fig. 3B), and the detection limit (LOD) was about 1.3 nM calculated using the equation LOD = 3σ/S, where σ and S are the standard deviation and the slope of the resulting linear relationship, respectively. The sensitivity is better than that of previously reported fluorescence ratiometric sensors.9,36 In a control experiment, we also tested the sensitivity of sensor 2 under the same conditions. As seen in Fig. S7A in the ESI,† Tb3+ emission in sensor 2 was sensitive to Hg2+ and decreased with increasing the concentration of Hg2+, while no fluorescence change was observed for luminol. The unchanged luminescence of luminol in sensor 2 served as an inert reference signal, and then a ratiometric senor was constructed. A linear correlation existed between the emission intensity ratio I430/I548 and the concentration of Hg2+ with a slope of 0.00585 in the range from 50 nM to 80 μM (Fig. S7B, ESI†). Compared with sensor 2, sensor 1 exhibits better performance with a steeper slope and wider linear range, further confirming that the residual luminol in sensor 1 is profitable for enhancing the sensitivity for ratiometric sensing of Hg2+.
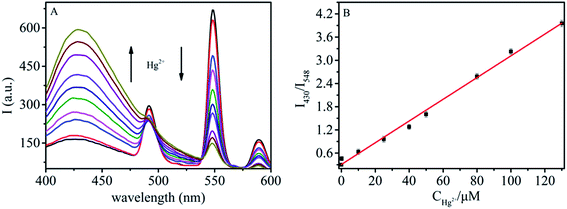 | ||
| Fig. 3 (A) Fluorescence spectra of GMP–Tb–luminol with different concentrations of Hg2+ (λex = 310 nm); (B) plot of the I430/I548 ratio versus the concentration of Hg2+. | ||
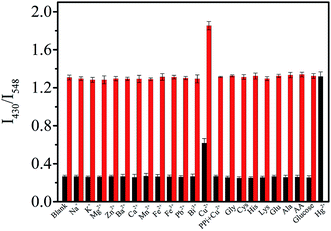
Subsequently, the selectivity of sensor 1 was evaluated by measuring its performance in the presence of other common metal ions under the same conditions. The results revealed that, with the exception of Cu2+, other metal ions (Na+, K+, Mg2+, Zn2+, Ba2+, Ca2+, Mn2+, Fe2+, Fe3+, Pb2+ and Bi3+) and biological species (Gly, Cys, His, Lys, Glu, Ala, AA and glucose) do not interfere with Hg2+ sensing (black bar in Fig. 4). The considerable interfering effect originating from Cu2+ can be explained by the Cu2+-caused aggregation of GMP–Tb–luminol CPs, which resulted in the dynamic quenching of the Tb3+ luminescence as previously reported.18 Fortunately, the interfering effect of Cu2+ can be eliminated using a masking agent, pyrophosphate (PPi), due to the strong affinity with Cu2+.37,38 Meanwhile, PPi itself shows a negligible influence on Hg2+ assay (Fig. S8, ESI†). Then, a competition experiment of Hg2+ in the presence of these metal ions was performed. As illustrated by the red bar in Fig. 4, the fluorescence intensity ratio I430/I548 is consistent with that when only Hg2+ was added. Therefore, it can be concluded that, with the help of PPi, a superior selectivity and anti-interference could be achieved even in the presence of Cu2+.
3.4 Removal of Hg2+ from water
As stated in the sensing mechanism, Hg2+ might enter into GMP–Tb–luminol CPs and coordinate with GMP in the fluorescence assay. Thus, it is rational to deduce that the dual-emission GMP–Tb–luminol CPs may also play the role of a “sweeper” for removing Hg2+ from solution. To demonstrate this hypothesis, the mixture of sensor 1 in the presence of three different concentrations of Hg2+ was centrifuged, and the residual Hg2+ in the supernatant was measured by AFS. The Hg2+ removal efficiency was evaluated using the equation E = (C0 − C)/C0, where C and C0 represent the determined concentration of Hg2+ in the supernatant and the initial concentration, respectively. As seen in Table 1, the higher the initial concentration of Hg2+, the higher the removal efficiency. A removal efficiency of 98.3% was achieved even when the initial concentration was as low as 5 nM, which is only half the maximum level of Hg2+ in drinking water (10 nM) permitted by the US Environmental Protection Agency.39,40 These results further confirmed the sensing mechanism as noted above. Therefore, besides fluorescence ratiometric sensing, this dual-emission probe can also remove Hg2+ from water simultaneously with high efficiency.| Sample | C 0 | C | C 0 − C/C0 (%) |
|---|---|---|---|
| 1 | 5 nM | 0.085 nM | 98.3% |
| 2 | 10 μM | 0.05 μM | 99.5% |
| 3 | 130 μM | 1.17 μM | 99.1% |
3.5 Determination of Hg2+ in tap water
Furthermore, to demonstrate the practicability of sensor 1, we tested the determination performance for Hg2+ in tap water samples regularly, and the standard addition method was used herein. The results are summarized in Table 2 by comparing the fluorescence intensity ratio I430/I548 with the calibration curve obtained in Fig. 3B. As shown, the quantitative recoveries for Hg2+ in tap water were in the range from 97.2% to 107%, and the relative standard deviation (RSD) for five samples was lower than 4.9%. These satisfactory results indicated that the proposed probe is an ideal fluorescent platform for ratiometric sensing of Hg2+ in real samples such as tap water.| Sample | Hg2+ added (μM) | Hg2+ found (μM) | Recovery (%) | RSD (%) |
|---|---|---|---|---|
| Tap water | 0 | 0 | — | — |
| 0.005 | 0.0049 | 97.2 | 3.8 | |
| 10 | 10.7 | 107.2 | 1.6 | |
| 25 | 25.7 | 102.7 | 4.9 |
4. Conclusion
In summary, we proposed a facile fluorescence ratiometric method for determination of Hg2+ based on dual-emission GMP–Tb–luminol CPs, where both GMP and luminol serve as bridging linkers coordinated with Tb3+ spontaneously. Besides the good linearity, high sensitivity and selectivity, the probe was also a good adsorbent for Hg2+ removal from water, thus dealing with Hg2+ pollution in water in the course of detection. Moreover, this study may also open a new way for the development of fluorescence ratiometric probes through rational design, based on the facile combination with other luminescent molecules, as well as the diversity of components and excellent optical properties of Ln-based CPs.Conflicts of interest
The authors declare that they have no competing financial interests.Acknowledgements
This work was supported by the National Natural Science Foundation of China (Grant No. 21575130) and Key Scientific Research Project in Universities of Henan Province (18A150017).References
- X. Cui, L. Zhu, J. Wu, Y. Hou, P. Wang, Z. Wang and M. Yang, Biosens. Bioelectron., 2015, 63, 506–512 CrossRef CAS.
- S. Wang, B. Lin, L. Chen, N. Li, J. Xu, J. Wang, Y. Yang, Y. Qi, Y. She, X. Shen and X. Xiao, Anal. Chem., 2018, 90, 11764–11769 CrossRef CAS.
- N. Chen, Y. Zhang, H. Liu, X. Wu and A. Wu, ACS Sens., 2016, 1, 521–527 CrossRef CAS.
- L. Lan, Q. Niu, Z. Guo, H. Liu and T. Li, Sens. Actuators, B., 2017, 244, 500–508 CrossRef CAS.
- P. B. Tchounwou, W. K. Ayensu, N. Nanuli and S. Dwayne, Environ. Technol., 2010, 18, 149–175 Search PubMed.
- T. A. Fayed, M. N. El-Nahass, H. A. El-Daly and A. A. Shokry, Appl. Organomet. Chem., 2019, 33, e4868 CrossRef.
- M. Nagy, S. L. Kovacs, T. Nagy, D. Racz, M. Zsuga and S. Keki, Talanta, 2019, 201, 165–173 CrossRef CAS.
- F. Ye, X. M. Liang, K. X. Xu, X. X. Pang, Q. Chai and Y. Fu, Talanta, 2019, 200, 494–502 CrossRef CAS.
- Y. Wang, M. Tang, H. Shen, G. Che, Y. Qiao, B. Liu and L. Wang, ACS Sustainable Chem. Eng., 2018, 6, 1744–1752 CrossRef CAS.
- W. Gao, Y. Xu, W. Wei, W. Da and X. Shi, Talanta, 2018, 188, 644–650 CrossRef CAS.
- P. Zhang, Z. Lyu, J. Viktorova, A. Offenhäusser, L. Feng and D. Mayer, Biosens. Bioelectron., 2018, 117, 450–456 CrossRef CAS.
- N. Phendukani, W. R. Krause and B. B. Mamba, Sensors, 2011, 11, 4598–4608 CrossRef PubMed.
- G. Liang, Z. Tao, X. Zhenxiang, S. Yanxi, L. Hongqi, X. Shengtao and S. Li, Spectrochim. Acta, Part A, 2019, 207, 88–95 CrossRef.
- Y. J. Cui, Y. F. Yue, G. D. Qian and B. L. Chen, Chem. Rev., 2012, 112, 1126–1162 CrossRef CAS.
- Y. Xu, Z. Zhang, P. Lv, Y. Duan, G. Li and B. Ye, J. Lumin., 2019, 205, 519–524 CrossRef CAS.
- J. Gao, C. Wang and H. Tan, J. Mater. Chem. B, 2017, 5, 7692–7700 RSC.
- J. Deng, G. Shi and T. Zhou, Anal. Chim. Acta, 2016, 942, 96–103 CrossRef CAS PubMed.
- J. Gao, Q. Li, C. Wang and H. Tan, Sens. Actuators, B, 2017, 253, 27–33 CrossRef CAS.
- Z. Zhang, Y. Wu, S. He, Y. Xu, G. Li and B. Ye, Anal. Chim. Acta, 2018, 1014, 85–90 CrossRef CAS PubMed.
- X. Wang, S. Yu, W. Liu, L. Fu, Y. Wang, J. Li and L. Chen, ACS Sens., 2018, 3, 378–385 CrossRef CAS PubMed.
- A. Bigdeli, F. Ghasemi, S. Abbasi-Moayed, M. Shahrajabian, N. Fahimi-Kashani, S. Jafarinejad, M. A. Farahmand Nejad and M. R. Hormozi-Nezhad, Anal. Chim. Acta, 2019, 1079, 30–58 CrossRef CAS.
- X. Zhang, J. Deng, Y. Xue, G. Shi and T. Zhou, Environ. Sci. Technol., 2016, 50, 847–855 CrossRef CAS PubMed.
- J. Deng, P. Yu, Y. Wang and L. Mao, Anal. Chem., 2015, 87, 3080–3086 CrossRef CAS PubMed.
- Y. J. Tong, L. D. Yu, L. L. Wu, S. P. Cao, R. P. Liang, L. Zhang, X. H. Xia and J. D. Qiu, Chem. Commun., 2018, 54, 7487–7490 RSC.
- Y. J. Tong, L. D. Yu, L. L. Wu, S. P. Cao, Y. L. Guo, R. P. Liang and J. D. Qiu, ACS Sustainable Chem. Eng., 2018, 6, 9333–9341 CrossRef CAS.
- S. F. Xue, L. F. Lu, Q. X. Wang, S. Zhang, M. Zhang and G. Shi, Talanta, 2016, 158, 208–213 CrossRef CAS PubMed.
- X. Y. Han, Q. X. Fan, Z. H. Chen, L. X. Deng, Z. Q. Fang, G. Shi and M. Zhang, Biosens. Bioelectron., 2019, 139, 111335 CrossRef CAS PubMed.
- M. Zhang, Z. B. Qu, H. Y. Ma, T. Zhou and G. Shi, Chem. Commun., 2014, 50, 4677–4679 RSC.
- H. Schumann, J. A. Meese-Marktscheffel and L. Esser, Chem. Rev., 1995, 26, 865–986 CrossRef.
- J. S. Qin, S. J. Bao, P. Li, W. Xie, D. Y. Du, L. Zhao, Y. Q. Lan and Z. M. Su, Chem.–Asian J., 2014, 9, 749–753 CrossRef CAS PubMed.
- A. Gerald Hebbink, N. David Reinhoudt and C. J. Frank, Eur. J. Org. Chem., 2010, 2001, 4101–4106 CrossRef.
- L. J. Zhang, N. He and C. Lu, Anal. Chem., 2015, 87, 1351–1357 CrossRef CAS.
- J. Mei, Y. N. Hong, J. W. Y. Lam, A. J. Qin, T. Y. H. Tang and B. Z. Tang, Adv. Mater., 2015, 26, 5429–5479 CrossRef PubMed.
- P. Y. Cheng, D. S. Honbo and J. Rozsnyai, Biochem., 1969, 8, 4470–4476 CrossRef CAS PubMed.
- M. Zhang, Z. B. Qu, C. M. Han, L. F. Lu, Y. Y. Li, T. Zhou and G. Shi, Chem. Commun., 2014, 50, 12855–12858 RSC.
- X. Y. Xu and B. Yan, J. Mater. Chem. C, 2016, 4, 1543–1549 RSC.
- M. Guo, P. Dong, Y. Feng, X. Xi, R. Shao, X. Tian, B. Zhang, M. Zhu and X. Meng, Biosens. Bioelectron., 2017, 90, 276–282 CrossRef CAS PubMed.
- J. Deng, Q. Jiang, Y. Wang, L. Yang, P. Yu and L. Mao, Anal. Chem., 2013, 85, 9409–9415 CrossRef CAS PubMed.
- A. Aliberti, P. Vaiano, A. Caporale, M. Consales, M. Ruvo and A. Cusano, Sens. Actuators, B, 2017, 247, 727–735 CrossRef CAS.
- Y. Zhao, Y. Sun, X. Lv, Y. Liu, M. Chen and W. Guo, Org. Biomol. Chem., 2010, 8, 4143–4147 RSC.
Footnote |
| † Electronic supplementary information (ESI) available. See DOI: 10.1039/c9ay02199j |
| This journal is © The Royal Society of Chemistry 2020 |

