
Monitoring stem cell differentiation using Raman microspectroscopy: chondrogenic differentiation, towards cartilage formation
Francesca
Ravera
 *ab,
Esen
Efeoglu
c and
Hugh J.
Byrne
b
*ab,
Esen
Efeoglu
c and
Hugh J.
Byrne
b
aSchool of Physics and Clinical and Optometric Sciences, TU Dublin, City Campus, Dublin 8, Ireland. E-mail: Francesca.Ravera@TUDublin.ie
bFOCAS Research Institute, TU Dublin, City Campus, Dublin 8, Ireland
cSchool of Biomolecular and Biomedical science, University College Dublin, Belfield, Dublin 4, Ireland
First published on 2nd November 2020
Abstract
Mesenchymal Stem Cells (MSCs) have the ability to differentiate into chondrocytes, the only cellular components of cartilage and are therefore ideal candidates for cartilage and tissue repair technologies. Chondrocytes are surrounded by cartilage-like extracellular matrix (ECM), a complex network rich in glycosaminoglycans, proteoglycans, and collagen, which, together with a multitude of intracellular signalling molecules, trigger the chondrogenesis and allow the chondroprogenitor to acquire the spherical morphology of the chondrocytes. However, although the mechanisms of the differentiation of MSCs have been extensively explored, it has been difficult to provide a holistic picture of the process, in situ. Raman Micro Spectroscopy (RMS) has been demonstrated to be a powerful analytical tool, which provides detailed label free biochemical fingerprint information in a non-invasive way, for analysis of cells, tissues and body fluids. In this work, RMS is explored to monitor the process of Mesenchymal Stem Cell (MSC) differentiation into chondrocytes in vitro, providing a holistic molecular picture of cellular events governing the differentiation. Spectral signatures of the subcellular compartments, nucleolus, nucleus and cytoplasm were initially probed and characteristic molecular changes between differentiated and undifferentiated were identified. Moreover, high density cell micromasses were cultured over a period of three weeks, and a systematic monitoring of cellular molecular components and the progress of the ECM formation, associated with the chondrogenic differentiation, was performed. This study shows the potential applicability of RMS as a powerful tool to monitor and better understand the differentiation pathways and process.
1. Introduction
Stem cells are present within most, if not all, multicellular organisms and are the ultimate drivers of individual organism as well as species growth and regeneration. They can be defined as biological cells capable of self-renewal and differentiation into a variety of cell types. They have been demonstrated to play a critical role in proper growth and development during embryogenesis, as well as in adult species for the replenishment of potentially every differentiated mature cell type.1Stem cells can be broadly divided in two main types, embryonic stem cells (ESCs), derived from the inner cells of a blastocyst, with pluripotency capacity, and non-embryonic stem cells, the most commonly used, predominantly adult stem cells with multipotent differentiation capacity.2 Mesenchymal stem cells (MSCs) are one type of non-embryonic, immature adult, but more specialised stem cells, which differentiate predominantly into derivatives of the mesoderm, the skeletal tissues (osteoblasts, chondrocytes), the muscle myocytes and adipocytes.3 They are characterised by a number of unique biological properties, such as unlimited or prolonged self-renewal, tissue regeneration and repair capacity, while maintaining their multipotency.4,5 MSCs can be easily isolated from a number of tissues, such as umbilical cord and placenta, as well as blood.2 They can be readily transplanted to a site of injury without provoking immune rejection,2 and they naturally possess immunomodulatory properties.2 Their application in modern medicine, to cultivate tissues in laboratories and use them for replacement of diseased tissues, offers numerous new alternatives to surgery treatments and standard medical therapies.6 Thus, over the past decade, these properties have generated increasing interest for a range of applications in tissue engineering, disease treatment and transplantation.7
Adult MSCs have the ability to differentiate into chondrocytes, ideal candidates for cartilage tissue repair, and therefore a very important differentiated lineage. Chondrocytes are responsible for producing and maintaining the integrity of the cartilage, which consists mainly of collagen, hyaluronan, and proteoglycans such as aggrecan with chondroitin sulphate and keratin sulphate chains.8 In recent years, a better understanding of the chondrogenic differentiation pathway has been achieved, and a number of extracellular signalling molecules and factors involved has been identified.9–11
A plethora of techniques, such as optical microscopy,12,13 Confocal Laser Scanning Microscopy (CLSM),14–16 Electron Microscopy (EM),17 have extensively been used for visualisation of cells, images of live cells and studies of biological structures.18 Fluorescence microscopy provides the possibility of understanding the molecular dynamics underpinning the fundamental cellular processes, but relies on selective imaging of cellular molecules labelled with specific fluorescent dyes.6,19 Histochemistry techniques have been employed for an assessment of the success of chondrogenic differentiation,20 observing the accumulation of the glycosaminoglycans (GAG)21 in the extracellular matrix of the cells. The extracellular matrix (ECM) of the chondrocytes is essential for maintaining the structure and the function of the tissue. It consists in a number of components, such as fibrous proteins (e.g. collagen), GAG (e.g. hyaluronan, chondroitin sulphate), proteoglycans, which are composed by a core protein and GAG chains, (e.g. aggrecan, with chondroitin sulphate and keratin sulphate chains), glycoprotein (e.g. fibronectin), and lipids (e.g. phospholipids, cholesterol).22 Chondrogenesis is the fate of most skeletogenic cells, and it consists of a series of strictly regulated events, and multiple trigger intercellular signalling cascades that activate the chondroprogenitor cells.10
During the differentiation process, the population of initiated mesenchymal cells progressively transits to a primary phase of intense growth and condensation, known as pre-cartilaginous condensation, as described by Atchley and Hall.90 A range of different studies, using optical and electron microscopies, as well as indirect immunofluorescence techniques24 have previously demonstrated the development of MSCs aggregates en route to the formation of cartilage;23,25 and that this condensation process plays a crucial role in the initiation of the chondrogenic differentiation process.26 The pre-cartilaginous condensation is an extremely important intermediate phase that provides the fundamental scaffold for the skeletal elements, and it is provoked by a reduction of intercellular distances, and consequently increase of cell to cell contacts.24 Numerous studies described the molecular characteristics of condensation phase,8,23,26,27 an important role in the cell-to-cell adhesion is regulated by adhesion molecules (N-CAM), cell-to-cell interaction molecules (N-cadherin), and aggrecan, a protein of the proteoglycan family, with glycosaminoglycan side chains of chondroitin and keratin sulphate collagen I type and collagen II type Toole and Trelstad, and Knudson and Toole28,29 have described the association between changes occurring in the type of proteoglycans and GAGs, initially rich in hyaluronan, and successively decreasing in favour of chondroitin sulphate, and the condensation trigger. The presence of collagen I, tenascin, fibronectin and hyaluronan in the initial ECM of undifferentiated mesenchymal cell has been identified,10,30 and Lefebvre et al.31,32 described the identification of the first main chondrogenic factor, Sox9 and other Sox proteins, as the main and earliest markers of the conversion of MSCs into differentiated chondrocytes. Lee and Chuong studied the N-CAM expression in chondrocytes, demonstrating with immunofluorescent staining techniques that, when this adhesion molecule is downregulated, the pre-chondrogenic condensation is consequently interrupted.33,34 Therefore, successive expression of adhesion molecules and collagen I are switched off,27 and cells undergo a second phase of chondrocyte differentiation, as they start producing collagen types IIB, IX, XI as the main ECM components.7 Moreover, the transition from the condensation phase to differentiated chondrocytes status, mediated by the suppression of the condensation enhancers, brings into play new factors such as Hox transcription factors and BMP-2 (bone morphogenetic protein), differentiation enhancers.26 The chondrocytes appear at this stage encompassed in their ECM, and the events taking place at a molecular level progressively lead to the cells acquiring the typical rounded morphology of the differentiated cells.8,26
Although numerous studies have investigated the signaling pathways involved in chondrogenesis, it is still difficult to monitor the process effectively, in situ, and to unambiguously distinguish the differentiation status, as the techniques referred to above are limited in their ability to monitor and characterise the process holistically, at a molecular level in situ. Raman micro spectroscopy (RMS), as label-free, non-invasive and non-destructive analytical technique appears a promising candidate to potentially overcome many of these limitations. RMS is able to provide accurate and high content molecular information, about the whole cell as well as the subcellular regions,3,5,35,36 with minimal sample preparation, and it is also suitable for measurement in aqueous environments.
Vibrational spectroscopy has previously been used to characterise the ECM,37 and the characteristic spectroscopic signatures of reference GAG molecules such as chondroitin 4-sulphate, hyaluronic acid, heparin sulphates, chondroitin sulphates and others have also been established.22,38,39 Moreover, the applicability of RMS for probing the difference between the status of undifferentiated and differentiated cells40 and the ability of detecting proteoglycans and GAG in differentiated chondrocytes has been demonstrated.41 However, a complete and systematic spectroscopic profiling of the process of chondrogenesis in vitro, through its three different phases, has not been presented, and the potential to discrimination of them, for an overall understanding of cellular events that govern this process has not yet been demonstrated.
This study demonstrates the use of RMS as technique to monitor the proliferation and differentiation of MSCs in vitro, highlighting the evolution of the cellular metabolism, at a subcellular level, compared to control, as well as the formation of the ECM, as the cells transition through pre-chondrocyte condensation, towards full chondrogenic differentiation. As a well-studied model for the differentiation process, a commercially available rodent mesenchymal stem cell line was chosen. Chondrogenic differentiation has previously been demonstrated by positive proteoglycan Alcian blue staining after 18 days of culturing,33,42 and by monitoring the content of sulphated glycosaminoglycans after 14, 21 and 28 days.21,43,44
2. Materials and methods
2.1. Cell culture
Cells of the rat mesenchymal stem cell line (GIBCO® Rat (SD) Mesenchymal Stem Cells Catalog No. S1601-100 Invitrogen, Thermo Fisher Scientific) were kindly provided by Prof. Paul Cahill, Dublin City University, and were cultured in Dulbecco's Modified Eagle Medium DMEM (1×) Glutamax-I (low glucose, Thermo Fisher Scientific), supplemented with 10% MSC-Qualified FBS, and 5 μg mL−1 gentamicin at 37 °C in a 5% CO2 incubator. The cells were sub-cultured every three to four days, when their confluency reached 60%–80%. For sub-culturing, briefly, the growth medium was removed, and cells were washed with 10 mL of Dulbecco's Phosphate-Buffered Saline (D-PBS, containing no calcium, magnesium, or phenol red) to remove any remnant medium and cell secretions. Then, cells were trypsinised, seeded at the appropriate volume (0.2–0.5 mL cm−2) and further incubated at 37 °C in a 5% CO2.MSCs were subsequently induced into chondrocytes under the required differentiation process conditions, using the commercially available StemPro™ Chondrogenesis Differentiation Kit (Thermo Fisher Scientific). The differentiation medium was prepared by combining 100 mL of StemPro® Chondrocyte Differentiation Basal Medium with 10 mL of StemPro® Chondrogenesis Supplement. 250 μL of Gentamycin (5 μg mL−1) were added, and the prepared medium was kept in the dark at 4 °C in accordance with the manufacturer's instructions.45
Cells were prepared at a density of 8 × 10⁶ cells per mL onto two different 6 of 12-well-plates. The empty wells were filled with 2 mL PBS to provide humidity for the formation of chondrogenic pellets. The plates were incubated for two hours at 37 °C, 5% CO2 and 90% humidity. 1 mL of α-MEM medium (Minimum Essential Medium Eagle Alpha Modifications, Thermo Fisher Scientific) supplemented with GlutaMAX™-I and 5 μg mL−1 gentamicin was added to three of the wells, to be used as negative controls, whereas, 1 mL of differentiation medium was added into the other three wells of each culture plate.
The plates were kept at 37 °C in the 5% CO2 humidified incubator for up to 21 days and medium was replaced every 3 days with pre-warmed (37 °C) α-MEM and differentiation medium for control and differentiation samples, respectively. Medium for chondrogenic differentiation and α-MEM were prepared prior to differentiation experiments and used for up to 4 weeks. Representative examples of morphologies of the MSCs in growth medium (A) and differentiation medium (B) are provided in Fig. 2.
2.2. Raman imaging and Raman mapping
A Horiba Jobin–Yvon LabRAM HR800 spectrometer, equipped with a 785 nm diode laser as source, was used throughout the study. All measurements were acquired in water by using a ×100 water immersion objective (LUMPlanF1, Olympus, N.A. 1), of spot size ∼1 μm. The spectrometer was calibrated to the 520.7 cm−1 line of silicon prior to spectral acquisition. Although the high resolution HR800 instrument can achieve a dispersion of ∼0.25 cm−1 per pixel with higher density gratings, a 300 lines per mm grating was chosen in order to capture the whole fingerprint region of the spectrum in a single window, with a spectral dispersion of approximately 1.5 cm−1 per pixel. A 100 μm confocal pinhole was used for all measurements. The spectra were dispersed onto a 16 bit dynamic range Peltier cooled CCD detector and the spectral range from 400 to 1800 cm−1, the so-called fingerprint region, was chosen.Point spectra from the cytoplasm, nucleus and nucleolus of 20 to 40 cells were acquired for each differentiation time point, and spectra were acquired for 2 × 20 seconds at each spot (sections 3.1 and 3.2.).
In the Raman mapping technique, the laser is point focused and translated point-by-point over the identified area (section 3.3). The step between two successive measurements was set to 1.5 μm. The spot size of ∼1 μm, and step size of 1.5 μm results in a slight under-sampling of the sample. However, rather than providing a graded spatial map of the sample, the spectra are grouped into and analysed according to regions of the pellet identified as Centre, Intermediate, and Edge. The continuous line scanning means that no specific features of the pellet were targeted, and the under-sampling may add to the variability of the data subset corresponding to each region.
2.3. Brightfield microscopy
In this study, images of the cells were collected with bright field option of a Zeiss LSM 510-META microscope, in inverted mode (×60 oil immersion objective).2.4. Sample preparation
For Raman analysis of MSCs control and differentiated cultures, samples were prepared by treating the cells with trypsin to detach them, after which they were counted and seeded on CaF2 disks (Crystran, UK) with a specific density of 100![[thin space (1/6-em)]](https://www.rsc.org/images/entities/char_2009.gif) 000 cells per substrate. After 24 hours of incubation, cells were washed three times with D-PBS, then fixed with 10% formalin for 15 minutes. Formalin solution was removed after 15 minutes incubation at room temperature and cells were rinsed with distilled water (dH2O) three times and kept in dH2O for Raman measurements.
000 cells per substrate. After 24 hours of incubation, cells were washed three times with D-PBS, then fixed with 10% formalin for 15 minutes. Formalin solution was removed after 15 minutes incubation at room temperature and cells were rinsed with distilled water (dH2O) three times and kept in dH2O for Raman measurements.
The same fixation process was performed for optical microscopy, but onto 35 mm uncoated glass bottom dishes (MatTek Corporation, USA). The samples were stored with 2 mL of distilled water for measurements.
2.5. Data pre-processing
The raw spectra of cells were subjected to data pre-processing in Matlab (Mathworks, USA) before further analysis, to remove the background signal and reduce the noise. Data smoothing was performed using the Savitzky–Golay filter (3rd order, 9 points).Background, which is mainly due to water in immersion geometry46 and whose OH bending feature at 1640 cm−1 can interfere with the cellular spectra, was removed by adapted Extended Multiplicative Signal Correction (EMSC) algorithm, previously described by Kerr and Hennelly, 2016.47 The EMSC algorithm was applied to smoothed spectra, using a spectrum of MSC recorded on CaF2 as a reference, and a baseline of chosen polynomial of order (N = 9) was used.
After smoothing and background correction, the dataset is vector normalised to minimise any effects of instrumental variability during or between measurements.
2.6. Multivariate analysis: principal components analysis
Principal Components Analysis (PCA) is an unsupervised data transformation procedure that aims to explain high-dimensional data using smaller number of variables called the principal components. The principal components are the orthogonal axes of a new generated subspace, in which all the most significant information is retained. The main goal of PCA is to identify a pattern and a relationship between a set of measured variables.48 The spectral data are decomposed by PCA into object rows (m) and columns (n), generating a matrix (m × n). In the matrix, the rows represent the different observations recorded, the spectra, and the columns are the n variables of the different measurements, i.e. the wavenumbers/Raman shifts.49 The PCs are independent, and they can be interpreted as the direction of the maximum variance given, where the variance is a measure of the spread of the variable values50 The order of the principal components indicates their importance among the data: PC1 expresses the direction of the greatest variance, PC2 the second highest amount of variation, and so on.35 A PCA scatter plot is commonly used to show the distribution and any differentiation of the datasets according to the PCs, and the loading of a PC illustrates the spectral origin of the variability of differentiation of datasets.35In this study, 20–40 spectra (observations) were recorded for each data set, and each spectrum is a different point in an n variable space, the wavenumbers (400–1800 cm−1). If the sample shows some features that have same origin of variation among the bands, a correlation between the variables will be displayed.
3. Results
3.1. Mesenchymal stem cells: features of cytoplasm, nucleus and nucleolus
In vibrational spectroscopy (infrared absorption or Raman scattering), the spectral region between 400 and 1800 cm−1 is considered to include the most relevant biochemical information concerning biological tissues and is called the “fingerprint region”. Fingerprints of biochemical compositions were investigated in order to determine the most relevant characteristics of different subcellular regions of MSCs. An example of a white-light image indicating the regions selected for sampling is provided in Fig. 1A. 20 point spectra were acquired from the cytoplasm, nucleus and nucleolus of 20 individual cells, as described in section 2.2, and all Raman spectral data sets were transferred to Matlab (Mathworks, USA), in which pre-processing and analysis were performed. The corresponding mean spectra obtained from cytoplasm, nucleus and nucleolus of 20 individual cells is presented in Fig. 1B and typical band assignments for major classes of biomolecules are indicated by the highlights.51 More extensive details of Raman spectral peak positions and corresponding band assignments for MSCs are provided in Table 1.51 | ||
| Fig. 1 (A) A representative white-light image of MSCs. (B) Mean spectra of nucleolus (red), nucleus (blue) and cytoplasm (green) of MSCs. The cellular regions are indicated with black arrows and respective spectra are provided in (B). The spectra have been offset for clarity. | ||
| Peak position (cm−1) | Band assignment |
|---|---|
| 519 | Phosphatidylinositol |
| 540 | Membrane lipids |
| 727 | C–C stretching, proline (collagen) |
| 750 | CH2 stretching |
| 785 | U, T, C (ring breathing modes in the DNA/RNA bases) |
| 810 | PO2− stretching of RNA/A-form DNA |
| 830 | PO2− stretching of B-form DNA |
| 1002 | Phenylalanine |
| 1060–1095 | PO2− stretching (DNA/RNA) |
| 1270–1299 | Amide III band in proteins |
| 1301 | Triglycerides (fatty acids) |
| 1338 | DNA and proteins |
| 1440 | Cholesterol, fatty acid band (lipids) |
| 1440–50 | CH2CH3 stretching |
| 1660–1700 | C![[double bond, length as m-dash]](https://www.rsc.org/images/entities/char_e001.gif) O stretch Amide I α-helix O stretch Amide I α-helix |
The most significant biochemical differences in subcellular regions arise from the varying amounts of biomolecules, due to their specific roles in the cell. Most of the genetic information in cells is stored in the nucleolar region which fulfils a crucial role in cell proliferation, protein transcription and transfer of genetic material to the next generation cells, whereas the cytoplasm provides an environment for multiple cellular activities such as translation, post-translational modifications, lipid metabolism, energy production etc.52 Therefore, based on cellular events occurring in different compartments, the abundance of biomolecular features varies, and these variances can be observed in the differences in Raman spectral profiles of the different subcellular regions.
As seen in Fig. 1B, the mean spectra of the three visually distinct cellular regions are remarkably similar, although subtle differences are apparent. For example, nucleic acid features in the 750–830 cm−1 region of the fingerprint are seen to be more prominent in the mean spectra of the nucleus and nucleolus.
The 830 cm−1 feature can be attributed to the presence of DNA, whereas the bands at 785 cm−1 and 810 cm−1 are indicators of the RNA in the nucleolar region.53
On the other hand, the spectral profile of the cytoplasm is observed to be considerably different from those of the nucleolar and nuclear region: whereas in the nucleus and nucleolus the bands corresponding to DNA and RNA vibrations are prominent, there is little, or no contribution from these bands observed in the mean spectra of cytoplasm. The bands between 1300–1400 cm−1 (CH2 stretching in lipidic components (fatty acids d(CH2)-lipids) and/or proteins) are also observed to be significantly different among different cellular regions.51
Although investigation of mean spectra provides valuable information regarding differences in spectral profiles, PCA provides further insights into the biochemical differences by extracting the most common variances among data sets.35 In order to better identify varying biochemical features of cellular compartments of MSCs, PCA was applied to the data sets obtained from cytoplasm, nucleus and nucleolus (Fig. 2). In Fig. 2A, the PCA scatterplot of nucleolar, nuclear, and cytoplasmic regions of MSCs, the spectral data for each region is well clustered, and a considerable degree of separation of the different clusters is observed. PC1 and PC2 describe the majority of the variance of the dataset, and the loadings are interpretable in terms of characteristic features, consistent with the differing biochemical profiles of the different subcellular regions.35,54
 | ||
| Fig. 2 PCA of different cellular regions of MSCs. (A) Scatter plot of the PCA of spectra corresponding to cytoplasm (green), nucleus (blue) and nucleolus (red) of the MSCs. (B) First loading of PCA corresponding to comparison of cellular regions. (C) Scatter plot of the pairwise PCA of spectra corresponding to nucleus (blue) and nucleolus (red) of the MSCs, and (D) first and second loadings of PCA, corresponding to comparison of nucleus and nucleolus. Loadings are offset for clarity and the dotted line represents the zero ‘0’ line for each loading. Notable bands are indicated by highlights. | ||
The data is mainly differentiated according to PC1 (67% explained variance, Fig. 2A), whereby the data set related to cytoplasm scored negatively (PC1 < 0), whereas the nucleus and nucleolus scored positively (PC1 > 0). The strong differentiation of the cytoplasm from the other regions is a confirmation of the observations from the mean spectra of Fig. 1 that the differences in spectral features are predominantly between the cytoplasmic and nuclear (nucleus/nucleolus) regions. PC2 gives information about the highest second variance (18%) among the data set; the negative side is dominated by the nucleolus (in red), which mainly scored negatively (PC2 < 0), while the positive side is dominated by nuclear features (PC2 > 0). Fig. 2B shows the loading of the first Principle Component (PC1) corresponding to the comparison of the three cellular regions, in which relevant peaks are highlighted in grey. They indicate the spectral features which are primarily responsible for the differentiation of the datasets in the scatterplot, and are relatively stronger in the respective clusters.35 The loading exhibits a number of peaks extending in the positive aspect of the plot (PC1 > 0), mainly related to the nuclear and nucleolar regions (Fig. 2A), and in the negative area (PC1 < 0), which correspond to cytoplasmic features.35 The 750–810 cm−1 region exhibits the strong contribution of nucleic acids features, related to the nucleolar and nuclear data sets. The band at 785 cm−1 is manifest as a sharp, positive peak, which indicates the presence of thymine (T), cytosine (C), uracil (U) bases and the PO2− backbone of nucleic acids. The feature at 810 cm−1 corresponds to vibrations of PO2− of RNA. The 1060–1095 cm−1 region also contains PO2− stretching (DNA/RNA) bands which are predictably stronger in the nuclear and nucleolar region due to the presence of nucleic acids.55
A further two positive features at 1340 cm−1 and 1373 cm−1 are attributed to nucleic acid modes and ring breathing modes of the DNA/RNA bases (T, A and G),35 respectively. The negative bands of the loading of PC1 are characteristic of lipidic components, which are more prominent in the cytoplasmic spectra. Peaks at 1301 cm−1, 1440 cm−1, indicate lipids, and the region 1440–1450 cm−1, contains features of CH2 and CH3 and CH deformation vibrations, attributed to cholesterol and fatty acids.
In order to identify biochemical features varying between nucleus and nucleolus, whose differentiation is more subtle, due to the similar composition of the biomolecules and the difficulty in focussing on the specific area of the nucleolus, a pairwise comparison of the data sets was carried out using PCA. As observable in Fig. 2C, the spectral clusters of the nucleus (blue) and nucleolus (red) are separated according to PC1 (Explained variance 42%), although, as expected, the differentiation is not absolute. It is nevertheless noticeable in Fig. 2D that the loading of the differentiating PC1 (in blue) is dominated on the positive side by a strong double peak at 785 (DNA/RNA bases, thymine, cytosine, uracil) and 810 cm−1 (PO2− stretching in RNA/DNA A form), which is characteristic of the nucleoli of the cell.
RNA is usually found as dense packs in the nucleolar region and the presence this doublet peak in the positive features can be attributed to higher composition of RNA in nucleolus compared to nucleus. The spectra of the two nuclear regions are also partially differentiated by PC2 (32% Explained variance). The loading shows a prominent peak at 785 cm−1 correlated to DNA/RNA bases and a sharp peak at 830 cm−1 related to PO2− stretching in B-form DNA on the positive side, while the sharp peak at 810 cm−1 related to PO2− stretching in RNA/A-form DNA dominates the negative side. The loadings therefore show subtle differences in the nucleic acid composition and conformation in the two subnuclear regions.
The study of the undifferentiated MSC cells demonstrates how, spectroscopically, the subcellular regions of the cell are distinct, and how Raman microspectroscopy, in combination with multivariate statistical analysis, can elucidate the subtle differences related to differences in biochemical composition. Thus, the spectral characteristics of the regions will be employed to monitor the process of differentiation of the MSCs.
3.2. In vitro monitoring of mesenchymal stem cell differentiation to chondrocytes using Raman microspectroscopy
Throughout this study, optical bright field microscopy was employed to image and monitor MSCs and the process of differentiation to chondrocytes. In Fig. 3A and B, a remarkable change in cellular shape is evident after 14 days of chondrogenic differentiation, whereby the partially differentiated lineage (Fig. 3B) present a notably more ovoid and round shape compared to the tapered and thin oblong morphology of the non-differentiated MSCs (Fig. 3A). | ||
| Fig. 3 White-light images of MSCs, undifferentiated (A), and after 14 days differentiation (B). | ||
In order to identify the biochemical factors which are engaged in the differentiation process, the Raman spectral profiles of the cytoplasm, nucleus and nucleolus of MSCs (controls) are compared to those at each of the different stages of differentiation into chondrocytes using a pairwise PCA, as described in section 2.6. The scatter plots of PCA are provided in Fig. 4 for Raman spectral analysis of the cytoplasm, nucleus and nucleolus, for 7 days and 14 days, in each case, compared to control. The scatter of the data, for both datasets, according to PC1 is an indication of the intrinsic variability of the measurements. For both differentiation time points, the most significant differences are observed in the biochemical composition of the cytoplasm, the spectra of which are at least partially discriminated according to PC2 (10%, 8% explained variance for 7 days and 14 days, respectively), and it is apparent that prolonged exposure to the differentiating medium resulted in an increased differentiation of the clusters of chondrocytes (red) and non-differentiated MSC (blue). The pairwise comparisons of data sets of control MSCs and differentiated cells for the nuclear and nucleolar regions also show an increased separation with prolonged differentiation time, and therefore the spectral differences represent the significant, progressive biochemical changes occurring in MSCs during the initial stages of their differentiation into chondrocytes.
 | ||
| Fig. 4 Scatter plot of the PCA of spectra corresponding to cytoplasm of MSCs (blue) and chondrocyte (red) for nucleolus, nucleus and cytoplasm for 7 and 14 days. | ||
In order to obtain a better understanding of the biochemical changes involved in the differentiation process, the loading plots according to PC2 of the cytoplasmic region, in which the best-defined discrimination is observed, as well as the nuclear and nucleolar regions are shown in Fig. 5. As shown in Fig. 4, the scatter plots of cytoplasm showed that the clearest separation is observed according to PC2, by which MSCs tend to dominate the negative side of the plot, and the differentiated chondrocytes, both after 7 and 14 days, dominate the positive area. Note, in some of the scatter plots of Fig. 4, e.g. nucleus 14 days, the MSC data are distributed (arbitrarily by Matlab) on the positive side. For clarity in the analysis, in this case the loadings have been inverted in Fig. 4, such that positive loadings always refer to differentiated cells.
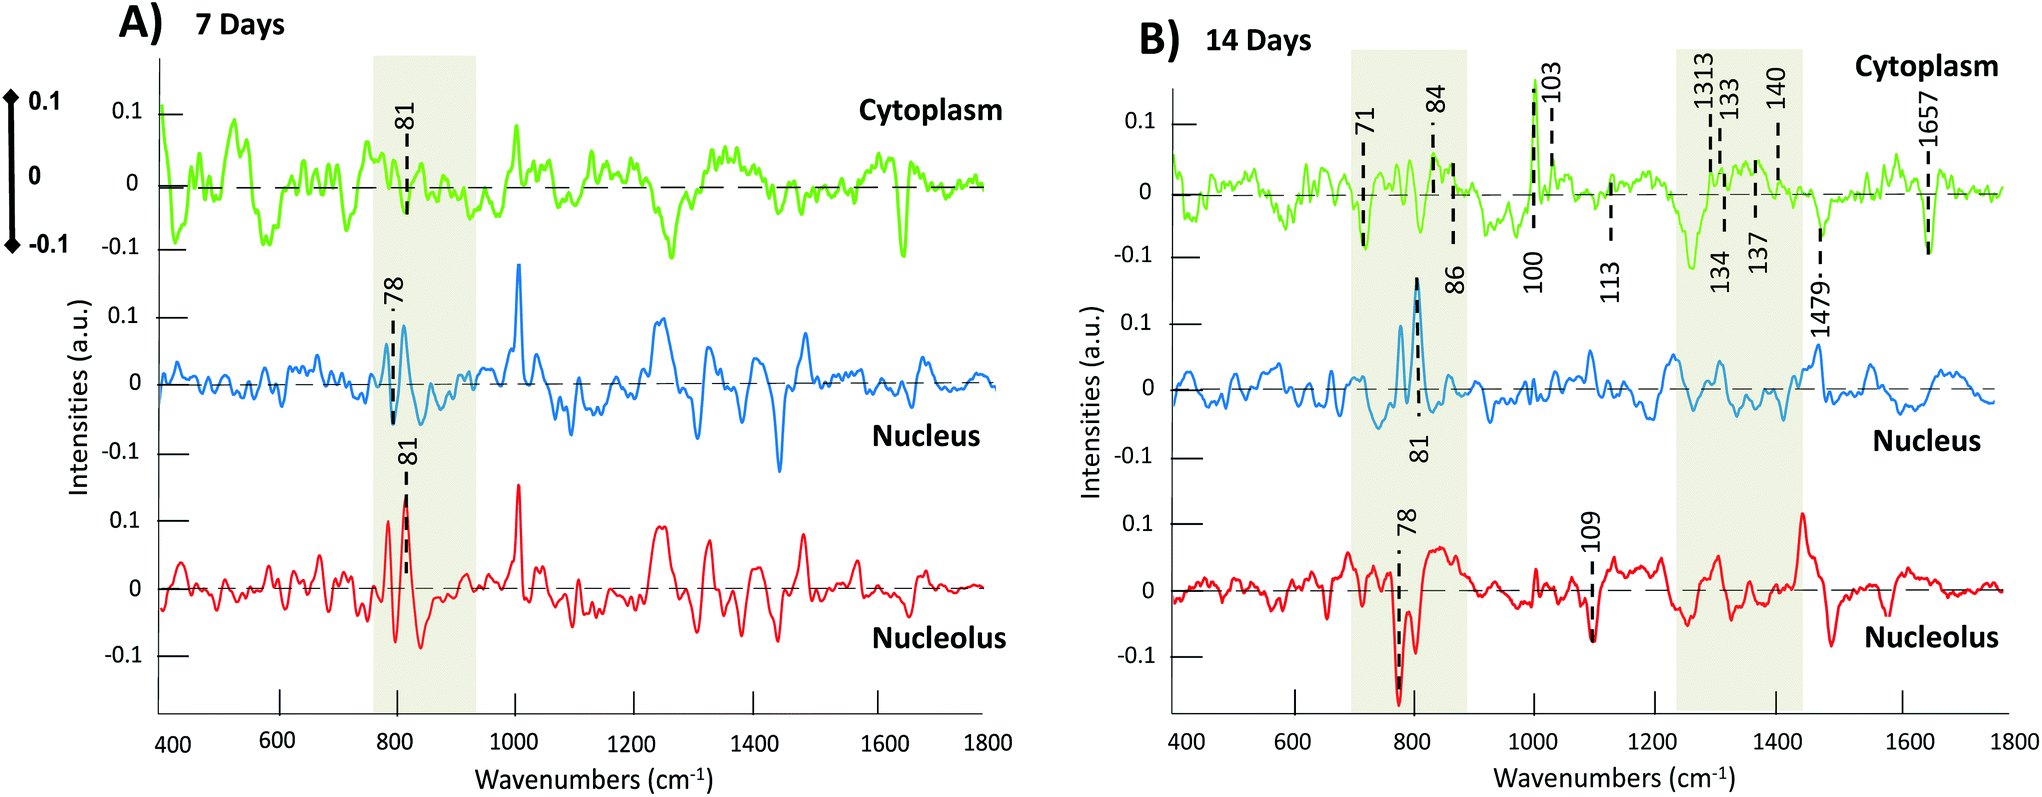 | ||
| Fig. 5 (A) Second loading of PCA (PC2) of the 7 days pairwise comparison between MSCs and chondrocytes of cytoplasm (green), nucleus (blue) and nucleolus (red). (B) Second loading of the 14 days pairwise comparison between MSCs and chondrocytes of cytoplasm (green) and nucleolus (red). | ||
The loadings plots indicate progressive decreases of features in both the nucleolus and nucleus of the cell, particularly associated with RNA and DNA in the region of 780–850 cm−1, indicative of the evolving phenotype of the cell. Reduced concentrations of RNA in differentiated stem cells compared to partially differentiated or undifferentiated has been previously reported using Raman spectroscopy,6,58 and, in accordance with the literature, this behaviour can be explained by a reduced differentiation potential in the cells.59 RNA was found to be abundant in cells with higher differentiation potential, and therefore, when cells progress along the differentiation pathway, their proliferation capacity increases, whereas a significant decrease can be observed in potency.40,59
The process of chondrocyte differentiation is in fact specifically associated with the expression of the chondrogenic related genes, such as ACAN, the gene responsible for the aggrecan formation,60 COL2A1 and COL2A1, the gene that provides instructions for making one component of type I and II collagen,61 SOX9 and others.62,63 Such changes are observable at the subcellular level, particularly in the nucleolus, the primary location of RNA, while the nucleus instead, is abundant in DNA.35,51,64 The most noticeable discriminant features are observed in the nuclear loading of the 14th day of chondrogenesis; peaks at 785 cm−1 and 813 cm−1, related to DNA PO2− symmetric stretch, and vibrations of the DNA bases adenine and guanine.51,64 In contrast to the observed evolution of the nucleolar features, the significant increase of the band intensity indicates that the nucleic acids content of differentiating chondrocytes has increased. Similar results have previously obtained65 and have been associated with changes in the structure of chromatin, which is located in the nucleus of the cell, and is responsible for stem cells self-renewal abilities and gene expression.66,67
The cytoplasmic scatter plots showed the highest degree of separation (Fig. 4), and the features of the corresponding loading of PC2 (green in Fig. 5A and B) can potentially be identified as important markers of the chondrogenic differentiation pathway. In the loading of the cytoplasmic PCA at 14th day of differentiation, the negative features, attributed to undifferentiated MSCs, are characteristic of phospholipid content (719 cm−1), and fatty acids contributions (1255 cm−1, 1479 cm−1 and 1657 cm−1).51 Changes in the protein content are indicated by the band at 1032 cm−1, which represents hydroxyproline content, and the C–C stretching of proteins involved in the collagen development respectively,40,68 1002 cm−1, related to phenylalanine (collagen assignment), which exhibits a sharp peak with increasing intensity from day 7 to 14.68 Moreover, the region of ∼1310 cm−1–1450 cm−1 potentially contains additional characteristic features, identified by others, related to CH3CH2 (collagen vibration),51 Amide III and Amide II respectively.40 Collagen fibre structure and organisation, with its characteristic triple helix structure, are key to the development of the ECM, as the basis of cartilage conformation.69 Amide bands have been studied and been demonstrated to depend on the conformation of collagen, and therefore they provide information about the conformational changes of this protein.37
Within the cytoplasmic loading, positive features related to increases in polysaccharide content can also be expected in the regions of 1290–1400 cm−1 and 840–860 cm−1, corresponding to CH bending and the C–O–C group of polysaccharides.22,51 Long linear polysaccharidic structures have been associated with a small family of linear polysaccharides called glycosaminoglycans (GAG). GAG structure consist of unbranched chains of disaccharide repeated units,70 which can form numerous chains and attach covalently to a protein core, generating a wide and large family of extracellular matrix (ECM) molecules, the proteoglycans. GAGs are synthesised by chondrocytes, and their structure and intermolecular interactions confer the characteristic cartilaginous tissues with their physical properties, and they are moreover involved in biological signalling pathways for the development and functional regeneration of cartilage.22
The vibrational activity of GAGs has previously been reported39 and a band at 1375 cm−1 has previously been identified as a proteoglycans marker in cartilage and bone,71 while characteristic peaks at 1335 cm−1 and 1341 cm−1, corresponding to CH3CH2 of GAGs, were also identified. Moreover, bands at 1409 cm−1 and 1413–1416 cm−1, related to the symmetric COO− stretch, and 1131cm−1, corresponding to the sulphate vibrational mode (SO) of the GAGs were also observed.22,70,71 These features identified by previous studies have been labelled as potentially discernible in the cytoplasmic loadings of Fig. 5B, but become more apparent as the cell culture evolves, as discussed in the following section (3.4). The spectroscopic analysis of the three subcellular organelles thus reveals a variety of spectroscopic markers of biochemical compounds involved in the chondrogenic differentiation process up to the 14th day of differentiation. These findings lead to the conclusion that the cytoplasm region especially revealed the highest degree of molecular changes and therefore differentiation, as a manifestation of the nucleolar biochemical content occurred throughout the chondrogenic differentiation of MSCs.
Notably, however, after this time point it became increasingly difficult to identify and analyse individual cells, as they began to cluster. Therefore, subsequent monitoring of the development of the chondrocytes was performed by analysing the cluster formation, rather than individual cells, as MSCs are induced into chondrogenic differentiation.
3.3. Monitoring of chondrogenic pellet formation using Raman microspectroscopy
As MSCs differentiate into chondrocytes, it has been observed that a high-density cell pellet, also called a micromass,30,72 begins to grow.20 The pellet formation is a characteristic of MSC differentiation into chondrocytes, as they mimic the growth of shallow multilayers of cartilage.72The formation of the chondrogenic micromass is caused by an aggregation of cells around a Centre, a process termed pre chondrogenic condensation (see Introduction).26 At this early first phase of differentiation, the chondroprogenitor cells begin to produce the ECM, a complex meshwork which has the important role of conferring flexibility and strength7 and maintaining the homeostasis of the cartilaginous tissues.73
Progressively, the deposition of extracellular matrix, a process mediated by growth factor (TGF-β) and fibronectin, breaks the adhesion molecule links,26 triggering the transit of cells from condensation to differentiation. Understanding the main developmental steps of the ECM is of great importance in the context of the differentiation of MSC and therefore cartilage, in order to detect and identify the main signalling molecules and components involved in chondrogenesis differentiation and regulations.
In this study, formation of the chondrogenic pellet was observed to typically begin from the Centre and gradually evolve to the Edge, naturally developing three regions of different cell density, and the overall profile evolves as a function of the cellular differentiation time. Fig. 6 shows a graphic illustration of the chondrogenic differentiation pellet and representative white-light images corresponding to the different pellet regions, taken after 7 days of differentiation.
 | ||
| Fig. 6 Schematic representation of 7th day chondrocyte pellet formation during differentiation process and white-light images of the regions which Raman spectral maps are acquired. Regions A, B and C are representative examples of the regions of pellet from Centre, through Intermediate, to the Edge, the light grey area represents the culture substrate. | ||
Raman microspectroscopy was employed to perform an analysis of the evolution of the pellet regions, from Centre to the Edge, as a function of cell differentiation time. Raman maps were acquired in order to non-invasively characterise the different regions of the pellet (A, B and C) after 7, 14 and 21 days of differentiation. As seen in Fig. 6, the scanned regions are observed to have different degrees of compactness, increasing from Edge to the Centre, whereas visible cellular features become less discernible, due to multi-layer formation. The Centre, Intermediate and Edge regions of the pellet are indicated by A, B and C, respectively and the same letter coding is used throughout the section 3.3.
The study of Sekiya et al.11 monitored the changes of the chondrogenic pellet size suspended in a polypropylene tube from 7 days to 21 days, and reported an increase in lateral dimensions from 700 μm to 1.5 mm, with extended exposure to differentiation medium. Therefore, the dimensions of the spectroscopically mapped regions in the samples were kept similar throughout this study. A 12 × 10 pixel map, with 1.5 μm step size, of area 300 μm2 and 120 spectra per sample, was performed and the raw data were pre-processed on Matlab.
Pre-processed data sets, which were obtained from regions A, B and C, each after 7, 14 and 21 days exposure to differentiation medium, were analysed using PCA in a time dependant and region dependant fashion to extract information relating to the evolution of the biochemical composition of the cell pellet during differentiation, with the ultimate aim of identification of spectral markers of differentiation.
Fig. 7 shows the scatter plots of PCA from the comparison of the 3 chondrogenic pellet regions, for day 7, 14, and 21 (Fig. 7A, B and C). In each scatter plot, A, B and C are indicated with blue, black and red colour coding, respectively. Interestingly, although the three regions of the pellet form three well defined clusters, their relative distributions, indicative of their relative similarities, evolves as a function of time. Notably, the % variances explained by PC1 and PC2 are relatively low. However, in all cases, PC3 accounts for <10% of the variance, and critical to the current analysis, scatterplots of PC3 vs. PC1 or PC2 do not give any indication of differentiation of clusters of data associated with the respective regions of the condensate. After 7 days of differentiation, it is observable that A (Centre) and B (Intermediate) partially overlap, and they score mostly negatively according to PC1. In contrast, the Edge region of the pellet (C), indicated in red, is well differentiated (PC1 > 1), showing a distinct separation from the Centre and the Intermediate regions, and is predominantly distributed positively with respect to PC1, which has an explained variance of 31%.
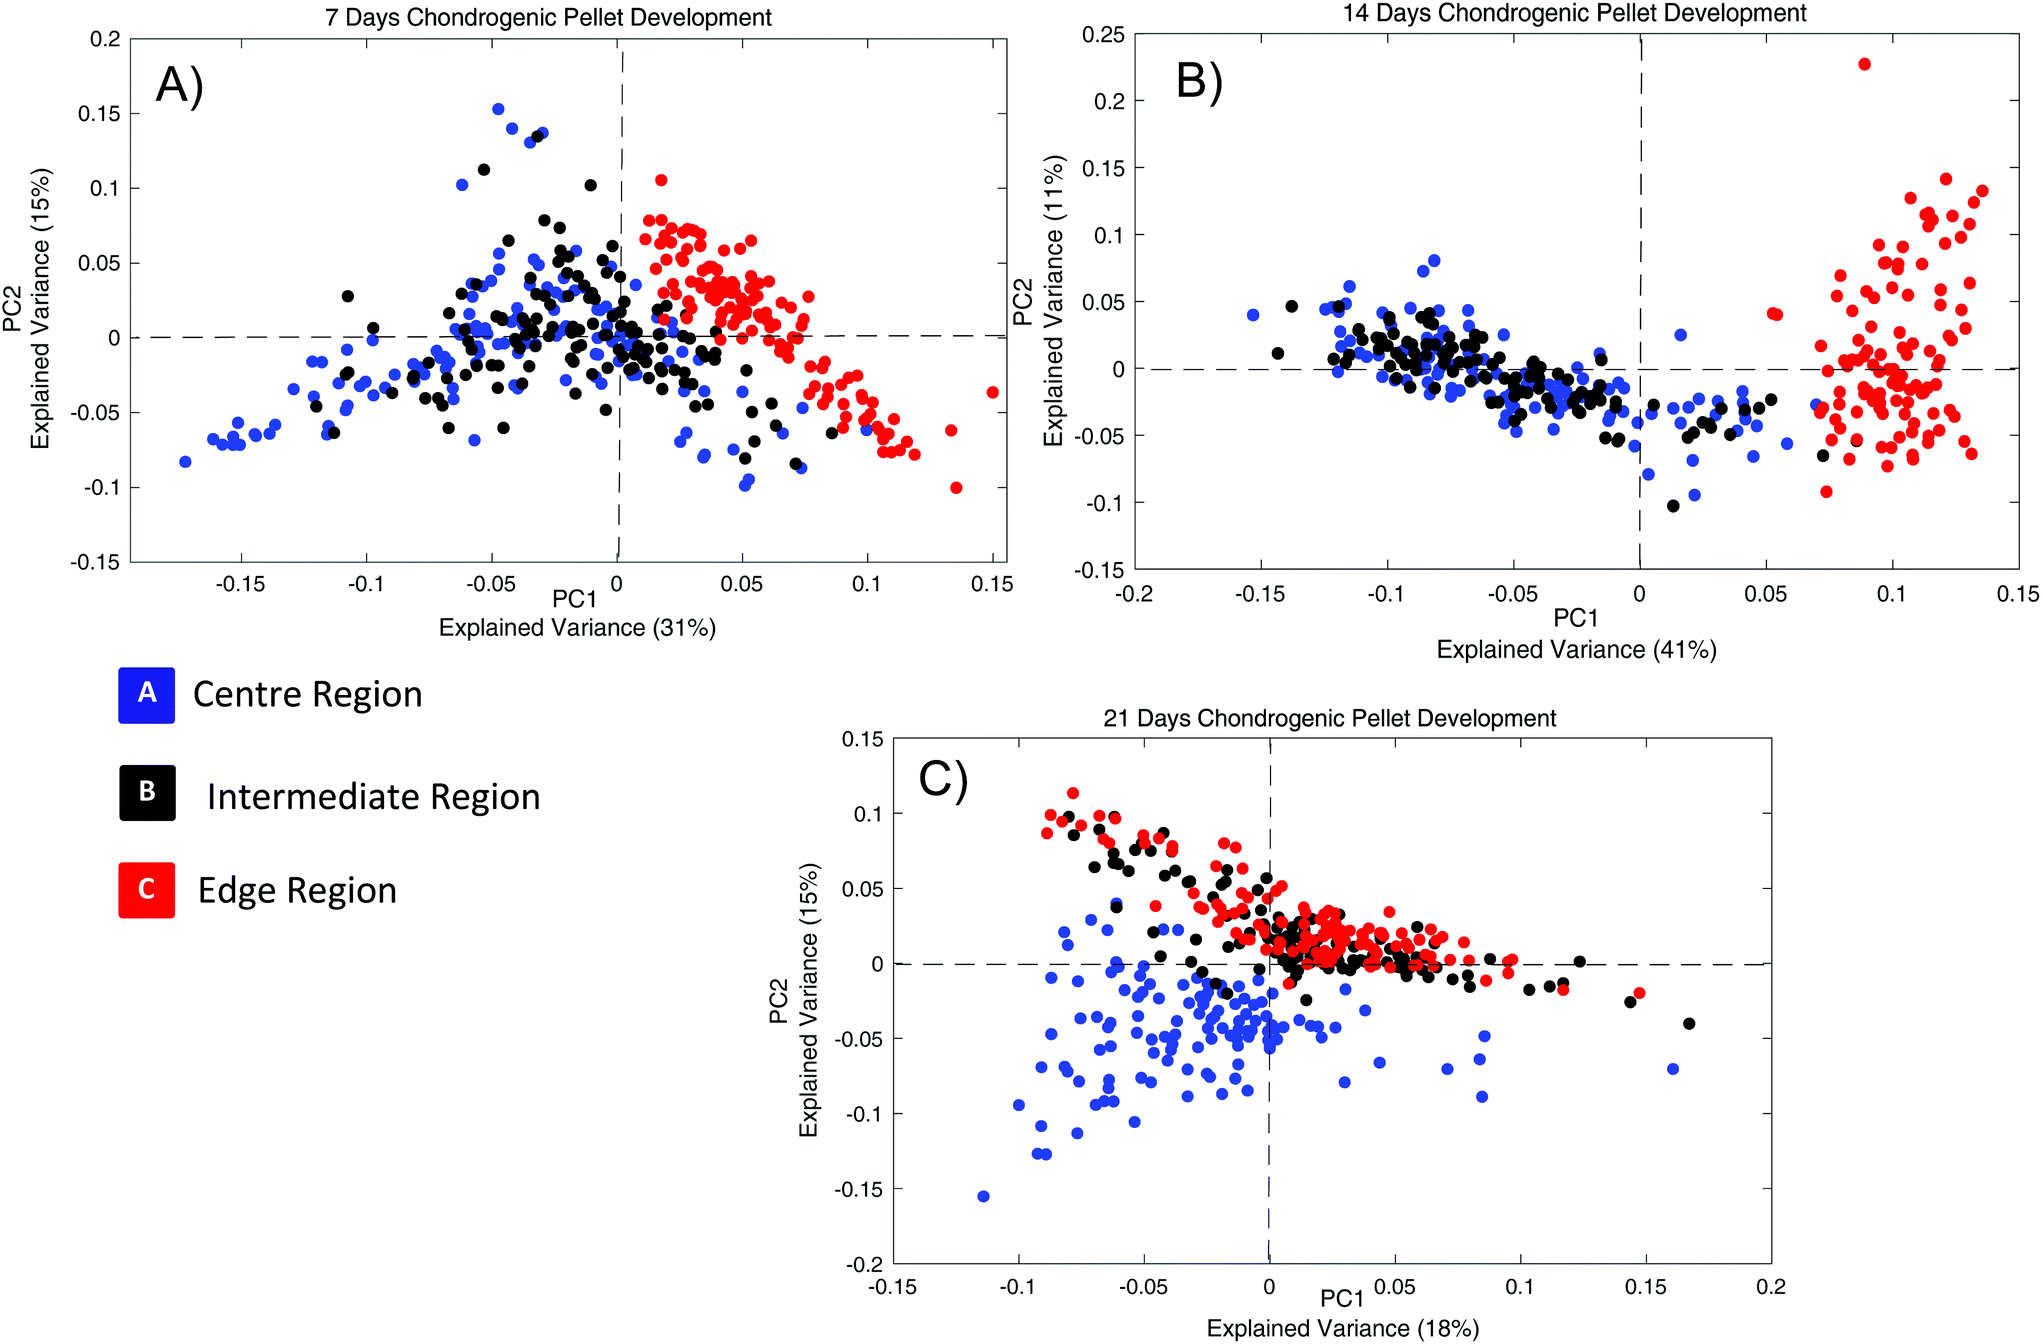 | ||
| Fig. 7 (A) Representative example of scatter plot of the PCA, corresponding to comparison of the pellet regions (A, B and C), after 7 (A), 14 (B), and 21 days (C). | ||
Following 14 days of differentiation process, the separation between the Edge (C) and the other regions, A and B has further increased: the positive aspect of PC1 is fully dominated by spectra of the Edge region, while, A and B spectra almost completely overlap. The similarity of cells that are located in the Central and Intermediate regions of the chondrogenic pellet (A, B) is already observable, after the first 7 days of the differentiation process. Notably, regions A and B appears to become more homogenised upon prolonged differentiation, while C remains completely distinct from the two.
After a further 7 days differentiation, however, the Edge and Intermediate regions are now grouped together at 21 days, and distributed across the positive and negative aspects of PC1, whereas the central region is now seen to be differentiated, clustered as it is on the negative side of PC1, as shown in Fig. 7C. PCA of the spectroscopic features of the three different regions of the pellet, and the evolution of their distributions in the scatter plots of Fig. 7 provides some information about the differences in the biochemical composition of the three regions of the pellet at the two different stages of differentiation, the pre chondrogenic condensation and the early chondrocytes differentiation, the first and second phases, respectively.
After 7 and 14 days, the clear separation of the cells in the Edge region, and greater similarity of regions A and B, can be attributed to a higher concentration of cells located in these more central regions, which are committed to the first phase of differentiation (see Introduction), the pre-chondrogenic condensation. It is interesting to observe that, the cells in the Centre region, A, seem to approach the condensation phase within the first 7 days, and gradually cells of the Intermediate region converge with A after 14 days of differentiation. At these stages, the cells of the Edge region, surrounding the pre-chondrogenic condensation exhibit a retarded development, and therefore they show a significant degree of separation in the scatter plot of PCA.
After 21 days, however, the observed overlap of the Intermediate and the Edge region in the scatterplot of Fig. 7C can be attributed to the fact that the latter has also evolved to the pre-chondrogenic condensation phase. On the other hand, further significant changes in the biochemical composition of the cells located in the Centre region of the pellet culture has occurred, such that they are now spectroscopically distinct from those of the Intermediate and Edge regions, probably due to their progression through the subsequent second stage of maturation. Cells are not yet differentiated when the pre-chondrogenic mass forms.74 However, after 21 days of the process, as other studied have shown,75–77 cells at the Centre of the pre-chondrogenic condensate undergo the second and final phase of chondrogenesis. The overall process of MSC differentiation to fully differentiated chondrocytes, via formation of the condensate, is seen to originate at the Centre region and progressively spread towards the Edge regions.
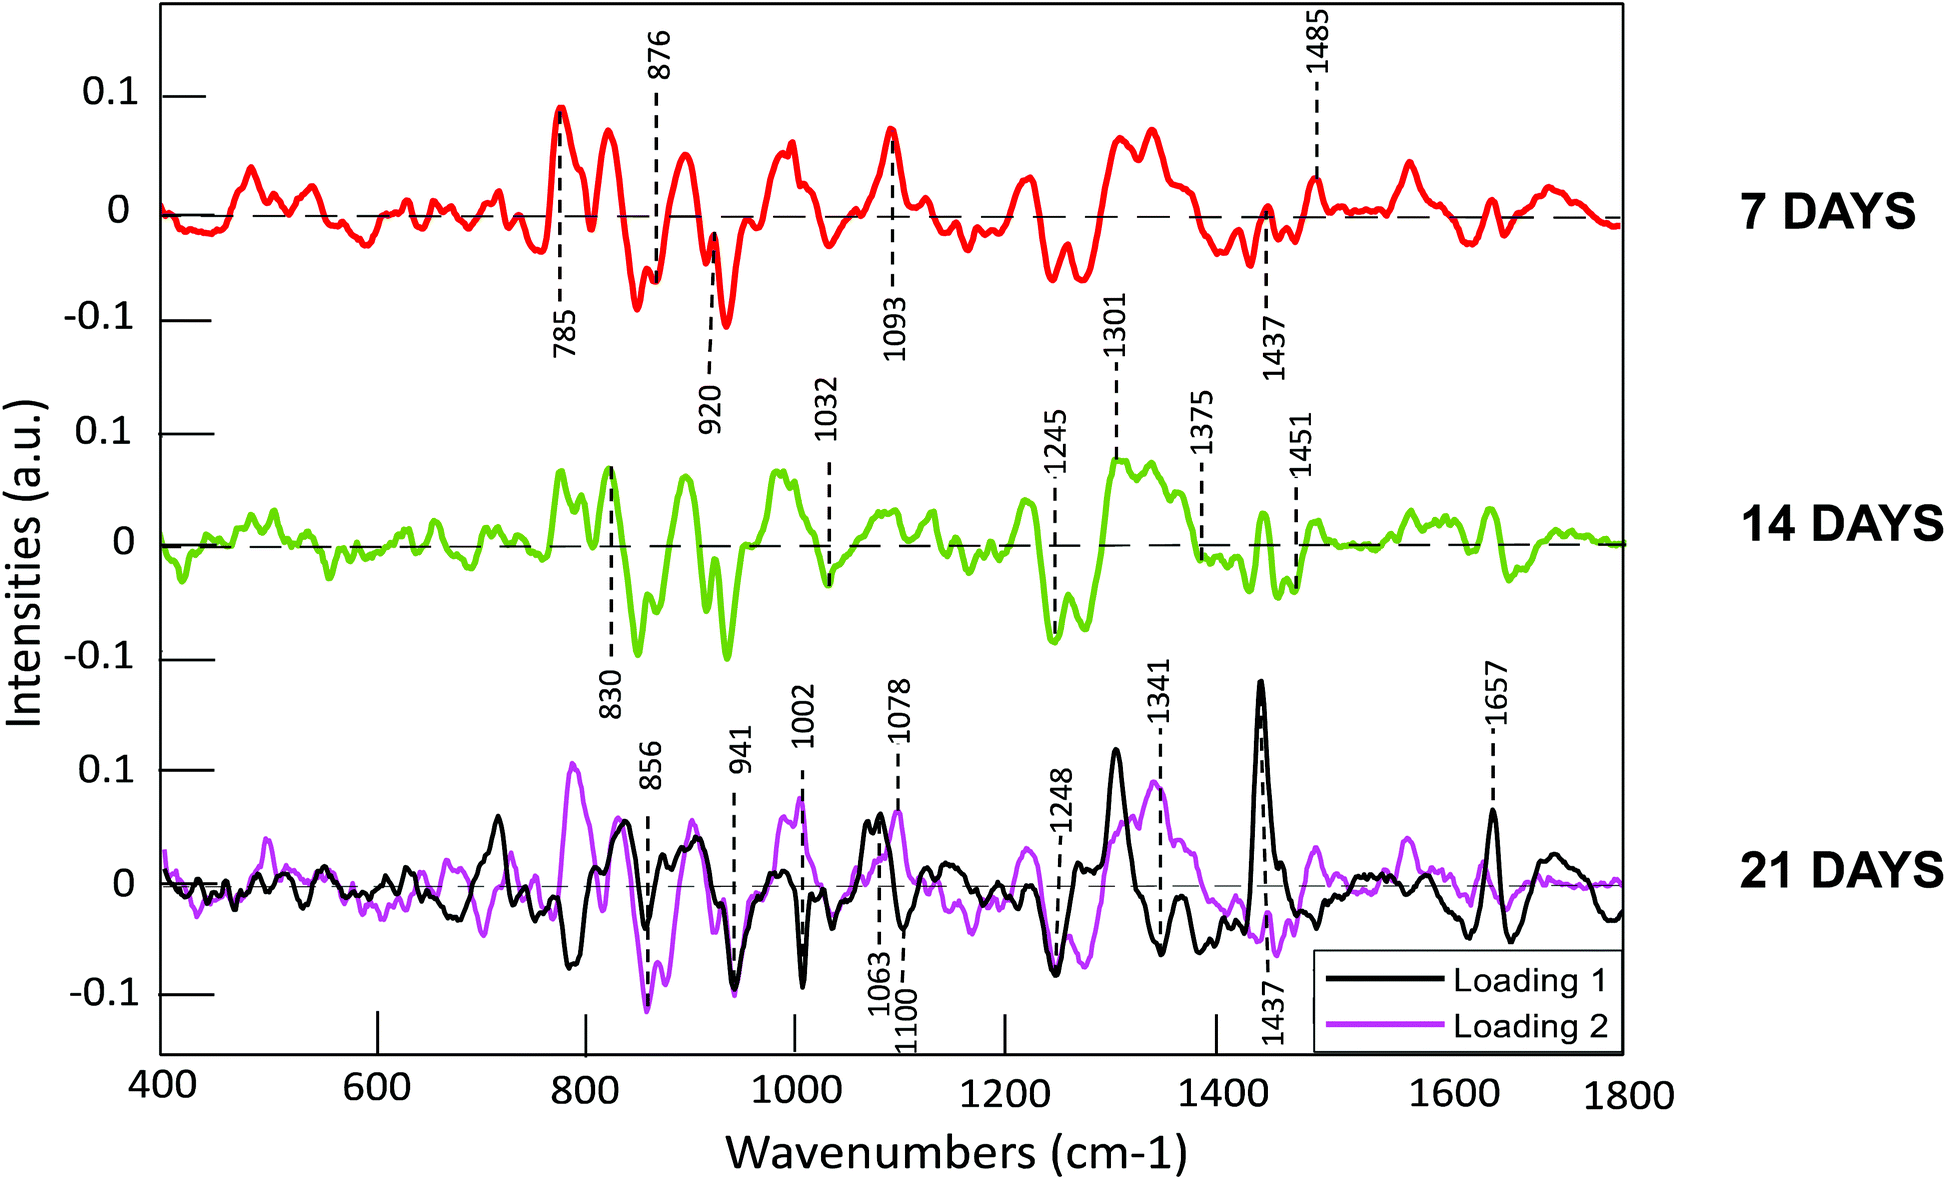
In order to further elucidate the spectroscopic signatures associated with the evolution of the from the analysis of A, B, C pellet regions, and therefore accomplish a greater understanding of the two different phases of chondrogenesis, the first and second loadings of the PCA were also examined (Fig. 8). Fig. 8 shows the loadings of the differentiating PCs of the scatter plots (Fig. 7) corresponding to the comparison of the pellet regions after 7 (PC1), 14 (PC1), and 21 (PC1 and PC2) days. It is observable from the scatter plots, that the positive area of the loading of 7th day and 14th day of differentiation (coloured in red and green, respectively) are mainly occupied by Edge region (red cluster) features, with a higher discrimination degree by the 14th day of differentiation.
 | ||
| Fig. 8 Loadings of PC1 for comparison of the pellet regions (A, B and C), after 7 (red) and 14 days (green). Loadings of PC1and PC2 of the comparison of the pellet regions after 21 days (in black and purple respectively). Positive features of the loadings represent the positive region in the respective scatter plot, whereas negative features represent the negative region (Fig. 7). The dashed line represents the zero ‘0′ point for each loading. | ||
The features of PC1 for 7 and 14 days are almost identical and are very similar to those of PC2 after 21 days, and the positive features are associated with the less evolved Edge and later Intermediate area of the pellet.
It is important to note, that the loadings represent the evolution of the cell clusters, including the perinuclear regions and surrounding cytoplasm of the cells, rather than distinct subcellular regions of individual cells and so they cannot be directly compared with the loadings of Fig. 4.
Nevertheless, as the regions of the pellet evolve, as in the study of individual cells (section 3.2), considerable activity within the spectral region between ∼750 and 850 cm−1 is indicative of evolution of the nucleic acid content of the cells. In general, the RNA associated bands at, for example 785 cm−1, score positively in all 3 loadings, associated with the first differentiation phase of chondrogenic condensation (see Introduction), which is relatively rich in RNA, consistent with a reduction of RNA contributions as the differentiation progresses. DNA bands, such as those at 830 cm−1, 1093 cm−1 and 1485 cm−1 score positively, consistent with the observations of the individual cell analysis, indicating an increased DNA content in this first phase of chondrogenesis, which is also prevalent in the Edge and Intermediate regions after 21 days, as represented by PC2.
PC1 at 7 and 14 days, as well as PC2 at 14 days also exhibit numerous characteristic bands of proteins, especially related to collagen, which play a crucial role in the initial stages of cartilage formation. Such bands of collagen are observed at 815, 856, 876 cm−1, while additionally peaks seen at and 1451 cm−1 and 1488 cm−1, which are related to CH2CH3 deformation,51 can also be assigned to collagen, confirming that is a prominent component of the early stages of condensate formation. These strong peaks were consistently manifest at all the 3 timepoints, especially the sharp doublet peak at 815 cm−1, 876 cm−1 and 920 cm−1 (proline and hydroxyproline, collagen assignment), which is a consistent negative feature of the scatterplots, and therefore corresponds to region A and B, the Centre and the Intermedium area, respectively. Proline is involved in the formation of the triple helix structure of the collagen molecule.78,79 The formation of the triple helix may result in changes in proline location and hydroxylation mechanisms.78,79 Contributions of C–O–C vibrations of polysaccharides51 and CH3CH2 of the GAGs22,70 are also observable in the PC1 loadings at 7 and 14 days and PC2 at 21 days, identifiable at 941 cm−1,22 peaks amongst the range of 1375 cm−1 and 1410 cm−1,80 and 1248 cm−1,22 which are related to the sulphate vibrational mode of the GAGs (C–O–S and SO3respectively).81 Chondroitin sulphate and heparin sulphate have been observed to be considerably expressed in chondrocytes,82 and it can be seen that these compounds begin to become prominent at the early stages of pre-chondrocyte condensation.
Positive features were observed in the PC1 of the 21 day analysis (Fig. 8, black) which identify the final stage of chondrocyte differentiation, at 1063 cm−1, 1078 cm−1 and 1301 cm−1, that had been assigned to SO3(GAG),70 C–C assignment (phospholipids)41 and lipids.51 Moreover peaks at 1437 cm−1, 1657 cm−1,51 which correspond to lipids and fatty acid vibrations, have been identified. Lipidic contents and their effect on mesenchymal stem cell differentiation towards chondrocytes have been studied83 and some species of lipids, including fatty acids (FAs), sphingolipids (SLs), and phospholipids (PLs), have been identified as fundamental for proper cartilage formation, due to their effect on the chondrogenic phenotype.51,84 Phosphatidylcholines (PLs class) and sphingomyelins (SLs class), levels of which have been shown to decrease during chondrogenic differentiation,85 are responsible of the production of secondary metabolites, involved in cellular growth, signalling, differentiation.86 The mobilisation of them could explain the dramatic loss of relative lipid content (as represented by the positive lipidic peaks associated with the other regions of the pellet at 1437 cm−1, 1657 cm−1) after 21 days in the Centre region (Fig. 8, PC1), the most advanced stage of chondrogenic differentiation.
Prominent features of PC1 at this stage are also observable at 782 cm−1 (DNA content), 856 cm−1 (proline and hydroxyproline content), 1002 cm−1 (phenylalanine/proteins content), 1032 cm−1 (CH2CH3 bending modes of collagen), 1245 cm−1 (Amide III of collagen) and 1341 cm−1 (CH3CH2 of GAGs), which were previously identified in the subcellular regions of individual cells analysis (Fig. 4).40,51,68 Further sharp peaks were 1100 cm−1 (amide III C–C vibration of collagen),51 1635 cm−1 (differences in collagen).87 These peaks scored negatively in the scatter plot (PC1 < 1) and are therefore related to the Centre of the pellet (Table 2).
| Peak position (cm−1) | Band assignment |
|---|---|
| 815 | CH2CH3 (collagen) |
| 856 | Collagen, proline |
| 876 | Collagen hydroxyproline |
| 920 | C–C, proline ring (collagen assignment) |
| 938 | Collagen hydroxyproline |
| 941 | C–O–C of GAGs |
| 1002 | Phenylalanine (collagen assignment) |
| 1032 | CH2CH3 (collagen) |
| 1063 | SO3(GAGs) |
| 1078 | Phosopholipids |
| 1100 | Amide III of collagen |
| 1245 | Amide III of collagen |
| 1248 | SO vibrational mode (GAGs) |
| 1275 | Amide III (collagen assignment) |
| 1301 | Triglycerides (fatty acids) |
| 1335 | CH3CH2 (GAGs) |
| 1350 | Amide III (collagen assignment) |
| 1375–1410 | (GAGs) |
| 1437 | Lipids |
| 1451 | CH2CH3 deformation (collagen assignment) |
| 1488 | Protein, CC, collagen |
| 1340–1415 | CH2 deformation |
| 1657 | Lipids content |
These results demonstrate that Raman has the ability to show significant differences in the alpha helical structure of amide band,89 and therefore distinguish between type I and type III and IV collagen, as previously mentioned (section 3.1), and provide an assessment of the changes in the structure of the pellet throughout the differentiation process. The proliferation of the cells has hence resumed, first in the centre of the pre cartilaginous condensations. A critical role for development of the chondrocytes is played by the transcription factor, Sox9,9 which codifies for the expression of the link protein, the aggrecan and Col9a1, the gene which provides instructions for manufacture of collagen type IX.7
Further significant changes in the biochemical composition of the cells located in the Centre region of the pellet culture have occurred, such that they are now spectroscopically distinct from those of the Intermediate and Edge regions, due to their progression through the subsequent second stage of maturation.
The evolution of the pre-chondrogenic micromass can be visualised as a 3D contour plot, as shown in Fig. 9.
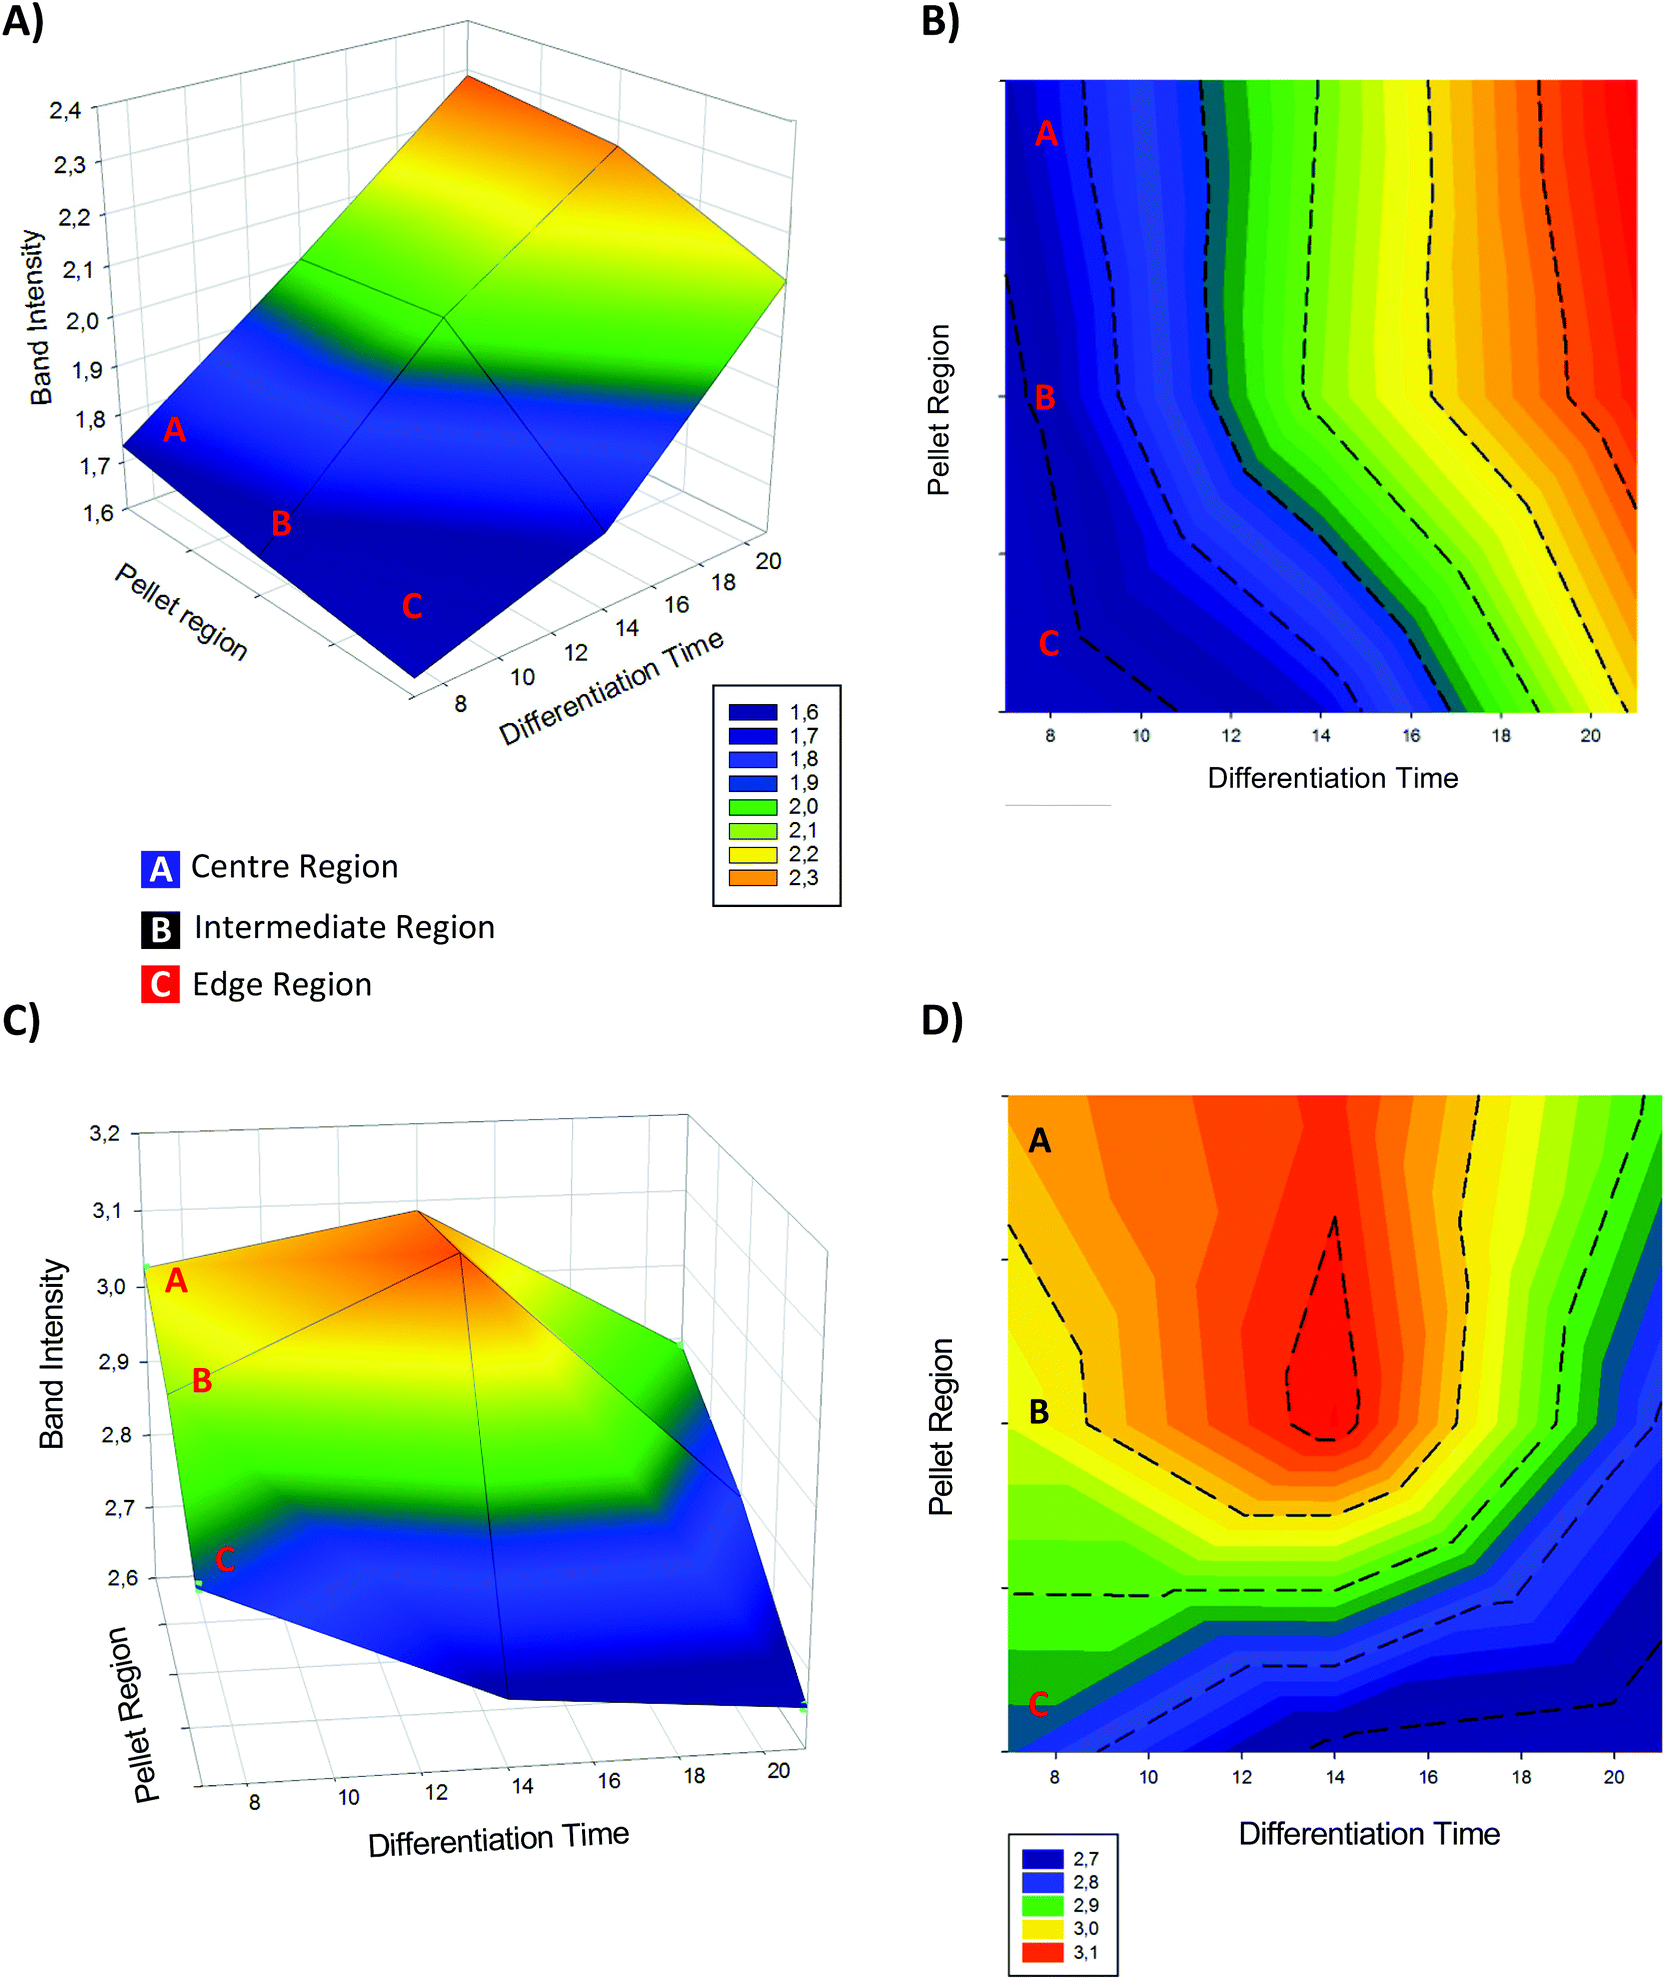 | ||
| Fig. 9 3D mesh and contour plot of 875 cm−1 (A) and (B) and 1437 cm−1 (C) and (D) spectral markers intensity as a function of the differentiation time (from day 7 to 21), and band intensity. | ||
The 867 and 1437 cm−1 bands have been identified as one of the most significant markers observed throughout the cartilage development process showing dramatic changes and progresses over the 7th, 14th and 21th days of pellet formation.
They correspond to the vibrations of hydroxyproline (collagen)78,79 and the contribute of lipids51 respectively.
Intensity of 876 cm−1 band (Fig. 9A and B) is seen to be weakest in the Edge region (C) at the 7th day, increasing towards the Centre region.
After 14th days an overall increase of all the regions is observed, successively followed by a secondary increase of the intensity up to the 21st day of differentiation.
The band at 1437 cm−1 (Fig. 9C and D) originates from CH2 deformation from lipids content, and consistently with the pattern observed in the correspondent loadings (Fig. 8) it displays a different evolution towards the 21st day of chondrogenesis.
At 14 days, the intensity of Centre and Side regions increased and (approximately) equilibrated, whereas the Edge showed a depletion in intensity.
After 14th day to the 21st instead, region C kept showing a decrease, and the intensity of regions A and B decreased dramatically, indicating a consistent diminution of the lipidic contributes, as previously observed.
The 3D representation of the 21 days analysis is consistent with the observations of the PCA scatter plot of Fig. 7, elucidating the initial stages of pre-chondrocyte condensation, and later progressive maturation towards chondrocytes. The multivariate analysis clearly demonstrates the significant transformation of the nuclear characteristics in the earliest stages of differentiation, and the continuous elaboration of the content of the ECM.
4. Conclusions
In this study, Raman spectroscopy has been shown to be an effective technique for monitoring the stem cell differentiation process at a subcellular level and also the evolution of the extracellular matrix in the initial stages of tissue generation. The analysis of subcellular regions showed that molecular changes occur in the nuclear region of the cell throughout the differentiation of MSCs, although the cytoplasmic region manifests a high degree of spectrally significant changes, as the extracellular matrix is generated. In the process of chondrogenesis, the sequential stages of triggered differentiation, pre-chondrogenic condensation, and chondrocyte maturation are clearly delineated.Characteristic signatures of several specific macromolecules of the ECM are identifiable in the early stages of condensation, including collagen type II, proteoglycans, adhesion molecules, and several other proteins, whereas, in the latter stages, elaboration of the lipidic content of the ECM appears to be most significant.
The study demonstrates that Raman microspectroscopy can contribute to the understanding of the biochemical evolution underpinning the cellular progression from the undifferentiated status, through the condensation stage through to their final transition to chondrocytes. The technique can simultaneously effectively monitor the process of generation of the ECM and the early stages of tissue generation.
Conflicts of interest
There are no conflicts to declare.Acknowledgements
FR acknowledges financial support from the TU Dublin Fiosraigh Postgraduate Scholarship Programme.References
- S. Stewart, Stem Cells Handbook, Humana Press, Division of Translational Medicine, Wadsworth Center State Department of Health, New York Albany, NY, USA, 2nd edn, 2013 Search PubMed.
- S. Wang, X. Qu and R. C. Zhao, J. Hematol. Oncol., 2012, 5, 19 CrossRef CAS.
- J. K. Pijanka, D. Kumar, T. Dale, I. Yousef, G. Parkes, V. Untereiner, Y. Yang, P. Dumas, D. Collins, M. Manfait, G. D. Sockalingum, N. R. Forsyth and J. Sulé-Suso, Analyst, 2010, 135, 3126–3132 RSC.
- A. I. Caplan, J. Orthop. Res., 1991, 9, 641–650 CrossRef CAS.
- J. Sulé-Suso, N. R. Forsyth, V. Untereiner and G. D. Sockalingum, Trends Biotechnol., 2014, 32, 254–262 CrossRef.
- A. Ghita, F. C. Pascut, V. Sottile, C. Denning and I. Notingher, EPJ Tech. Instrum., 2015, 2, 6 CrossRef.
- S. M. Richardson, G. Kalamegam, P. N. Pushparaj, C. Matta, A. Memic, A. Khademhosseini, R. Mobasheri, F. L. Poletti, J. A. Hoyland and A. Mobasheri, Methods, 2016, 99, 69–80 CrossRef CAS.
- V. Lefebvre and P. Bhattaram, in Current Topics in Developmental Biology, ed. P. Koopman, Academic Press, 2010, ch. 8, pp. 291–317 Search PubMed.
- V. Lefebvre, R. R. Behringer and B. de Crombrugghe, Osteoarthritis Cartilage, 2001, 9, S69–S75 CrossRef.
- A. M. DeLise, L. Fischer and R. S. Tuan, Osteoarthritis Cartilage, 2000, 8, 309–334 CrossRef CAS.
- I. Sekiya, J. T. Vuoristo, B. L. Larson and D. J. Prockop, Proc. Natl. Acad. Sci. U. S. A., 2002, 99, 4397–4402 CrossRef CAS.
- Y. Xia, E. M. Darling and W. Herzog, J. Orthop. Res., 2018, 36, 620–631 CAS.
- Á. Fernández-Iglesias, R. Fuente, H. Gil-Peña, L. Alonso-Duran, M. García-Bengoa, F. Santos and J. M. López, Sci. Rep., 2020, 10, 6935 CrossRef.
- J. Aigner, J. Bujía, P. Hutzler and E. Kastenbauer, In Vitro Cell. Dev. Biol.: Anim., 1997, 33, 407–409 CrossRef CAS.
- M. Zayed, C. Caniglia, N. Misk and M. S. Dhar, Front. Vet. Sci., 2016, 3, 121 Search PubMed.
- I. Walter, M. Egerbacher, B. Wolfesberger and G. Seiberl, Scanning, 1998, 20, 511–515 CrossRef CAS.
- G. C. Godman and K. R. Porter, J. Biophys. Biochem. Cytol., 1960, 8, 719–760 CrossRef CAS.
- Y. Lin, R. Trouillon, G. Safina and A. G. Ewing, Anal. Chem., 2011, 83, 4369–4392 CrossRef CAS.
- C. Bour-Dill, M. P. Gramain, J. L. Merlin, S. Marchal and F. Guillemin, Cytometry, 2000, 39, 16–25 CrossRef CAS.
- A. D. Murdoch, L. M. Grady, M. P. Ablett, T. Katopodi, R. S. Meadows and T. E. Hardingham, Stem Cells, 2007, 25, 2786–2796 CrossRef CAS.
- L. A. Solchaga, K. J. Penick and J. F. Welter, Methods Mol. Biol., 2011, 698, 253–278 CrossRef CAS.
- S. Brézillon, V. Untereiner, H. T. Mohamed, J. Hodin, A. Chatron-Colliet, F.-X. Maquart and G. D. Sockalingum, Analyst, 2017, 142(148), 1333–1341 RSC.
- B. K. Hall and T. Miyake, Anat. Embryol., 1992, 186, 107–124 CrossRef CAS.
- C. Tacchetti, S. Tavella, B. Dozin, R. Quarto, G. Robino and R. Cancedda, Exp. Cell Res., 1992, 200, 26–33 CrossRef CAS.
- M. Solursh, T. F. Linsenmayer and K. L. Jensen, Dev. Biol., 1982, 94, 259–264 CrossRef CAS.
- B. K. Hall and T. Miyake, Int. J. Dev. Biol., 1995, 39, 881–893 CAS.
- B. K. Hall and T. Miyake, BioEssays, 2000, 22, 138–147 CrossRef CAS.
- C. B. Knudson and B. P. Toole, Dev. Biol., 1985, 112, 308–318 CrossRef CAS.
- B. P. Toole and R. L. Trelstad, Dev. Biol., 1971, 26, 28–35 CrossRef CAS.
- K. V. Greco, A. J. Iqbal, L. Rattazzi, G. Nalesso, N. Moradi-Bidhendi, A. R. Moore, M. B. Goldring, F. Dell'Accio and M. Perretti, Biochem. Pharmacol., 2011, 82, 1919–1929 CrossRef CAS.
- V. Lefebvre and M. Dvir-Ginzberg, Connect. Tissue Res., 2017, 58, 2–14 CrossRef CAS.
- V. Lefebvre, W. Huang, V. R. Harley, P. N. Goodfellow and B. de Crombrugghe, Mol. Cell. Biol., 1997, 17, 2336–2346 CrossRef CAS.
- S. Grässel, S. Stöckl and Z. Jenei-Lanzl, in Methods Mol. Biol., 2012/05/23 edn, 2012, vol. 879, ch. 13, pp. 203–267 Search PubMed.
- Y. S. Lee and C. M. Chuong, J. Bone Miner. Res., 1992, 7, 1435–1446 CrossRef CAS.
- F. Bonnier and H. J. Byrne, Analyst, 2012, 137, 322–332 RSC.
- I. Notingher, S. Verrier, S. Haque, J. M. Polak and L. L. Hench, Biopolymers, 2003, 72, 230–240 CrossRef CAS.
- M. S. Bergholt, A. Serio and M. B. Albro, Front. Bioeng. Biotechnol., 2019, 7, 303 CrossRef.
- N. Mainreck, S. Brezillon, G. D. Sockalingum, F. X. Maquart, M. Manfait and Y. Wegrowski, Methods Mol. Biol., 2012, 836, 117–130 CrossRef CAS.
- T. R. Rudd, R. Hussain, G. Siligardi and E. A. Yates, Chem. Commun., 2010, 46, 4124–4126 RSC.
- J. J. Lazarevic, T. Kukolj, D. Bugarski, N. Lazarevic, B. Bugarski and Z. V. Popovic, in Spectrochim Acta A Mol Biomol Spectrosc, Elsevier B.V., England, 2019, vol. 213, pp. 384–390 Search PubMed.
- M. Pudlas, E. Brauchle, T. J. Klein, D. W. Hutmacher and K. Schenke-Layland, J. Biophotonics, 2013, 6, 205–211 CrossRef CAS.
- P. Sangeetha, S. K. Maiti, D. Mohan, S. Shivaraju, R. Raguvaran, M. A. Rafee, B. V. Bindhuja, N. Kumar and P. D. S. Raguvanshi, Mesenchymal stem cells derived from rat bone marrow (rbm msc): techniques for isolation, expansion and differentiation, J. Stem Cell Res. Ther., 2017, 3, 272–277 Search PubMed.
- A. Lotfy, Y. M. El-Sherbiny, R. Cuthbert, E. Jones and A. Badawy, Biomed. Rep., 2019, 11, 165–170 CAS.
- H. Zhang, X. Ma, L. Zhang, X. Guan, T. Bai and C. Xue, Int. J. Clin. Exp. Med., 2015, 8, 4989–4996 CAS.
- Invitrogen TM Thermo-Scientific, 2009, vol. MAN0001768-A11561, p. 33 Search PubMed.
- R. Boyack and E. C. Le Ru, Phys. Chem. Chem. Phys., 2009, 11, 7398–7405 RSC.
- L. T. Kerr and B. M. Hennelly, A multivariate statistical investigation of background subtraction algorithms for Raman spectra of cytology samples recorded on glass slides, Chemom. Intell. Lab. Syst., 2016, 158, 61–68 CrossRef CAS.
- D. G. Kim, H. Esbensen, F. Westad and L. P. Houmoller, Multivariate Data Analysis: in Practice : An Introduction to Multivariate Data Analysis and Experimental Design, Camo Process AS, 5th edn, 2002 Search PubMed.
- R. Gautam, S. Vanga, F. Ariese and S. Umapathy, EPJ Tech. Instrum., 2015, 2, 8 CrossRef.
- R. Gautam, S. Vanga, F. Ariese and S. Umapathy, EPJ Tech. Instrum., 2015, 2, 1–38 CrossRef.
- Z. Movasaghi, S. Rehman and I. U. Rehman, Appl. Spectrosc. Rev., 2014, 50, 46–111 Search PubMed.
- G. Karp, Cell and molecular biology : concepts and experiments, John Wiley, Hoboken, NJ, 6th edn, 2010 Search PubMed.
- E. Efeoglu, A. Casey and H. J. Byrne, Analyst, 2016, 141, 5417–5431 RSC.
- M. J. German, A. Hammiche, N. Ragavan, M. J. Tobin, L. J. Cooper, S. S. Matanhelia, A. C. Hindley, C. M. Nicholson, N. J. Fullwood, H. M. Pollock and F. L. Martin, Biophys. J., 2006, 90, 3783–3795 CrossRef CAS.
- A. Bertoluzza, C. Fagnano and P. Monti, Spectroscopy of Biological Molecules State of the Art, Società Editrice Esculapio s.r.l, Via Terracini 30, 1989 Search PubMed.
- I. Notingher and L. L. Hench, Expert Rev. Med. Devices, 2006, 3, 215–234 CrossRef CAS.
- I. Notingher, Sensors, 2007, 343–1358 Search PubMed.
- I. Notingher, I. Bisson, A. E. Bishop, W. L. Randle, J. M. Polak and L. L. Hench, Anal. Chem., 2004, 76, 3185–3193 CrossRef CAS.
- B. Gharibi and F. J. Hughes, Stem Cells Transl. Med., 2012, 1, 771–782 CrossRef CAS.
- P. Sangeetha, S. K. Maiti, D. Mohan, S. Shivaraju, R. Raguvaran, M. A. Rafee, B. V. Bindhuja, N. Kumar and P. D. S. Raguvanshi, J. Stem Cell Res. Ther., 2017, 3, 272–277 Search PubMed.
- C. Miao, S. Mu, P. Duan, X. Liang, B. Yang, G. Zhou and S. Tang, Artif. Cells, Blood Substitutes, Immobilization Biotechnol., 2009, 37, 214–221 CrossRef CAS.
- L. Fan, Z. Ge and J. Lin, Osteoarthritis Cartilage, 2016, 24, 149–150 CrossRef.
- H. Yoshimura, T. Muneta, A. Nimura, A. Yokoyama, H. Koga and I. Sekiya, Cell Tissue Res., 2007, 327, 449–462 CrossRef CAS.
- Z. Farhane, F. Bonnier, A. Casey, A. Maguire, L. O'Neill and H. J. Byrne, Analyst, 2015, 140, 5908–5919 RSC.
- D. Ami, T. Neri, A. Natalello, P. Mereghetti, S. M. Doglia, M. Zanoni, M. Zuccotti, S. Garagna and C. A. Redi, Biochim. Biophys. Acta, 2008, 1783, 98–106 CrossRef CAS.
- U. Zelig, Z. Dror, S. Iskovich, A. Zwielly, M. Ben-Harush, I. Nathan, S. Mordechai and J. Kapelushnik, J. Biomed. Opt., 2010, 15, 037008 CrossRef.
- J. Cerny and P. J. Quesenberry, J. Cell Physiol., 2004, 201, 1–16 CrossRef CAS.
- C. Aksoy and F. Severcan, J. Spectrosc., 2012, 27, 167–184 CrossRef CAS.
- M. D. Shoulders and R. T. Raines, Annu. Rev. Biochem., 2009, 78, 929–958 CrossRef CAS.
- R. Ellis, E. Green and C. P. Winlove, Connect. Tissue Res., 2009, 50, 29–36 CrossRef.
- N. Mainreck, S. Brezillon, G. D. Sockalingum, F. X. Maquart, M. Manfait and Y. Wegrowski, J. Pharm. Sci., 2011, 100, 441–450 CrossRef CAS.
- S. W. Gay and R. A. Kosher, J. Exp. Zool., 1984, 232, 317–326 CrossRef CAS.
- K. Daniels and M. Solursh, J. Cell Sci., 1991, 100(Pt 2), 249–254 Search PubMed.
- H. B. Fell, J. Morphol., 1925, 40, 417–459 CrossRef.
- Z. Bradamante, L. Kostović-Knezevic, B. Levak-Svajger and A. Svajger, Int. J. Dev. Biol., 1991, 35, 311–320 CAS.
- M. B. Mueller, M. Fischer, J. Zellner, A. Berner, T. Dienstknecht, L. Prantl, R. Kujat, M. Nerlich, R. S. Tuan and P. Angele, Cells Tissues Organs, 2010, 192, 158–166 CrossRef CAS.
- C. C. Zuliani, M. F. Bombini, K. C. d. Andrade, R. Mamoni, A. H. Pereira and I. B. Coimbra, Clinics, 2018, 73, e268–e268 CrossRef.
- K. A. Dehring, A. R. Smukler, B. J. Roessler and M. D. Morris, Appl. Spectrosc., 2006, 60, 366–372 CrossRef CAS.
- M. Gąsior-Głogowska, M. Komorowska, J. Hanuza, M. Ptak and M. Kobielarz, Acta Bioeng. Biomech., 2010, 12, 55–62 Search PubMed.
- M. S. Bergholt, J. P. St-Pierre, G. S. Offeddu, P. A. Parmar, M. B. Albro, J. L. Puetzer, M. L. Oyen and M. M. Stevens, ACS Cent. Sci., 2016, 2, 885–895 CrossRef CAS.
- G. J. Miller, S. U. Hansen, M. Baráth, C. Johannessen, E. W. Blanch, G. C. Jayson and J. M. Gardiner, Carbohydr. Res., 2014, 400, 44–53 CrossRef CAS.
- S. L. Carney and H Muir, Physiol. Rev., 1988, 68, 858–910 CrossRef CAS.
- B. Cillero-Pastor, G. Eijkel, A. Kiss, F. J. Blanco and R. M. Heeren, Anal. Chem., 2012, 84, 8909–8916 CrossRef CAS.
- C. M. Simonaro, S. Sachot, Y. Ge, X. He, V. A. Deangelis, E. Eliyahu, D. J. Leong, H. B. Sun, J. B. Mason, M. E. Haskins, D. W. Richardson and E. H. Schuchman, PLoS One, 2013, 8, e62715 CrossRef CAS.
- B. Rocha, B. Cillero-Pastor, G. Eijkel, A. L. Bruinen, C. Ruiz-Romero, R. M. Heeren and F. J. Blanco, Proteomics, 2015, 15, 702–713 CrossRef CAS.
- A. H. Merrill Jr., E. M. Schmelz, D. L. Dillehay, S. Spiegel, J. A. Shayman, J. J. Schroeder, R. T. Riley, K. A. Voss and E. Wang, Toxicol. Appl. Pharmacol., 1997, 142, 208–225 CrossRef CAS.
- R. K. Dukor, Vibrational Spectroscopy in the Detection of Cancer, in Handbook of Vibrational Spectroscopy, 2006 Search PubMed.
- H. J. S. Byrne and D. Ganesh, Stone, Nick, in Biomedical Applications of Synchrotron Infrared Microspectroscopy: A Practical Approach, ed. D. Moss, Royal Society of Chemistry, 2010, ch. 4, pp. 105–143 Search PubMed.
- T. T. Nguyen, C. Gobinet, J. Feru, S. Pasco, M Manfait and O. Piot, J. Spectrosc., 2012, 27, 421–427 CrossRef CAS.
- W. R. Atchley and B. K. Hall, Biol. Rev., 1991, 66(2), 101–157 CrossRef CAS.
| This journal is © The Royal Society of Chemistry 2021 |