
Information-rich high-throughput cellular assays using acoustic mist ionisation mass spectrometry†
Martin
Bachman
 *ab,
Ian
Sinclair
b,
Delyan
Ivanov
c and
Jonathan
Wingfield
c
*ab,
Ian
Sinclair
b,
Delyan
Ivanov
c and
Jonathan
Wingfield
c
aDiscovery Science & Technology, Medicines Discovery Catapult, Alderley Park, UK. E-mail: martin.bachman@md.catapult.org.uk
bSample Management, Discovery Sciences, R&D, AstraZeneca, Alderley Park, UK
cMechanistic Biology and Profiling, Discovery Sciences, R&D, AstraZeneca, Cambridge, UK
First published on 23rd October 2020
Abstract
Cellular metabolites and phospholipids contain a vast amount of information about the current state of a cell, and are a useful resource for understanding the effects of drug candidates in vitro. Typical human cell-based assays in early drug discovery rely on simple readouts such as cell viability, or focus on single end-points revealed by an antibody or other label-based technologies. We introduce a generic 384-well plate-based workflow for data-rich cellular assays using facile sample preparation and direct analysis by acoustic mist ionization mass spectrometry (AMI-MS). The assays are compatible with adherent and suspension cells, and provide simultaneous information about a number of cellular small-molecule components (e.g., amino acids, nucleotides, phospholipids), cellular processes (e.g., proliferation, glycolysis, oxidative stress), as well as compound uptake and metabolism. Thanks to the high-throughput and low cost of analysis, the workflow can be introduced very early into any drug discovery pipeline to help select optimal lead molecules.
Introduction
As part of drug discovery and development, candidate molecules are studied in simple (2D) and complex (3D) cellular models to confirm their activity on the desired molecular target, and to reveal any off-target effects that cannot be predicted from biochemical assays. The quality and breadth of the obtained information is key to the future success of candidate drugs in subsequent pre-clinical and clinical studies. Due to technical challenges and high cost, many cell-based assays rely on very simple readouts such as cell viability or cell death without deeper understanding of the underlying mode of action. This often leads to progressing compounds that are sub-optimal, and it is partly the reason for the high attrition rate of new candidate drugs at very late stages of development.Mass spectrometry (MS) has the potential to simultaneously measure thousands of molecules that make up human cells (e.g., proteins, lipids, small metabolites) without the use of antibodies and labelling reagents, providing a fuller picture of how cells respond to the presence of a tested compound. Traditional MS methods use liquid chromatography (LC) to reduce the complexity of biological samples for analysis, but they are too slow to be deployed early in the discovery pipeline where variables such as compound numbers, concentrations, cell types or time points quickly generate thousands of samples for analysis.
Direct analysis MS approaches present a valuable compromise between sampling throughput and analyte coverage. A large number of ionisation and sample introduction methods are available to analyse various sample types and analyte classes, from the more traditional electrospray ionisation (ESI)1 and matrix-assisted laser desorption ionisation (MALDI)2 to ambient methods such as desorption electrospray ionisation (DESI),3 direct analysis in real time (DART)4 and many others.5–7 Flow injection ESI-MS workflow by Fuhrer et al. initially developed for untargeted metabolomics of bacterial lysates is particularly interesting as it relies on facile sample preparation and can be applied to virtually any cells or tissues with data acquisition of around 30 s per sample.8 However, miniaturisation to a 384-well format, as well as further automation of sample preparation and analysis remain an important bottleneck preventing wider use of MS methods for cell based assays in early drug discovery. A recent addition to the high-throughput MS toolbox is acoustic mist ionisation (AMI), a 384-well plate-based platform that relies on contactless charging of a liquid sample followed by direct infusion of a mist of femtolitre to picolitre-sized droplets into a quadrupole time-of-flight (qToF) mass detector.9,10 AMI-MS system can be fully automated and carry out large biochemical screens of millions of samples at rates of up to 3 samples per second.10 In this manuscript, we focus on the subsequent stage of early drug discovery and describe a generic, practical, automatable and 384-well-compatible workflow for high-content analysis of cultured mammalian cells using an AMI-MS endpoint.
Results and discussion
Generic AMI-MS assay overview and sample preparation
Intracellular concentrations of the most abundant metabolites range from μM to mM levels.11 We hypothesized that starting with a total intracellular volume of 10 nL (10![[thin space (1/6-em)]](https://www.rsc.org/images/entities/char_2009.gif) 000 cells based on an average volume of 1 pL per cell) and a lysis step in 50 μL (optimal volume for AMI) would efficiently dilute the most abundant analytes to the linear range of the AMI-MS platform (low nM to high μM levels).10 To avoid contamination of cell lysates with components of culture media, it was necessary to introduce a thorough plate-based wash step. Isotonic and pH-neutral solution of ammonium formate was compatible with all tested cell types and unlike standard phosphate-buffered saline, it contains no ion-suppressing inorganic salts. Adherent cells can be washed in an automated centrifugal plate washer or manually in a tabletop centrifuge if inverted on a piece of absorbing tissue. Suspension cells can be cultured in V-bottom 384-well plate to facilitate washing using a 384-well plate pipettor or a plate washer (Fig. 1).
000 cells based on an average volume of 1 pL per cell) and a lysis step in 50 μL (optimal volume for AMI) would efficiently dilute the most abundant analytes to the linear range of the AMI-MS platform (low nM to high μM levels).10 To avoid contamination of cell lysates with components of culture media, it was necessary to introduce a thorough plate-based wash step. Isotonic and pH-neutral solution of ammonium formate was compatible with all tested cell types and unlike standard phosphate-buffered saline, it contains no ion-suppressing inorganic salts. Adherent cells can be washed in an automated centrifugal plate washer or manually in a tabletop centrifuge if inverted on a piece of absorbing tissue. Suspension cells can be cultured in V-bottom 384-well plate to facilitate washing using a 384-well plate pipettor or a plate washer (Fig. 1).
 | ||
| Fig. 1 Overview of steps (1–5) in a cellular AMI-MS assay workflow. Cells are cultured, dosed with compounds, washed and lysed on the same 384-well plate. Lysates containing intracellular metabolites and membrane phospholipids are transferred to an acoustic plate for AMI-MS analysis. | ||
Cell lysis is carried out on the same microtiter plate using acidified ultrapure water and a simple freeze–thaw cycle. Organic solvents were avoided or kept low in concentration (e.g., <25% MeOH) if using typical polystyrene cell culture plates as they easily leach polymers which interfere with MS analysis. Since adherent cells do not typically attach on AMI-MS-enabled plates, and suspension cells cannot be efficiently washed on this flat-bottom plate, both cell types currently need a single pipette-based plate transfer of the lysate to an AMI-MS plate. Overall, the workflows are suitable for use with standard laboratory automation but are equally practical for manual handling.
Analyte coverage and assay reproducibility
To determine analyte coverage and overall performance of AMI-MS for cellular assays, we first analysed untreated adherent MCF7 (breast cancer) cells at a rate of nearly 2 samples per second (3.4 min per 384-well plate) and consuming less than 0.1% of the cell lysate (30 nL per well, translating to contents of ∼6 cells) (Fig. 2a). Typically, 15 nL of sample is pre-dispensed at the wrong polarity (i.e., positively charged mist in the negative ion mode), followed by 15 nL at the correct polarity, which together with the well-to-well movement of the stage provides sufficient baseline separation of the MS signal at scan rates of 100 ms (Fig. 2b). Extracted ion chromatograms for an abundant metabolite glutathione (GSH) and its internal standard (GSH-13C2,15N) added to lysis buffer also show that although there is a degree of variability in MS signal between individual wells, the ratio of an analyte to its internal standard is consistent (Fig. 2b). As with most MS techniques, the coefficient of variation (CV) for an analyte across technical replicates decreases with increasing ion count. We obtained CVs as low as 12% which includes the variability introduced by cell dispensing, culture, wash and lysis steps (Fig. S1†).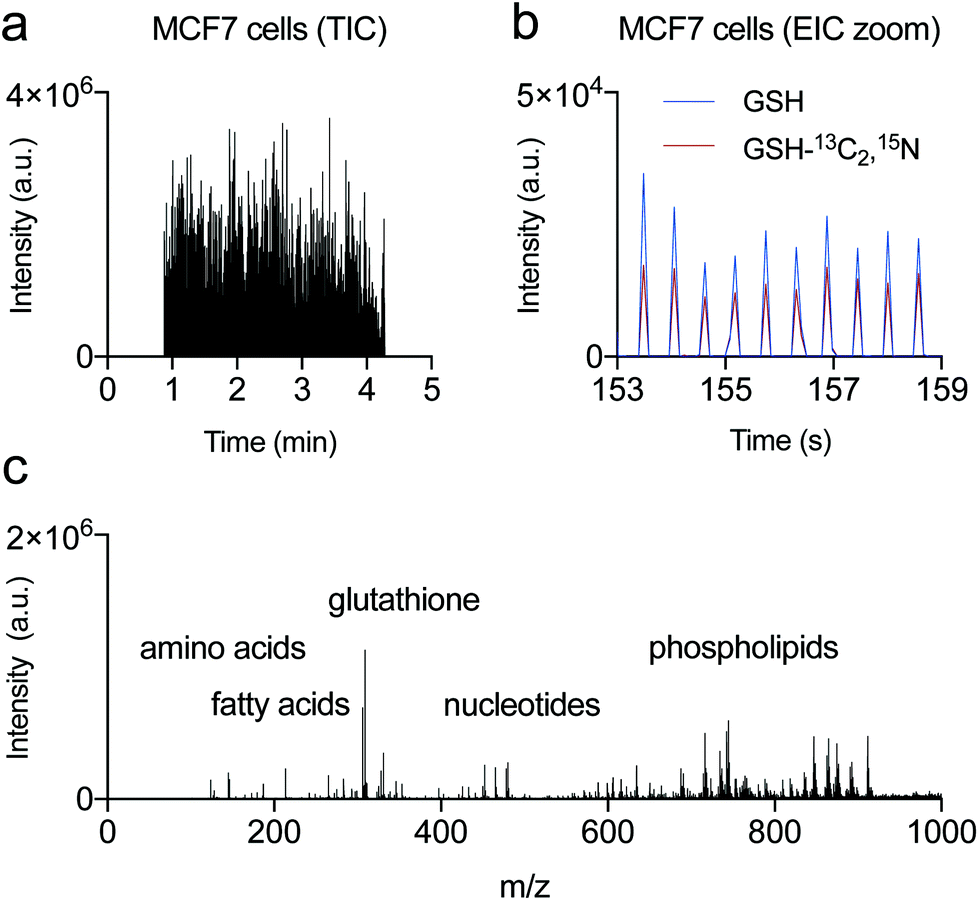 | ||
| Fig. 2 Intracellular metabolites and membrane phospholipids from MCF7 cells profiled by AMI-MS. (a) Total ion chromatogram (TIC) in negative ion mode of a single 384-well plate. (b) Overlaid extracted ion chromatograms (EIC) of glutathione (GSH) and its internal standard (GSH-13C2,15N) for 10 consecutive wells. Shown are combined spectra of an entire 384-well plate containing 10000 MCF7 cells per well, acquired in 3.4 min (0.53 s per sample). See also Fig. S1 and 2, Table S1 and Data S1 and 2.† | ||
Mass spectra were acquired in the negative ion mode over a mass-to-charge (m/z) range from 100 to 1000 Da and with resolving power of ∼20000 (m/Δm where Δm = full width of a peak at half maximum (FWHM)) at 200 m/z. 387 features with a signal to noise of at least 5:1 were detected, and 87 peaks were matched to a known abundant biologically relevant species spanning small metabolites, amino acids, nucleotides, fatty acids, and phospholipids of various classes (Fig. 2c, Table S1, Data S1†). Longer data acquisition times improve signal to noise across the entire spectrum as shown on example MS spectra from the suspension cell line HuT 78 acquired at rates of 0.76 s, 2.3 s and 7.6 s per well (Data S2†). A direct comparison of AMI against flow injection ESI on the same mass spectrometer and the same sample plate showed a similar coverage of molecular species, with AMI-MS spectra richer in the phospholipid region and poorer in polar metabolites compared to ESI-MS (Fig. S2†).
During AMI-MS data acquisition, each MS scan is annotated with plate barcode and well location in real time.10 This greatly simplifies data analysis, which can be reliably automated independent of how many plates are present in a batch, or in which order the wells are read. Genedata Expressionist, a commercial software package, was used to sum all MS scans originating from the same sample and create 384 individual spectra per plate. Typical further data processing steps include aligning m/z, peak picking, 13C isotope clustering and identification from public databases such as the Human Metabolome Database (HMDB),12 or from a simplified internal database relevant to the cell line or experiment. After a visual review, signal intensities can be exported for any number of analytes and any number of samples (Fig. S3†).
As part of the validation of the entire workflow, we processed 18 384-well plates of untreated HepG2 (hepatocellular carcinoma) cells which are commonly used for predicting liver toxicity of compounds at early stages of drug discovery. With a seeding density of 3500 cells per well and incubation period of 48 h, and with a throughput of 2 s per sample, we found that 38 analytes had a CV of less than 30% when normalized to an internal standard added after the lysis step (Fig. S4†). It is important to note that using exact isotopologues as internal standards further improves the CVs as illustrated using glutathione (mean CV 12%, Fig. S4†), and an appropriate mixture of internal standards should be selected depending on the analytes of interest.
A useful feature of AMI-MS is that samples can be infused at rates ranging from 0.3 seconds to several minutes per sample depending on the abundance of target analytes. We noticed that the first bursts of droplets from an aqueous cell lysate are richer in phospholipids than the subsequent bursts, which we believe is due to the membrane phospholipids acting as surfactants and migrating to the meniscus from where the mist of charged droplets is generated (Fig. S5†). This finding led us to try depositing a small amount of immiscible solvent such as tert-butyl methyl ether (TBME)13 on the surface of the aqueous lysate to further enhance phospholipid enrichment. Using this strategy, we achieved a dramatic improvement in signal intensity of phospholipids (∼20-fold) originating from just 1000 adherent cells per well (Fig. S6†).
Information-rich cellular assays
The ability to simultaneously measure compound penetration and cellular response to the treatment can offer valuable data for quick triage of drug candidates, understanding structure–activity relationships or informing the synthesis of analogues with improved properties. To provide a simple example, we treated caco-2 cells (human epithelial colorectal adenocarcinoma typically used for compound permeability studies) with bis-2-(5-phenylacetamido-1,2,4-thiadiazol-2-yl)ethyl sulphide (BPTES), an inhibitor of glutaminase 1 (GLS1).14 Using a standalone Echo550 acoustic dispenser, we dosed BPTES at 2 concentrations across 15 time points (1–120 min) and 12 replicates (a total of 576 samples including vehicle and untreated controls). Normalised compound intensity showed a steep rise over the first 20 min of treatment before reaching a plateau that quantitatively reflected dosed compound concentrations (Fig. 3a and b). At the same time, the data revealed a rapid effect on the glutamine-glutamate balance resulting from successful inhibition of glutaminase activity (Fig. 3c). Importantly, compared to flow injection ESI-MS, we observed no carryover or cross contamination of neighbouring wells that can often be the case when analysing chemically adsorbing compounds using high-throughput contact-based analytical methods (Fig. S7†).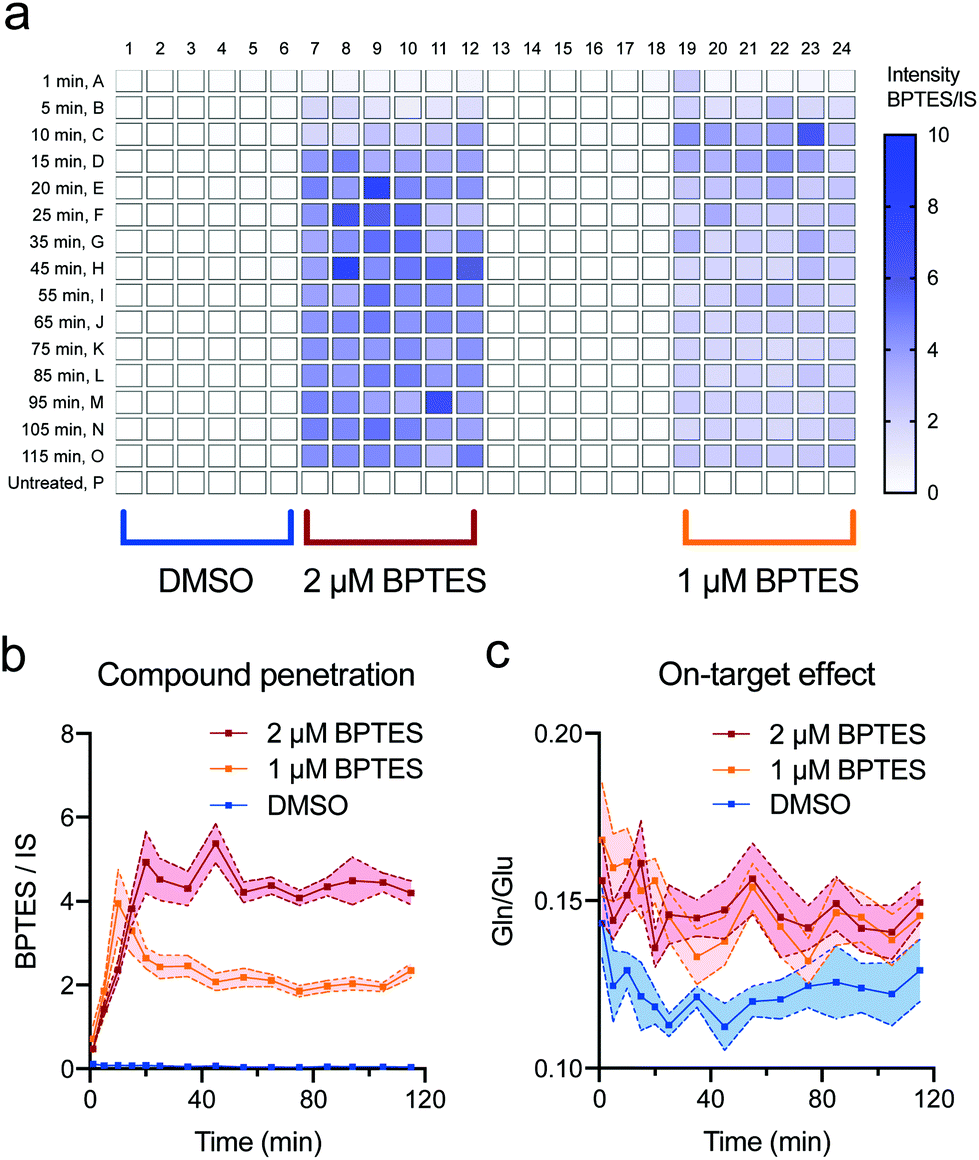 | ||
| Fig. 3 Simultaneous measurement of compound penetration and biological activity in cells using AMI-MS. (a) Assay plate layout and a heatmap of BPTES intensity normalised to 13C2,15N-glutathione internal standard (IS) across one dosed cell plate. (b) and (c) BPTES penetration and its inhibition of GLS1 as measured by glutamine/glutamate ratio. Shown are mean ± s.e.m. of 12 replicates for each condition and time point. | ||
Off-target effects of test compounds in cells often manifest by acute or long-term changes in intracellular metabolite or membrane phospholipid composition. The analyte coverage of AMI-MS (Table S1†) should facilitate the discovery of common compound-induced effects such as oxidative stress, nutrient starvation, nucleotide imbalance, phospholipid degradation or mitochondrial toxicity.
We investigated whether AMI-MS can clearly highlight some of these effects in MCF7 cells treated with an in-house library of compounds known to cause oxidative stress. Fig. 4 shows an overlay of mass spectra of selected species from vehicle (DMSO) and compound-treated cells at a 3 h time point for a single compound at a single concentration, normalised to the intensity of 13C2,15N-glutathione internal standard spiked into the lysis solution. It clearly confirmed cells were undergoing oxidative stress (reduced glutathione (GSH) decreased, oxidised glutathione (GSSG) increased, Fig. 4a), but also revealed that they responded by activating glycolysis and pentose phosphate pathway (increase in citrate and sugar phosphates, Fig. 4b) to produce NADPH needed for restoring correct glutathione redox state. Consistent with the lack of free cellular NADPH, we found that the NADPH-dependent de novo lipid synthesis was impaired (decrease in monosubstituted glycerophospho-ethanolamines (PE) with a stronger effect in longer chain PE relative to the shorter chain, Fig. 4c). Furthermore, glutamine-glutamate ratio was increased (Fig. 4d), likely to support activated de novo synthesis of glutathione as also shown by the higher levels of γ-glutamyl-cysteine precursor (Fig. 4d). Finally, we observed an increased usage of adenosine triphosphate (ATP) (i.e., cell running out of energy, Fig. 4d), but at this time point we still found no signs of cell death as indicated by the unchanged levels in the mature membrane lipid PE (36:1) (Fig. 4c).
 | ||
| Fig. 4 High-throughput AMI-MS-based metabolite and phospholipid analysis enables data-rich cellular assays. (a–d) Overlay of mass spectra from MCF7 cells treated with an oxidative-stress inducer or a vehicle control at a 3 h time point. Spectra acquired with a dwell time of 8 s per well. (a) Glutathione redox state. IS = internal standard (13C2,15N-glutathione). (b) Intermediates of glycolysis and pentose phosphate pathways. (c) Mono- and di-substituted phospholipids. (d) Intermediates of glutathione de novo synthesis and ATP as a marker of overall cellular energy. γ-GC = γ-glutamyl-cysteine. | ||
Additional time points and replicates further revealed that oxidative stress was induced to a different extent in compounds 1–3 as GSSG levels increased more than 10-fold (Fig. 5). Cells treated with compounds 2 and 3 showed an immediate effect on glutathione oxidation (GSH depleted (red), GSSG accumulated (black) at t = 0). While cells could temporarily recover from treatment with compound 2, compound 3 caused severe cell death already after 1 h (most metabolites in red, Fig. 5).
 | ||
| Fig. 5 Heatmap of the changes in concentration of 45 selected analytes in MCF7 cells treated with compounds inducing oxidative stress (compounds 1–3) and an inactive (compound 4), acquired in the negative ion mode. All raw intensities are normalised to vehicle control (DMSO only), and two replicates per time point are shown side by side. Data was collected with a dwell time of 8 s per well. | ||
The multiplexed information obtained from this type of experiment would be difficult to obtain without using a mass spectrometer, while the high throughput of AMI-MS and simple sample preparation allows profiling large numbers of compounds at many concentration points, time points and replicates. The resulting datasets can be processed in a hypothesis-free fashion, revealing time-dependent differences between tested treatments. Given that a very low volume of sample is consumed in an AMI-MS experiment, any newly observed species at the accurate mass level can be investigated further and characterised using a combination of LC, tandem MS or ion mobility MS experiments directly from the same sample plate. Alternatively, data analysis can be targeted to quantify a specific set of analytes (e.g., GSH or ATP levels as a direct replacement of commercial kits based on secondary reactions), or to answer a set of biological questions. The latter approach can provide rapid, robust and clear answers that can immediately be used for triaging candidate compounds in drug discovery programmes.
Conclusions
We have introduced a simple and generic plate-based workflow for cellular assays that integrates MS-compatible washing and lysis steps with high-throughput and high-content data acquisition by AMI-MS. We show that AMI-MS platform can be used as a flexible ‘reader’ to carry out cellular metabolite and phospholipid fingerprinting, compound penetration or drug response studies without relying on secondary reactions or antibodies. Similar to direct infusion ESI-MS, the analyte coverage of crude cell lysates in AMI-MS is not as deep as under gold standard LC-MS/MS assay conditions, but it has sufficient coverage to reveal relative changes in a number of important cellular processes at scale. As a fully contactless MS method, it has additional advantages such as no signal carryover between consecutive wells and low sample consumption. The basic workflow is customisable and adaptable to small and large compound screens, dose–response experiments, detailed timecourse studies, or flux analyses using stable isotopes.15 It can be deployed widely to study on- and off-target effects of candidate compounds and any other perturbations such as nutrient starvation or gene silencing, significantly improving the depth and quality of current high-throughput cell-based assays in basic and applied research.Experimental
Cell culture
MCF7 cells were obtained from DSMZ (Braunschweig, Germany) and maintained in RPMI medium containing 2 mM L-glutamine and 10% fetal bovine serum. HepG2 (C3a subclone) cells were obtained from AZ Global Cell Bank and maintained in glucose-free DMEM medium supplemented with 4 mM L-glutamine, 10% fetal calf serum, 1 mM sodium pyruvate, 5 mM HEPES and 10 mM galactose. Caco-2 cells were obtained from ATCC and maintained in EMEM medium supplemented with 10% FBS. HuT 78 cells were obtained from ATCC and maintained in IMEM medium supplemented with 10% FBS. All media, sera and additives were obtained from Thermo Fisher and Sigma. All cell lines were authenticated by STR profiling and were mycoplasma tested.Cellular assay set up
Cells were maintained at 5% CO2 and 37 °C and seeded in fresh media 24 h before treatment using a MultiDrop Combi dispenser (Thermo) and a seeding density of 1000–10000 cells per well. Typical assay volume was 50 μL. Adherent cell assays were carried out in poly-D-lysine coated 384-well polystyrene plates (Corning). Suspension cell assays were carried out in 384-well V-bottomed polypropylene plates (Greiner). Compounds were dosed directly from stock solutions (10 mM in DMSO) using an Echo 550 liquid handler (Labcyte), the plate was sealed with a sterile gas-permeable AeraSeal film (Sigma) and incubated for the stated period of time. DMSO and BPTES were obtained from Sigma. Remaining compounds were taken from AZ proprietary collection. Timecourse studies were carried out by consecutive compound dosing into individual wells of a cell plate, followed by harvesting all wells on the entire plate together.
Sample preparation for adherent cells
Cell culture medium was removed either using a BluWasher centrifugal plate washer (BlueCatBio), EL-406 tip-based plate washer (BioTek) or, in a manual workflow, by gently tapping a plate upside down on an absorbent tissue, followed by centrifugation in a tabletop centrifuge for 10 s while inverted on a piece of absorbent tissue. A freshly made solution of ammonium formate (150 mM in water, pH 7.2 adjusted with ammonia, 37 °C, 80 μL per well) was dispensed using a MultiDrop Combi, and the washing solution removed using automation or manually as above. The wash step was repeated for a total of 3 washes. 50 μL of lysis solution (0.1% acetic acid in MS-grade ultrapure water and a mix of internal standards) were added to the washed cell monolayer using a MultiDrop Combi, and the cells were placed on dry ice. After freezing, the lysates were thawed on ice and transferred to a 384-well acoustic flat-bottomed polypropylene plate (Labcyte) using a CyBio Felix platform (Analytik Jena) or a Viaflo 384-channel pipette (Integra). Sample plates were centrifuged to remove air bubbles and brought to room temperature prior to MS analysis. Glutathione-(glycine-13C2,15N), adenosine-15N5-triphosphate and Splash Lipidomix internal standards were obtained from Sigma. (2,2,4,4-D4)-Citric acid and (2,2,3-D3)-aspartic acid internal standards were purchased from Cambridge Isotope Laboratories.Sample preparation for suspension cells
Cells were spun down at 1000g for 2 min using a tabletop centrifuge, and the medium was removed using a Viaflo 384-channel pipette (z height 31.9 mm, lowest aspirating speed). Cells were then washed 3 times using a solution of ammonium formate as described for adherent cells, repeating the above steps for careful removal of the solution without disturbing the cell pellet. Lysis of the washed pellets and lysate transfer were carried out as described for adherent cells.Acoustic-mist ionisation MS analysis
Crude cell lysates were ionised using an AMI source composed of an Echo550 (Labcyte), a high-voltage power supply (RIGOL), a moving XY-stage and a heated transfer interface (Waters) as described in Sinclair et al.,10 and introduced into a Xevo G2-XS qToF mass detector (Waters). Misting event repetition rate was set at 1400 Hz with a power of 11.5 dB, polarity switching every 10 nL (∼0.3 s), and charging cone voltage at ±3 kV. Transfer interface was heated at 260 °C and the droplet velocity within the interface was optimised by allowing cone gas flow at 30 L h−1. The detector was operated in negative ion MS sensitivity mode, with source temperature of 100 °C, 6 V collision energy, 80 V cone voltage and 40 V offset. Data was acquired over a mass range of 50–1200 Da and with scan rate of 0.1 s, with a total sample-to-sample time between 0.5–8 s.Flow injection ESI MS analysis
Crude cell lysates were injected into an isocratic flow of 60% MeOH, 0.1% formic acid at 150 μL min−1 using I-class UPLC system (Waters) fitted with a flow-through needle, and connected to a Xevo G2-XS qToF mass detector via a Unispray source (Waters). The mass spectrometer was operated in the negative ion ESI-MS sensitivity mode with −2 kV capillary voltage, 80 V cone voltage and 40 V offset, 50 L h−1 cone gas, 100 °C source temperature and 600 L h−1 desolvation gas at 450 °C. Collision energy was set at 6 V. Data was acquired over a mass range of 50–1200 Da and with a scan rate of 0.1 s. Typical injection volume was 2 μL and sample eluted between 6 and 18 s, with a total sample-to-sample time of 45 s.Data analysis
Raw data from AMI-MS and flow injection ESI-MS were processed in Expressionist software (Genedata). MS scans from AMI-MS data are annotated with information about plate barcode and well location in real time during data acquisition, and MS scans originating from the same well are automatically summed and displayed as an individual mass spectrum per sample. For ESI-MS data, individual mass spectra were generated by calculating a geometric mean of all MS scans between 0.1–0.3 s of the chromatogram. Further steps of the processing workflow are the same for both AMI-MS and ESI-MS data as detailed in Fig. S3.† MS peaks were annotated using LipidMAPS16 and HMDB12 databases. Processed data was exported as a .csv file and plotted in R or GraphPad Prism.Conflicts of interest
There are no conflicts to declare.Acknowledgements
We would like to acknowledge Kerry Hallbrook and Sonia Houghton for their support with cell culture. We would also like to thank Maria Luisa Guerriero and Natalie Kurbatova for their help and advice in data processing and analysis.References
- J. B. Fenn, M. Mann, C. K. Meng, S. F. Wong and C. M. Whitehouse, Science, 1989, 246, 64–71 CrossRef CAS.
- M. Karas, D. Bachmann and F. Hillenkamp, Anal. Chem., 1985, 57, 2935–2939 CrossRef CAS.
- Z. Takáts, J. M. Wiseman, B. Gologan and R. G. Cooks, Science, 2004, 306, 471–473 CrossRef.
- R. B. Cody, J. A. Laramée and H. D. Durst, Anal. Chem., 2005, 77, 2297–2302 CrossRef CAS.
- K. C. Schäfer, J. Dénes, K. Albrecht, T. Szaniszló, J. Balogh, R. Skoumal, M. Katona, M. Tóth, L. Balogh and Z. Takáts, Angew. Chem., Int. Ed, 2009, 48, 8240–8242 Search PubMed.
- V. Kertesz and G. J. Van Berkel, J. Mass Spectrom., 2010, 45, 252–260 CrossRef CAS.
- J. Wu, C. S. Hughes, P. Picard, S. Letarte, M. Gaudreault, J. F. Lévesque, D. A. Nicoll-Griffith and K. P. Bateman, Anal. Chem., 2007, 79, 4657–4665 CrossRef CAS.
- T. Fuhrer, D. Heer, B. Begemann and N. Zamboni, Anal. Chem., 2011, 83, 7074–7080 CrossRef CAS.
- I. Sinclair, R. Stearns, S. Pringle, J. Wingfield, S. Datwani, E. Hall, L. Ghislain, L. Majlof and M. Bachman, J. Lab. Autom., 2016, 21, 19–26 CrossRef.
- I. Sinclair, M. Bachman, D. Addison, M. Rohman, D. C. Murray, G. Davies, E. Mouchet, M. E. Tonge, R. G. Stearns, L. Ghislain, S. S. Datwani, L. Majlof, E. Hall, G. R. Jones, E. Hoyes, J. Olechno, R. N. Ellson, P. E. Barran, S. D. Pringle, M. R. Morris and J. Wingfield, Anal. Chem., 2019, 91, 3790–3794 CrossRef CAS.
- J. O. Park, S. A. Rubin, Y. F. Xu, D. Amador-Noguez, J. Fan, T. Shlomi and J. D. Rabinowitz, Nat. Chem. Biol., 2016, 12, 482–489 CrossRef CAS.
- D. S. Wishart, Y. D. Feunang, A. Marcu, A. C. Guo, K. Liang, R. Vázquez-Fresno, T. Sajed, D. Johnson, C. Li, N. Karu, Z. Sayeeda, E. Lo, N. Assempour, M. Berjanskii, S. Singhal, D. Arndt, Y. Liang, H. Badran, J. Grant, A. Serra-Cayuela, Y. Liu, R. Mandal, V. Neveu, A. Pon, C. Knox, M. Wilson, C. Manach and A. Scalbert, Nucleic Acids Res., 2018, 46, D608–D617 CrossRef CAS.
- V. Matyash, G. Liebisch, T. V. Kurzchalia, A. Shevchenko and D. Schwudke, J. Lipid Res., 2008, 49, 1137–1146 CrossRef CAS.
- M. M. Robinson, S. J. McBryant, T. Tsukamoto, C. Rojas, D. V. Ferraris, S. K. Hamilton, J. C. Hansen and N. P. Curthoys, Biochem. J., 2007, 406, 407–414 CrossRef CAS.
- J. M. Buescher, M. R. Antoniewicz, L. G. Boros, S. C. Burgess, H. Brunengraber, C. B. Clish, R. J. DeBerardinis, O. Feron, C. Frezza, B. Ghesquiere, E. Gottlieb, K. Hiller, R. G. Jones, J. J. Kamphorst, R. G. Kibbey, A. C. Kimmelman, J. W. Locasale, S. Y. Lunt, O. D. K. Maddocks, C. Malloy, C. M. Metallo, E. J. Meuillet, J. Munger, K. Nöh, J. D. Rabinowitz, M. Ralser, U. Sauer, G. Stephanopoulos, J. St-Pierre, D. A. Tennant, C. Wittmann, M. G. Vander Heiden, A. Vazquez, K. Vousden, J. D. Young, N. Zamboni and S. M. Fendt, Curr. Opin. Biotechnol., 2015, 34, 189–201 CrossRef CAS.
- E. Fahy, S. Subramaniam, R. C. Murphy, M. Nishijima, C. R. H. Raetz, T. Shimizu, F. Spener, G. Van Meer, M. J. O. Wakelam and E. A. Dennis, J. Lipid Res., 2009, 50, S9–S14 CrossRef.
Footnote |
| † Electronic supplementary information (ESI) available: Fig. S1–7, Table S1, Data S1 and 2. See DOI: 10.1039/d0an01519a |
| This journal is © The Royal Society of Chemistry 2021 |