Raman spectroscopy as a potential diagnostic tool to analyse biochemical alterations in lung cancer†
Qingfeng
Zheng‡
 a,
Junyi
Li‡
b,
Lin
Yang
c,
Bo
Zheng
c,
Jiangcai
Wang
b,
Ning
Lv
c,
Jianbin
Luo
b,
Francis L.
Martin
 d,
Dameng
Liu
 *b and
Jie
He
*a
aDepartment of Thoracic Surgery, National Cancer Center/National Clinical Research Center for Cancer/Cancer Hospital, Chinese Academy of Medical Sciences and Peking Union Medical College, Beijing, 100021, China. E-mail: prof.jiehe@gmail.com
bState Key Laboratory of Tribology, Tsinghua University, Beijing 100084, China. E-mail: ldm@tsinghua.edu.cn
cDepartment of Pathology, National Cancer Center/National Clinical Research Center for Cancer/Cancer Hospital, Chinese Academy of Medical Sciences and Peking Union Medical College, Beijing, 100021, China
dSchool of Pharmacy and Biomedical Sciences, University of Central Lancashire, Preston PR1 2HE, UK
First published on 28th November 2019
Abstract
Patient survival remains poor even after diagnosis in lung cancer cases, and the molecular events resulting from lung cancer progression remain unclear. Raman spectroscopy could be used to noninvasively and accurately reveal the biochemical properties of biological tissues on the basis of their pathological status. This study aimed at probing biomolecular changes in lung cancer, using Raman spectroscopy as a potential diagnostic tool. Herein, biochemical alterations were evident in the Raman spectra (region of 600–1800 cm−1) in normal and cancerous lung tissues. The levels of saturated and unsaturated lipids and the protein-to-lipid, nucleic acid-to-lipid, and protein-to-nucleic acid ratios were significantly altered among malignant tissues compared to normal lung tissues. These biochemical alterations in tissues during neoplastic transformation have profound implications in not only the biochemical landscape of lung cancer progression but also cytopathological classification. Based on this spectroscopic approach, classification methods including k-nearest neighbour (kNN) and support vector machine (SVM) were successfully applied to cytopathologically diagnose lung cancer with an accuracy approaching 99%. The present results indicate that Raman spectroscopy is an excellent tool to biochemically interrogate and diagnose lung cancer.
1. Introduction
Lung cancer is the most common cancer in terms of incidence and mortality. Patient survival remains poor, since >90% of patients die within 5 years of diagnosis. Notwithstanding the co-morbid conditions, poor survival rates primarily reflect the fact that over two-thirds of patients are diagnosed at an incurable stage that is currently not amenable for potentially curative treatment.1 Routine diagnosis includes a series of assessments including physical examination, imaging analysis, and biopsies, which are time-consuming and invasive.2Raman spectroscopy is an inelastic light scattering method that helps detect molecule-specific vibrations in a sample.3 Each molecular species has its own unique set of molecular vibrations derived from a Raman spectrum, which is applicable as an unlabelled biomolecular fingerprint.4 Water does not interfere with Raman spectroscopy, which is especially advantageous for in vivo measurements. Thus, Raman spectroscopy has already been used for biological characterisation owing to its quantitative and semi-quantitative potential. Furthermore, Raman spectroscopy considerably benefits biomedical diagnoses owing to its non-invasiveness, relatively short acquisition time, and the ability to provide biochemical molecular information.5,6 Although Raman spectroscopy has high chemical specificity, the spectral differences among classes are difficult to visually observe. Multivariate analysis has been used to understand the spectral data.7 Cluster methods including principal component analysis (PCA) and linear discriminant analysis (LDA) can be used to extract biological information derived from Raman spectroscopy. Furthermore, Raman spectroscopy along with classification methods including support vector machine (SVM) and k-nearest neighbour (kNN) methods help classify tissue carcinogenesis.8,9
This study aimed at assessing the efficacy of Raman spectroscopy to analyze lung tissues with or without cancer as a non-invasive diagnostic tool for clinicopathological classification. This approach is expected to elucidate biochemical changes arising from lung tissue carcinogenesis.
2. Materials and methods
2.1 Patients and tissue section preparation
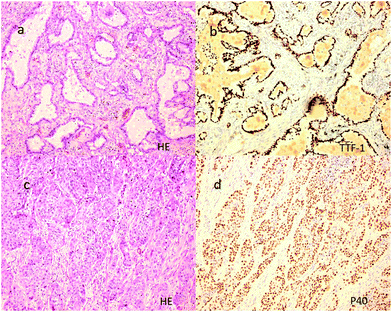
Fifty cancer tissues and 16 normal tissues were harvested from the pathology archive and sample library. The sex ratio of patients from whom the 50 tumour samples were obtained was 29/21 (M/F), with an average age of 60 years. According to the 8th edition of UICC lung cancer staging, the included 50 lung cancer samples were classified as T1a (n = 11), T1b (n = 14), T1c (n = 9); T2a (n = 10), T2b (n = 1), T3 (n = 5); N0 (n = 39), N1 (n = 4), and N2 (n = 7), and none of them presented distant metastasis (M0). All 50 included cancer tissues were histologically and immunohistochemically confirmed as 40 adenocarcinomas and 10 squamous carcinomas in accordance with the 2015 World Health Organization lung cancer classification by two senior pathologists. Anti-thyroid transcription factor-1 (TTF-1) (clone SP141) and anti-P63 (clone 4A4) antibodies were purchased from Roche (USA) for immunohistochemical analysis. NapsinA (clone no. MX015), CK5/6 (clone no. MX040), and P40 (clone no. ZR8) were purchased from Fuzhou Maixin Biotechnology Co., Ltd (China). The DAKO EnVision FLEX staining kit (batch number 20065946) was used for probing with the secondary antibody. Immunohistochemical staining was performed using the standard two-step method. The representative staining images are shown in Fig. 1.Sections for Raman spectroscopy were prepared from the corresponding frozen samples of patients from the biological sample library. Four-micrometre-thick sections were cut and fixed in 95% alcohol at room temperature (18–24 °C) away from light prior to Raman testing. The tissue sections were laid on aluminium foil substrates, and the size of each dissected sample was approximately 0.5 × 0.5 cm2.
All experiments were performed in accordance with the Guidelines about Research Involving Human Subjects, and approved by the ethics committee at Tsinghua University (No. 20190036). Informed consents were obtained from the human participants of this study.
2.2 Spectral acquisition
The Raman spectra were recorded using a Horiba HR evolution Raman spectrometer equipped with a 532 nm laser (<10 mw at samples) and a 600 l mm−1 grating. All Raman spectra were obtained using a 50× objective lens (NA = 0.8) for 10 s of exposure with three accumulations. The Raman system was calibrated with a silicon wafer using the Raman peak shift at 520 cm−1. After calibrating the system, the Raman spectra (see ESI Fig. S1†) were recorded in the range of 300–3500 cm−1. At least five random regions were selected in each tissue section. A minimum of five Raman spectra were acquired per region of tissue analysed. In total, 1876 Raman spectra were obtained from samples. As tissues are inherently heterogeneous, we used the DuoScan mode for laser scanning of an area of 5 × 5 μm2 and then obtained the average spectra, which reduced the spectral variance during Raman spectral acquisition.2.3 Spectral pre-processing
Raw spectral data were pre-processed using the open source IRootLab toolbox and performed with Matlab r2016.10 Each spectrum was cut into the biochemical fingerprint region (600–1800 cm−1) for further processing. Thereafter, these spectra were pre-processed via wavelet de-noising, Savitzky–Golay second-order differentiation, and vector normalisation, in a stepwise manner.2.4 Spectral data analysis
The pre-processed spectral data were then used for multivariate analysis and classification, and all pre-processed spectral datasets were further analysed using the IRootLab toolbox. Multivariate analysis (i.e. PCA and LDA) was performed for the pre-processed spectral data, using the IRootLab toolbox as well.The dataset was first input into PCA, an unsupervised data analysis method to reduce data dimensionality, to determine principal components (PCs), extract key features, and facilitate data visualisation.11–13 Furthermore, the loading vectors (commonly called principal components [PCs]) within this matrix are eigenvectors of the covariance matrix of the data. These PCs were obtained by determining the eigenvectors and eigenvalues of the covariance matrix obtained from the data matrix. The eigenvector with the highest eigenvalue yielded the first PC (PC1), based on the greatest variance in the data. To understand the importance of the order of the PCs, ‘percentage of variance explained’ was calculated. To account for most of the variance in the dataset, the first 10 PCs were selected. However, PCA is an unsupervised method, treating all classes as one without considering class labels, and can only recognise the total variance in a whole dataset.
PCA has a low discrimination power for data categorisation. Therefore, to maximise the spectral differences between classes and efficiently extract class-specific biomarkers associated with biochemical changes, a supervised approach, LDA, was applied for the dataset after PCA with the selected PCs. The first 10 PCs, accounting for >90% of the variance of the selected spectral regions, were selected for the subsequent LDA.14 Herein, a combinatorial PCA–LDA method was used for the multivariate analysis. LDA determines the discriminant function line that maximises the inter-class distance and minimises the intra-class distance, thus yielding an optimal linear boundary separating the different classes.
Cluster plots derived from the first two LD spaces were used to distinguish alterations among the three tissue types from different developmental stages, where each spectrum was defined as a point while point overlap and separation indicate similar or dissimilar features. Furthermore, PCA–LDA cluster vector plots were used to plot a ‘spectrum-like’ graph indicating the wavenumbers at which inter-class alterations occurred, as the peak magnitude (variance) indicated the extent of alteration.8,15,16 Thus, the peak positions have been considered as spectral biomarkers for tissues among different disease stages.
2.5 Spectral classification
kNN is a simple classification method, depending on the geometrical distance between the two samples. Here k indicates the number of neighbours considered to determine the distance and classify the samples.17 Band intensities as each wavenumber derived from the pre-processed Raman spectra were used as inputs for the kNN model. A suitable k value was determined by grid search to fit the classification prior to the model establishment.Furthermore, an SVM is a robust classifier, easy to implement, and performs well when applied to the unseen dataset, simultaneously optimising the decision boundary.18–21 Band intensities as each wavenumber derived from the pre-processed Raman spectra were considered as inputs for the SVM model. In the proposed automated system for screening, a linear kernel is utilised. This kernel assists in deriving complex associations between the possible output classes and the Raman spectra. Furthermore, a radial basis function (RBF) kernel was investigated, although its results were not substantially better than those obtained with a linear kernel. Both the factor for the soft-margin function and the RBF kernel sigma were fine-tuned following a grid search method for the validation subset.
2.6 Ratio measurements
Intensity ratios of Raman peaks 1303 cm−1/1267 cm−1 and 1654 cm−1/1445 cm−1 were used to evaluate the levels of saturated and unsaturated lipids. Furthermore, nucleic acid, protein, and lipid contents were analysed at a relative intensity of 720–800 cm−1, 1600–1690 cm−1, and 1750–3040 cm−1, respectively. Thereafter, the protein-to-lipid, nucleic acid-to-lipid, and protein-to-nucleic acid ratios were determined.2.7 Statistical analysis
All statistical analyses were performed using Graph Pad Software Prism 6 (GraphPad Software, USA). The processed spectral dataset was presented with mean ± standard deviation values. All results were statistically analysed using a t-test or one-way analysis of variance (ANOVA) with Dunnett's T3 post hoc test. A probability (p) value of <0.05 was considered to indicate the statistical significance for all tests.3. Results
3.1 Raman spectral analysis
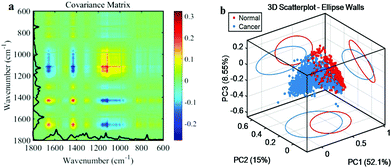
The pre-processed spectral dataset was analysed using the covariance matrix maps to indicate the spectral discrimination between the control and cancer groups (Fig. 2a). The prominent red and blue spots represent the spectral region responsible for major discrimination between these two groups, which were also observed in the loading plots derived through PCA (Fig. 2b). In these spectral regions, Raman shift peaks included 1114 cm−1, 1152 cm−1, 1429 cm−1, and 1655 cm−1, suggesting that lung tumorigenesis potentially induces significant biochemical alterations in lipid and protein levels.The fingerprint region (600–1800 cm−1) of the Raman spectra obtained from the lung tissue dissections is shown in ESI Fig. S2.† As shown in Fig. 2, distinct (despite some overlap) segregations among normal and cancer subtypes were observed in the PCA score plot of the first three PCs. Significant differences in these three spaces were observed between normal and cancer groups (p < 0.001).
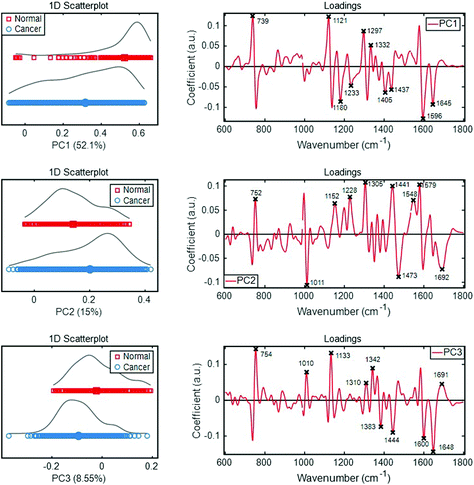
As shown in Fig. 3, the loading plot denotes the most pronounced 10 discriminating wavenumbers responsible for score plot segregations in each PC space. In PC1, band intensities corresponding to the biochemical segregations were observed at 1595 cm−1, 738 cm−1, 1121 cm−1, 1644 cm−1, 1297 cm−1, 1179 cm−1, 1405 cm−1, 1436 cm−1, 1332 cm−1, and 1233 cm−1; and in PC2 space, 1305 cm−1, 1011 cm−1, 1578 cm−1, 1441 cm−1, 1472 cm−1, 1228 cm−1, 752 cm−1, 1692 cm−1, 1547 cm−1, and 1152 cm−1. Similarly, the significant band intensities were 1648 cm−1, 754 cm−1, 1132 cm−1, 1600 cm−1, 1341 cm−1, 1444 cm−1, 10![[thin space (1/6-em)]](https://www.rsc.org/images/entities/char_2009.gif) 009 cm−1, 1383 cm−1, 1309 cm−1, and 1690 cm−1.
009 cm−1, 1383 cm−1, 1309 cm−1, and 1690 cm−1.
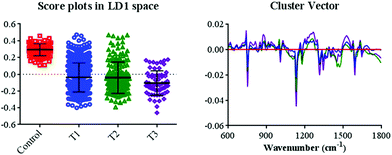
Data from the cancer groups were divided into three groups in accordance with the lung cancer stage. Thereafter, the pre-processed spectral dataset was analysed using the PCA–LDA method. In the LD1 space, score plots (Fig. 5) derived from the Raman spectral dataset revealed significant segregations among groups (ESI Table S2†). Moreover, a linear variation corresponding to the cancer stage was observed in accordance with the LD1 score plots. To elucidate the mechanism underlying the inter-group alterations at different stages, cluster vector plots were used to assess the biochemical changes (Fig. 5). In the cluster vector plots, biochemical alterations were observed by comparing the other groups with the control group. Distinct wavenumbers corresponding to the segregation at T1, T2, and T3 in comparison with the control group were recorded (ESI Table S3†). By comparing T1 with the control group, the band intensities corresponding to the biochemical segregations were observed at 1132 cm−1, 1591 cm−1, 750 cm−1, 1314 cm−1, 1343 cm−1, 1266 cm−1, 1199 cm−1, 1007 cm−1, 1373 cm−1, and 1527 cm−1. In comparison of T2 with the control group, the band intensities corresponding to the biochemical segregations were observed at 1132 cm−1, 750 cm−1, 1471 cm−1, 1314 cm−1, 1176 cm−1, 1591 cm−1, 1799 cm−1, 1343 cm−1, 1258 cm−1, and 1000 cm−1. By comparing T3 with the control group, the band intensities corresponding to the biochemical segregations were observed at 1132 cm−1, 750 cm−1, 1591 cm−1, 1314 cm−1, 1343 cm−1, 1265 cm−1, 875 cm−1, 1527 cm−1, 1176 cm−1, and 1007 cm−1. Upon tentative assignments of wavenumbers, the most prominent biochemical alterations during the tumorigenesis were mostly observed in DNA/RNA and protein regions.
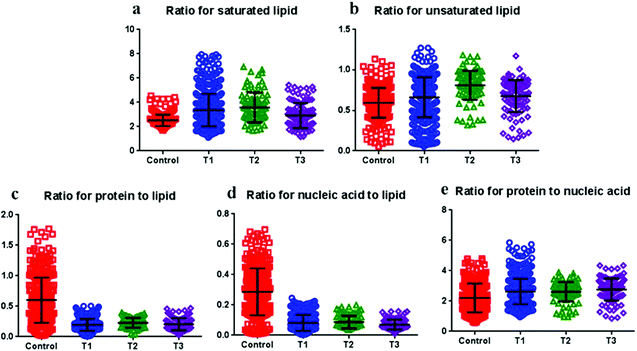 | ||
| Fig. 6 Comparisons of the relative intensity ratios of the selected Raman bands with the corresponding tentative biochemical assignments of the tissue samples. All data are represented as mean ± standard deviation values (statistical analyses are shown in ESI Table S4†). | ||
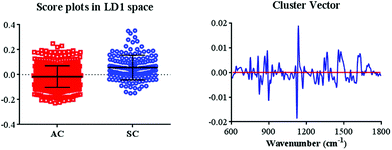
Data from the different cancer types were divided into two groups: adenocarcinomas and squamous carcinomas. This pre-processed spectral dataset was then analysed using the PCA–LDA method. In the LD1 space, score plots (Fig. 7) derived from the Raman spectral dataset displayed significant segregations between these two groups (P < 0.001). In addition, cluster vector plots were generated to assess the biochemical alterations between adenocarcinomas and squamous carcinomas (Fig. 7). The band intensities corresponding to the biochemical segregations were observed at 1134 cm−1, 896 cm−1, 1455 cm−1, 822 cm−1, 1363 cm−1, 1627 cm−1, 866 cm−1, 1170 cm−1, 751 cm−1, and 1331 cm−1. Based on the tentative assignments of wavenumbers, the most prominent biochemical difference between adenocarcinomas and squamous carcinomas mostly appeared in the protein regions.
3.2 Ratio measurements
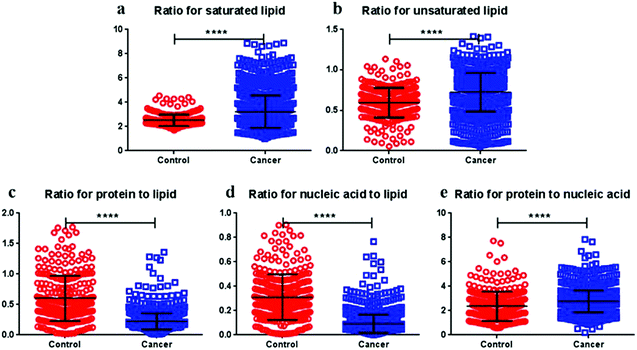
The ratio plot was formed on the basis of the Raman intensity at a specific wavenumber corresponding to the molecules concerned. The levels of saturated and unsaturated lipids displayed an increasing tendency in cancer tissues rather than in normal tissues, and significant differences were observed (Fig. 4). Moreover, both protein-to-lipid and nucleic acid-to-lipid ratios significantly decreased in cancer tissues in comparison with the normal tissues (p < 0.0001); however, the protein-to-nucleic acid ratio was significantly greater in cancer tissues than in normal tissues (p < 0.0001).The ratio plots constructed during tumorigenesis revealed that the ratio of both saturated and unsaturated lipids in tissues displayed an increasing tendency during tumorigenesis, indicating that protein-to-lipid and nucleic acid-to-lipid ratios seemed to decrease, while the protein-to-nucleic acid ratio tended to increase (Fig. 6).
3.3 Classification results
When kNN and SVM classification methods were used for separate spectral datasets, the fitting k value and kernel gamma value were determined for the two models. For the kNN model, the sensitivity and specificity approached 97.34% and 97.22%, while those for the SVM model were 98.06% and 99.84%, respectively.| Method | |||
|---|---|---|---|
| kNN | SVM | ||
| Control vs. cancer | Sensitivity | 97.34% | 98.06% |
| Specification | 97.22% | 99.84% | |
| Accuracy | 97.24% | 99.31% | |
| Adenocarcinoma vs. squamous carcinoma | Sensitivity | 92.17% | 95.55% |
| Specification | 81.38% | 75.86% | |
| Accuracy | 90.17% | 92.20% | |
When same methods were used to classify cancer stages, adequate data were obtained, which yielded a more accurate classification. Among the three groups (T1, T2, and T3), the classification accuracy of T1 approached 88.53% via the SVM method and 87.69%, while the accuracy of the other groups was markedly low potentially because of the limited data obtained herein.
Furthermore, the classification methods were used to classify adenocarcinoma and squamous carcinoma. The sensitivity and specification approached 92.17% and 81.38%, while those of the SVM model were 95.55% and 75.86%, respectively (Table 1).
4. Discussion
In recent decades, spectroscopy-based tissue analyses have successfully revealed subtle changes in the pathogenesis of various diseases including cancer and differences among different cancer states. Raman peaks of interest are located in the region from 600 cm−1 to 1800 cm−1 (biochemical fingerprint region). In this study, marked differences between normal and cancer tissues were observed through Raman spectroscopy, implying distinct molecular and cellular changes associated with lung cancer pathogenesis. These biochemical alterations could be characterised through their spectra derived from the tissues, corresponding to the biochemical and bimolecular signals.The detailed Raman band assignment presented in the loadings of the first 3 PCs indicated biochemical alterations resulting from various bimolecular structures including DNA/RNA, amide II, amide III (random coil, β sheet, and α helix), overlapping carbon–hydrogen (CH and CH2) vibrations in protein and lipids, and carbon–carbon (C![[double bond, length as m-dash]](https://www.rsc.org/images/entities/char_e001.gif) C) vibrational modes in lipids.22 The ratio plots indicated that lipid metabolism significantly contributes to tumorigenesis.23,24 Saturated lipid levels in cancer tissues appeared markedly increased, while unsaturated lipid levels displayed a marked tendency to decrease, probably owing to lipid peroxidation during tumorigenesis.25–27 Furthermore, protein ratios suggest disordered protein metabolism during tumorigenesis, potentially leading to pulmonary fibrosis.28–30
C) vibrational modes in lipids.22 The ratio plots indicated that lipid metabolism significantly contributes to tumorigenesis.23,24 Saturated lipid levels in cancer tissues appeared markedly increased, while unsaturated lipid levels displayed a marked tendency to decrease, probably owing to lipid peroxidation during tumorigenesis.25–27 Furthermore, protein ratios suggest disordered protein metabolism during tumorigenesis, potentially leading to pulmonary fibrosis.28–30
The molecular pathogenesis of lung cancer is complex owing to diverse biological phenomena, from cell metabolism to signalling, where a knowledge gap persists. Along with the evidence of tumorigenesis from histopathological and immunohistochemical analyses of lung sections, Raman spectroscopy combined with PCA highlighted remarkable biochemical alterations in cancer tissues in comparison with normal tissues. Furthermore, based on the Raman spectra, distinctive changes in the levels of amide proteins, lipids, nucleic acids, carbohydrates, and glycogen were observed. Raman spectroscopy thus presents great potential for detecting cancerous changes and identifying the biochemical biomarkers of lung cancer, concurrent with the previous reports.5,31–34
The spectral data presented herein constitute a multi-dimensional dataset including abundant information regarding the biochemical characteristics of tissue samples, potentially providing a detailed description of the sample and being applicable for diagnosing lung cancer. Along with multivariate analysis and machine learning methods, patterns of pathological alterations within tissues can be easily detected.35,36
5. Conclusion
In this study, Raman spectroscopy facilitated the clinical diagnosis of lung cancer, distinguishing not only cancer tissues from normal tissues, but also tissues among various cancer types and stages. Variations in the levels of amide proteins, lipids, collagen, and glycogen concomitant with carcinogenesis were non-invasively observed. To a certain extent, biochemical alterations, observed through Raman spectroscopy, suggest alterations in cellular metabolism. This study shows that Raman spectroscopy is potentially applicable for detecting cancerous alterations and helps to understand cancer progression, thus providing novel insights into a non-invasive and objective clinical diagnostic method for lung cancer.Conflicts of interest
There are no conflicts of interest to declare.Acknowledgements
This study was supported by The Tribology Science Fund of State Key Laboratory of Tribology (SKLTKF15A03), the National Key R&D Program of China (2018YFC1312100), the National Natural Science Foundation of China (51527901 and 51575298), the Beijing Municipal Science & Technology Commission (Z181100001918002), and the CAMS Initiative for Innovative Medicine (2017-I2M-1-005).References
- R. A. Smith, K. S. Andrews, D. Brooks, S. A. Fedewa, D. Manassaram-Baptiste, D. Saslow, O. W. Brawley and R. C. Wender, CA Cancer J. Clin., 2018, 68, 297–316 CrossRef.
- A. G. Sauer, R. L. Siegel, A. Jemal and S. A. Fedewa, Cancer Epidemiol. Biomarkers Prev., 2017, 26, 1192–1208 CrossRef PubMed.
- G. W. Auner, S. K. Koya, C. Huang, B. Broadbent, M. Trexler, Z. Auner, A. Elias, K. C. Mehne and M. A. Brusatori, Cancer Metastasis Rev., 2018, 37, 691–717 CrossRef CAS.
- L. A. Austin, S. Osseiran and C. L. Evans, Analyst, 2016, 141, 476–503 RSC.
- K. Kong, C. Kendall, N. Stone and I. Notingher, Adv. Drug Delivery Rev., 2015, 89, 121–134 CrossRef CAS PubMed.
- M. V. P. Chowdary, K. K. Kumar, J. Kurien, S. Mathew and C. M. Krishna, Biopolymers, 2006, 83, 556–569 CrossRef CAS PubMed.
- J. Trevisan, P. P. Angelov, P. L. Carmichael, A. D. Scott and F. L. Martin, Analyst, 2012, 137, 3202–3215 RSC.
- J. G. Kelly, J. Trevisan, A. D. Scott, P. L. Carmichael, H. M. Pollock, P. L. Martin-Hirsch and F. L. Martin, J. Proteome Res., 2011, 10, 1437–1448 CrossRef CAS PubMed.
- N. M. Ralbovsky and I. K. Lednev, Spectrochim. Acta, Part A, 2019, 219, 463–487 CrossRef CAS PubMed.
- J. Trevisan, P. P. Angelov, A. D. Scott, P. L. Carmichael and F. L. Martin, Bioinformatics, 2013, 29, 1095–1097 CrossRef CAS PubMed.
- G. Theophilou, K. M. Lima, P. L. Martin-Hirsch, H. F. Stringfellow and F. L. Martin, Analyst, 2016, 141, 585–594 RSC.
- E. Kaznowska, J. Depciuch, K. Łach, M. Kołodziej, A. Koziorowska, J. Vongsvivut, I. Zawlik, M. Cholewa and J. Cebulski, Talanta, 2018, 186, 337–345 CrossRef CAS PubMed.
- K. Gajjar, L. D. Heppenstall, W. Pang, K. M. Ashton, J. Trevisan, I. I. Patel, V. Llabjani, H. F. Stringfellow, P. L. Martin-Hirsch, T. Dawson and F. L. Martin, Anal. Methods, 2012, 5, 89–102 RSC.
- R. Gautam, S. Vanga, F. Ariese and S. Umapathy, EPJ Tech. Instrum., 2015, 2, 8 CrossRef.
- V. Llabjani, J. Trevisan, K. C. Jones, R. F. Shore and F. L. Martin, Environ. Sci. Technol., 2011, 45, 6129–6135 CrossRef CAS PubMed.
- V. Llabjani, J. D. Crosse, A. A. Ahmadzai, I. I. Patel, W. Pang, J. Trevisan, K. C. Jones, R. F. Shore and F. L. Martin, Environ. Sci. Technol., 2011, 45, 10706–10712 CrossRef CAS.
- Q. Li, Q. Gao and G. Zhang, Biomed. Opt. Express, 2014, 5, 2435–2445 CrossRef.
- Y. Yu, Y. Lin, C. Xu, K. Lin, Q. Ye, X. Wang, S. Xie, R. Chen and J. Lin, Biomed. Opt. Express, 2018, 9, 6053–6066 CrossRef CAS PubMed.
- S. Li, G. Chen, Y. Zhang, Z. Guo, Z. Liu, J. Xu, X. Li and L. Lin, Opt. Express, 2014, 22, 25895–25908 CrossRef CAS PubMed.
- E. Guevara, J. C. Torres-Galván, M. G. Ramírez-Elías, C. Luevano-Contreras and F. J. González, Biomed. Opt. Express, 2018, 9, 4998–5010 CrossRef CAS PubMed.
- J. Desroches, M. Jermyn, M. Pinto, F. Picot, M. A. Tremblay, S. Obaid, E. Marple, K. Urmey, D. Trudel, G. Soulez and M. C. Guiot, Sci. Rep., 2018, 8, 1792 CrossRef PubMed.
- I. Notingher, S. Verrier, S. Haque, J. M. Polak and L. L. Hench, Biopolymers, 2003, 72, 230–240 CrossRef CAS PubMed.
- O. F. Kuzu, M. A. Noory and G. P. Robertson, Cancer Res., 2016, 76, 2063–2070 CrossRef CAS.
- A. Gegotek, J. Niklinski, R. Charkiewicz, K. Bielawska, M. Kozlowski and E. Skrzydlewska, Free Radicals Biol. Med., 2014, 75, S31 CrossRef.
- G. Deep and I. R. Schlaepfer, Int. J. Mol. Sci., 2016, 17, 1061 CrossRef.
- G. Barrera, Int. Scholarly Res. Not., 2012, 137289–137289 Search PubMed.
- E. Skrzydlewska, S. Sulkowski, M. Koda, B. Zalewski, L. Kanczuga-Koda and M. Sulkowska, World J. Gastroenterol., 2005, 11, 403–406 CrossRef CAS PubMed.
- K. Kuwano, N. Hagimoto, M. Kawasaki, T. Yatomi, N. Nakamura, S. Nagata, T. Suda, R. Kunitake, T. Maeyama, H. Miyazaki and N. Hara, J. Clin. Invest., 1999, 104, 13–19 CrossRef CAS.
- H. Y. Kim, Y. M. Shim, K. S. Lee, J. Han, C. A. Yi and Y. K. Kim, Radiology, 2007, 245, 267–275 CrossRef PubMed.
- M. Ding, F. Chen, X. Shi, B. Yucesoy, B. Mossman and V. Vallyathan, Int. Immunopharmacol., 2002, 2, 173–182 CrossRef CAS.
- Z. Huang, A. McWilliams, H. Lui, D. I. McLean, S. Lam and H. Zeng, Int. J. Cancer, 2003, 107, 1047–1052 CrossRef CAS.
- W. Wang, J. Zhao, M. Short and H. Zeng, J. Biophotonics, 2015, 8, 527–545 CrossRef PubMed.
- P. T. Winnard Jr., C. Zhang, F. Vesuna, J. W. Kang, J. Garry, R. R. Dasari, I. Barman and V. Raman, Oncotarget, 2017, 8, 20266–20287 CrossRef PubMed.
- H. C. McGregor, M. A. Short, A. McWilliams, T. Shaipanich, D. N. Ionescu, J. Zhao, W. Wang, G. Chen, S. Lam and H. Zeng, J. Biophotonics, 2017, 10, 98–110 CrossRef CAS PubMed.
- H. J. Butler, L. Ashton, B. Bird, G. Cinque, K. Curtis, J. Dorney, K. Esmonde-White, N. J. Fullwood, B. Gardner, P. L. Martin-Hirsch and M. J. Walsh, Nat. Protoc., 2016, 11, 664 CrossRef CAS.
- C. L. Morais, M. Paraskevaidi, L. Cui, N. J. Fullwood, M. Isabelle, K. M. Lima, P. L. Martin-Hirsch, H. Sreedhar, J. Trevisan, M. J. Walsh and D. Zhang, Nat. Protoc., 2019, 14, 1546–1577 CrossRef CAS PubMed.
Footnotes |
| † Electronic supplementary information (ESI) available. See DOI: 10.1039/C9AN02175B |
| ‡ Joint first authors. |
| This journal is © The Royal Society of Chemistry 2020 |

