
Dehydropeptide-based plasmonic magnetogels: a supramolecular composite nanosystem for multimodal cancer therapy†
Sérgio R. S.
Veloso
 a,
J. A.
Martins
b,
Loic
Hilliou
c,
C.
O. Amorim
d,
V. S.
Amaral
d,
B. G.
Almeida
a,
Peter J.
Jervis
be,
Rute
Moreira
e,
David M.
Pereira
e,
Paulo J. G.
Coutinho
a,
Paula M. T.
Ferreira
b and
Elisabete M. S.
Castanheira
*a
a,
J. A.
Martins
b,
Loic
Hilliou
c,
C.
O. Amorim
d,
V. S.
Amaral
d,
B. G.
Almeida
a,
Peter J.
Jervis
be,
Rute
Moreira
e,
David M.
Pereira
e,
Paulo J. G.
Coutinho
a,
Paula M. T.
Ferreira
b and
Elisabete M. S.
Castanheira
*a
aCentro de Física (CFUM), University of Minho, Campus de Gualtar, 4710-057 Braga, Portugal. E-mail: ecoutinho@fisica.uminho.pt; Fax: +351 253604061; Tel: +351 253604321
bCentro de Química (CQUM), University of Minho, Campus de Gualtar, 4710-057 Braga, Portugal
cInstitute for Polymers and Composites/I3N, Department of Polymer Engineering, University of Minho, Campus de Azurém, 4800-058 Guimarães, Portugal
dPhysics Department and CICECO, University of Aveiro, Campus de Santiago, 3810-193 Aveiro, Portugal
eREQUIMTE/LAQV, Lab of Pharmacognosy, Department of Chemistry, Faculty of Pharmacy, University of Porto, R. Jorge Viterbo Ferreira, 228, 4050-313 Porto, Portugal
First published on 11th November 2019
Abstract
Supramolecular hydrogels are highly promising candidates as biomedical materials owing to their wide array of properties, which can be tailored and modulated. Additionally, their combination with plasmonic/magnetic nanoparticles to form plasmonic magnetogels further improves their potential in biomedical applications through the combination of complementary strategies, such as photothermia, magnetic hyperthermia, photodynamic therapy and magnetic-guided drug delivery. Here, a new dehydropeptide hydrogelator, Npx-L-Met-Z-ΔPhe-OH, was developed and combined with two different plasmonic/magnetic nanoparticle architectures, i.e., core/shell manganese ferrite/gold nanoparticles and gold-decorated manganese ferrite nanoparticles with ca. 55 nm and 45 nm sizes, respectively. The magnetogels were characterized via HR-TEM, FTIR spectroscopy, circular dichroism and rheological assays. The gels were tested as nanocarriers for a model antitumor drug, the natural compound curcumin. The incorporation of the drug in the magnetogel matrices was confirmed through fluorescence-based techniques (FRET, fluorescence anisotropy and quenching). The curcumin release profiles were studied with and without the excitation of the gold plasmon band. The transport of curcumin from the magnetogels towards biomembrane models (small unilamellar vesicles) was assessed via FRET between the fluorescent drug and the lipid probe Nile Red. The developed magnetogels showed promising results for photothermia and photo-triggered drug release. The magnetogels bearing gold-decorated nanoparticles showed the best photothermia properties, while the ones containing core/shell nanoparticles had the best photoinduced curcumin release.
Introduction
The ongoing social, economic and cultural relation changes induced by the economic transition in low-income countries and the adoption of unhealthy lifestyles in high-income countries have contributed to cancer remaining as the leading cause of death worldwide, with lung, colorectal, breast and prostate cancers exhibiting the highest incidence ratio.1–6 Conventional chemotherapy has only shown improved survival rates on early-stage disease in high-income countries, which can be attributed to the lack of specificity in diagnosis and therapeutic effectiveness and high cost, worsening the patient's quality of life.6,7Supramolecular hydrogels are stimulus-responsive self-assembled intertwined fibrillar structures achieved through the cooperative effect of different non-covalent intermolecular interactions: hydrogen bonding, van der Waals, electrostatic, hydrophobic and aromatic interactions.8–18 Their microdomains of solvent pockets afford physical–chemical similarity to the cell matrix and also allow the retention of nanoparticles, which tailor and modulate the hydrogel matrix structure and their mechanical, electrical, optical, and thermal properties.10–17,19 Their hydrophobic and hydrophilic microdomains allow the loading and efficient transport of a wide variety of drugs, reducing side effects and enabling higher doses in therapy.20
The combination of hydrogels with magnetic nanoparticles affords magnetogels, providing control and targeting of the nanosystem to a specific location through a magnetic field gradient and a higher therapeutic efficiency owing to the synergistic effect between magnetic hyperthermia and the enhanced drug release promoted by the application of an alternating magnetic field (AMF).21–25 The higher magnetic susceptibility of manganese ferrite when compared to that of other transition metal ferrites makes it an appealing material for theranostic applications.26,27 Moreover, coating with gold may afford higher biocompatibility and lower toxicity together with the surface plasmon resonance (SPR) phenomenon, which can allow the conversion of electromagnetic radiation into heat.28–32 Furthermore, core/shell nanoparticles afford high therapeutic potentiality owing to the combination of different strategies such as photothermia, photodynamic therapy, magnetic hyperthermia and magnetic-guided drug delivery.
In this work, gold-decorated manganese ferrite and core/shell manganese ferrite/gold nanoparticles were synthesized, characterized and incorporated into a new dehydrodipeptide hydrogel (Npx-L-Met-Z-ΔPhe-OH, compound 1) containing naproxen (Npx) and methionine (Met) to avert the leaching of the nanoparticles through the S–Au bond. The dehydroamino acid dehydrophenylalanine (ΔPhe) endows the peptide hydrogelator with proteolytic stability and adds conformational restraints to the peptide backbone, while the naproxen group affords selectivity towards cyclooxygenase.11,33,34 The mechanical properties of the magnetogels were assessed and the effect of the nanoparticles on the hydrogel fibrillar matrix was investigated. Moreover, the magnetogels were evaluated for the loading of a hydrophobic model drug (curcumin). Their interaction with biomembrane models was studied as well as the use of photothermia as a trigger to accelerate the release of curcumin.
The proposed multifunctional nanosystem is promising for cancer therapy owing to the potential tunability of its mechanical properties, controlled drug delivery to biomembrane models through photothermia, proteolytic stability, anti-inflammatory properties and magnetically-guided drug delivery.
Experimental
Synthesis of the hydrogelator
Synthesis of magnetic/plasmonic nanoparticles
Self-assembly of hydrogel
![[thin space (1/6-em)]](https://www.rsc.org/images/entities/char_2009.gif) :3 were prepared using the ethanolic injection technique. The lipid probe Nile Red41–43 was incorporated into the SUVs for a final concentration of 2 μM. All studies on drug incorporation and transport in SUVs were carried out via fluorescence-based techniques (fluorescence emission, FRET and fluorescence anisotropy).
:3 were prepared using the ethanolic injection technique. The lipid probe Nile Red41–43 was incorporated into the SUVs for a final concentration of 2 μM. All studies on drug incorporation and transport in SUVs were carried out via fluorescence-based techniques (fluorescence emission, FRET and fluorescence anisotropy).
Spectroscopic measurements
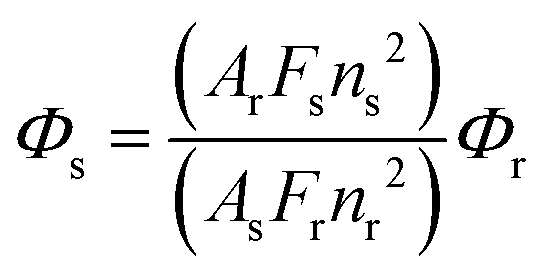
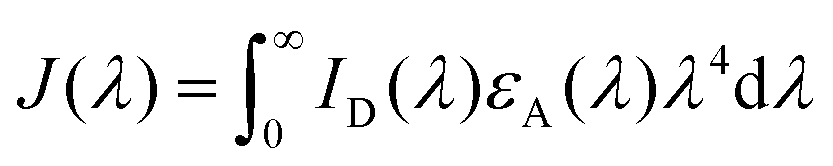
The fluorescence quantum yield, Φs, can be determined using eqn (1) (standard method),44,45
 | (1) |
 | (2) |
 | (3) |
 | (4) |
| R0 = 0.2108[κ2ΦDn−4J(λ)]1/6 | (5) |
 | (6) |
 , and εA(λ) is the molar absorption coefficient of the acceptor.
000 maximum number of generations, 2500000 maximum number of energy evaluations, and 60 × 60 × 60 grid points for 3NT1 and 3N8Z with a 0.375 Å spacing. The lowest docked energy conformation with the naproxen moiety in the active site was chosen as the best conformation. Visualization of the complex protein–ligand interactions was analysed with the PyMOL software.
, and εA(λ) is the molar absorption coefficient of the acceptor.
000 maximum number of generations, 2500000 maximum number of energy evaluations, and 60 × 60 × 60 grid points for 3NT1 and 3N8Z with a 0.375 Å spacing. The lowest docked energy conformation with the naproxen moiety in the active site was chosen as the best conformation. Visualization of the complex protein–ligand interactions was analysed with the PyMOL software.
The release of curcumin to pH = 7 buffer followed a similar procedure to that described for the biomembrane models (SUVs). Hydrogels/magnetogels loaded with 20 μM curcumin were prepared and left to stabilize overnight. The hydrogel/magnetogel was washed five times with 1 mL of pH = 7 buffer, and water (1.5 mL) was added to the drug-loaded hydrogel or magnetogel. Aliquots of 300 μL were taken, replaced with pH = 7 buffer and the curcumin fluorescence emission was measured to determine the concentration at each time point.
000 cells per well) and allowed to attach for 24 h. After incubation with Npx-L-Met-Z-ΔPhe-OH for 24 h, MTT (0.5 mg mL−1 final concentration) was added to each well and the plate was incubated for 75 min at 37 °C. Formazan crystals were dissolved by the addition of a DMSO:isopropanol mixture (3:1) and then quantified spectrophotometrically at 570 nm using a microplate reader (Multiskan Thermo Fisher Scientific).
Results and discussion
Synthesis of the hydrogelator compound 1
The hydrogelator methionyldehydrophenylalanine N-protected with 2-(6-methoxy-2-naphthyl)propionic acid (naproxen, Npx) was prepared using a conventional protocol in solution (Scheme 1).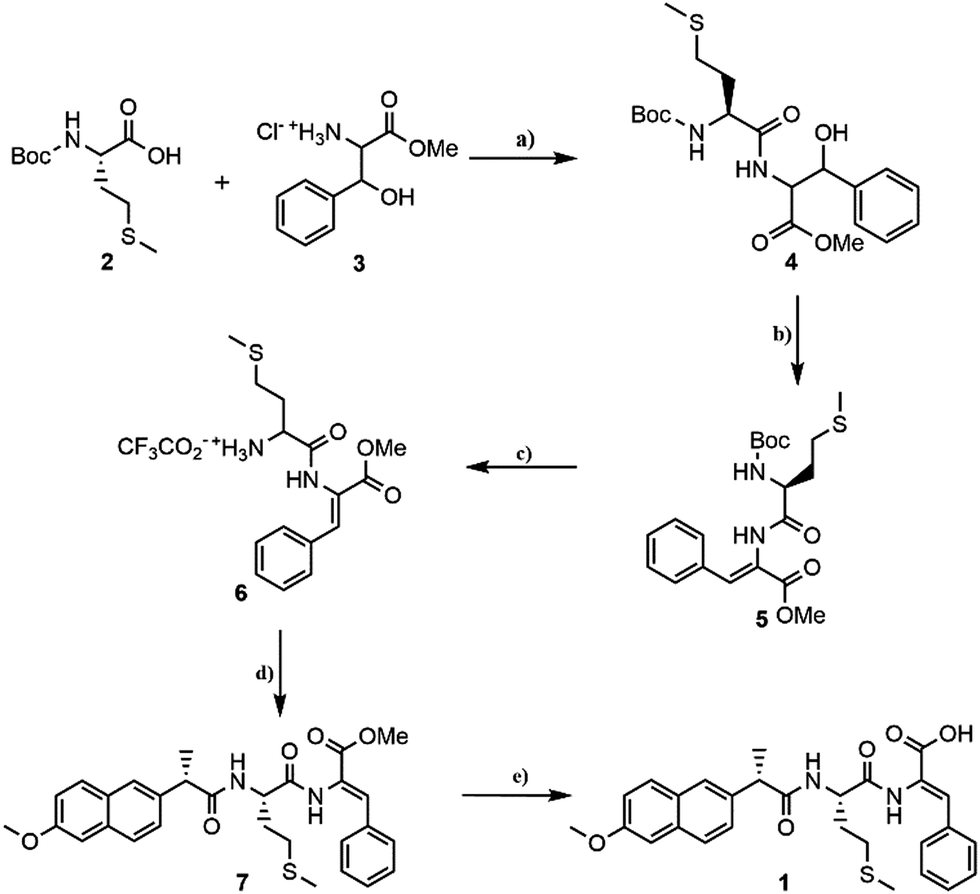 | ||
| Scheme 1 Synthesis of hydrogelator 1. (a) DCC, HOBt, Et3N, ACN, rt; (b) (1) Boc2O, DMAP, dry ACN, rt (2) TMG; (c) TFA; (d) (S)-(+)-naproxen chloride, Et3N, DCM, rt; and (e) (1) NaOH (1 M), 1,4-dioxane, rt, (2) KHSO4. | ||
The strategy for the synthesis of hydrogelator Npx-L-Met-Z-ΔPhe-OH 1 involved the coupling of N-tert-butyloxycarbonyl methionine (Boc-Met-OH, 2) with the methyl ester of β-hydroxyphenylalanine (H-D,L-Phe(β-OH)-OMe, 3), using the N,N′-dicyclohexylcarbodiimide (DCC)/1-hydroxybenzotriazole (HOBt) procedure. Compound 4 was obtained as a diastereomeric mixture in 84% yield. The reaction of the carboxylic acid of compound 3 gave an O-acylurea. The latter is very reactive and can lead to the formation of several by-products such as N-acylureas or oxazolones.55 Oxazolones are usually associated with epimerisation. The addition of 1-hydroxybenzo-triazole to the reaction mixture reduced epimerization through the formation of an active ester.55 Dehydration of β-hydroxydipeptide 4 was attained by reaction with di-tert-butyl dicarbonate (Boc2O) in the presence of 4-dimethylaminopyridine (DMAP), followed by treatment with N,N,N′,N′-tetramethylguadinine (TMG).56
Dehydrodipeptide 5 was isolated in 60% yield. The N-tert-butoxycarbonyl group of 5 was removed with trifluoroacetic acid (TFA) and the N-deprotected dehydrodipeptide 6 was coupled with 2-(6-methoxy-2-naphthyl)propionyl chloride. Hydrogelator 1 was obtained after basic cleavage of the methyl ester of compound 7 (Fig. S1 in ESI†).
Characterization of the hydrogelator Npx-L-Met-Z-ΔPhe-OH
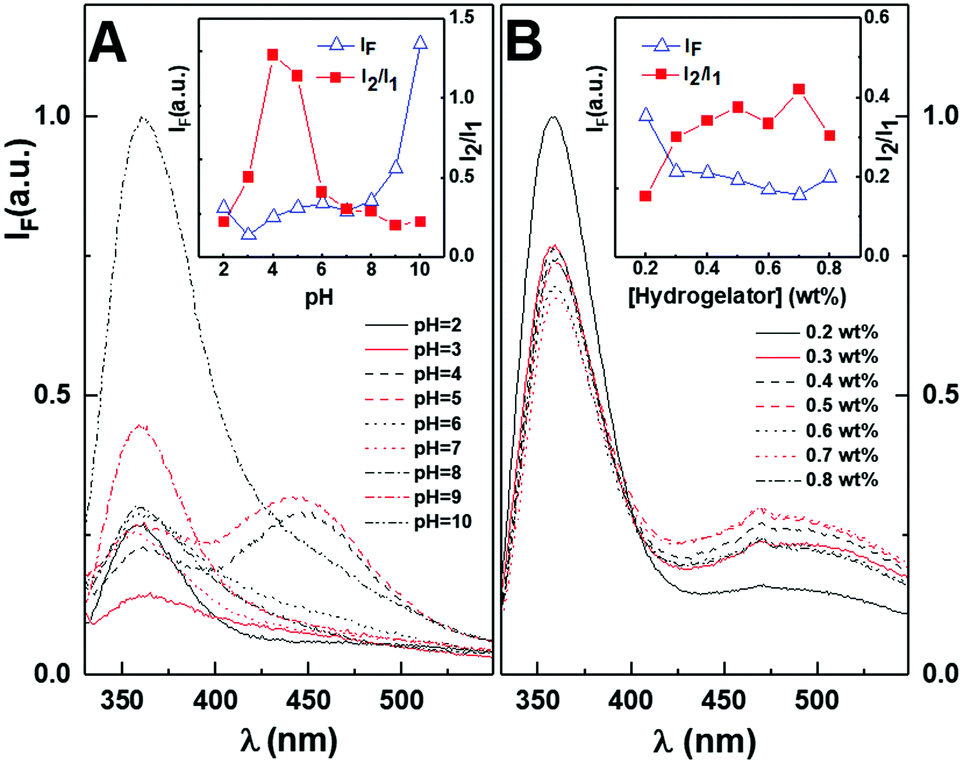 | ||
| Fig. 1 Fluorescence emission spectra of the (A) hydrogelator (2 × 10⁻⁶ M) in the pH range of 2–10 (λexc = 290 nm) and (B) in the concentration range of 0.2–0.8 wt% at pH = 6 (λexc = 290 nm). Insets: Maximum fluorescence intensity (IF) variation within the pH range and intensity ratio I2/I1 of the naproxen aggregate (I2, 450 nm) and monomer band (I1, 360 nm). | ||
Thus, the behaviour of the aggregate-to-monomer intensity ratio suggests that the carboxylic acid pKa must be close to this pH, which was previously observed for other dehydropeptide-based hydrogelators containing naproxen.36
The hydrogelator critical gelation concentration (CGC) assay was carried out in pH = 6 buffer, considering that it is close to the physiological pH, while ensuring the hydrogelator presented more Npx aggregates than at pH = 7. This is an advantage considering the changes in aggregation when the hydrogel is in contact with more acidic environments, such as the tumour region. The increased concentration used in this assay (comparative to the pH assay) resulted in no wavelength shifts of the monomer band, while the aggregate band was redshifted to 490 nm (Fig. 1B). Moreover, in this concentration range, incremental quenching of the monomer fluorescence emission was observed, which was associated with an increase in the aggregate band, where the minimum was attained at 0.7 wt%. The aggregate/monomer intensity ratio notably increased from 0.2 wt% to 0.3 wt%, with no changes in the monomer emission wavelength, suggesting that gelation was attained close to this concentration, where the presence of aggregates is higher. Nevertheless, a stable hydrogel could be attained at 0.1 wt%, which was gelated by dilution in an NaOH (1 M) aqueous solution (2 v/v%) followed by a decrease in pH with the addition of glucono-δ-lactone (GdL, 0.4 wt%).
The critical aggregation concentration was studied in the nanomolar range (Fig. S3B in the ESI†). An enhancement in the monomer fluorescence emission band was observed until a maximum at 0.025 nM. The maximum fluorescence emission is associated with the concentration at which self-assembly/aggregation occurs at room temperature, without applying any stimulus. The low aggregation concentration may be associated with the high predicted logP value of 4.12.
Molecular docking studies of hydrogelator Npx-L-Met-Z-ΔPhe-OH
Considering the anti-inflammatory property of the naproxen moiety, which may inhibit unwanted side effects by the immune system upon administration of the gel, the specificity and selectivity of hydrogelator 1 towards cyclooxygenase 2 (COX-2) and cyclooxygenase 1 (COX-1) were computationally evaluated. Direct docking of the crystallographic naproxen to evaluate the reliability of the defined protocol was previously reported and a root mean square deviation of 0.61 Å was calculated.59 The direct docking of the crystallographic flurbiprofen in COX-1 (Fig. S4 in the ESI†) attained an RMSD of 0.765 Å, thus making the defined protocol suitable.Cross docking between the hydrogelator and cyclooxygenases followed the same procedure applied to naproxen and flurbiprofen direct docking to evaluate the binding affinity for the active site and which parameters influence the hydrogelator stabilization in the binding pocket. The stabilizing hydrogen bonding interactions and distances to the Tyr355 hydroxyl group and Arg120 guanidinium moiety60 are represented in Fig. 2. Moreover, the common hydrophobic residues Leu,352 Val,349 Ala,527 and cyclooxygenase 2 (Val523) and 1 (Trp,387 Leu,531 and Ser530) specific interactions are also represented due to their role in the stabilization of the crystallographic ligands (naproxen and flurbiprofen) through hydrophobic interactions.60
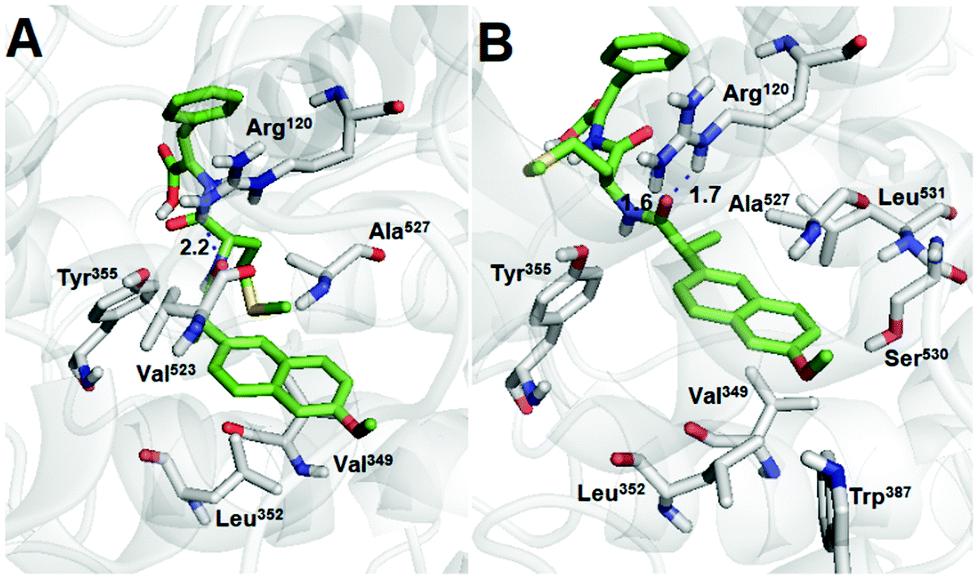 | ||
| Fig. 2 Representation of the best docking poses and polar interactions distances (Å) for the hydrogelator in (A) COX-2 and (B) COX-1 binding pocket obtained from the PyMOL software. | ||
The obtained lowest estimated free energies of binding, final intermolecular energy contribution in the binding pocket and the internal energy (both in the bound and unbound state) from the AutoDock calculations are presented in Table 1.
| Energy (kcal mol−1) | Naproxen (COX-2)59 | Flurbiprofen (COX-1) | COX-2 | COX-1 |
|---|---|---|---|---|
| Estimated free energy of binding | −8.25 | −9.10 | −7.43 | −6.52 |
| Final intermolecular energy | −9.15 | −10.00 | −11.01 | −10.10 |
| Final total internal energy | −0.31 | −0.38 | −3.26 | −1.24 |
| Loss of torsional free energy | +0.89 | +0.89 | +3.58 | +3.58 |
| Unbound system energy | −0.31 | −0.38 | −3.26 | −1.24 |
The hydrogelator shows a lower free energy of binding towards the cyclooxygenases than the crystallographic ligands (naproxen and flurbiprofen). The greatest contribution is associated with the favourable intermolecular interactions established between the binding pocket and the hydrogelator.
The methionine side chain affects the orientation of the naproxen moiety in the binding pocket. Thus, the lower affinity of the hydrogelator than the crystallographic ligands can be attributed to the higher loss of torsional free energy parameters.
The peptide backbone seems to have introduced slight selectivity towards COX-2. Nevertheless, the results suggest that anti-inflammatory activity through interaction with cyclooxygenases is possible, although to a lesser extent than that with naproxen and flurbiprofen.
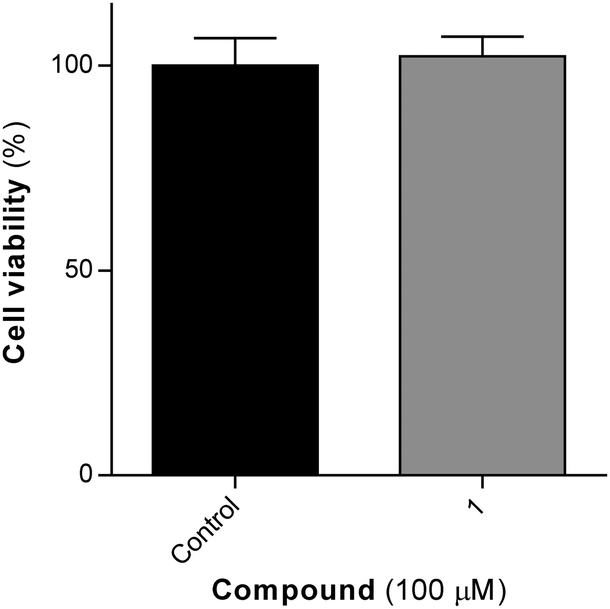 | ||
| Fig. 3 Cell viability in the presence of Npx-L-Met-Z-ΔPhe-OH for 24 h (three independent experiments performed in triplicate). | ||
Synthesis of the magnetic/plasmonic nanoparticles
The core/shell magnetic/plasmonic nanoparticles were synthesised based on the direct deposition of gold on manganese ferrite.61 The gold-decorated nanoparticles were synthesised through CDI coupling of the nanoparticle surface OH− groups to the MPA-functionalized gold nanoparticles carboxylic moiety. The obtained UV-visible absorption spectra are presented in Fig. 4.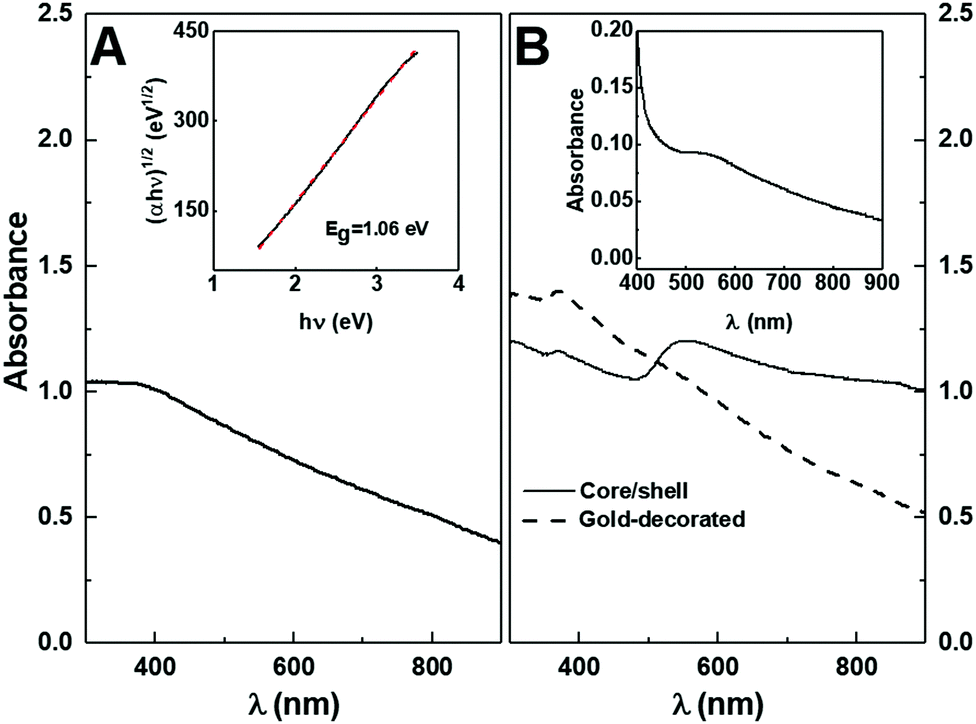 | ||
| Fig. 4 Absorption spectra of (A) MnFe2O4 nanoparticles and (B) core/shell MnFe2O4/gold and gold-decorated MnFe2O4 nanoparticles. Inset: (left) Tauc plot of MnFe2O4 nanoparticles and (right) absorption spectrum of gold nanoparticles. | ||
From the Tauc plot (inset of Fig. 4A), the optical band gap (Eg) of the manganese ferrite nanoparticles was determined and a linear relation was obtained for an indirect semiconductor with a band gap of 1.06 eV, which is similar to the previously reported values of 1.08 eV37 and 0.98 eV.62 The gold shell resulted in the appearance of a wide plasmon band with a maximum between 542 and 560 nm (Fig. 4B), with a small shoulder near 850 nm.
A universal scaling exponential decay of Δλ/λ0 with the ratio between shell thickness and magnetite (Fe3O4) core radius was proposed,61,63 where Δλ = λ − λ0, λ is the LSPR wavelength of the core–shell nanoparticle and λ0 the LSPR position of the corresponding gold core. Considering cores of 9 nm, 21 nm and 48 nm, the corresponding gold nanoparticles in water exhibited LSPR bands at 517 nm, 521 nm and 533 nm, respectively.64 Considering that the medium at the surface of prepared core–shell nanoparticles is expected to be composed by glycerol, and that its refraction index (1.47) is higher than that of water, a ∼20 nm red shift in the LSPR band is expected for spherical gold nanoparticles with a size of 40 nm,65 with the magnitude of the shift decreasing with a decrease in particle size. Therefore, the LSPR of the considered gold cores were predicted to be located at 553 nm. Accordingly, the LSPR of the core–shell nanoparticles will be <758 nm, <853 nm and >916 nm for a 1 nm shell and <538 nm, <579 nm and >691 nm for a 10 nm shell, respectively. However, the red-shifted plasmon band arising from the coupling of the gold shell with the core medium was found to be damped when the core imaginary refractive index increased,63 leaving an anti-coupled mode slightly deviated with a blue shift. MnFe2O4 is expected to have a higher imaginary component of the refractive index than magnetite since its indirect band gap is much lower than that of Fe3O4, which has been reported to be 2.12 eV.66 Thus, the obtained absorption spectrum of the Au@MnFe2O4 nanoparticles is compatible with an approximately 50 nm core and 1 nm gold shell, with the anti-coupled mode appearing below 553 nm or considering that the coupled mode is not damped, a core near 20 nm and gold shell above 10 nm.
The prepared spherical gold nanoparticles have their characteristic surface plasmon resonance band centred at around 530 nm, which corresponds to nanoparticles with a size in the range of 5–10 nm, in comparison to the gold nanoparticles capped with thiol ligands published in other works.39,67 Moreover, the colour shown upon nanoparticle precipitation is not associated with the aggregation of nanoparticles since no absorption band was observed at around 700 nm.39 This means that the capping layer is sufficiently long to avoid coupling between the gold nanoparticles. After coupling with manganese ferrite nanoparticles, the contribution from the gold nanoparticles plasmon band was observed at around 550 nm. This shift indicates that the gold nanoparticles were effectively bonded to manganese ferrite nanoparticles.
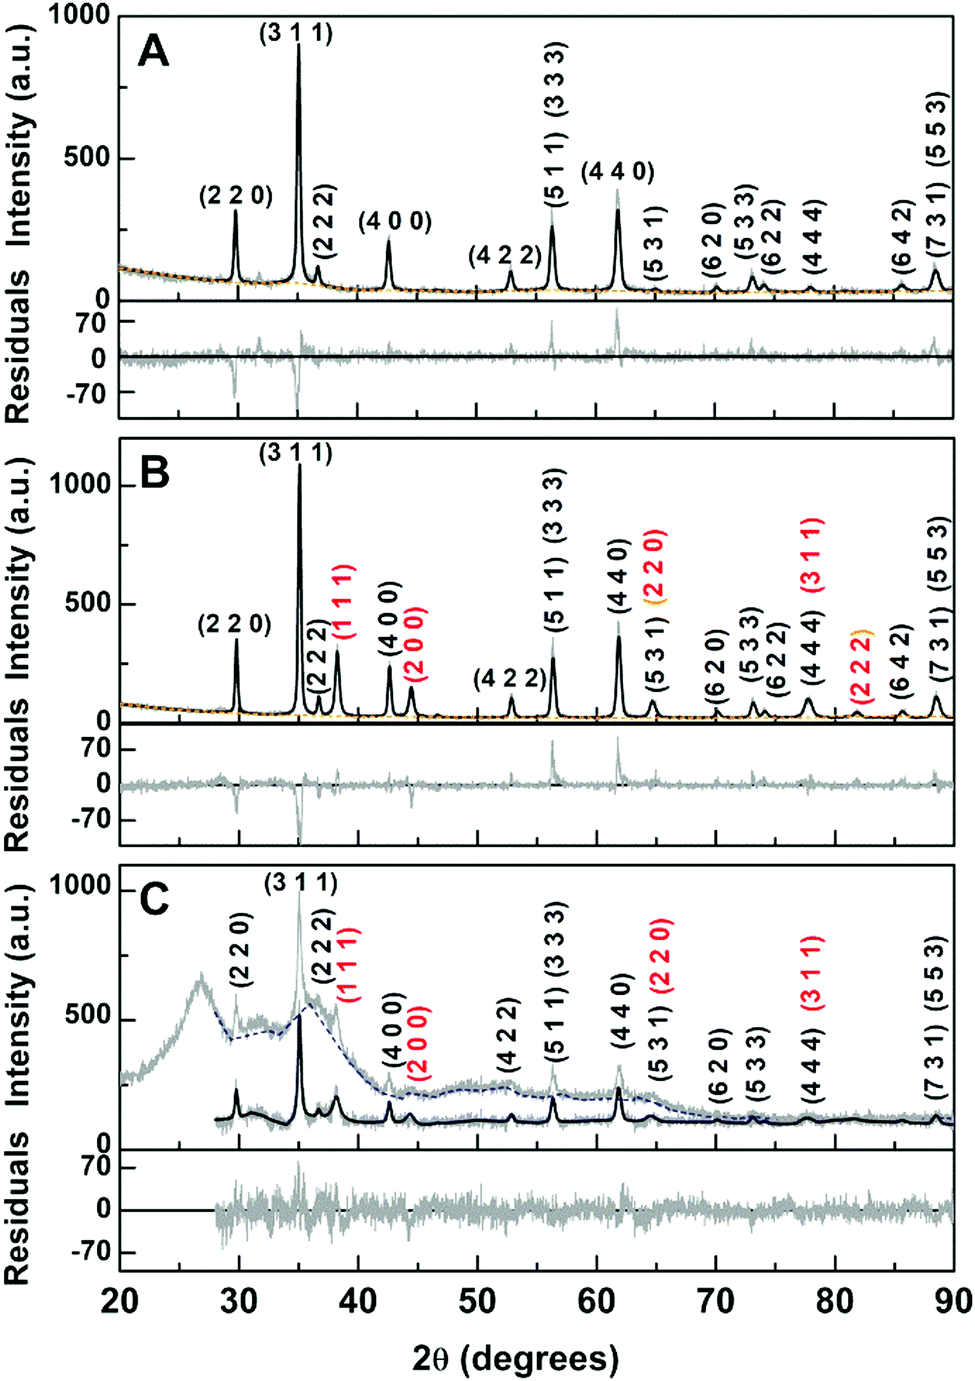 | ||
| Fig. 5 X-ray diffraction pattern of (A) manganese ferrite nanoparticles, (B) core/shell manganese ferrite/gold nanoparticles, and (C) manganese ferrite decorated with gold nanoparticles. Gray lines: experimental patterns and black lines: fitted patterns. Background (A and B) and amorphous background (C): short-dashed lines. Miller indices: black: manganese ferrite and red: gold. | ||
Nevertheless, diffraction peaks of gold (Fig. 5B and C) were observed at 2θ = 38.1° (1 1 1), 44.4° (2 0 0), 64.6° (2 2 0), 77.6° (3 1 1) and 81.8° (2 2 2), corresponding to CIF 9013035 (space group Fm![[3 with combining macron]](https://www.rsc.org/images/entities/char_0033_0304.gif) m). The diffraction peaks of the MnFe2O4 crystalline structure (Fig. 5A) were observed at 2θ = 29.7° (2 2 0), 34.9° (3 1 1), 36.5° (2 2 2), 42.5° (4 0 0), 52.7° (4 2 2), 56.2° (3 3 3) and (5 1 1), 61.8° (4 4 0), 65.0° (5 3 1), 70.1° (6 2 0), 73.1° (5 3 3), 74.0° (6 2 2), 78° (4 4 4), 85.6° (6 4 2), 88.5° (7 3 1) and (5 5 3), corresponding to CIF file 23000618 (space group Fdm:2).
m). The diffraction peaks of the MnFe2O4 crystalline structure (Fig. 5A) were observed at 2θ = 29.7° (2 2 0), 34.9° (3 1 1), 36.5° (2 2 2), 42.5° (4 0 0), 52.7° (4 2 2), 56.2° (3 3 3) and (5 1 1), 61.8° (4 4 0), 65.0° (5 3 1), 70.1° (6 2 0), 73.1° (5 3 3), 74.0° (6 2 2), 78° (4 4 4), 85.6° (6 4 2), 88.5° (7 3 1) and (5 5 3), corresponding to CIF file 23000618 (space group Fdm:2).
The Rietveld analysis was performed using the FullProf software suite68 (details in the ESI†). The calculated parameters and phase sizes are presented in Table 2.
The manganese ferrite phases have an average size of approximately 34.8 nm, which was found to increase to 48.8 nm upon thermal treatment in glycerol, leading to the formation of the gold shell.38 The gold phase in the core/shell nanoparticles was estimated to be 22.6 nm, resulting in an overall particle size of 94 nm. Although several studies reported the absence of core diffraction peaks when the gold shell has a thickness higher than 2 nm69,70 or a huge intensity decrease with a gold shell of up to 8.5 nm,71 in the latter case, the 13 nm core was observed to have a broader diffraction peak than that of the 2.5 nm shell. On the other hand, the gold shell diffraction peaks seemed to have distinct broadening effects, where for the 10 nm magnetite core coated with a 2 nm gold shell, the diffraction peak widths were identical (its dimensions were obtained from TEM measurements).69 Thus, in the obtained core/shell nanoparticles, either the gold shell is incomplete or a thin shell is present. The obtained gold weight percentage was only 7.1%. If the sizes obtained from the Rietveld analysis are the correct ones, and even considering that the size of gold phase corresponds to twice the thickness (a given X-ray when interacting with a core–shell nanoparticle encounters the gold phase two times), a 90% value would be expected (71.4 nm overall size). This means that only 8% of the MnFe2O4 nanoparticles was been coated. Considering a 1 nm shell thickness (50.8 nm overall size), then 33% weight percentage is expected, with a corresponding more reasonable 21% value for the coating efficiency.
For the gold-decorated nanoparticles and considering again that the gold phase size given by the Rietveld analysis corresponds to twice the gold nanoparticle size, the obtained gold weight percentage indicates that the average number of gold nanoparticles per MnFe2O4 is 16.8. This value would be 2.1 if the gold phase size corresponds to the gold nanoparticles size.
Development of magnetogels
The structure of the hydrogel is emphasized in Fig. 6A and B, where it can be observed that the hydrogel matrix comprises a fibrous structure, with the fibres exhibiting an average cross-section of 16.6 ± 2.4 nm, the thinnest being 7 nm and the thickest 21 nm. The fibres possessed diameters larger than 2 μm.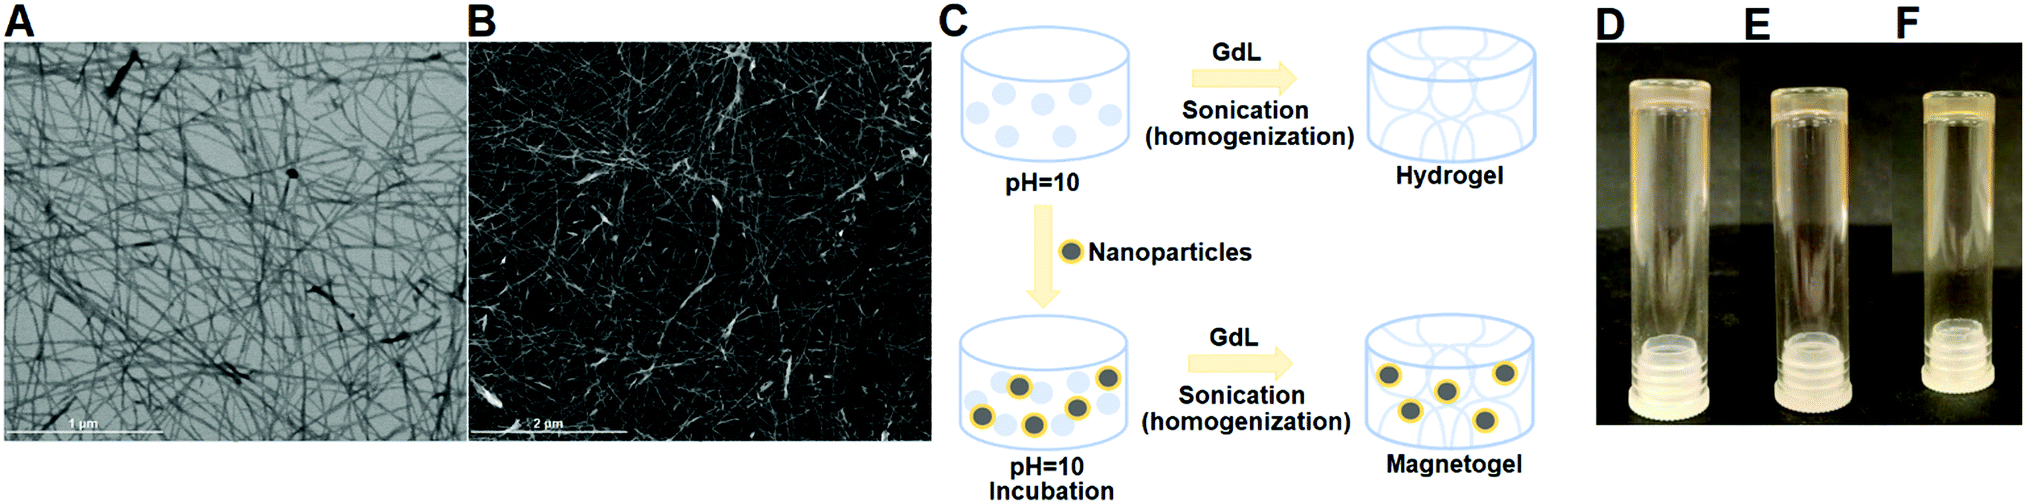 | ||
| Fig. 6 (A) STEM image of hydrogel in bright field (scale bar: 1 μm). (B) STEM image of hydrogel in dark field (scale bar: 2 μm). (C) Scheme of the gelation strategy of hydrogel and magnetogel. (D–F) Images of the glass vial inversion test of the magnetogel containing (D) core/shell nanoparticles 10 m/m%, (E) gold-decorated nanoparticles at 10 m/m% and (F) at 20 m/m%. The magnetogels showed a homogeneous dispersion and no visible deposition. | ||
Magnetogels were developed by mixing magnetic nanoparticles with the hydrogelator solution at pH = 10 and incubating at room temperature for 4 h (Fig. 6C). During the self-assembly process trigger, several phenomena will be competing, mainly the sedimentation and aggregation of nanoparticles, the formation of fibrils and coating of the nanoparticles. Here, the magnetogels were previously evaluated at 10, 20 and 30 m/m% concentration of nanoparticles for 0.3 wt% of hydrogelator since no magnetogel could be formed at a lower hydrogelator concentration. A homogenous dispersed magnetogel was obtained for 10 m/m% (Fig. 6D–F) owing to the rapid gelation, while for the 20 m/m% core/shell nanoparticles a gradient was obtained, and at 30 m/m% both nanoparticles sedimented.
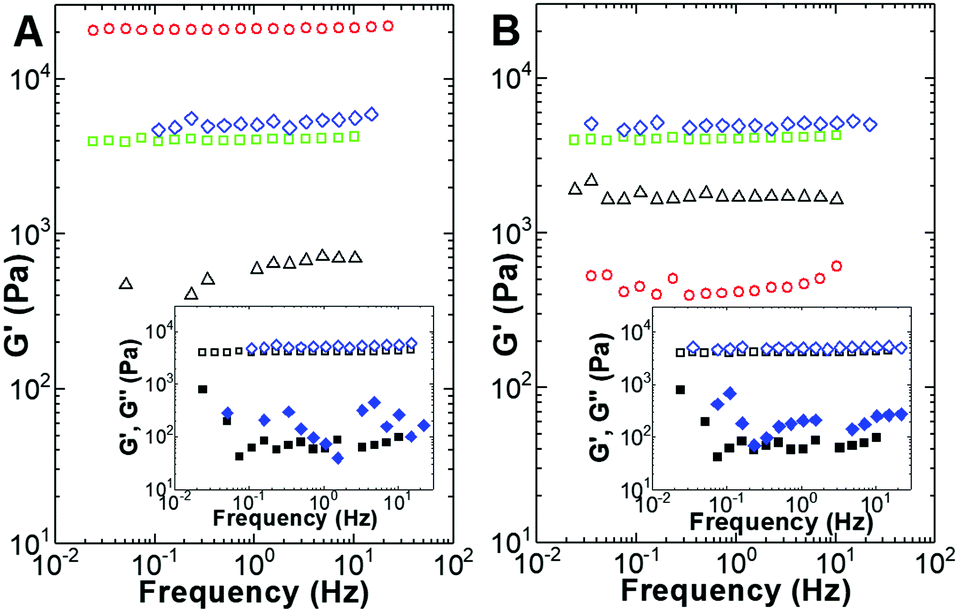 | ||
| Fig. 7 Frequency dependence of the shear elastic modulus, G′, for hydrogels formulated with 0 m/m% (squares), 10 m/m% (circles), 20 m/m% (triangles) and 30 m/m% (diamonds) of gold-decorated nanoparticles (A) or core/shell nanoparticles (B). Insets: Mechanical spectra (G′, empty symbols; G′′, solid symbols) of the hydrogel (squares) and magnetogels formulated with 30 m/m% nanoparticles (diamonds). | ||
Depending on the function and location of the tissue, the elastic modulus of native tissue ranges from 0.1 kPa (brain) to 100 kPa (cartilage).72 The elastic modulus of the developed hydrogel and magnetogels falls in the range of 1 kPa to 100 kPa, which covers soft tissues such as skin, pancreas, spleen, glands and muscles.72 Therefore, from a mechanical perspective, the hydrogel and magnetogels elastic properties seem to be promising for biomedical applications.
Compared to previously reported hydrogels with a similar chemical nature and prepared at a similar concentration, the hydrophobic collapse of the methionine residue seems to have reinforced the elasticity of the hydrogel (4 kPa at 0.3 wt%) compared to the hydrogels containing phenylalanine (Npx-L-Phe-Z-ΔPhe-OH, 1.7 kPa at 0.4 wt%), valine (Npx-L-Val-Z-ΔPhe-OH, 0.7 kPa at 0.6 wt%) and alanine (Npx-L-Ala-Z-ΔPhe-OH, 0.8 kPa at 0.8 wt%), being similar to the tryptophan-containing hydrogel (Npx-L-Trp-Z-ΔPhe-OH, 4 kPa at 0.4 wt%).34,36 Thus, a long hydrophobic residue close to the N-terminal aromatic moiety is expected to favour higher elasticity.
However, the addition of more nanoparticles changed this scenario since the viscoelastic features of the hydrogel were progressively recovered. Consequently, adding 30 m/m% nanoparticles did not result in any significant viscoelastic change to the hydrogel (mechanical spectra of gels at 20 m/m% are presented in the ESI†).
Nonlinear viscoelastic data was recently shown to be efficient in revealing the hierarchical structures of gelatin gels.73 Therefore, large amplitude oscillatory shear strain sweeps (LAOSS) were performed in an attempt to assess the possible structural differences in the gels prepared with the two types of particles. The strain dependence of the G′/G0 ratio (where G0 is the value of the shear modulus G′ measured at 1 Hz in the linear viscoelastic regime) is presented in Fig. 8.
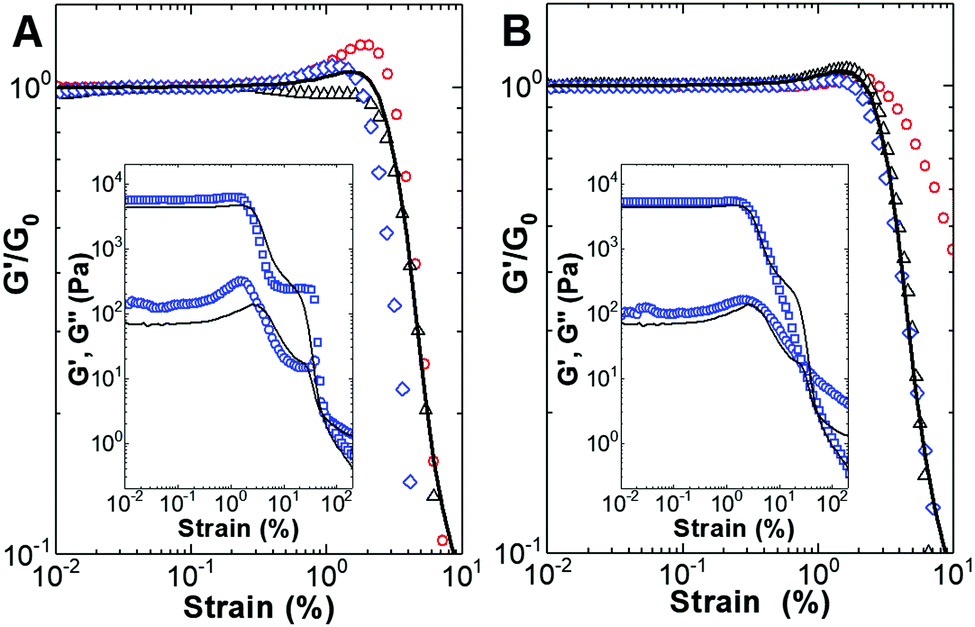 | ||
| Fig. 8 Strain dependence of the shear elastic modulus, G′, scaled by its value (G0) measured in the linear regime for the hydrogels formulated with gold-decorated nanoparticles (A) and with core/shell nanoparticles (B): 0 m/m% (lines), 10 m/m% (circles), 20 m/m% (triangles) and 30 m/m% (diamonds). Inset: Strain dependence of the elastic (G′, squares) and loss (G′′, circles) moduli for the hydrogels formulated with 0 m/m% (lines) and 30 m/m% (symbols) of nanoparticles. | ||
Overall, the strain dependence of the G′/G0 ratio indicates a strain hardening behavior for all the samples except the gel formulated with 20 m/m% gold-decorated manganese ferrite nanoparticles. Strain hardening, characterized by an increase in G′ with strain, is the nonlinear mechanical signature of a wide range of gels with structures ranging from networks of semi-flexible filaments to networks of strongly linked fractal flocs of colloidal particles.74–76
The magnetogels formulated with the gold-decorated manganese ferrite nanoparticles were more sensitive to shear deformation since the critical strain beyond which strain hardening occurs is smaller (0.2% against 0.4%). In addition, these magnetogels exhibited more intense hardening since the maxima in G′/G0 are larger than that measured for the hydrogels filled with bare core/shell nanoparticles.
All the gels showed the Payne effect, as can be seen in the inset of Fig. 8 for the hydrogel and magnetogels doped with 30 m/m% nanoparticles. The Payne effect has been reported for a large variety of viscoelastic matrices reinforced by solid fillers and is characterized by a local maximum in G′′, which is concomitant with a significant decrease in G′ with an increase in strain. This effect can be associated with the breakage and recovery of weak interaction bonds linking adjacent filler clusters, the aggregation/disaggregation of nanoparticles, and molecular disentanglement.77 Nevertheless, the data displayed in Fig. 8 indicate that the nonlinear viscoelastic response of the samples is sensitive to differences in particle–particle and particle–hydrogelator interactions.
The intrinsic fluorescence of the hydrogelator naproxen moiety allowed the incorporation of the magnetic nanoparticles into the hydrogel to be followed through changes on its photophysical behaviour. The fluorescence spectra show a maximum emission at 360 nm, associated with the monomer state of the naproxen moiety, and an aggregate band at around 450 nm36 (Fig. 9A). The magnetic nanoparticles introduced several photophysical effects, but mainly fluorescence quenching. This effect can be a result from the electronic energy transfer to the nanoparticles owing to their wide absorption spectrum, but also due to the heavy atom effect, where the presence of heavy atoms enhances the spin–orbit interaction, favouring intersystem crossing.47
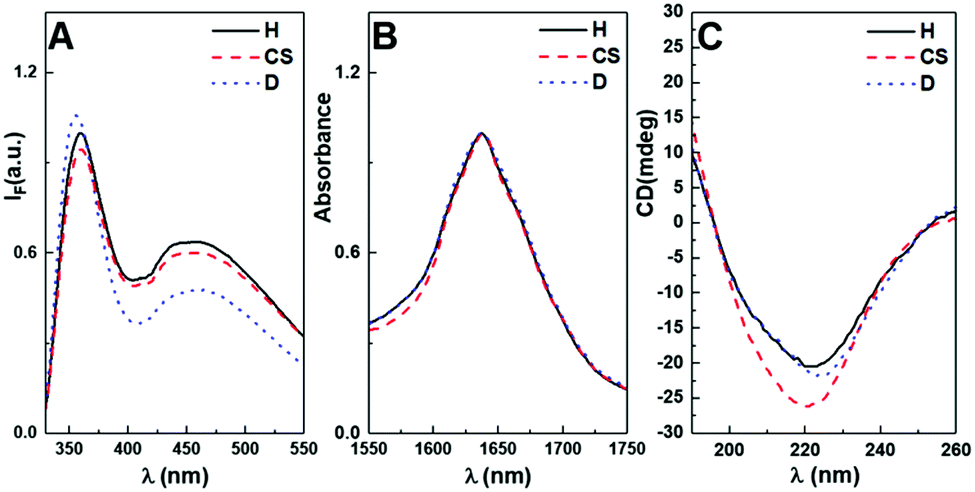 | ||
| Fig. 9 (A) Fluorescence emission spectra of hydrogel (H) and magnetogels with core/shell (CS) and gold-decorated (D) nanoparticles, 10 m/m%. (B) Hydrogel and magnetogel amide I infrared absorption spectra. (C) Hydrogel and magnetogel circular dichroism spectra of the hydrogelator solution at 0.02 wt%. | ||
However, more effects are included due to the localized surface plasmon of the gold shell. The near-field enhancement close to the nanoparticles will increase absorption and fluorescence, where the latter is enhanced owing to the coupling of the lowest order plasmonic modes (electric dipolar mode) to the far-field.78–80
Nevertheless, the obtained fluorescence quenching evidences the domination of non-radiative mechanisms in the magnetogels. On the other hand, the introduction of gold-decorated manganese ferrite nanoparticle surface functional groups may hinder the proximity of the fibres or modify their structure, as denoted by the higher monomer-to-aggregate intensity ratio and the blue-shift in monomer emission (Fig. 9A).
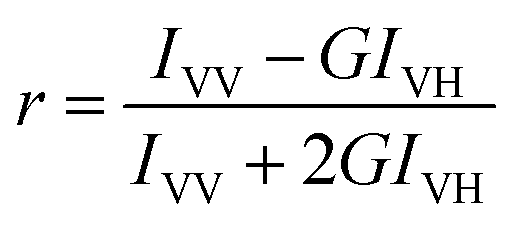
Moreover, the fluorescence anisotropy values of the naproxen moiety suggest that the hydrogel (r = 0.113) fibrils underwent a structural change with the introduction of the core/shell (r = 0.043) and gold-decorated (r = 0.035) nanoparticles.
Fig. 9B displays the FTIR absorption spectra in the amide I region (1600–1700 cm−1). In this region, the main contribution for infrared absorption is the C![[double bond, length as m-dash]](https://www.rsc.org/images/entities/char_e001.gif) O stretching, which is sensitive to the protein secondary structure owing to the hydrogen bonding pattern and molecular geometry. The second derivative shows a peak at around 1625 cm−1 and 1639–1641 cm−1, which can be assigned to β-sheet and random coil, respectively (Fig. S7 in the ESI†). Other peaks were identified at 1668 cm−1 and 1685 cm−1, which are associated with the presence of turns and loops, respectively, while the peak at 1699 cm−1 may be a result of the strong hydrogen bonds between β-sheets or β-strand aggregates.49 The major difference is that magnetogels exhibited a decrease in the intensity of the bands corresponding to ordered structures, suggesting that in the presence of nanoparticles, the hydrogelators are more randomly oriented. Table 3 displays the percentages of secondary structures obtained for the hydrogel and magnetogels. The results show a close agreement between the amide III and second derivative curve fitting method, mainly when the percentages of ordered (α-helix and β-sheet) and unordered (random coil and turns) structures are compared. Overall, a reduction in ordered secondary structures was obtained for the magnetogels compared to the hydrogels, which was accompanied by an increase in unordered structures. Accordingly, a higher percentage of unordered structures may reduce the compactness of the well-ordered self-assembled structures owing to the lack of ordered hydrogen bonding, which may not only induce thicker fibres than in the hydrogel, but also a less stable matrix.
O stretching, which is sensitive to the protein secondary structure owing to the hydrogen bonding pattern and molecular geometry. The second derivative shows a peak at around 1625 cm−1 and 1639–1641 cm−1, which can be assigned to β-sheet and random coil, respectively (Fig. S7 in the ESI†). Other peaks were identified at 1668 cm−1 and 1685 cm−1, which are associated with the presence of turns and loops, respectively, while the peak at 1699 cm−1 may be a result of the strong hydrogen bonds between β-sheets or β-strand aggregates.49 The major difference is that magnetogels exhibited a decrease in the intensity of the bands corresponding to ordered structures, suggesting that in the presence of nanoparticles, the hydrogelators are more randomly oriented. Table 3 displays the percentages of secondary structures obtained for the hydrogel and magnetogels. The results show a close agreement between the amide III and second derivative curve fitting method, mainly when the percentages of ordered (α-helix and β-sheet) and unordered (random coil and turns) structures are compared. Overall, a reduction in ordered secondary structures was obtained for the magnetogels compared to the hydrogels, which was accompanied by an increase in unordered structures. Accordingly, a higher percentage of unordered structures may reduce the compactness of the well-ordered self-assembled structures owing to the lack of ordered hydrogen bonding, which may not only induce thicker fibres than in the hydrogel, but also a less stable matrix.
| System | H | CS | D | ||||||
|---|---|---|---|---|---|---|---|---|---|
| Method | AI | ASD | AIII | AI | ASD | AIII | AI | ASD | AIII |
| OC: ordered structures (α-helix and β-sheet); and UC: unordered structures (turn and random coil). | |||||||||
| α-Helix | 0 | 0 | 9.8 | 0 | 0 | 13.3 | 0 | 0 | 12.8 |
| β-Sheet | 45.8 | 28.1 | 19.7 | 41.6 | 24.3 | 13.0 | 34.4 | 25.2 | 13.0 |
| Turn | 19.9 | 17.0 | 23.0 | 9.4 | 24.5 | 33.9 | 41.2 | 16.3 | 32.0 |
| Random coil | 34.3 | 54.9 | 47.4 | 49.0 | 44.2 | 39.8 | 24.4 | 58.5 | 42.2 |
| OC | 45.8 | 28.1 | 29.6 | 41.6 | 26.1 | 26.3 | 34.4 | 25.2 | 25.8 |
| UC | 54.2 | 71.9 | 70.4 | 58.4 | 73.9 | 73.7 | 65.6 | 74.8 | 74.2 |
| χ 2 | 4 × 10⁻⁷ | 1 × 10⁻¹¹ | 3 × 10⁻⁸ | 4 × 10⁻⁸ | 3 × 10⁻¹¹ | 7 × 10⁻¹⁰ | 2 × 10⁻⁷ | 6 × 10⁻¹² | 1 × 10⁻¹⁰ |
A molecule is optically active in circular dichroism (CD) if its chromophore contains an asymmetric (chiral) environment or displays induced chirality owing to three-dimensional bonding structures.81–83 Thus, the spectrum corresponds to the sum of its conformational elements.83 The β-sheet structures were characterized by a sharp positive band in the region of 195–210 nm and a broad negative band in the region of 215–230 nm, while the α-helices display negative ellipticity at 222 nm and 208 nm, and positive ellipticity at 193 nm.83 The random coil structures have a weak positive band at 217 nm and a large negative near 200 nm.83 These bands are associated with the peptide bond π–π* and n–π* transitions, which are centred at around 190 nm and 220 nm, respectively.36,84 The obtained CD spectra of diluted hydrogelator solutions with and without nanoparticles are represented in Fig. 9C. The solutions show a similar spectral shape, where an increase in ellipticity was observed in the presence of the core/shell nanoparticles and a red-shift for the magnetogel containing gold-decorated nanoparticles. Overall, the exciton couplets are evidenced by a negative Cotton effect with a broad negative ellipticity centred at 220 nm and a slow ellipticity decrease for lower wavelengths, which suggest the dominance of β-sheets and that the hydrogelator molecules establish similar intermolecular interactions in hydrogel and magnetogels. Nevertheless, the naphthalene moiety commonly shows exciton couplets between 200 and 230 nm, besides being stronger in magnitude than the peptide transitions.85 Thus, the broad negative ellipticity arises from the sum of contributions from the secondary structure and naphthalene exciton couplets.
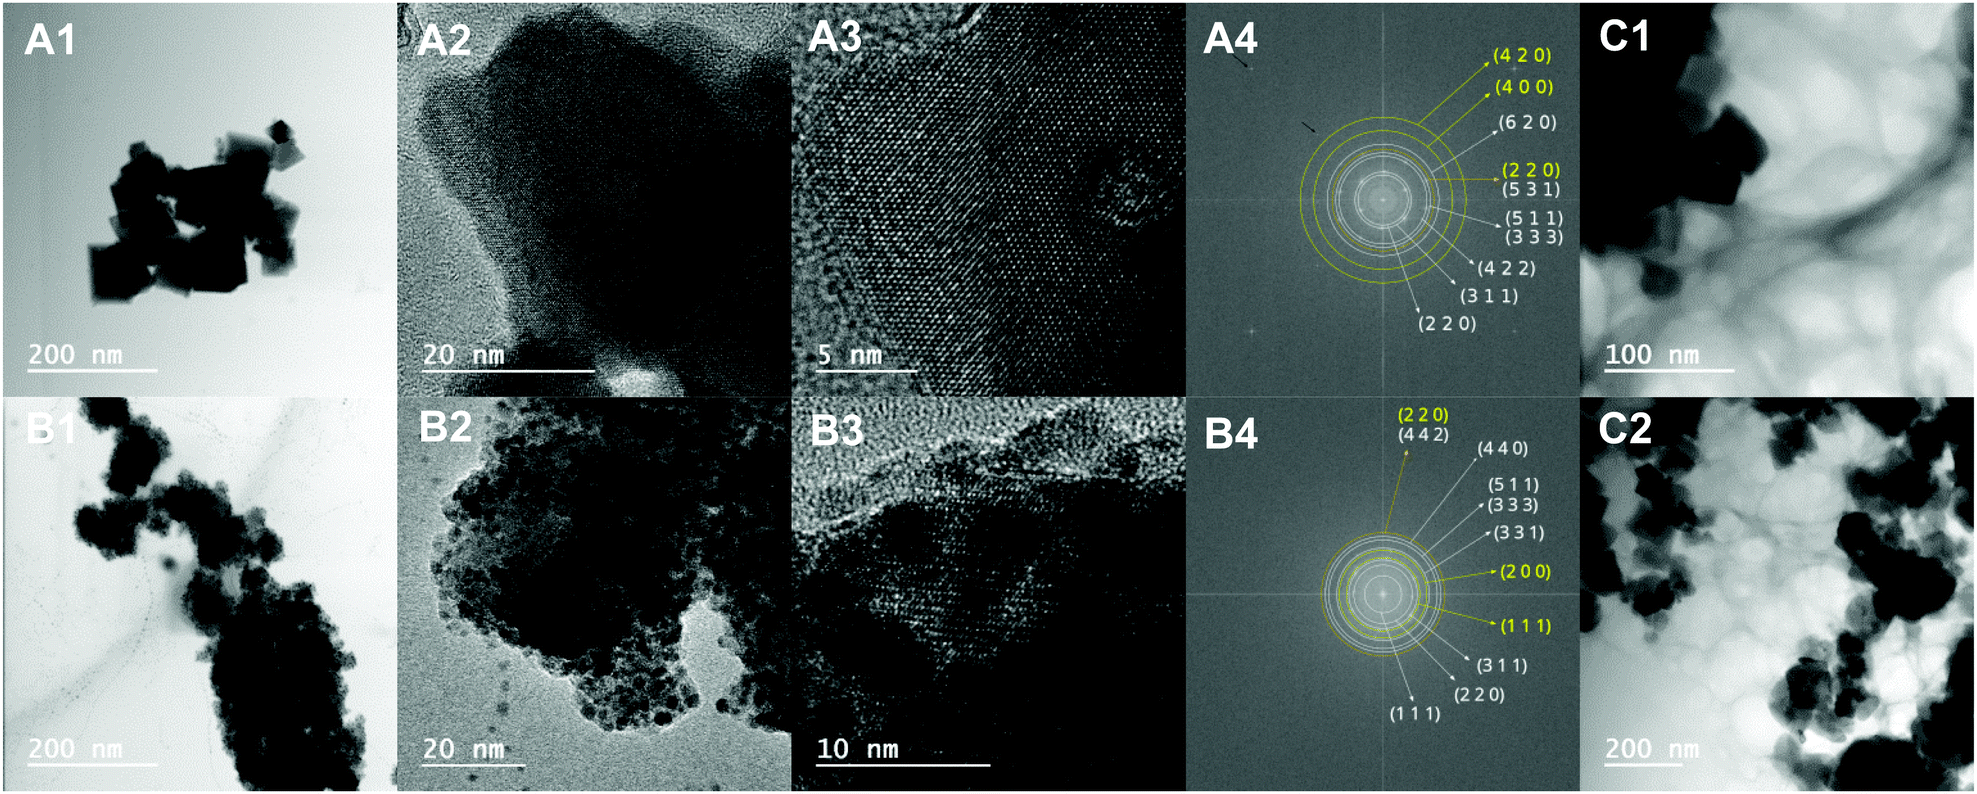 | ||
| Fig. 10 Transmission electron microscopy images of (A) core/shell manganese ferrite/gold nanoparticles and (B) gold-decorated manganese ferrite nanoparticles. A4 and B4 are the fast Fourier transform of the respective nanoparticles, where some gold planes (yellow) and MnFe2O4 planes (white) are indexed. (C) TEM image of Npx-L-Met-Z-ΔPhe-OH (0.08 wt%) magnetogel containing 10 m/m% core/shell manganese ferrite/gold nanoparticles (C1) and gold-decorated manganese ferrite nanoparticles (C2). | ||
For the core–shell nanoparticles, subtracting (from the obtained average size) the value of the MnFe2O4 core diameter obtained through XRD Rietveld analysis, the shell thickness can be estimated to be 3 nm. However, the defect on the Au coating seen in the darker zone of Fig. 10A3 seems to indicate a much thinner shell layer. The fast Fourier transform (FFT) of this figure shows bright spots that prove the existence of both MnFe2O4 and Au phases (Fig. 10A4). Specifically, these spots appear at 2.98, 2.66, 1.70, 1.58, 1.45 and 1.34 Å, corresponding to d-spacing values of the MnFe2O4 spinel crystal structure with 8.483 Å lattice constants of 3.00, 2.56, 1.73, 1.63, 1.43 and 1.34 Å, respectively, where the (h k l) Miller indices are indicated in the figure. The Au phase results in spots at 1.45, 1.08 and 0.9 Å, which can be assigned to the d-spacing values of the Au fcc crystal structure with 4.076 Å lattice constants of 1.44, 1.02 and 0.91 Å, respectively. The bright spots at low spacing values (∼0.4 Å and 0.8 Å) and marked with a dark arrow were found to be instrumental artifacts since they appear in the FFT of images with different resolutions at exactly the same pixel positions (data not shown). The FFT of the circular spots in the lighter and darker regions of Fig. 10A3 (Fig. S11 in the ESI†) shows that the gold spots are mainly located in the darker region.
For the gold-decorated MnFe2O4 nanoparticles, the estimation of overall particle size was very difficult due to the further agglomeration on the TEM grid. This explains why the obtained average value of 45.7 nm is higher than the sum of the size of the MnFe2O4 phase obtained from the XRD Rietveld analysis (34.8 nm) with that of the Au nanoparticles obtained from TEM (3.8 nm). Nevertheless, the size of the gold nanoparticles from TEM imaging is similar to half the value of the size determined from XRD for the gold phase (7.88/2 = 3.94 nm), confirming the hypothesis that on average, the X-rays at a given diffraction angle detected two gold nanoparticles per MnFe2O4 core. The FFT of the image in Fig. 10B3 also shows bright spots, which confirm the presence of both Au and MnFe2O4 phases. Specifically, these spots appear at 4.72, 2.98, 2.54, 1.89, 1.61, 1.51 and 1.42 Å, corresponding to d-spacing values of the MnFe2O4 spinel crystal structure with 8.486 Å lattice constants of 4.90, 3.00, 2.56, 1.94, 1.63, 1.50 and 1.41 Å, respectively. For Au, the bright spots are observed at 2.38, 1.98 and 1.42 Å and are attributed to d-spacing values of the Au fcc crystal structure with 4.085 Å lattice constants of 2.35, 2.04 and 1.44 Å, respectively.
In Fig. 10C1 and C2, it can be observed that the nanoparticles work as template surfaces for the growth of the hydrogel fibres, which results in a porous structure with an average pore size of 82.2 ± 44.6 nm, where the smallest pore is 20 nm and the largest is 223 nm. The fibres have an average cross section of 11.2 ± 3.6 nm, the thinnest being 5.6 nm and the thickest 21 nm. The high density of nanoparticles and fibre crosslinks suggest that the gels are highly saturated at 10 m/m% of nanoparticles.
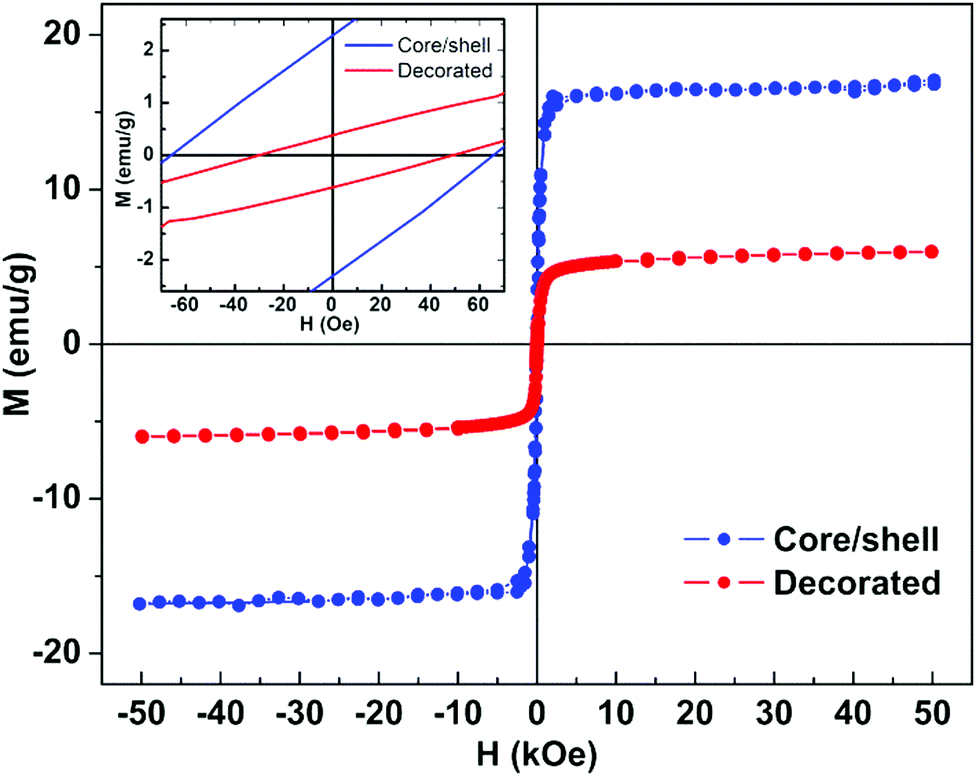 | ||
| Fig. 11 Magnetization hysteresis loops of manganese ferrite/gold nanoparticles measured at room temperature (T = 300 K). Inset: Enlargement of the loops in the low field region. | ||
| H c (Oe) | M s (emu g−1) | M r (emu g−1) | M r/Ms | |
|---|---|---|---|---|
| Core/shell | 63.2 | 17.1 | 2.04 | 0.12 |
| Decorated | 39.1 | 6.15 | 0.52 | 0.08 |
As evidenced from the Mr/Ms ratio, which is around 0.1 for both types of nanoparticles, both nanoparticles present roughly superparamagnetic behaviour.86
Therefore, both nanoparticles designs show promising results for magnetic targeting and hyperthermia, although the gold-shell manganese ferrite nanoparticle design represents an improvement due to the reduction of the diamagnetic contribution of gold. The presence of both plasmonic and magnetic materials with promising magnetic properties is expected to synergistically enhance both photodynamic therapy and hyperthermia (through the combined use of magnetic hyperthermia and photothermia), allowing the use of the unique modality magnetomotive photoacoustic imaging,61 and guaranteeing the retention of the nanoparticles in the target site (through a magnetic field gradient) to avert the reoccurrence of cancer even when the hydrogel has been degraded/absorbed.
The fluorescence emission (around 500 nm) of curcumin due to FRET from the hydrogelator is overlapped by the emission band of the aggregates (Fig. 12). However, direct excitation at 420 nm resulted in a strong emission from curcumin in all the gels (insets of Fig. 12), indicating that curcumin was in the hydrophobic domains of the system networks (near the gel fibres) since it does not emit fluorescence in aqueous environments. A highly similar quenching effect of the monomer band was obtained, and a similar curcumin to monomer emission ratio was also verified. This demonstrates that the nanoparticles did not significantly affect the distance of curcumin relative to the fibrils since the quenching effect on the gels due to FRET from hydrogelator aromatic moieties to curcumin remained similar. However, it was observed that for the three systems, curcumin emitted fluorescence with different bandwidths, shapes and wavelength maxima (Fig. 12, insets). The magnetogel containing gold-decorated nanoparticles seems to have a stricter variety of environments for curcumin location owing to its sharper emission band and blue-shifted fluorescence maximum. Thus, in this system, curcumin is restricted to more hydrophobic environments than in the magnetogel based on core/shell nanoparticles and in the hydrogel. These hydrophobic environments may be associated with the long chain functional groups at the surface of the nanoparticles or changes on the organization of the fibres due to nanoparticle-fibre interactions.
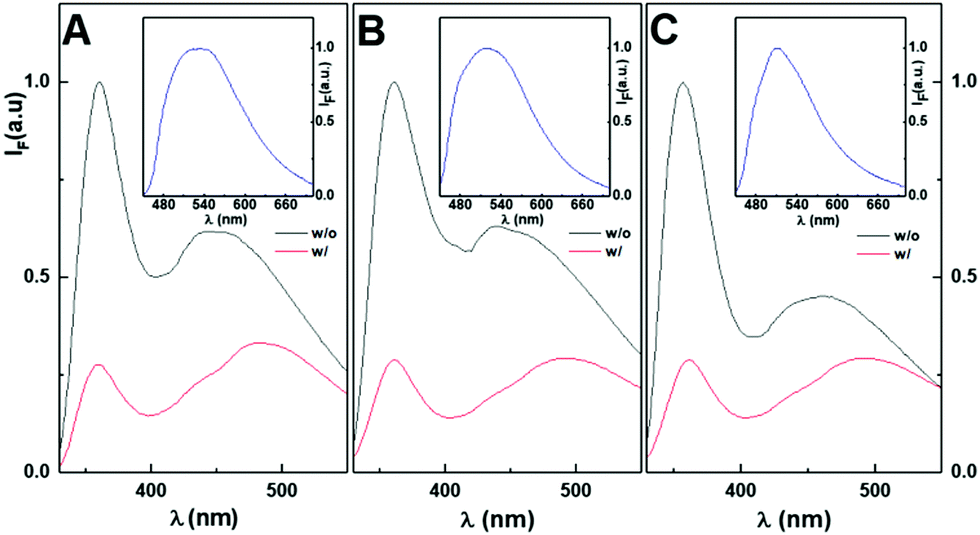 | ||
| Fig. 12 Fluorescence emission spectra of (A) hydrogel, (B) magnetogel with core/shell manganese ferrite/gold nanoparticles (10 m/m%) and (C) magnetogel with gold-decorated manganese ferrite nanoparticles (10 m/m%), with (w/) and without (w/o) curcumin (λexc = 290 nm). Insets: Fluorescence emission spectra of directly excited curcumin (λexc = 420 nm). | ||
The fluorescence anisotropy values of curcumin in the hydrogel (rH = 0.29) and magnetogels (rcore/shell = 0.11 and rgold-decorated = 0.25) demonstrate that the introduction of nanoparticles produced an increase in the fluidity of the curcumin microenvironment, which can be associated with the different arrangement in the fibres promoted by the nanoparticles, especially in the system containing the core–shell nanoparticles. Moreover, the high anisotropy values evidence the high affinity of curcumin towards the matrix, even though it can also be related to more compact fibres and a denser network.
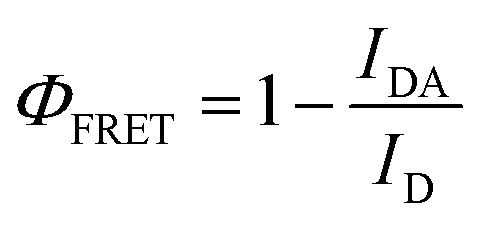
The hydrogelator fluorescence quantum yield was determined through eqn (1), where a value of 0.041 was obtained. The calculated FRET efficiencies (ΦFRET), Förster radius (R0), and donor–acceptor distances (RDA) are presented in Table 5. The introduction of the nanoparticles did not produce a significant change in the distance between the fibre aromatic groups and curcumin in all the nanosystems.
| Nanosystem | Φ FRET | R 0 (nm) | R DA (nm) |
|---|---|---|---|
| H | 0.72 | 2.9 | 2.6 |
| CS | 0.73 | 2.9 | 2.4 |
| D | 0.73 | 2.8 | 2.4 |
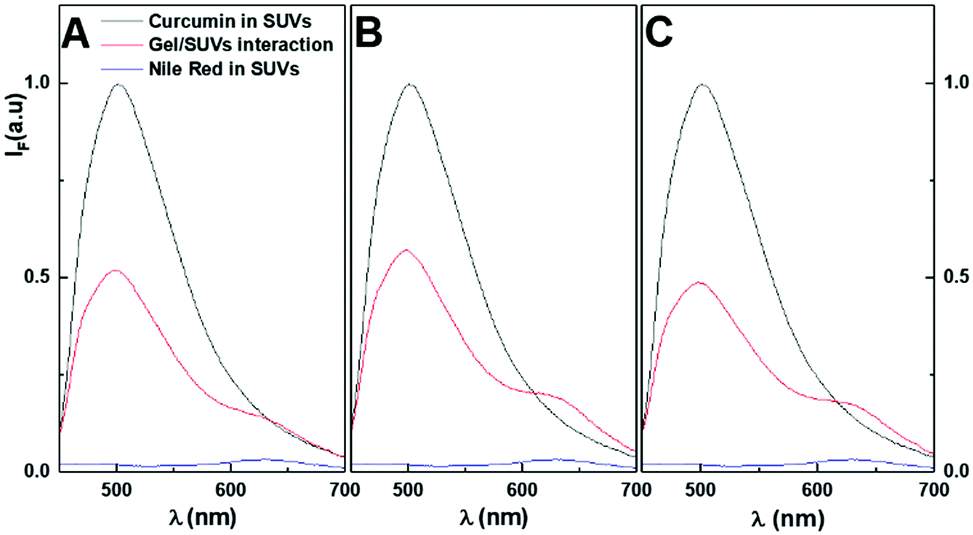 | ||
| Fig. 13 Fluorescence emission spectra (λexc = 420 nm) of SUVs of egg-PC/cholesterol 7:3 containing Nile Red before and after interaction with curcumin-loaded hydrogel (A), magnetogel containing core/shell nanoparticles (B) and magnetogel containing gold-decorated manganese ferrite nanoparticles (C). Emission of curcumin in SUVs is also shown for comparison. | ||
The interaction of the magnetogel/hydrogel with the membrane models can occur either by the penetration of the SUVs into the hydrogel/magnetogel matrix or through drug delivery. In the latter case, the drug incorporated in the gel diffuses into the biomembranes. The gels may have small cavities since no FRET was obtained in the hydrogel/magnetogel matrix, i.e. the biomembrane models did not penetrate the matrix. Nevertheless, the aqueous phase containing the added SUVs showed the curcumin fluorescence emission and FRET to Nile Red about one hour after its addition. The curcumin emission after the interaction was compared to that of curcumin in SUVs for the same final concentration (Fig. 13).
The curcumin emission decreased (compared to SUVs containing only curcumin) and the enhanced Nile Red fluorescence indicate that drug delivery occurred upon interaction between the gel and SUVs. Moreover, the comparison with curcumin inside the hydrogel/magnetogel revealed that curcumin was localized to a more hydrophobic environment (biomembranes). Also, since the maximum emission wavelength of Nile Red after interaction is similar in the SUVs, this suggests that the gel did not interfere with the organization of the biomembranes.
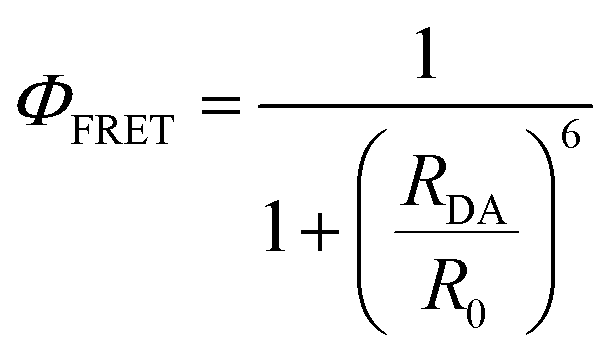
The donor–acceptor (curcumin–Nile Red) distances in the SUVs were calculated with the FRET data using eqn (3)–(6), which were similar in all cases (Table 6).
| Nanosystem | Φ FRET | R 0 (nm) | R DA (nm) |
|---|---|---|---|
| H | 0.46 | 2.6 | 2.7 |
| CS | 0.41 | 2.6 | 2.8 |
| D | 0.49 | 2.8 | 2.6 |
 | (7) |
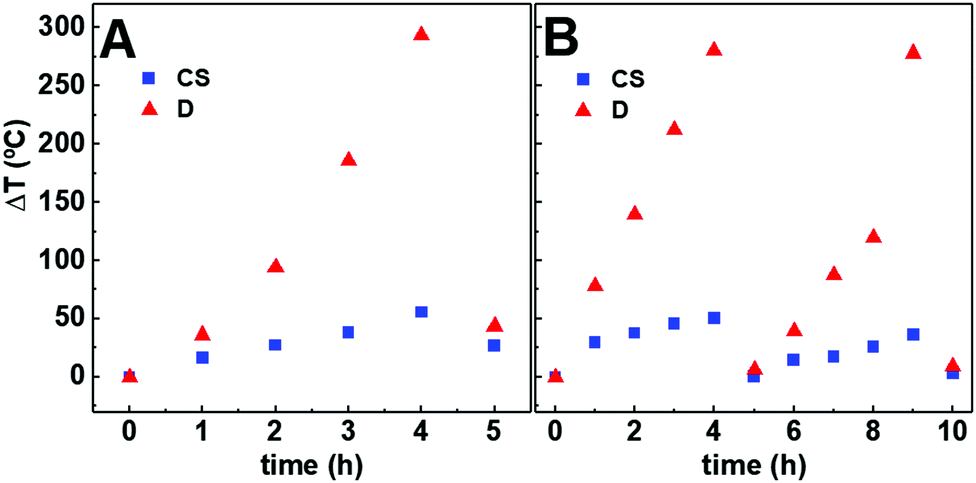 | ||
| Fig. 14 Temperature variation through irradiation of curcumin-loaded magnetogels containing core/shell manganese ferrite/gold nanoparticles (CS) and gold-decorated manganese ferrite nanoparticles (D) at 10 m/m% of nanoparticles. (A) First irradiation cycle. (B) Subsequent cycles for 5 h. | ||
Although quantitative information could not be inferred owing to the many processes involved, the gold-decorated nanoparticles exhibit high potential for photothermia. This may be associated with the high gold nanoparticle concentration and the surface functionalization, which favour the greater accumulation of curcumin around the nanoparticle cluster and higher temperatures since heat will have greater difficulty to dissipate than in the non-functionalized core/shell nanoparticles.
However, thermal degradation of curcumin must not be excluded (which further reduces fluorescence), besides the increased non-radiative relaxation rate by the heating of gold nanoparticles. The thermal degradation of curcumin results in the formation of vanillin, ferulic acid and 4-vynil guaiacol, which are reported to have biological activity (antioxidant and anti-inflammatory).91
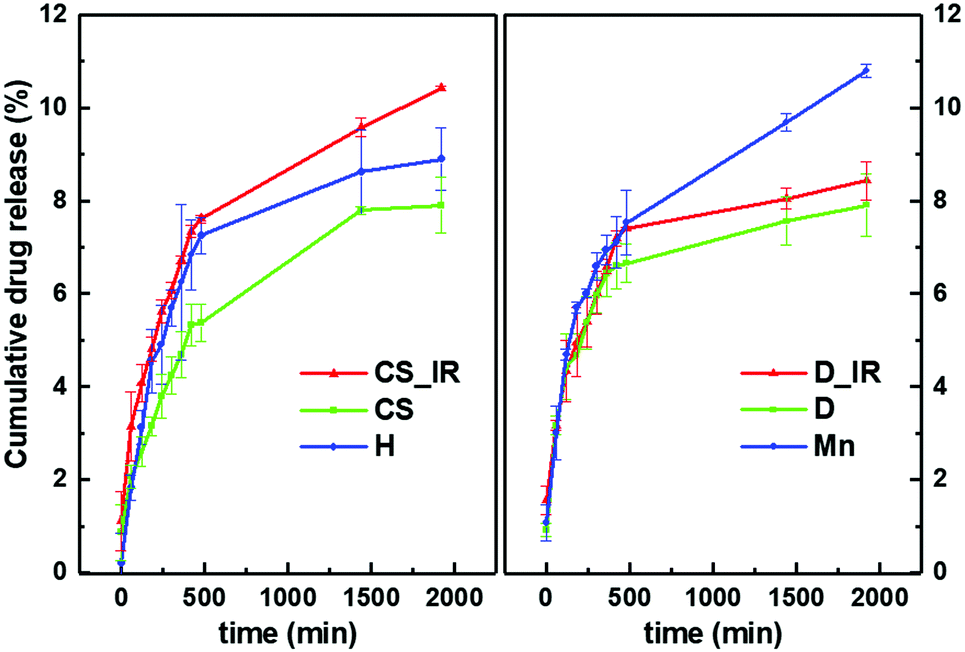 | ||
| Fig. 15 Cumulative drug release profiles (3 replicates) of curcumin (20 μM) in the hydrogel (H), magnetogel containing 10% core/shell MnFe2O4/Au nanoparticles (CS), magnetogel with 10% gold-decorated MnFe2O4 nanoparticles (D), and magnetogel containing 10% non-coated MnFe2O4 nanoparticles (Mn), with (IR) and without incidence of radiation, for a contact area of 3.8 cm2. | ||
Therefore, the results obtained for the non-coated manganese ferrite nanoparticles suggest that the incorporation of nanoparticles opens the hydrogel pores and facilitates drug release, while nanoparticles capable of interacting with the loaded drug (core/shell and gold-decorated nanoparticles) will make its release difficult. The photothermia effect of the core/shell nanoparticles on curcumin release is reflected by the enhanced release compared with the non-irradiated magnetogel. Hydrogel incubation in water at room temperature resulted in a 2% swelling increase, while incubation at 40 °C reduced the hydrogel swelling by 11%. Thus, the drug release may be associated with the heating-induced gel contraction. However, the difference in drug release is relatively small for both the hydrogel and the magnetogel containing non-coated manganese ferrite nanoparticles. This profile is useful since the release by the plasmonic magnetogels, which is even lower compared to the other systems (hydrogels and magnetogels containing magnetic nanoparticles), can be enhanced, making it possible to control the release of curcumin. The interaction of the loaded drug with nanoparticles was more pronounced for the gold-decorated nanoparticles, where surface functionalization may have hindered drug release even with the use of photothermia.
To quantitatively evaluate the effect of the nanoparticles and irradiation on the magnetogel, several mathematical models were fitted to the cumulative drug release profiles and the coefficients of determination were calculated (Table S1 in the ESI†). The first-order model is usually applied to the drug dissolution of water-soluble drugs in porous matrices.92,93 The Hixson–Crowell model describes the remaining concentration at time, t, from a system that changes in surface area and diameter over time, but the initial geometrical form is kept constant.92 The Korsmeyer–Peppas model is applicable to polymeric systems that include both diffusion and erosion of polymer chains, which is described by a rate constant Ks, which includes the structural and geometrical characteristics of the nanosystem, and a coefficient n, which is related with the diffusion mechanism.92–95 The Higuchi model assumes that the drug concentration in the nanosystem is much higher than its solubility, drug diffusion occurs in a single dimension and diffusivity is constant, the drug particle size is much smaller than the nanosystem thickness, effects due to matrix swelling and dissolution are negligible, and that the release environment provides perfect sink conditions, i.e. the solvent volume is much larger than the saturated nanosystem solution.92,94 The Gompertz model adequately describes the release profiles where the drug has good solubility and intermediate release rates.92
Overall, the R2 values (Table S1 in the ESI†) demonstrate that the results are not modelled by the first-order and the Hixson–Crowell model, i.e. the released drug (curcumin) is not water soluble and the hydrogel does not change in diameter with time. The results were best fitted by the Gompertz model (eqn (8)),
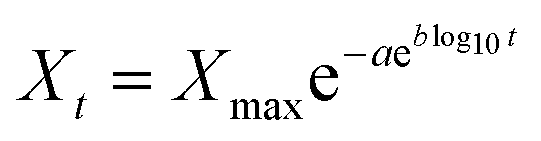 | (8) |
However, the Korsmeyer–Peppas model (eqn (9)) also suggests that the release can be associated with a diffusion-controlled mechanism,
| Ct = C0Kstn | (9) |
The determined kinetic dissolution constants and parameters of these two models (eqn (8) and (9)) are presented in Table 7.
| Korsmeyer–Peppas | Gompertz | ||||
|---|---|---|---|---|---|
| K s | n | X max | a | b | |
| Hydrogel | 0.87 | 0.32 | 10.48 | 36.97 | 1.67 |
| CS | 0.51 | 0.37 | 18.89 | 8.11 | 0.69 |
| CS_IR | 1.99 | 0.21 | 18.89 | 7.25 | 0.76 |
| D | 3.93 | 0.21 | 9.25 | 11.23 | 1.30 |
| D_IR | 3.72 | 0.23 | 9.99 | 13.27 | 1.34 |
| MnFe2O4 | 1.18 | 0.29 | 18.96 | 6.54 | 0.73 |
The Gompertz model parameters demonstrate that the nanoparticles in the magnetogels hampered the release of curcumin comparatively to the hydrogel. This effect may be associated with either the interaction between curcumin and the nanoparticles or the nanoparticles introducing inhomogeneities in the hydrogel matrix, which hinder the drug diffusion through it. Moreover, the irradiated magnetogels demonstrated faster drug release kinetics, where the highest increase in b coefficient was observed for the core/shell or the control with manganese ferrite nanoparticles. On the other hand, the lower increase in b coefficient in the case of gold-decorated nanoparticles can be associated with the surface functionalization not favouring the release of curcumin.
The nanoparticles exhibited an impact on the predicted maximum curcumin dissolution, which can be associated with the perturbation in the free energy difference between the magnetogel matrix and the solution. The core/shell nanoparticles may induce a reduced affinity of curcumin towards the matrix, while the gold-decorated nanoparticles, due to their functionalized surface, may lead to the higher affinity of the hydrophobic drug towards the matrix.
Considering the potential anti-inflammatory activity of these nanosystems, the release profiles of the hydrogelator compound were also assessed with and without irradiation (Fig. S15 and Table S2 in the ESI†). The nanoparticles did not severely affect the release of the hydrogelator. After gelation, a certain amount of free hydrogelator was in equilibrium with the aggregate state in the hydrogel matrix, which was released to the buffer. The release profiles were fitted with the previously described drug release models (Table S3 in the ESI†), showing that they cannot be described by the dissolution of a water-soluble drug or geometrical changes in the gel. The good fitting obtained with the other models suggests that the release mechanism can be described by a diffusion-controlled mechanism. The lack of agreement between the Korsmeyer–Peppas model and the Gompertz model indicates that the nanoparticles and irradiation did not significantly affect the hydrogelator release rate.
The irradiation influence on the release of curcumin towards biomembrane models (SUVs) was assessed by measuring their interaction for 8 h. The hydrogel and magnetogels without irradiation showed similar sigmoidal behaviour (Fig. S16 in the ESI†), while the magnetogels subjected to irradiation exhibited an accelerated accumulation of curcumin in biomembrane models in the first 2 h. Thus, considering that saturation is due to curcumin attaining a partitioning equilibrium between the hydrogel/magnetogel and the limited number of available liposomes, the initial release acceleration (also observed upon release to the buffer) further demonstrates that photothermia may be used as a trigger to burst the release of the encapsulated drug in supramolecular magnetogels.
Conclusions
Considering the affinity of sulphur towards gold, a hydrogelator comprised of naproxen and a thioether, Npx-L-Met-Z-ΔPhe-OH, was synthesized and physicochemically characterized. The hydrogelator was computationally evaluated as a potential anti-inflammatory agent.Magnetogels were successfully obtained for a limit of 10 m/m% of core/shell manganese ferrite/gold or gold-decorated manganese ferrite nanoparticles, above which sedimentation was faster than gelation. The nanoparticles induced an increase in random coil and a decrease in ordered structures, and had no major effect on the chiral stacking of the naproxen moieties.
The nanosystems were demonstrated to be suitable for the encapsulation of a model drug, curcumin. The presence of nanoparticles improved the encapsulation since they induced less polar regions in the hydrogel matrix. Moreover, the interaction of the gels with the biomembrane models (SUVs) showed that curcumin can be delivered, but no penetration of vesicles into the gel matrix occur owing to its high density of fibres and small aqueous cavity size.
The gold-decorated manganese ferrite nanoparticles were more efficient in the generation of heat compared to the core/shell manganese ferrite/gold nanoparticles according to the obtained results using curcumin as a fluorescence thermometer. However, drug release by irradiation was only enhanced in the core/shell nanoparticle-containing magnetogels, although delivery was higher in both irradiated gels compared to the non-irradiated gels.
The superparamagnetic properties of the nanoparticles are suitable for biomedical applications and the elastic properties of the gels fall in the range of soft tissues. Therefore, the magnetogels based on Npx-L-Met-Z-ΔPhe-OH are promising for multimodal cancer therapy by combining controlled drug delivery and photothermia.
Conflicts of interest
There are no conflicts of interest to declare.Acknowledgements
This work was supported by the Portuguese Foundation for Science and Technology (FCT) in the framework of the Strategic Funding of CF-UM-UP (UID/FIS/04650/2019) and CQUM (UID/QUI/00686/2019). FCT, FEDER, PORTUGAL2020 and COMPETE2020 are also acknowledged for funding under research projects PTDC/QUI-QFI/28020/2017 (POCI-01-0145-FEDER-028020) and PTDC/QUI-QOR/29015/2017 (POCI-01-0145-FEDER-029015). The magnetic measurements were supported by projects UTAP-EXPL/NTec/0046/2017, NORTE-01-0145-FEDER-028538 and PTDC/FIS-MAC/29454/2017. Authors gratefully acknowledge Dr L. M. Vieira for carrying out the FTIR measurements at the Infrared Spectroscopy Lab. of the Centre of Physics, Univ. Minho.Notes and references
- P. Kumari, B. Ghosh and S. Biswas, Nanocarriers for cancer-targeted drug delivery, J. Drug Targeting, 2015, 24, 179–191 CrossRef.
- L. Torre, R. Siegel, E. Ward and A. Jemal, Global cancer incidence and mortality rates and trends - An update, Cancer Epidemiol., Biomarkers Prev., 2015, 25, 16–27 CrossRef.
- A. Jemal, F. Bray, M. Center, J. Ferlay, E. Ward and D. Forman, Global cancer statistics, Ca-Cancer J. Clin., 2011, 61, 69–90 CrossRef PubMed.
- Y. A. Lee and M. Hashibe, Tobacco, alcohol, and cancer in low and high income countries, Ann. Glob. Health, 2014, 80, 378–383 CrossRef PubMed.
- N. Berger, Obesity and cancer pathogenesis, Ann. N. Y. Acad. Sci., 2014, 1311, 57–76 CrossRef CAS.
- H. Nagai and Y. Kim, Cancer prevention from the perspective of global cancer burden patterns, J. Thorac. Dis., 2017, 9, 448–451 CrossRef PubMed.
- C. Huang, D. Ju, C. Chang, P. M. Reddy and B. Velmurugan, A review on the effects of current chemotherapy drugs and natural agents in treating non–small cell lung cancer, Biomedicine, 2017, 7, 12–23 CrossRef.
- M. Ma, Y. Kuang, Y. Gao, Y. Zhang, P. Gao and B. Xu, Aromatic-aromatic interactions induce the self-assembly of pentapeptidic derivatives in water to form nanofibers and supramolecular hydrogels, J. Am. Chem. Soc., 2010, 132, 2719–2728 CrossRef CAS.
- S. Sutton, N. L. Campbell, A. I. Cooper, M. Kirkland, W. J. Frith and D. J. Adams, Controlled release from modified amino acid hydrogels governed by molecular size or network dynamics, Langmuir, 2009, 25, 10285–10291 CrossRef CAS.
- E. Caló and V. V. Khutoryanskiy, Biomedical applications of hydrogels: A review of patents and commercial products, Eur. Polym. J., 2015, 65, 252–267 CrossRef.
- H. Vilaça, T. Castro, F. M. G. Costa, M. Melle-Franco, L. Hilliou, I. W. Hamley, E. M. S. Castanheira, J. A. Martins and P. M. T. Ferreira, Self-assembled RGD dehydropeptide hydrogels for drug delivery applications, J. Mater. Chem. B, 2017, 5, 8607–8617 RSC.
- A. Bonhome-Espinosa, F. Campos, I. Rodriguez, V. Carriel, J. Marins, A. Zubarev, J. Duran and M. Lopez-Lopez, Effect of particle concentration on the microstructural and macromechanical properties of biocompatible magnetic hydrogels, Soft Matter, 2017, 13, 2928–2941 RSC.
- Y. Li, F. Wang and H. Cui, Peptide-based supramolecular hydrogels for delivery of biologics, Bioeng. Transl. Med., 2016, 1, 306–322 CrossRef CAS.
- S. Bhattacharya and S. Samanta, Soft-nanocomposites of nanoparticles and nanocarbons with supramolecular and polymer gels and their applications, Chem. Rev., 2016, 116, 11967–12028 CrossRef CAS.
- M. Antman-Passig and O. Shefi, Remote magnetic orientation of 3D collagen hydrogels for directed neuronal regeneration, Nano Lett., 2016, 16, 2567–2573 CrossRef CAS.
- S. Salatin, J. Barar, M. Barzegar-Jalali, K. Adibkia, M. Milani and M. Jelvehgari, Hydrogel nanoparticles and nanocomposites for nasal drug/vaccine delivery, Arch. Pharmacal Res., 2016, 39, 1181–1192 CrossRef CAS.
- A. Z. Cardoso, A. E. A. Alvarez, B. N. Cattoz, P. C. Griffiths, S. M. King, W. J. Frith and D. J. Adams, The influence of the kinetics of self-assembly on the properties of dipeptide hydrogels, Faraday Discuss., 2013, 166, 101–116 RSC.
- G. Fichman and E. Gazit, Self-assembly of short peptides to form hydrogels: Design of building blocks, physical properties and technological applications, Acta Biomater., 2014, 10, 1671–1682 CrossRef CAS.
- O. Ozay, S. Ekici, Y. Baran, N. Aktas and N. Sahiner, Removal of toxic metal ions with magnetic hydrogels, Water Res., 2009, 43, 4403–4411 CrossRef CAS.
- H. Kim, A. Jo, S. Baek, D. Lim, S. Park, S. Cho, J. Chung and J. Yoon, Synergistically enhanced selective intracellular uptake of anticancer drug carrier comprising folic acid-conjugated hydrogels containing magnetite nanoparticles, Sci. Rep., 2017, 7, 1–10 CrossRef.
- A. Hervault and N. Thanh, Magnetic nanoparticle-based therapeutic agents for thermo-chemotherapy treatment of cancer, Nanoscale, 2014, 6, 11553–11573 RSC.
- A. Akbarzadeh, M. Samiei and S. Davaran, Magnetic nanoparticles: Preparation, physical properties, and applications in biomedicine, Nanoscale Res. Lett., 2012, 7, 144 CrossRef.
- S. R. S. Veloso, P. M. T. Ferreira, J. A. Martins, P. J. G. Coutinho and E. M. S. Castanheira, Magnetogels: Prospects and main challenges in biomedical applications, Pharmaceutics, 2018, 10, 145 CrossRef CAS.
- Z. Q. Zhang and S. C. Song, Thermosensitive/superpara-magnetic iron oxide nanoparticle-loaded nanocapsule hydrogels for multiple cancer hyperthermia, Biomaterials, 2016, 106, 13–23 CrossRef CAS.
- B. Issa, I. M. Obaidat, B. A. Albiss and Y. Haik, Magnetic nanoparticles: Surface effects and properties related to biomedicine applications, Int. J. Mol. Sci., 2013, 14, 21266–21305 CrossRef CAS.
- L. I. Cabrera, A. Somoza, J. F. Marco, C. J. Serna and M. P. Morales, Synthesis and surface modification of uniform MFe2O4 (M = Fe, Mn, and Co) nanoparticles with tunable sizes and functionalities, J. Nanopart. Res., 2012, 14, 873 CrossRef.
- M. Colombo, S. Carregal-Romero, M. F. Casula, L. Gutiérrez, M. P. Morales, I. B. Böhm, J. T. Heverhagen, D. Prosperi and W. J. Parak, Biological applications of magnetic nanoparticles, Chem. Soc. Rev., 2012, 41, 4306–4334 RSC.
- M. Das, K. Shim, S. An and D. Yi, Review on gold nanoparticles and their applications, Toxicol. Environ. Health Sci., 2011, 3, 193–205 CrossRef.
- M. H. Carneiro and F. Barbosa, Gold nanoparticles: A critical review of therapeutic applications and toxicological aspects, J. Toxicol. Environ. Health, Part B, 2016, 19, 129–148 Search PubMed.
- Y. Yeh, B. Creran and V. Rotello, Gold nanoparticles: Preparation, properties, and applications in bionano-technology, Nanoscale, 2012, 4, 1871–1880 RSC.
- X. Huang and M. El-Sayed, Gold nanoparticles: Optical properties and implementations in cancer diagnosis and photothermal therapy, J. Adv. Res., 2010, 1, 13–28 CrossRef.
- E. Elsherbini, Laser and radiofrequency-induced hyperthermia treatment via gold-coated magnetic nanocomposites, Int. J. Nanomed., 2011, 6, 2155–2165 CrossRef.
- J. Li, Y. Kuang, Y. Gao, X. Du, J. Shi and B. Xu, d-Amino acids boost the selectivity and confer supramolecular hydrogels of a nonsteroidal anti-inflammatory drug (NSAID), J. Am. Chem. Soc., 2013, 135, 542–545 CrossRef CAS.
- H. Vilaça, G. Pereira, T. G. Castro, B. F. Hermenegildo, J. Shi, T. Q. Faria, N. Micaêlo, R. M. M. Brito, B. Xu, E. M. S. Castanheira, J. A. Martins and P. M. T. Ferreira, New self-assembled supramolecular hydrogels based on dehydropeptides, J. Mater. Chem. B, 2015, 3, 6355–6367 RSC.
- O. Keller, W. E. Keller, G. van Look and G. Wersin, Tert-butoxycarbonylation of amino acids and their derivatives: n-tert-butoxycarbonyl-L-phenylalanine, Org. Synth., 1985, 63, 160 CrossRef CAS.
- H. Vilaça, A. C. L. Hortelão, E. M. S. Castanheira, M. J. R. P. Queiroz, L. Hilliou, I. Hamley, J. A. Martins and P. M. T. Ferreira, Dehydrodipeptide hydrogelators containing naproxen N-capped tryptophan: self-assembly, hydrogel characterization, and evaluation as potential drug nanocarriers, Biomacromolecules, 2015, 16, 3562–3573 CrossRef.
- A. R. O. Rodrigues, J. M. F. Ramos, I. T. Gomes, B. G. Almeida, J. P. Araújo, M. J. R. P. Queiroz, P. J. G. Coutinho and E. M. S. Castanheira, Magnetoliposomes based on manganese ferrite nanoparticles as nanocarriers for antitumor drugs, RSC Adv., 2016, 6, 17302–17313 RSC.
- A. R. O. Rodrigues, J. O. G. Matos, A. M. Nova Dias, B. G. Almeida, A. Pires, A. M. Pereira, J. P. Araújo, M. J. R. P. Queiroz, E. M. S. Castanheira and P. J. G. Coutinho, Development of Multifunctional Liposomes Containing Magnetic/Plasmonic MnFe2O4/Au Core/Shell Nanoparticles, Pharmaceutics, 2019, 11, 10 CrossRef CAS.
- S. Liu, T. Zhu, Y. Wang and Z. Liu, Synthesis and pH Dependent Optical Properties of Gold Nanoparticles Capped with Mercaptopropionic Acid, Mol. Cryst. Liq. Cryst. Sci. Technol., Sect. A, 1999, 337, 245–248 CrossRef CAS.
- D. Perrin and B. Dempsey, Buffers for pH and Metal Ion Control, Chapman and Hall, London, England, 1974 Search PubMed.
- P. Greenspan and S. Fowler, Spectrofluorometric studies of the lipid probe Nile Red, J. Lipid Res., 1985, 26, 781–789 CAS.
- I. and G. Krishnamoorthy, Probing the link between proton transport and water content in lipid membranes, J. Phys. Chem. B, 2001, 105, 1484–1488 CrossRef CAS.
- P. J. G. Coutinho, E. M. S. Castanheira, M. C. Rei and M. E. C. D. R. Oliveira, Nile Red and DCM fluorescence anisotropy studies in C12E7/DPPC Mixed Systems, J. Phys. Chem. B, 2002, 106, 12841–12846 CrossRef CAS.
- G. A. Crosby and J. N. Demas, The measurement of photoluminescence quantum yields. – Review, J. Phys. Chem., 1971, 75, 991–1024 CrossRef CAS.
- S. Fery-Forgues and D. Lavabre, Are fluorescence quantum yields so tricky to measure? A demonstration using familiar stationery products, J. Chem. Educ., 1999, 76, 1260–1264 CrossRef CAS.
- E. P. Kirby and R. F. Steiner, Influence of solvent and temperature upon the fluorescence of indole derivatives, J. Phys. Chem., 1970, 74, 4480–4490 CrossRef CAS.
- B. Valeur, Molecular fluorescence – Principles and Applications, Wiley-VCH, Weinheim, 2001 Search PubMed.
- S. Lin and H. Chu, Fourier transform infrared spectroscopy used to evidence the prevention of β-sheet formation of amyloid β(1–40) peptide by a short amyloid fragment, Int. J. Biol. Macromol., 2003, 32, 173–177 CrossRef CAS.
- H. Fabian and W. Mäntele, Infrared spectroscopy of proteins. in Handbook of Vibrational Spectroscopy ed. J. M. Chalmers and P. R. Griffiths, 2006. Retrieved Nov. 6 2018 DOI:10.1002/0470027320.s8201.
- H. Fabian and C. P. Schultz, Fourier transform infrared spectroscopy in peptide and protein analysis. in Encyclopedia of Analytical Chemistry, ed. R. A. Meyers and C. Schöneich, 2006. Retrieved Nov. 6 2018 DOI:10.1002/9780470027318.a1612.
- B. H. Stuart, Infrared spectroscopy of biological applications: An overview, in Encyclopedia of Analytical Chemistry, ed. R. A. Meyers and C. Schöneich, 2012. Retrieved Nov. 6 2018, from DOI:10.1002/9780470027318.a0208.pub2.
- H. Yang, S. Yang, J. Kong, A. Dong and S. Yu, Obtaining information about protein secondary structures in aqueous solution using Fourier transform IR spectroscopy, Nat. Protoc., 2015, 10, 382–396 CrossRef CAS.
- M. J. Frisch, G. W. Trucks, H. B. Schlegel, G. E. Scuseria, M. A. Robb, J. R. Cheeseman, G. Scalmani, V. Barone, B. Mennucci, G. A. Petersson, H. Nakatsuji, M. Caricato, X. Li, H. P. Hratchian, A. F. Izmaylov, J. Bloino, G. Zheng, J. L. Sonnenberg, M. Hada, M. Ehara, K. Toyota, R. Fukuda, J. Hasegawa, M. Ishida, T. Nakajima, Y. Honda, O. Kitao, H. Nakai, T. Vreven, J. A. Montgomery Jr., J. E. Peralta, F. Ogliaro, M. Bearpark, J. J. Heyd, E. Brothers, K. N. Kudin, V. N. Staroverov, R. Kobayashi, J. Normand, K. Raghavachari, A. Rendell, J. C. Burant, S. S. Iyengar, J. Tomasi, M. Cossi, N. Rega, J. M. Millam, M. Klene, J. E. Knox, J. B. Cross, V. Bakken, C. Adamo, J. Jaramillo, R. Gomperts, R. E. Stratmann, O. Yazyev, A. J. Austin, R. Cammi, C. Pomelli, J. W. Ochterski, R. L. Martin, K. Morokuma, V. G. Zakrzewski, G. A. Voth, P. Salvador, J. J. Dannenberg, S. Dapprich, A. D. Daniels, Ö. Farkas, J. B. Foresman, J. V. Ortiz, J. Cioslowski and D. J. Fox, Gaussian 09, Revision A.02, Gaussian, Inc., Wallingford CT, 2009 Search PubMed.
- D. M. Pereira, G. Correia-da-Silva, P. Valentão, N. Teixeira and P. B. Andrade, Palmitic acid and Ergosta-7,22-dien-3-ol contribute to the apoptotic effect and cell cycle arrest of an extract from Marthasterias glacialis L. in Neuroblastoma cells, Mar. Drugs, 2014, 12, 54–68 CrossRef.
- E. Valeur and M. Bradley, Amide bond formation: beyond the myth of coupling reagents, Chem. Soc. Rev., 2009, 38, 606–631 RSC.
- P. M. T. Ferreira, L. S. Monteiro, G. Pereira and L. Ribeiro, J. Sacramento and L. Silva, Reactivity of dehydroamino acids and dehydrodipeptides towards N-bromosuccinimide: Synthesis of β-bromo- and β,β-dibromodehydroamino acid derivatives and of substituted 4-imidazolidinones, Eur. J. Org. Chem., 2007, 5934–5949 CrossRef CAS.
- M. Velazquez, M. Valero, L. J. Rodríguez, S. M. B. Costa and M. A. Santos, Hydrogen bonding in a non-steroidal anti-inflammatory drug Naproxen, J. Photochem. Photobiol., B, 1995, 29, 23–31 CAS.
- E. Yeargers and L. Augenstein, UV spectral properties of phenylalanine powder, Biophys. J., 1965, 5, 687–696 CrossRef CAS.
- S. R. S. Veloso, C. A. B. Magalhães, A. R. O. Rodrigues, H. Vilaça, M. J. R. P. Queiroz, J. A. Martins, P. J. G. Coutinho, P. M. T. Ferreira and E. M. S. Castanheira, Novel dehydropeptide-based magnetogels containing manganese ferrite nanoparticles as antitumor drug nanocarriers, Phys. Chem. Chem. Phys., 2019, 21, 10377–10390 RSC.
- H. Azizian, Z. Mousavi, H. Faraji, M. Tajik, K. Bagherzadeh, P. Bayat, A. Shafiee and A. Almasirad, Arylhydrazone derivatives of naproxen as new analgesic and anti-inflammatory agents: Design, synthesis and molecular docking studies, J. Mol. Graphics Modell., 2016, 67, 127–136 CrossRef CAS.
- E. Kwizera, E. Chaffin, Y. Wang and X. Huang, Synthesis and properties of magnetic-optical core-shell nanoparticles, RSC Adv., 2017, 7, 17137–17153 RSC.
- M. Y. Rafique, P. Li-Qing, Q. Javed, M. Z. Iqbal, Q. Hong-Mei, M. H. Farooq, G. Zhen-Gang and M. Tanveer, Growth of monodisperse nanospheres of MnFe2O4 with enhanced magnetic and optical properties, Chin. Phys. B, 2013, 22, 107101 CrossRef.
- E. Chaffin, S. Bhana, R. O’Connor, X. Huang and Y. Wang, Impact of core dielectric properties on the localized surface plasmonic spectra of gold-coated magnetic core-shell nanoparticles, J. Phys. Chem. B, 2014, 118, 14076–14084 CrossRef CAS.
- S. Link and M. A. El-Sayed, Size and temperature dependence of the plasmon absorption of colloidal gold nanoparticles, J. Phys. Chem. B, 1999, 103, 4212–4217 CrossRef CAS.
- K.-S. Lee and M. A. El-Sayed, Gold and silver nanoparticles in sensing and imaging: Sensitivity of plasmon response to size, shape, and metal composition, J. Phys. Chem. B, 2006, 110, 19220–19225 CrossRef CAS.
- Y. Bagbi, A. Sarswat, D. Mohan, A. Pandey and P. R. Solanki, Lead and Chromium adsorption from water using L-Cysteine functionalized magnetite (Fe3O4) nanoparticles, Sci. Rep., 2017, 7, 7672 CrossRef.
- T. Sen and A. Patra, Resonance energy transfer from rhodamine 6G to gold nanoparticles by steady-state and time-resolved spectroscopy, J. Phys. Chem. C, 2008, 112, 3216–3222 CrossRef CAS.
- J. Rodriguez-Carvajal, Recent advances in magnetic structure determination by neutron powder diffraction, Phys. B, 1993, 192, 55–69 CrossRef CAS.
- Z. Xu, Y. Hou and S. Sun, Magnetic core/shell Fe3O4/Au and Fe3O4/Au/Ag nanoparticles with tunable plasmonic properties, J. Am. Chem. Soc., 2007, 129, 8698–8699 CrossRef CAS.
- L. Wang, J. Luo, M. M. Maye, Q. Fan, Q. Rendeng, M. H. Engelhard, C. Wang, Y. Lin and C.-J. Zhong, Iron oxide-gold core-shell nanoparticles and thin film assembly, J. Mater. Chem., 2005, 15, 1821–1832 RSC.
- M. Mandal, S. Kundu, S. K. Ghosh, S. Panigrahi, T. K. Sau, S. M. Yusuf and T. Pal, Magnetite nanoparticles with tunable gold or silver shell, J. Colloid Interface Sci., 2005, 286, 187–194 CrossRef CAS.
- J. Liu, H. Zheng, P. Poh, H. Machens and A. Schilling, Hydrogels for engineering of perfusable vascular networks, Int. J. Mol. Sci., 2015, 16, 15997–16016 CrossRef CAS.
- Z. Yang, Y. Hemar, L. Hilliou, E. Gilbert, D. McGillivray, M. Williams and S. Chaieb, Nonlinear behavior of gelatin networks reveals a hierarchical structure, Biomacromolecules, 2015, 17, 590–600 CrossRef.
- A. Dobrynin and J. Carrillo, Universality in nonlinear elasticity of biological and polymeric networks and gels, Macromolecules, 2011, 44, 140–146 CrossRef CAS.
- F. Meng and E. Terentjev, Nonlinear elasticity of semiflexible filament networks, Soft Matter, 2016, 12, 6749–6756 RSC.
- T. Gisler, R. C. Ball and D. A. Weitz, Strain hardening of fractal colloidal gels, Phys. Rev. Lett., 1999, 82, 1064–1067 CrossRef CAS.
- X. Fan, H. Xu, Q. Zhang, D. Xiao, Y. Song and Q. Zheng, Insight into the weak strain overshoot of carbon black filled natural rubber, Polymer, 2019, 167, 109–117 CrossRef CAS.
- M. Chekini, R. Filter, J. Bierwagen, A. Cunningham, C. Rockstuhl and T. Bürgi, Fluorescence enhancement in large-scale self-assembled gold nanoparticle double arrays, J. Appl. Phys., 2015, 118, 1–10 CrossRef.
- T. Nakamura and S. Hayashi, Enhancement of dye fluorescence by gold nanoparticles: Analysis of particle size dependence, Jpn. J. Appl. Phys., 2005, 44, 6833–6837 CrossRef CAS.
- J. Chen, Y. Jin, N. Fahruddin and J. Zhao, Development of gold nanoparticle-enhanced fluorescent nanocomposites, Langmuir, 2013, 29, 1584–1591 CrossRef CAS.
- P. A. Presta and M. J. Stillman, Circular dichroism (CD) spectroscopy, in Encyclopedia of Inorganic and Bioinorganic Chemistry, ed. R. A. Scott, 2011. Retrieved Jan. 5 2019 DOI:10.1002/9781119951438.eibc0308.
- A. Urbach, Circular dichroism spectroscopy in the undergraduate curriculum, J. Chem. Educ., 2010, 87, 891–893 CrossRef CAS.
- N. Greenfield, Applications of circular dichroism in protein and peptide analysis, TrAC, Trends Anal. Chem., 1999, 18, 236–244 CrossRef CAS.
- S. M. Kelly, T. J. Jess and N. C. Price, How to study proteins by circular dichroism, Biochim. Biophys. Acta, 2005, 1751, 119–139 CrossRef CAS PubMed.
- K. L. Morris, L. Chen, A. Rodger, D. J. Adams and L. C. Serpell, Structural determinants in a library of low molecular weight gelators, Soft Matter, 2015, 11, 1174–1181 RSC.
- J. Smit, Magnetic Properties of Materials, McGraw Hill, New York, USA, 1971 Search PubMed.
- C. Chignell, P. Bilskj, K. Reszka, A. Motten, R. Sik and T. Dahl, Spectral and photochemical properties of curcumin, Photochem. Photobiol., 1994, 59, 295–302 CrossRef CAS.
- G. Hungerford, E. M. S. Castanheira, M. E. C. D. Real Oliveira, M. G. Miguel and H. Burrows, Monitoring ternary systems of C12E5/water/tetradecane via the fluorescence of solvato-chromic probes, J. Phys. Chem. B, 2002, 106, 4061–4069 CrossRef CAS.
- V. Amendola, R. Pilot, M. Frasconi, O. Maragò and M. Iatì, Surface plasmon resonance in gold nanoparticles: a review, J. Phys.: Condens. Matter, 2017, 29, 1–48 CrossRef CAS.
- K. Dahl, R. Biswas and M. Maroncelli, The photophysics and dynamics of diphenylbutadiene in alkane and perfluoroalkane solvents, J. Phys. Chem. B, 2003, 107, 7838–7853 CrossRef CAS.
- T. Esatbeyoglu, K. Ulbrich, C. Rehberg, S. Rohn and G. Rimbach, Thermal stability, antioxidant, and anti-inflammatory activity of curcumin and its degradation product 4-vinyl guaiacol, Food Funct., 2015, 6, 887–893 RSC.
- S. Dash, P. N. Murthy, L. Nath and P. Chowdhury, Kinetic modelling on drug release from controlled drug delivery systems, Acta Pol. Pharm., 2010, 67, 217–223 CAS.
- J. Ghitman, R. Stan, A. Ghebaur, S. Cecoltan, E. Vasile and H. Iovu, Novel PEG-modified hybrid PLGA-vegetable oils nanostructured carriers for improving performances of indomethacin delivery, Polymers, 2018, 10, 579 CrossRef.
- S. Kini, D. Bahadur and D. Panda, Mechanism of anti-cancer activity of benomyl loaded nanoparticles in multidrug resistant cancer cells, J. Biomed. Nanotechnol., 2015, 11, 877–889 CrossRef CAS PubMed.
- M. Joy, S. Iyengar, J. Chakraborty and S. Ghosh, Layered double hydroxide using hydrothermal treatment: morphology evolution, intercalation and release kinetics of diclofenac sodium, Front. Mater. Sci., 2017, 11, 395–408 CrossRef.
Footnote |
| † Electronic supplementary information (ESI) available: Detailed synthesis procedure; 1H NMR spectra; UV-vis absorption spectra; critical aggregation assays; docking in COX-1; details of XRD analysis; mechanical spectra; FTIR spectra; EDX spectra; nanoparticle size histograms from TEM; FFT of TEM image; spectral overlap for FRET assays; deduction of eqn (7); data of drug release assays. See DOI: 10.1039/c9tb01900f |
| This journal is © The Royal Society of Chemistry 2020 |