
Investigation of biodistribution and tissue penetration of PEGylated gold nanostars and their application for photothermal cancer treatment in tumor-bearing mice†
Chao-Cheng
Chen‡
 a,
Deng-Yuan
Chang‡
a,
Jia-Je
Li
a,
Hui-Wen
Chan
a,
Jenn-Tzong
Chen
b,
Chih-Hsien
Chang
b,
Ren-Shyan
Liu
acde,
C. Allen
Chang
afg,
Chuan-Lin
Chen
*a and
Hsin-Ell
Wang
*a
a,
Deng-Yuan
Chang‡
a,
Jia-Je
Li
a,
Hui-Wen
Chan
a,
Jenn-Tzong
Chen
b,
Chih-Hsien
Chang
b,
Ren-Shyan
Liu
acde,
C. Allen
Chang
afg,
Chuan-Lin
Chen
*a and
Hsin-Ell
Wang
*a
aNational Yang-Ming University, Department of Biomedical Imaging and Radiological Sciences, Taipei, Taiwan. E-mail: clchen2@ym.edu.tw; hewang@ym.edu.tw
bInstitute of Nuclear Energy Research, Taoyuan, Taiwan
cNational Yang-Ming University, Institute of Clinical Medicine, Taipei, Taiwan
dNational Comprehensive Mouse Phenotyping and Drug Testing Center, Molecular and Genetic Imaging Core/Taiwan Mouse Clinic, Taipei, Taiwan
eCheng Hsin General Hospital, Department of Nuclear Medicine, Taipei, Taiwan
fNational Yang-Ming University, Department of Biotechnology and Laboratory Science in Medicine, Taipei, Taiwan
gNational Yang-Ming University, Molecular Imaging Research Center (MIRC), Taipei, Taiwan
First published on 13th November 2019
Abstract
Gold nanostars (AuNSs), with unique physicochemical properties, are thought to be a promising agent for photothermal therapy (PTT). In this study, we prepared PEGylated gold nanostars (pAuNSs) using the HEPES-reduction method. The high photothermal conversion efficiency (∼80%) and photothermal stability of pAuNSs were demonstrated in vitro and in vivo. 111In–DTPA–pAuNSs were prepared as a radioactive surrogate for the biodistribution studies of pAuNSs. In both microSPECT/CT images and the biodistribution study, the tumor-to-muscle (T/M) ratio reached a maximum at 24 h post intravenous injection of 111In–DTPA–pAuNSs. The high linear correlation between the 111In radioactivity and the gold content in the tumors (R2 0.86–0.99) indicated that 111In–DTPA–pAuNSs were appropriate for noninvasively tracking pAuNSs in vivo after systemic administration. Histological examination after silver enhancement staining clearly illustrated that the accumulated pAuNSs in the tumors were mainly located on the luminal surface of vessels. The mice bearing a SKOV-3 xenograft exhibited remarkable therapeutic efficacy with negligible organ damage after receiving pAuNS-mediated photothermal therapy. Our findings suggested that pAuNSs, together with their radioactive surrogate 111In–DTPA–pAuNSs, are promising for applications in image-guided photothermal therapy.
Introduction
Nanoparticle (NP)-based agents have a major impact on medical applications because of their versatile functions such as drug delivery, disease diagnosis and treatment.1,2 Recently, nanoparticle-mediated photothermal therapy (NP-PTT) has been stated as a potential strategy to generate heat in deep tumors.3 Compared with organic fluorescent dyes applied in PTT such as indocyanine green, IR-783, and IR-780, nanoparticles (NPs) exhibit better photostability4 and tumor targeting ability owing to the enhanced permeability and retention effect.5 Inorganic nanoparticle agents such as gold nanoshell, gold nanorod and upconversion nanoparticles with distinctive surface plasmon resonance in the near-infra-red (NIR) region (650–900 nm) have been widely exploited in PTT for cancer treatment.6–9 To date, AuroLase® therapy, using PEGylated gold nanoshells (Auroshell®) developed by Nanospectra, is the first NP-PTT for head and neck cancer treatment in clinical trials (NCT00848042, http://www.clinicaltrials.gov).Gold nanostars (AuNSs), gold nanostructures with a core and many sharp branches, have attracted attention as substrates for surface-enhanced Raman scattering10,11 and as photothermal agents for PTT owing to their high conversion efficiency upon exposure to an NIR laser.12–15 In addition to the cetyltrimethylammonium bromide (CTAB)-capping and seed-mediated method,16–18 the group led by Tabata first reported the 2-[4-(2-hydroxyethyl)-1-piperazinyl]ethanesulfonic acid (HEPES) reduction method for the preparation of AuNSs.19 In addition, a study of Xie et al. reported that the yield of AuNSs in gram-quantity could be obtained using the HEPES-reduction method.20
Several in vitro and in vivo studies have demonstrated that PTT could be a promising strategy or adjuvant therapy for cancer treatment.21,22 For clinical applications, it is crucial to utilize imaging modalities to monitor the distribution of photothermal agents after administration into the body, known as image-guided PTT. Computed tomography (CT), magnetic resonance imaging (MRI), positron emission tomography (PET) and single photon emission computed tomography (SPECT) are powerful tools for clinical cancer diagnosis, treatment planning, and therapeutic efficacy determination.23 Considering the optical and chemical properties of gold nanoparticles (AuNPs), several groups have demonstrated using optical, photoacoustic imaging or CT for tracking the in vitro and in vivo distribution of AuNPs.24–26 However, the penetration depth in tissue limits the application of optical imaging for non-invasive diagnosis in the clinic.27 The main advantage of using radiotracers in combination with PET or SPECT is the highest sensitivity compared with other imaging modalities.28,29 Indium-111 (111In, T1/2 = 2.81 days) is readily available, and has a straightforward labeling procedure for preclinical and clinical applications. In addition, a radionuclide itself like 131I or radionuclide pairs like 99mTc/188Re, 111In/90Y, 86Y/90Y, and 68Ga/177Lu can be applied in the theranostic approach.30 In our previous studies, we have successfully incorporated a radionuclide, either iodine-123/13131 or indium-111,32 into a 20 nm cetuximab-conjugated gold nanoparticle for investigating its pharmacokinetics and biodistribution using microSPECT/CT.
In the present study, we prepared PEGylated gold nanostars (pAuNSs) by the HEPES-reduction method, labeled with In-111 to afford the radioactive surrogate, 111In–DTPA–pAuNS, and investigated the photothermal properties. The biological characteristics of pAuNSs in the human ovarian SKOV-3 tumor-bearing mice were studied. The penetration of pAuNSs in tumors and liver tissue was determined by silver enhancement staining. Damage to the main organs and the therapeutic efficacy in tumor-bearing mice were also evaluated after pAuNS-mediated PTT.
Results
Preparation and characterization of gold nanostars
The physicochemical characterization of AuNSs is summarized in Fig. 1 and Table S1 (ESI†). All the three types of AuNSs exhibited strong absorption in the first biological window (NIR-I, 700–950 nm).33 The maximum absorption (λmax) of the bare AuNSs located at 790 ± 2.1 nm, while that of pAuNSs and DTPA–pAuNSs shifted to 823 ± 3.2 and 817 ± 3.5 nm, respectively (Fig. 1A). The mean particle sizes of the bare AuNSs, pAuNSs, and DTPA–pAuNSs were 46.8 ± 3.6, 50.5 ± 2.1 and 51.4 ± 2.5 nm, respectively (Fig. 1B). The zeta potential of AuNSs (−37.41 ± 0.24 mV) increased after PEGylation (pAuNSs, −8.69 ± 2.06 mV), but decreased after being further conjugated with DTPA (DTAP–pAuNSs, −15.76 ± 1.45 mV) (Fig. 1C). The morphology of AuNSs, pAuNSs, and DTPA–pAuNSs as three-dimensional branched gold nanomaterials was clearly visualized in the transmission electron microscope (TEM) images (Fig. 1D–F). Surface modification with PEG may separate the nanoparticles, prevent interparticle agglomeration of AuNSs (Fig. 1D–F) and narrow down the particle size distribution (Table S1, ESI†). In addition, the in vitro stability studies revealed that AuNSs after PEGylation exhibited better stability (Fig. S1, ESI†). After being stored at 4 °C for more than one month, the shift of the absorption peak and the particle size were more noticeable in AuNSs compared to in PEGylated AuNSs (both pAuNSs and DTPA–pAuNSs). | ||
| Fig. 1 Physicochemical characterization of AuNSs. (A) Ultraviolet-visible-near infrared (UV-Vis-NIR) absorption spectra of gold nanostars (AuNSs), PEGylated gold nanostars (pAuNSs) and DTPA-conjugated pAuNSs (DTPA–pAuNSs) in deionized (DI) water. (B) Size distribution determined by dynamic light scattering (DLS) of AuNSs, pAuNSs, and DTPA–pAuNSs in DI water. (C) Zeta potential using a NanoPlus nanoparticle analyzer for AuNSs, pAuNSs, and DTPA–pAuNSs in DI water. (D–F) Transmission electron microscopy (TEM) images of AuNSs (D), pAuNSs (E) and DTPA–pAuNSs (F). (Scale bar = 50 nm.) | ||
Characterization and the in vitro stability of indium-111 labeled pAuNSs (111In–DTPA–pAuNSs)
111In-labeled pAuNSs (111In–DTPA–pAuNSs) were prepared with a high radiolabeling efficiency (90.3 ± 1.5%), radiochemical purity (>95%) (Fig. 2A and B) and an acceptable radiochemical yield (71.0 ± 2.1%). The λmax of 111In–DTPA–pAuNSs (820 nm) was comparable to that of pAuNSs (823 nm, Fig. 2C), indicating that no apparent aggregation of pAuNSs occurred during radiolabeling. After 72 h incubation in normal saline (4 and 37 °C) and fetal bovine serum (37 °C), the radiochemical purities of 111In–DTPA–pAuNSs remained >90% under all conditions (Fig. 2D), demonstrating high in vitro stability of 111In–DTPA–pAuNSs. | ||
| Fig. 2 Characterization of 111In-labeled PEGylated gold nanostars (111In–DTPA–pAuNSs). The results of instant thin-layer chromatograms (iTLC) of (A) the reaction mixture, and (B) the purified 111In–DTPA–pAuNSs using 0.5 M sodium citrate (pH 5.0) as the developing agent. (C) The UV-Vis-NIR spectra of pAuNSs, DTPA–pAuNSs and 111In–DTPA–pAuNSs. (D) In vitro stability assay of 111In–DTPA–pAuNS incubated in normal saline (NS) at either 4 °C or 37 °C, and in fetal bovine serum (FBS) at 37 °C. The radiochemical purity of 111In–DTPA–pAuNSs at the designated time points was analyzed by the iTLC method. | ||
Photothermal characterization of pAuNSs
The temperature elevation of deionized (DI) water containing different concentrations of pAuNSs was recorded upon exposure to a 793 nm NIR laser at a power of 1.0 W cm−2 (Fig. 3A). Heat generation of pAuNSs in DI water is remarkable and concentration dependent. After laser exposure (793 nm, 1.0 W cm−2) for 10 min, the temperature difference of DI water was only 1.1 °C, while that of pAuNS-containing solutions ranged from 6.4 to 28.2 °C as the concentration increased from 2 to 50 ppm. After three on/off cycles of laser irradiation (1.0 W cm−2), the reproducible temperature elevation (Fig. 3B) indicated the excellent photothermal stability of pAuNSs. The UV-Vis-NIR spectrum of pAuNSs remained identical before and after three cycles of 793 nm laser irradiation (Fig. 3C). | ||
| Fig. 3 In vitro photothermal characterization of pAuNSs. (A) The temperature elevation of 2 mL of DI water containing different concentrations (0–50 ppm) of pAuNSs during exposure to a 793 nm NIR laser at 1.0 W cm−2 for 10 min. (B) The temperature elevation of 2 mL pAuNS solution (20 ppm) upon three sequential cycles of laser exposure. (C) UV-Vis-NIR spectra of the pAuNS solution before and after three cycles of NIR laser irradiation. | ||
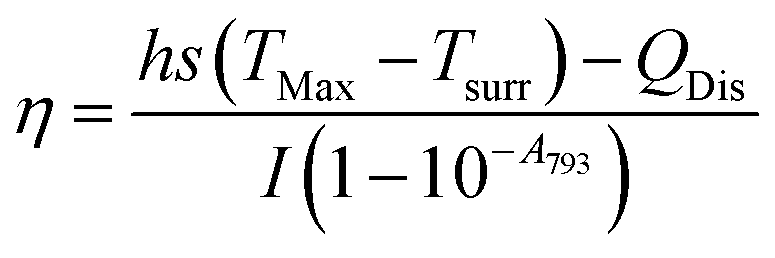
The temperature elevation profile of pAuNSs at a concentration of 20 ppm upon exposure to a 793 nm laser (1.0 W cm−2) is shown in Fig. 4A. The estimated photothermal conversion efficiency (η) value was 80.5% for pAuNSs. The heat flux mass density and the temperature elevation speed of pAuNSs, 1.77 × 10⁴ (W g−1) and 1.37 × 10⁵ (°C s−1), respectively, were derived following the study of Liu et al.34 (see the ESI† for calculations in detail). These results suggested that pAuNSs exhibited a high photothermal conversion efficiency and good photostability after repeated laser exposure, and fulfill the requirements of the agent for NIR-triggered hyperthermia using a 793 nm laser.9,35
 | ||
| Fig. 4 (A) The temperature elevation profile of pAuNSs at a concentration of 20 ppm upon exposure to a 793 nm laser (1.0 W cm−2). The laser was turned off after the temperature of the solution became steady. The solution temperature was continuously recorded until it declined to ambient temperature. (B) The linear correlation between the time in the cooling period and −ln(θ) was derived from the results of (A). | ||
Cytotoxicity of pAuNSs and pAuNS-mediated photothermal therapy (PTT) in SKOV-3 cell culture
A negligible to slight cytotoxicity of pAuNSs (at a concentration up to 200 ppm) to SKOV-3 cells was observed after co-incubation for 48 h (Fig. 5A). The relative cell viability slightly decreased to 84.7 ± 2.4% after incubation with 200 ppm of pAuNSs for 48 h.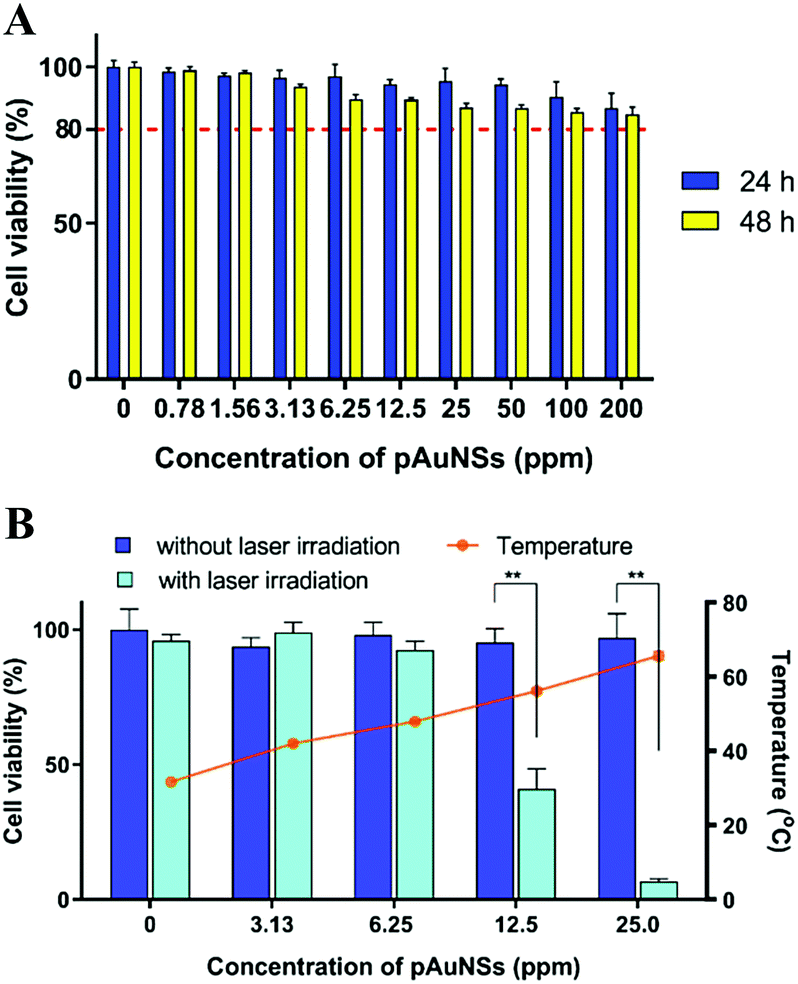 | ||
| Fig. 5 Relative cell viability of SKOV-3 cells. (A) Cells incubated with different concentrations of pAuNSs for 24 or 48 h. (B) Cells incubated with pAuNSs (0, 3.13, 6.25, 12.5 and 25.0 ppm) and subjected to 793 nm NIR laser irradiation (1.0 W cm−2) for 6 min. The cell viability was determined by MTT assay at 24 h post irradiation. ** indicates p < 0.01. | ||
To evaluate the efficacy of in vitro pAuNS-mediated PTT, the cells were immediately subjected to 793 nm laser irradiation for 6 min after incubation with different concentrations (from 0 to 25 ppm) of pAuNSs (Fig. 5B). In the absence of pAuNSs, laser irradiation increased the temperature from 28 °C to 31.7 ± 0.8 °C and did not induce cell death. In combination with laser irradiation, the cell viability decreased with the increasing pAuNS concentration. At a pAuNS concentration of 25.0 ppm, the temperature increased dramatically to 65.7 ± 1.2 °C and the cell viability decreased from 95.8 ± 2.4% (laser irradiation alone, without pAuNSs) to 6.7 ± 1.0%. More apparent cell death was noticed at 48 h post laser irradiation. The cell viability reduced from 99.0 ± 3.8% (without pAuNSs) to 79.7 ± 7.0% at a pAuNS concentration as low as 3.13 ppm (Fig. S2, ESI†).
Pharmacokinetic study of the 111In–DTPA–pAuNSs in SKOV-3 tumor-bearing mice
Four SKOV-3 human ovarian tumor-bearing mice received a single injection of 111In–DTPA–pAuNSs (10 mg kg−1, 67.9 ± 2.2 μCi) via the tail vein. The time-radioactivity profile of 111In–DTPA–pAuNSs in the blood exhibited a biphasic pattern (Fig. 6), in which a slow elimination phase appeared subsequent to a rapid distribution phase. The pharmacokinetic parameters were estimated using WinNonLin software and are summarized in Table 1. The half-life of the distribution phase (T1/2α) and the elimination phase (T1/2β) was 2.06 h and 446.1 h, respectively. The area under the curve (AUC) and the clearance rate (CL) of 111In–DTPA–pAuNSs were estimated to be 118.66%ID h per mL and 0.84 h, respectively. | ||
| Fig. 6 The time-radioactivity profile of 111In–DTPA–pAuNSs in the blood after intravenous injection in SKOV-3 tumor-bearing mice. The value at each time point was expressed as a percentage of the injected dose per milliliter (%ID per mL) and represented the mean ± SD (n = 4). | ||
| Parameters | 111In–DTPA–pAuNSs (unit) |
|---|---|
| AUC, area under the curve; T1/2α, distribution half-life; T1/2β, elimination half-life; CL, the clearance rate. | |
| AUC | 118.66 (%ID h per mL) |
| T 1/2α | 2.06 (h) |
| T 1/2β | 446.1 (h) |
| CL | 0.84 (mL h−1) |
MicroSPECT/CT imaging and the biodistribution study
The microSPECT/CT images of mice after administration of 111In–DTPA–pAuNSs via the tail vein were presented in both a transaxial and coronal view (Fig. 7). Significant uptake of 111In–DTPA–pAuNSs by the mononuclear phagocyte system (MPS) resulted in high liver and spleen accumulation at 1 h post injection (p.i.), and retained until 72 h p.i. The short distribution half-life of pAuNSs (2.06 h) accounted for the decreased background of mice at 24 h p.i. and thereafter. | ||
| Fig. 7 MicroSPECT/CT images of SKOV-3 tumor-bearing mice after iv injection of 111In–DTPA–pAuNSs. Most of the radioactivity was retained in the MPS-contained organs such as the liver and spleen. (L, liver; white arrow, and SKOV-3 tumor). | ||
The radioactivity distribution after intravenous (iv) administration of 111In–DTPA–pAuNSs in SKOV-3 tumor-bearing mice is summarized in Table 2. Remarkable radioactivity was retained in the MPS-obtained organs (i.e., the liver and spleen), consistent with the observation in microSPECT/CT imaging. The liver uptake increased from 10.95 ± 1.65%ID per g at 1 h p.i. to 17.48 ± 2.59%ID per g at 72 h p.i. The spleen uptake was initially 14.43 ± 2.59%ID per g at 1 h p.i., slightly increased to 16.91 ± 4.42%ID per g at 4 h p.i., and then slowly declined to 10.13 ± 2.57%ID per g at 72 h p.i. It is worth mentioning that the skin accumulation was 2.35 ± 0.96%ID per g at 1 h p.i., peaked at 4 h p.i. (3.67 ± 0.42%ID per g), and declined to 1.38 ± 0.18%ID per g at 72 h p.i. Remarkable radioactivity accumulation in urine was noticed at 1 h p.i. The radioactive species in urine was analyzed using the radio-TLC method (data no shown). The radioactivity mainly located in the origin and also in the solvent front of the TLC plate which indicated that the small size 111In–DTPA–pAuNSs and their radioactive metabolites were excreted mainly via urinary elimination. The highest tumor accumulation (1.78 ± 0.48%ID per g) was observed at 1 h p.i. and then declined slowly to 0.53 ± 0.28%ID per g at 72 h p.i. The tumor-to-muscle (T/M) ratios determined individually from the results of biodistribution and based on the value of the region of interest (ROI) of the microSPECT images are shown in Fig. 8, and both reached a maximum at 24 h p.i.
| Organs | Radioactivity distribution | ||||
|---|---|---|---|---|---|
| 1 h | 4 h | 24 h | 48 h | 72 h | |
| Expressed as the percentage of the injected dose per gram of an organ (%ID per g). Each value represents mean ± SD (n = 4). S.I: small intestine; L.I: large intestine; B.M: bone marrow; T/M: tumor-to-muscle ratio. | |||||
| Blood | 20.54 ± 3.27 | 13.91 ± 1.45 | 0.19 ± 0.03 | 0.12 ± 0.05 | 0.08 ± 0.02 |
| Heart | 3.75 ± 0.42 | 1.28 ± 0.23 | 0.22 ± 0.04 | 0.22 ± 0.05 | 0.19 ± 0.04 |
| Lungs | 9.99 ± 1.98 | 4.22 ± 0.47 | 0.39 ± 0.09 | 0.35 ± 0.10 | 0.31 ± 0.05 |
| Liver | 10.95 ± 1.65 | 10.63 ± 0.61 | 13.53 ± 1.30 | 15.30 ± 3.36 | 17.48 ± 2.59 |
| Stomach | 1.39 ± 0.18 | 0.93 ± 0.33 | 0.34 ± 0.04 | 0.29 ± 0.07 | 0.30 ± 0.10 |
| S.I. | 7.69 ± 1.96 | 5.88 ± 0.90 | 4.58 ± 0.55 | 4.00 ± 1.45 | 3.89 ± 1.69 |
| L.I. | 1.12 ± 0.15 | 0.87 ± 0.19 | 0.40 ± 0.13 | 0.40 ± 0.09 | 0.37 ± 0.09 |
| Pancreas | 1.17 ± 0.34 | 0.51 ± 0.07 | 0.12 ± 0.07 | 0.14 ± 0.06 | 0.14 ± 0.03 |
| Spleen | 14.43 ± 2.59 | 16.91 ± 4.42 | 11.02 ± 1.23 | 11.13 ± 2.14 | 10.13 ± 2.57 |
| Kidneys | 6.53 ± 0.54 | 4.29 ± 0.64 | 2.33 ± 0.17 | 2.21 ± 0.34 | 1.68 ± 0.05 |
| Muscle | 0.72 ± 0.18 | 0.36 ± 0.08 | 0.10 ± 0.02 | 0.08 ± 0.04 | 0.10 ± 0.02 |
| Skin | 2.35 ± 0.96 | 3.67 ± 0.42 | 2.75 ± 0.48 | 1.91 ± 0.60 | 1.35 ± 0.18 |
| Urine | 145.8 ± 24.5 | 39.78 ± 7.10 | 3.03 ± 1.23 | 3.12 ± 1.93 | 3.80 ± 0.90 |
| Feces | 0.09 ± 0.07 | 0.60 ± 0.15 | 0.62 ± 0.58 | 0.47 ± 0.15 | 0.16 ± 0.05 |
| B.M. | 2.85 ± 1.10 | 1.82 ± 0.60 | 1.56 ± 0.32 | 1.66 ± 0.30 | 1.15 ± 0.39 |
| Bone | 0.28 ± 0.09 | 0.14 ± 0.04 | 0.04 ± 0.01 | 0.08 ± 0.04 | 0.07 ± 0.02 |
| Bladder | 1.20 ± 0.18 | 0.52 ± 0.11 | 0.17 ± 0.02 | 0.16 ± 0.01 | 0.14 ± 0.02 |
| Ovarian | 2.26 ± 0.53 | 1.07 ± 0.19 | 0.51 ± 0.11 | 0.71 ± 0.14 | 0.56 ± 0.07 |
| Uterus | 2.43 ± 0.81 | 1.84 ± 0.34 | 0.39 ± 0.26 | 0.79 ± 0.54 | 0.68 ± 0.30 |
| Tumors | 1.78 ± 0.48 | 1.74 ± 1.17 | 0.99 ± 0.38 | 0.57 ± 0.39 | 0.53 ± 0.28 |
| T/M | 2.62 ± 1.01 | 5.63 ± 5.37 | 10.18 ± 3.22 | 7.32 ± 5.07 | 5.67 ± 3.46 |
 | ||
| Fig. 8 The tumor-to-muscle (T/M) ratio obtained from the results of the biodistribution study and derived from the images of microSPECT/CT after iv injection of 111In–DTPA–pAuNSs in SKOV-3 tumor-bearing mice. Both microSPECT/CT and biodistribution showed similar profiles of the T/M ratio, peaked at 24 h, and then slowly declined till 72 h p.i. | ||
Quantification of the gold concentration in SKOV-3 tumors
The gold concentration in the tumor tissues obtained in the biodistribution study was estimated based on the tumor radioactivity and the specific activity of 111In–DTPA–pAuNSs. The gold concentration in the tumor tissues was 4.17 ± 1.13, 4.09 ± 2.73, 2.33 ± 0.90, 1.33 ± 0.91, and 1.24 ± 0.65 ppm at 1, 4, 24, 48, and 72 h p.i., respectively. The gold content in the same tumor samples was also determined by ICP-MS after the complete decay of radioactivity. The results derived from the biodistribution study were highly linearly correlated to those determined by ICP-MS. The correlation factor (R2) ranged from 0.87 to 0.99 within 72 h p.i. (Fig. 9). In addition, an apparent decrease of the slope of linear regression, from 0.99 at 1 h p.i. to 0.25 at 72 h p.i., was noticed. These phenomena suggested that the 111In–DTPA conjugation on pAuNSs, though stable in vitro, might be slowly degraded from the surface of pAuNSs after accumulation in tumor tissues. | ||
| Fig. 9 Correlation between the gold concentration in tumor tissues derived from the results of the biodistribution study and determined by ICP-MS at 1, 4, 24, 48 and 72 h p.i. Each point represented the tumor sample from one mouse. | ||
Tissue penetration of pAuNSs in SKOV-3 tumor and liver tissues
Silver enhancement staining was performed to display the penetration of pAuNSs in tumor and liver tissues obtained from the sacrificed SKOV-3 tumor-bearing mice at 24 h p.i. The black spots indicated the location of the deposited pAuNSs in tissues (Fig. 10). pAuNSs deposited mainly close to the blood vessels in tumors. However, in liver tissues, pAuNSs were found in both the luminal surface of the blood vessel and the interstitial space. | ||
| Fig. 10 Microscopic images of pAuNS distribution in SKOV-3 tumor (A and C) and liver tissues (B and D) after silver enhancement staining. SKOV-3 tumor-bearing mice were sacrificed at 24 h post pAuNS injection. White arrows indicated the silver enhanced gold nanostars. The blood vessel was stained with CD31 monoclonal antibody (brown). The nuclei and the cytoplasm were counterstained with haematoxylin (blue) and eosin (red), respectively. Scale bar: A and D, 50 μm; B, 100 μm; C, 10 μm. | ||
Therapeutic efficacy of pAuNS-mediated PTT in SKOV-3 tumor-bearing mice
Mice in the laser irradiation alone group and the pAuNS-mediated PTT group received repeated laser irradiation (1.0 W cm−2) at 24 h post-injection of normal saline and pAuNSs (10 mg Au per kg), respectively (Fig. 11A). The surface temperature in the tumor region was monitored using a thermography camera (FLIR Systems E8, FLIR® Systems, Inc., Wilsonville, OR, USA) before and after laser irradiation. A remarkable increase of temperature in the tumor region was noticed in mice of the pAuNS-mediated PTT group. The surface temperature reached ∼55 °C after 3 min laser irradiation, while that of the laser irradiation alone mice only increased to ∼40 °C (Fig. 11B). The surface temperature in the tumor region repeatedly exceeded >55 °C in pAuNS-mediated PTT mice after each cycle of laser irradiation, indicating high photostability of pAuNSs in vivo. The tumors of all pAuNS-mediated PTT mice apparently shrunk to almost being undetectable at 12 days after treatment. However, two of the five mice exhibited tumor recurrence on day 20. In contrast, tumors in mice of the control, pAuNSs alone, and laser irradiation alone groups kept growing after treatment (Fig. 12 and Fig. S3, ESI†). | ||
| Fig. 11 (A) Thermal imaging of mice in laser irradiation alone and pAuNS-mediated PTT groups. (B) The surface temperature of the tumor region in laser irradiation alone and pAuNS-mediated PTT mice. Repeated 3 min laser irradiation with a 2 min time interval was performed on mice at 24 h after iv injection of normal saline or pAuNSs (10 mg kg−1). | ||
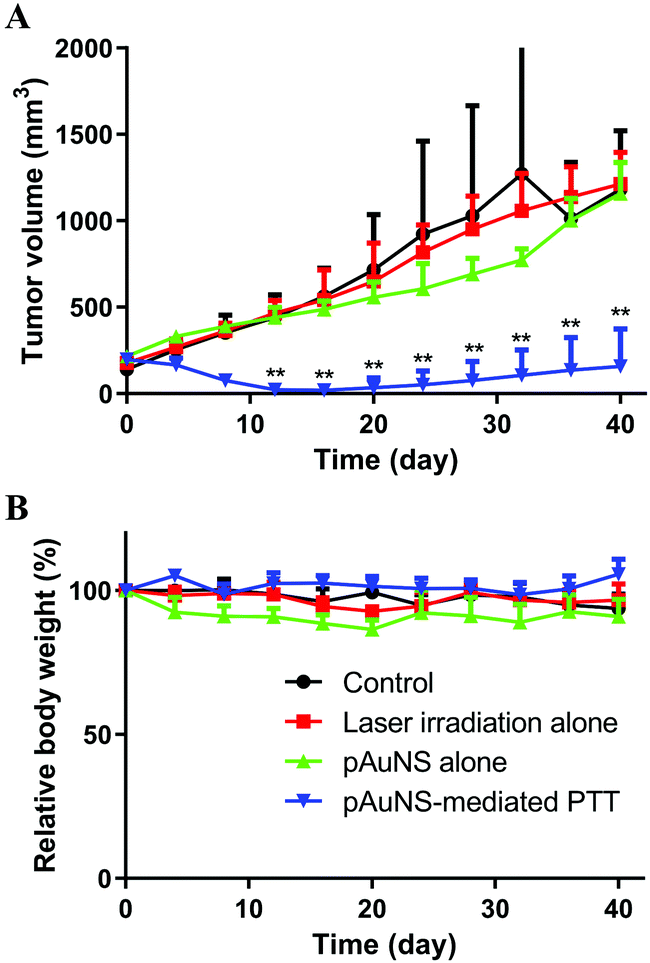 | ||
| Fig. 12 (A) Therapeutic efficacy of pAuNS-mediated PTT in SKOV-3 tumor-bearing mice was evaluated based on the tumor burden till 40 days after treatment. (B) The body weight of every mouse in all groups was measured every 4 days till 40 days after treatment to investigate the acute toxicity. Each value represents mean ± SD (n = 5). ** indicates p < 0.01 compared to the control group. | ||
The potential toxicity of pAuNSs to critical organs, including the liver, spleen, and kidneys, was examined by histological hematoxylin and eosin (H&E) staining on day 0, day 7 and day 28. No noticeable histological change could be found in the liver, spleen, and kidney tissues of all groups before and after treatment (Fig. 13).
 | ||
| Fig. 13 H&E staining of the liver, spleen and kidney tissues obtained from mice before and after being treated with normal saline (control), laser irradiation alone, pAuNSs alone and pAuNS-mediated PTT on day 7 and day 28. | ||
Discussion
Various types and sizes of gold nanomaterials have been applied as photothermal agents for NP-PTT.36,37 Consistent with previous studies of AuNSs,34,38 our studies demonstrated that the pAuNSs prepared using the HEPES-reduction method also exhibited a high photothermal conversion efficiency (η). The η value of our pAuNSs was calculated to be 80.5% upon exposure to the 793 nm laser, much higher than that of the other shapes of gold nanomaterials (Table S2, ESI†).34,39–43 In addition, the high photothermal conversion ability of pAuNSs was retained after repeated laser irradiation in vitro and in vivo, indicating high photothermal stability of pAuNSs and suggested that repeated photothermal treatment after a single pAuNSs injection is feasible.Halide ions are able to chemisorb on the surface of gold nanoparticles to form Au–X bonds. In previous studies, radioactive iodine (i.e., I-125 and I-131) was directly labeled on gold nanomaterials and used as imaging agents.34,44,45 However, in vivo deiodination limited the application of radioactive iodine-labeled gold nanomaterials in the medical field.46,47 Radiometals are valuable materials for clinical medical diagnosis and for cancer treatment. DTPA and its derivatives are pervasive metal chelators and have been used in several FDA-approved radiopharmaceuticals such as 99mTc–DTPA for renal scan, OctreoScan™ (111In–DTPA–octreotide) for neuroendocrine tumor imaging and Zevalin® (90Y–Ibritumomab) for non-Hodgkin's lymphoma treatment.48,49 In the present study, DTPA-conjugated pAuNSs were successfully prepared and used for radioisotope labeling. The physicochemical characteristics of pAuNSs were retained after surface modification with DTPA and radiolabeling with In-111. In addition to nuclear imaging, MRI is another powerful imaging modality for clinical disease diagnosis. DTPA also chelates with non-radioactive metals such as gadolinium (Gd) for the application of MRI imaging.50 The group led by T. J. Meade reported a remarkable proton relaxation enhancement using gold nanostars as a carrier for Gd(III)-labeled DNA.51
The results of biodistribution of pAuNSs after iv administration displayed the typical in vivo behaviour of nanoparticles. The macrophage and Kupffer cells’ uptake accounted for the high accumulation of most nanoparticles in the liver and spleen.52,53 Besides the MPS-contained organs, Sykes et al. reported a significant NP accumulation in the skin in a dose-dependent manner after systemic administration.54 The correlation between the liver and spleen uptake and skin accumulation of AuNPs was validated by elemental analysis. In this study, we also observed an apparent skin accumulation after iv administration of 111In–DTPA–pAuNSs. The photothermal agents deposited in the skin might result in unnecessary skin damage during laser irradiation. In the present study, the accumulation of 111In–DTPA–pAuNS in the skin peaked at 4 h p.i. and then declined slowly. The results of both the biodistribution study and microSPECT/CT imaging revealed the highest tumor uptake at 1 h p.i. The uptake in tumors and muscle both decreased with time to reach the maximum T/M ratio at 24 h p.i. Considering the tumors, skin accumulation and the T/M ratio, we decided to perform pAuNS-mediated PTT at 24 h after iv injection of pAuNSs in tumor-bearing mice, and obtained an acceptable therapeutic efficacy.
The gold concentration in tumor tissues derived from the results of biodistribution was highly linearly correlated with that determined by ICP-MS at each time point. The decreasing slope of linear regression (from 0.99 at 1 h p.i. to 0.25 at 72 h p.i.) may be attributed to the degradation of the surface modification of pAuNSs (i.e., PEG and PEG-DTPA conjugate). The unconjugated PEG and PEG-DTPA would be eliminated from tumors, but the AuNSs still remained in tumors. The thiourea bond formation between isothiocyanate and the primary amine was commonly used to conjugate protein or antibody with drugs or radioisotopes (i.e., Zevalin®).55,56 However, it has been reported that apparent hydrolysis of the thiourea bond upon incubation at 37 °C was found compared with other crosslinks such as NHS ester-based conjugation.57 In addition, Borzenkov and co-workers revealed that the temperature and the incubation environment would alter the stability of PEG after conjugation on the surface of gold nanostars through the gold–thiol bond.58
Liu et al. have reported the size effect of gold nanostars on the penetration in tumor tissues by high-resolution darkfield microscopy. 30 nm gold nanostars penetrated into the interstitial space after leaking from the tumor blood vessels, while 60 nm gold nanostars were restricted mainly to the tumor vessels.34 In this study, the images of silver enhancement staining of tumor tissues demonstrated that most pAuNSs (50.5 ± 2.1 nm) localized at the luminal surface of the tumor blood vessel. It is considered that significant heat generation was induced at the tumor vessels during laser irradiation, caused severe damage to the vascular structure and resulted in tumor shrinkage after pAuNS-mediated PTT.
Conclusions
In the present study, we successfully prepared 50 nm PEGylated AuNSs with high photothermal conversion efficiency and photothermal stability. The distribution of pAuNSs, based on the findings with a radioactive surrogate 111In–DTPA–pAuNSs, after intravenous administration, was mainly in the MPS-contained organs and partly in tumors in mice bearing a SKOV-3 xenograft. The results of microscopic imaging revealed that pAuNSs located around the tumor vessels. The tumor bearing mice exhibited remarkable therapeutic efficacy with negligible organ damage after receiving pAuNS-mediated photothermal therapy.Materials and methods
Materials
Hydrogen tetrachloroaurate(III) hydrate (HAuCl4·3H2O) was purchased from Alfa Aesar (Haverhill, MA, USA). Thiol–poly(ethylene glycol)–amine (SH–PEG5000–NH2, Mn 5000), thiol–poly(ethylene glycol) (SH–PEG6000, Mn 6000), and 2-[4-(2-hydroxyethyl)-1-piperazinyl]ethanesulfonic acid (HEPES) were purchased from Sigma-Aldrich Corp. (St. Louis, MO, USA). S-2-(4-Isothiocyanatobenzyl)-diethylenetriamine pentaacetic acid (p-SCN–Bn–DTPA) was purchased from Macrocyclics (Dallas, TX, USA). 111In–InCl3 solution was obtained from the Institute of Nuclear Energy Research (Taoyuan, Taiwan). Cell culture dishes, flasks, and plasticware were purchased from Corning Inc. (Corning, NY, USA). Fetal bovine serum and the cell culture medium were purchased from HyClone (Logan, UT, USA). A silver enhancer kit for microscopy (Sr-01-01) was purchased from Cytodiagnostics (Burlington, Ontario, Canada).Preparation of gold nanostars (AuNSs)
Gold nanostars (AuNSs) were synthesized by the HEPES reduction method reported in previous studies with slight modifications.19,20 As illustrated in Fig. 14, 0.6 mL of 20 mM HAucl4 solution was uniformly dispersed in 30 mL of HEPES buffer (0.14 M, pH 7.4), and kept at 30 °C for an hour to obtain crude AuNS solution with dark green color. | ||
| Fig. 14 Flow chart of the preparation of gold nanostars (AuNSs), PEGylated AuNSs (pAuNSs), DTPA-conjugated pAuNSs (DTPA–pAuNSs) and indium-111 labeled pAuNSs (111In–DTPA–pAuNSs). | ||
For the preparation of PEGylated gold nanostars (pAuNSs), SH–PEG6000 was added to the AuNS solution at a PEG![[thin space (1/6-em)]](https://www.rsc.org/images/entities/char_2009.gif) :Au molar ratio of 1.2. The mixture was stirred at 25 °C for one hour and then was purified by centrifugation at 13000g for 15 min. The pellet was re-suspended with deionized (DI) water. After three cycles of purification, the final product PEGylated AuNSs (pAuNSs) was characterized and stored at 4 °C until further use.
:Au molar ratio of 1.2. The mixture was stirred at 25 °C for one hour and then was purified by centrifugation at 13000g for 15 min. The pellet was re-suspended with deionized (DI) water. After three cycles of purification, the final product PEGylated AuNSs (pAuNSs) was characterized and stored at 4 °C until further use.
For the preparation of DTPA-conjugated pAuNSs (DTPA–pAuNSs), SH–PEG5000–NH2 was added to the AuNS solution at a PEG:Au molar ratio of 0.3 and incubated at ambient temperature for one hour. The mixture was then centrifuged at 13000g for 15 min, and the pellet was re-suspended with 0.1 M carbonate solution (pH 8.5) and conjugated with 0.5 mg of p-SCN–Bn–DTPA at 60 °C for 2 h. After cooling to room temperature, SH–PEG6000 was added to the DTPA-conjugated gold nanostars at a PEG:Au molar ratio of 0.9. After 1 h incubation at 25 °C, the mixture was purified by centrifugation. The final product DTPA–pAuNSs was kept at 4° until further use.
Characterization of gold nanostars
The absorbance spectra of gold nanomaterials in DI water were recorded by an Agilent 8453 UV-Visible Spectrophotometer (Agilent Technologies, CA, USA). The concentration of pAuNSs in DI water was analyzed by an Agilent 7500ce inductively coupled plasma mass spectrometer (ICP-MS, Agilent Technologies, CA, USA) and correlated to the UV/VIS/NIR absorption. The particle size and morphology were respectively determined and examined by a HORIBA SZ-100 nanoparticle analyzer (Kyoto, Japan) and a JEM-2000EXII transmission electron microscope (TEM, Tokyo, Japan). The zeta potential of the gold nanomaterials in DI water was measured using a NanoPlus Nanoparticle analyzer (Particulate systems Norcross, GA, USA).Preparation and characterization of indium-111 labeled pAuNSs (111In–DTPA–pAuNSs)
As illustrated in Fig. 14, the required radioactive indium-111 was incubated with 20 μg of DTPA–pAuNSs in 0.1 M HEPES buffer (pH 4.5) at 30 °C for 15 min. 10 mM EDTA solution was added for chelating unlabeled In-111. The mixture was purified by centrifugation at 13000g for 15 min, and the pellet was resuspended in normal saline. After three cycles of purification, the radiochemical purity was determined by instant thin-layer chromatography (iTLC) using 0.5 M sodium citrate (pH 5.0) as a developing agent.
In vitro stability of 111In–DTPA–pAuNSs
The in vitro stability of 111In–DTPA–pAuNSs was expressed as radiochemical purity in solution after storage. Purified 111In–DTPA–pAuNSs were incubated in both normal saline (4 and 37 °C) and fetal bovine serum (FBS, 37 °C) for 1, 4, 8, 24 and 72 h. The radiochemical purity under various conditions was assayed by the iTLC method in duplicate.Photothermal characterization of pAuNSs
Two milliliters of DI water containing different concentrations of pAuNSs was placed in a quartz cuvette and then irradiated with a 793 nm NIR laser at 1.0 W cm−2 for 10 min. The temperature elevation of various solutions upon exposure to laser irradiation was measured by a digital thermometer using a thermocouple. The photostability of pAuNSs (at 20 ppm) was studied by three sequential cycles of 793 nm laser irradiation on and off for 10 min.The photothermal conversion efficiency (η) of pAuNSs was calculated based on the previous report.59 In brief, 2 mL of purified pAuNS solution at 20 ppm or DI water was placed in a quartz cuvette. After the top of the cuvette was sealed, the solution was exposed to a 793 nm NIR laser at a power of 1.0 W cm−2, and the temperature was measured by using a digital thermometer. The laser was turned off when the temperature of the solution reached a plateau, and the temperature was continuously recorded until the temperature of the solution returned to room temperature.
The η value of pAuNSs was calculated according to the following formula:
 | (1) |
Cytotoxicity of pAuNSs in SKOV-3 cell culture
SKOV-3 human ovarian carcinoma cell line was maintained in McCoy's 5A modified medium containing 10% FBS under standard conditions (37 °C and 5% CO2). Five thousands of SKOV-3 cells were pre-seeded in a 96-well plate. The medium was replaced by a fresh medium containing different concentrations (from 0 to 200 ppm) of pAuNSs. After 24 or 48 h incubation, the cells were washed twice with PBS, and then the MTT-containing medium (0.5 mg mL−1) was added. At 4 h post incubation, the purple crystal was dissolved by using dimethyl sulfoxide. The absorbance at 570 nm in each well was analyzed by a TECAN Sunrise ELISA reader (Mannedorf, Switzerland).In vitro pAuNS-mediated photothermal therapy (PTT)
Five thousands of SKOV-3 cells were pre-seeded in a 96-well plate. The medium was replaced by a medium containing 0, 3.125, 6.25, 12.5 or 25 ppm of pAuNSs, and the cells were subsequently exposed to a 793 nm NIR laser at a power of 1.0 W cm−2 for 6 min. After irradiation, the medium was replaced by a fresh medium, and the cells were incubated at 37 °C for another 24 h. The relative cell viability was analyzed by MTT assay.Establishment of the SKVO-3 human ovarian bearing mouse model
Female BALB/cAnN.Cg-Foxn1nu/CrlNarl (5–6 weeks old) were obtained from the National Laboratory Animal Center (Taipei, Taiwan, ROC). Mice were housed in cages under controlled environmental conditions, with food and water being provided ad libitum. Two million SKOV-3 cells suspended in 0.1 mL of serum-free medium was inoculated subcutaneously into the right flank of the mice. After 3 weeks inoculation, the tumor volume reached 150–200 mm3, and the mice were used for the subsequent in vivo studies. All animal studies were approved by the Institutional Animal Care and Use Committee (IACUC) of National Yang-Ming University (IACUC no. 1040509r and 1070211).Pharmacokinetic study of 111In–DTPA–pAuNSs in SKOV-3 tumor-bearing mice
Four SKOV-3 tumor-bearing mice received 67.9 ± 2.2 μCi of 111In–DTPA–pAuNSs in 0.1 mL normal saline through the tail vein (10 mg Au per kg of mice body weight). The blood samples were collected from the tail at 0.17, 0.5, 1, 2, 4, 8, 12, 16, 20, 24, 36 and 48 h post administration and subjected to radioactivity measurement using a Wallace 1470 Wizard Gamma counter (GMI, Inc., Ramsey, Minnesota, USA). Data were expressed as the percentage injected dose per milliliter (%ID per mL). The pharmacokinetic parameters were estimated by WinNonlin software (version 6.1; Pharsight Corp., Mountain View, California, USA) using the two-compartment model.MicroSPECT/CT and the biodistribution study of 111In–DTPA–pAuNSs in SKOV-3 tumor-bearing mice
To investigate the distribution of 111In–DTPA–pAuNSs in tumor-bearing mice, microSPECT/CT scan and a biodistribution study was performed. MicroSPECT/CT images of mice were obtained at 1, 24, 48 and 72 h post iv injection of 111In–DTPA–pAuNSs (815.5 ± 36.1 μCi/0.1 mL) by a microPET/SPECT/CT scanner (FLEX Triumph Regular FLEX X-OCT, SPECT CZT 3 Head System, Gamma Medica, Northridge, California, USA). Each tumor-bearing mouse was anesthetized with 1–2% isoflurane (w/v) in 2 L oxygen in the prone position. The images were reconstructed by using an ordered-subset expectation maximization algorithm (five iterations and eight subsets).For the biodistribution study, twenty SKOV-3 tumor-bearing mice were randomly divided into five groups. Each mouse was administrated 67.9 ± 2.2 μCi of 111In–DTPA–pAuNSs in 0.1 mL normal saline through the tail vein (10 mg Au per kg of mice body weight). At the designated time points (1, 4, 24, 48 and 72 h), four mice were sacrificed, and the tissues/organs of interest were harvested and weighed, and the radioactivity of each tissue/organ was counted by the gamma counter. The accumulation of 111In–DTPA–pAuNSs in each tissue or organ was expressed as the percentage injected dose per gram (%ID per g).
Determination of the gold concentration in SKOV-3 tumors using ICP-MS
After the radioactivity decayed to the background, SKOV-3 tumors were digested following the procedures reported by Das and Ting.60 Briefly, the tumor tissue (0.2 g) was placed in 2 mL of 1:1 concentrated (conc.) HNO3:DI water (v/v) and sonicated at 60 °C for 5 min. Then, 3 mL of conc. HNO3 was added to the mixture and sonicated at 60 °C for another 10 min. Lastly, 2 mL of conc. HCl was added and sonicated at 60 °C for another 5 min. The digestion mixture was cooled down to ambient temperature and diluted to 10 mL with deionized water. The content of gold was analyzed by an Agilent 7500ce ICP-MS system. The gold concentration obtained from the biodistribution results and the ICP-MS measurement were linearly fitted and statistically correlated.
Tissue penetration of pAuNSs in the liver and SKOV-3 tumors using silver enhancement staining
To validate the tissue penetration of pAuNSs in the liver and tumor tissues, tumor-bearing mice were sacrificed at 24 h post injection (p.i.) of pAuNS. Both the liver and tumor tissues were harvested, fixed with 4% phosphate-buffered paraformaldehyde and then embedded in paraffin. The procedure of silver enhancement staining was done following the manufacturer's instructions and the procedures are detailed in our previous study.32 The cell nuclei and the cytoplasm were stained by hematoxylin and eosin (H&E) staining. The tumor vasculature was stained by CD31 staining (ab28364, Abcam, USA) following the manufacturer's instructions. The stained slides were examined by an Olympus BX61 microscope.In vivo therapeutic efficacy of pAuNS-mediated PTT
When the SKOV-3 tumor volume reached 150–200 mm3 (day 0), twenty SKOV-3 tumor-bearing mice were randomly divided into four groups: control, pAuNSs alone, laser irradiation alone and pAuNS-mediated PTT (n = 5 in each group). For the group of pAuNSs alone and pAuNS-mediated PTT, pAuNS in normal saline were injected through the tail vein at a dose of 8.0 mg kg−1 of body weight, while normal saline was intravenously injected in the control and the laser irradiation alone group. At 24 h p.i., the tumors in the laser irradiation alone and pAuNS-mediated PTT groups were exposed to the 793 nm laser (1.0 W cm−2) for 3 minutes, with a 2 minute break, and then exposed for another 3 minutes. Afterward, the antitumor effect was evaluated by monitoring the tumor volume and the body weight every four days until day 40. The tumor volume was measured by a caliper and calculated as volume = 0.5 × length (mm) × width (mm2). Humane endpoint euthanasia was performed as the tumor volume reached 1500 mm3 or the body weight loss was more than 15%.Damage to the main organs
To examine the possible damage to the main organs, two mice per group were sacrificed at day 0, 7, and 28. The main organs including the liver, spleen, and kidneys were dissected, fixed with 4% phosphate-buffered paraformaldehyde and embedded in paraffin for H&E staining. The stained slides were examined using an Olympus BX61 microscope.Statistics
Statistical analysis was performed using unpaired Student's t-test. All results were expressed as mean ± SD. The value of p < 0.05 indicated statistically significant differences.Conflicts of interest
There are no conflicts to declare.Acknowledgements
This work was supported by Grants from the Ministry of Science and Technology of Taiwan (MOST 104-2314-B-010-039-MY3, MOST 107-2314-B-010-038 and MOST 108-2314-B-010-004). We thank the staff of the Institute of Nuclear Energy Research (Taoyuan, Taiwan), who kindly provided the radionuclide and excellent technical assistance. We also thank the Taiwan Animal Consortium (MOST 108-2319-B-001-003)—Molecular and Genetic Imaging Center, which is funded by the Ministry of Science and Technology (MOST) of Taiwan for technical support in microSPECT/CT animal study. We thank the Instrumentation Center at National Tsing Hua University for the ICP-MS analysis.Notes and references
- D. Peer, J. M. Karp, S. Hong, O. C. Farokhzad, R. Margalit and R. Langer, Nat. Nanotechnol., 2007, 2, 751–760 CrossRef CAS.
- J. Xie, S. Lee and X. Chen, Adv. Drug Delivery Rev., 2010, 62, 1064–1079 CrossRef CAS.
- U. Chitgupi, Y. Qin and J. F. Lovell, Nanotheranostics, 2017, 1, 38–58 CrossRef.
- D. Hu, J. Zhang, G. Gao, Z. Sheng, H. Cui and L. Cai, Theranostics, 2016, 6, 1043–1052 CrossRef CAS PubMed.
- M. Zheng, P. Zhao, Z. Luo, P. Gong, C. Zheng, P. Zhang, C. Yue, D. Gao, Y. Ma and L. Cai, ACS Appl. Mater. Interfaces, 2014, 6, 6709–6716 CrossRef CAS PubMed.
- C. Loo, A. Lowery, N. Halas, J. West and R. Drezek, Nano Lett., 2005, 5, 709–711 CrossRef CAS PubMed.
- X. Huang, I. H. El-Sayed, W. Qian and M. A. El-Sayed, J. Am. Chem. Soc., 2006, 128, 2115–2120 CrossRef CAS PubMed.
- S. L. Lin, Z. R. Chen and C. A. Chang, Nanotheranostics, 2018, 2, 243–257 CrossRef PubMed.
- X. Ai, J. Mu and B. Xing, Theranostics, 2016, 6, 2439–2457 CrossRef CAS.
- F. Hao, C. L. Nehl, J. H. Hafner and P. Nordlander, Nano Lett., 2007, 7, 729–732 CrossRef CAS.
- C. G. Khoury and T. Vo-Dinh, J. Phys. Chem. C, 2008, 2008, 18849–18859 CrossRef.
- H. Yuan, A. M. Fales and T. Vo-Dinh, J. Am. Chem. Soc., 2012, 134, 11358–11361 CrossRef CAS PubMed.
- H. Yuan, C. G. Khoury, C. M. Wilson, G. A. Grant, A. J. Bennett and T. Vo-Dinh, Nanomedicine, 2012, 8, 1355–1363 CrossRef CAS.
- M. Borzenkov, A. Maattanen, P. Ihalainen, M. Collini, E. Cabrini, G. Dacarro, P. Pallavicini and G. Chirico, ACS Appl. Mater. Interfaces, 2016, 8, 9909–9916 CrossRef CAS.
- S. Wang, P. Huang, L. Nie, R. Xing, D. Liu, Z. Wang, J. Lin, S. Chen, G. Niu, G. Lu and X. Chen, Adv. Mater., 2013, 25, 3055–3061 CrossRef CAS.
- S. Chen, Z. L. Wang, J. Ballato, S. H. Foulger and D. L. Carroll, J. Am. Chem. Soc., 2003, 125, 16186–16187 CrossRef CAS.
- C. H. Kuo and M. H. Huang, Langmuir, 2005, 21, 2012–2016 CrossRef CAS.
- Z. Kereselidze, V. H. Romero, X. G. Peralta and F. Santamaria, J. Visualized Exp., 2012, 59, e3570 Search PubMed.
- A. Habib, M. Tabata and Y. G. Wu, Bull. Chem. Soc. Jpn., 2005, 78, 262–269 CrossRef CAS.
- J. Xie, J. Y. Lee and D. I. C. Wang, Chem. Mater., 2007, 19, 2823–2830 CrossRef CAS.
- S. Wang, X. Ma, X. Hong, Y. Cheng, Y. Tian, S. Zhao, W. Liu, Y. Tang, R. Zhao, L. Song, Z. Teng and G. Lu, ACS Nano, 2018, 12, 662–670 CrossRef CAS.
- S. Wang, Y. Tian, W. Tian, J. Sun, S. Zhao, Y. Liu, C. Wang, Y. Tang, X. Ma, Z. Teng and G. Lu, ACS Nano, 2016, 10, 8578–8590 CrossRef CAS.
- J. Rieffel, U. Chitgupi and J. F. Lovell, Small, 2015, 11, 4445–4461 CrossRef CAS.
- D. Xi, S. Dong, X. Meng, Q. Lu, L. Meng and J. Ye, RSC Adv., 2012, 2, 12515–12524 RSC.
- L. A. Austin, M. A. Mackey, E. C. Dreaden and M. A. El-Sayed, Arch. Toxicol., 2014, 88, 1391–1417 CrossRef CAS.
- A. K. Oyelere, P. C. Chen, X. Huang, I. H. El-Sayed and M. A. El-Sayed, Bioconjugate Chem., 2007, 18, 1490–1497 CrossRef CAS.
- D. E. Lee, H. Koo, I. C. Sun, J. H. Ryu, K. Kim and I. C. Kwon, Chem. Soc. Rev., 2012, 41, 2656–2672 RSC.
- M. M. Khalil, J. L. Tremoleda, T. B. Bayomy and W. Gsell, Int. J. Mol. Imaging, 2011, 2011, 796025 Search PubMed.
- M. A. Pysz, S. S. Gambhir and J. K. Willmann, Clin. Radiol., 2010, 65, 500–516 CrossRef CAS.
- A. Bockisch, Eur. J. Nucl. Med. Mol. Imaging, 2011, 38(Suppl 1), S1–S3 CrossRef PubMed.
- H. W. Kao, Y. Y. Lin, C. C. Chen, K. H. Chi, D. C. Tien, C. C. Hsia, M. H. Lin and H. E. Wang, Bioorg. Med. Chem. Lett., 2013, 23, 3180–3185 CrossRef CAS.
- H. W. Kao, Y. Y. Lin, C. C. Chen, K. H. Chi, D. C. Tien, C. C. Hsia, W. J. Lin, F. D. Chen, M. H. Lin and H. E. Wang, Nanotechnology, 2014, 25, 295102 CrossRef.
- E. Hemmer, N. Venkatachalam, H. Hyodo, A. Hattori, Y. Ebina, H. Kishimoto and K. Soga, Nanoscale, 2013, 5, 11339–11361 RSC.
- Y. Liu, J. R. Ashton, E. J. Moding, H. Yuan, J. K. Register, A. M. Fales, J. Choi, M. J. Whitley, X. Zhao, Y. Qi, Y. Ma, G. Vaidyanathan, M. R. Zalutsky, D. G. Kirsch, C. T. Badea and T. Vo-Dinh, Theranostics, 2015, 5, 946–960 CrossRef CAS.
- P. Rai, S. Mallidi, X. Zheng, R. Rahmanzadeh, Y. Mir, S. Elrington, A. Khurshid and T. Hasan, Adv. Drug Delivery Rev., 2010, 62, 1094–1124 CrossRef CAS.
- S. Hwang, J. Nam, S. Jung, J. Song, H. Doh and S. Kim, Nanomedicine, 2014, 9, 2003–2022 CrossRef CAS.
- Y. Liu, B. M. Crawford and T. Vo-Dinh, Immunotherapy, 2018, 10, 1175–1188 CrossRef CAS.
- C. Bi, J. Chen, Y. Chen, Y. Song, A. Li, S. Li, Z. Mao, C. Gao, D. Wang, H. Möhwald and H. Xia, Chem. Mater., 2018, 30, 2709–2718 CrossRef CAS.
- J. R. Cole, N. A. Mirin, M. W. Knight, G. P. Goodrich and N. J. Halas, J. Phys. Chem. C, 2009, 113, 12090–12094 CrossRef CAS.
- R. Zhu, Y. Li, X. Zhang, K. Bian, M. Yang, C. Cong, X. Cheng, S. Zhao, X. Li and D. Gao, Nanotechnology, 2019, 30, 055602 CrossRef CAS.
- V. P. Pattani and J. W. Tunnell, Lasers Surg. Med., 2012, 44, 675–684 CrossRef.
- X. Wang, D. Cao, X. Tang, J. Yang, D. Jiang, M. Liu, N. He and Z. Wang, ACS Appl. Mater. Interfaces, 2016, 8, 19321–19332 CrossRef CAS.
- J. Zeng, D. Goldfeld and Y. Xia, Angew. Chem., Int. Ed., 2013, 52, 4169–4173 CrossRef CAS.
- Y. H. Kim, J. Jeon, S. H. Hong, W. K. Rhim, Y. S. Lee, H. Youn, J. K. Chung, M. C. Lee, D. S. Lee, K. W. Kang and J. M. Nam, Small, 2011, 7, 2052–2060 CrossRef CAS.
- L. Dziawer, P. Koźmiński, S. Męczyńska-Wielgosz, M. Pruszyński, M. Łyczko, B. Wąs, G. Celichowski, J. Grobelny, J. Jastrzębski and A. Bilewicz, RSC Adv., 2017, 7, 41024–41032 RSC.
- Y. Zhang, Y. Zhang, L. Yin, X. Xia, F. Hu, Q. Liu, C. Qin and X. Lan, Contrast Media Mol. Imaging, 2017, 2017, 6081724 Search PubMed.
- A. A. Walsh, J. Nanopart. Res., 2017, 19, 152 CrossRef.
- H. Wallberg and S. Stahl, Biotechnol. Appl. Biochem., 2013, 60, 365–383 CrossRef CAS.
- E. W. Price and C. Orvig, Chem. Soc. Rev., 2014, 43, 260–290 RSC.
- C.-T. Yang, P. Padmanabhan and B. Z. Gulyás, RSC Adv., 2016, 6, 60945–60966 RSC.
- M. W. Rotz, K. S. B. Culver, G. Parigi, K. W. MacRenaris, C. Luchinat, T. W. Odom and T. J. Meade, ACS Nano, 2015, 9, 3385–3396 CrossRef CAS.
- A. Kunzmann, B. Andersson, T. Thurnherr, H. Krug, A. Scheynius and B. Fadeel, Biochim. Biophys. Acta, 2011, 1810, 361–373 CrossRef CAS PubMed.
- S. D. Steichen, M. Caldorera-Moore and N. A. Peppas, Eur. J. Pharm. Sci., 2013, 48, 416–427 CrossRef CAS.
- E. A. Sykes, Q. Dai, K. M. Tsoi, D. M. Hwang and W. C. Chan, Nat. Commun., 2014, 5, 3796 CrossRef CAS.
- K. Tsuchikama and Z. An, Protein Cell, 2018, 9, 33–46 CrossRef CAS.
- S. L. Kitson, V. Cuccurullo, T. S. Moody and L. Mansi, Curr. Radiopharm., 2013, 6, 57–71 CrossRef CAS.
- P. R. Banks and D. M. Paquette, Bioconjugate Chem., 1995, 6, 447–458 CrossRef CAS.
- M. Borzenkov, G. Chirico, L. D'Alfonso, L. Sironi, M. Collini, E. Cabrini, G. Dacarro, C. Milanese, P. Pallavicini, A. Taglietti, C. Bernhard and F. Denat, Langmuir, 2015, 31, 8081–8091 CrossRef CAS PubMed.
- C. Ayala-Orozco, C. Urban, M. W. Knight, A. S. Urban, O. Neumann, S. W. Bishnoi, S. Mukherjee, A. M. Goodman, H. Charron, T. Mitchell, M. Shea, R. Roy, S. Nanda, R. Schiff, N. J. Halas and A. Joshi, ACS Nano, 2014, 8, 6372–6381 CrossRef CAS PubMed.
- S. Das and Y.-P. Ting, Resources, 2017, 6, 64 CrossRef.
Footnotes |
| † Electronic supplementary information (ESI) available. See DOI: 10.1039/c9tb02194a |
| ‡ These authors contributed equally to this work and should be considered as co-first authors. |
| This journal is © The Royal Society of Chemistry 2020 |