Three-dimensional nitrogen-doped holey graphene and transition metal oxide composites for sodium-ion batteries†
Dongfang
Yang
 a,
Binghui
Xu
 b,
Qinglan
Zhao
a and
X. S.
Zhao
 *ab
*ab
aSchool of Chemical Engineering, The University of Queensland, St Lucia, Brisbane, QLD 4072, Australia. E-mail: george.zhao@uq.edu.au
bInstitute of Materials for Energy and Environment, College of Materials Science and Engineering, Qingdao University, Qingdao 266071, China
First published on 3rd December 2018
Abstract
Transition metal oxides (TMOs) such as nickel cobaltite (NCO) and magnetite (Fe3O4) with rich electroactive sites are promising anode materials for sodium-ion batteries (NIBs). However, these materials suffer from large volume change during charge/discharge, poor electron conductivity and severe aggregation of TMO nanoparticles. Here, we report an approach to improve the electrochemical performance of NCO and Fe3O4 by stabilizing them on three-dimensional (3D) nitrogen-doped holey graphene (N-HG), forming NCO@N-HG and Fe3O4@N-HG composite materials, respectively. The thin graphene sheets in both composites facilitate the electron transport and buffer the volume changes, while the interconnected 3D macroporous network with a pore size in the range of several micrometers, combined with the nanopores in the N-HG provide pathways for rapid ion transport. As expected, both composites showed high specific capacities, rate capability and cycling performance in NIBs. The good electrochemical performance of the electrode material indicates that using N-HG to support NCO and Fe3O4 particles is an effective approach towards developing high-performance anode materials for NIBs.
1. Introduction
Sodium-ion batteries (NIBs) are gaining fast growing attention as an alternative to lithium-ion batteries (LIBs) because of the rich abundance and low cost of sodium sources.1,2 One of the current grand challenges of the NIB technology is to find suitable anode materials with both high reversible capacities and long cycling life.3,4 Transition metal oxides (TMOs) such as TiO2,5,6 Nb2O5,7,8 NiCo2O4 (ref. 9–11) and Fe3O4,12–14 have been demonstrated to be promising anode materials for NIBs. However, the TMOs suffer from large volume change and sluggish kinetics of both ion and electron transport, as well as severe aggregation for TMOs nanoparticles (NPs), resulting in poor rate performance and cycling stability.15,16 One strategy for solving these problems is to combine TMOs with carbon materials, such as graphene, to prepare composite electrodes.9,12,17,18 While graphene is an excellent carbon material, graphene sheets tend to stack or agglomerate during electrochemical reactions in NIBs, leading to blockage of some ion transport pathways.19,20Using three-dimensional (3D) porous graphene aerogels with 3D ion diffusion channels to support TMOs has been shown to be a more effective approach to fabricating TMO–graphene composite electrode materials.12,18,21–23 However, ion transport across the basal plane of individual two-dimensional (2D) graphene sheets has been a great challenge.24 Introducing nanoholes in graphene sheets is regarded as a good approach to solve this problem. Zhao et al.25 reported that graphene can be etched by nitric acid to obtain holy graphene (HG). Jiang et al.26 reported that potassium hydroxide can also be used to create holes for preparing HG. The HG in the above two work exhibited a significantly improved rate capability with an excellent cycling stability as anode for lithium ion batteries. Later, Xu et al.27 reported that graphene can be etched by using a more environmentally friendly agent, namely hydrogen peroxide (H2O2) to obtain HG, which showed efficient capacitive energy storage. Recently, Sun and co-workers24 prepared a HG by etching graphene in the presence of H2O2, which was then used as a conductive scaffold for Nb2O5 to form an 3D architecture electrode. The HG greatly improved ion access to the Nb2O5, leading to an ultrahigh-rate lithium ion storage with a capacity of 75 mA h g−1 at 100C. On the other hand, nitrogen (N) doping is an effective approach to further improving the electron conductivity and wettability of carbon materials.21,28 Therefore, it can be expected that constructing a 3D porous architecture consisting of nitrogen-doped HG (N-HG) and the TMOs could significantly facilitate electron and sodium ion transport throughout the entire architecture.
It has been reported that nickel cobaltite (NCO)9–11,29 and magnetite (Fe3O4)12–14,30 are typical TMOs with rich electroactive sites are promising electrode materials for electrochemical energy storage due to their low cost, abundance in nature, and high theoretical specific capacities in NIBs (about 890 for NCO and 925 mA h g−1 for Fe3O4). However, their severe volume change during electrochemical cycling, inferior electric and ionic conductivity, and severe aggregation of NPs are critical issues that must be solved before such TMOs can find practical applications. In this work, N-HG was used to modify NCO and Fe3O4 nanoparticles by forming 3D porous N-HG supported NCO and Fe3O4 composites, which were designated as NCO@N-HG and Fe3O4@N-HG, respectively. The thin graphene sheets in both composites facilitate the electron transport and buffer the volume changes. In addition, the interconnected 3D macroporous network with a pore size in several micrometers range, combined with the nanoporous channels in the N-HG provide pathways for rapid ion transport. As expected, the composites exhibited enhanced rate capabilities with specific capacities of 403 and 350 mA h g−1 for NCO@N-HG and Fe3O4@N-HG at a current rate of 1 A g−1, respectively, and a stable cycling performance when used as anodes in NIBs.
2. Experimental section
Materials preparation
A graphene-supported Fe3O4 composite (Fe3O4@G) was prepared according to a method reported previously.33 Briefly, 10 mL of D.I. water containing 2.5 mmol of FeSO4·7H2O was added into 15 mL of 2 mg mL−1 GO dispersion. Then, 2.5 mL of D.I. water containing 0.20 g of NaOH was added under stirring. After 1 h, 10 mL of N2H4·H2O was added. The mixture was sealed in a teflon-lined stainless steel autoclave and heated at 180 °C for 8 h. The solid product was filtered off and washed with D.I. water, and freeze dried to obtain Fe3O4@G sample.
Characterization
X-ray diffraction (XRD) patterns were collected on a Bruker D8 X-ray diffractometer with Ni-filtered Cu Kα radiation (λ = 1.54056 Å, 40 kV, 30 mA) at a scan rate of 2° min−1. Field-emission scanning electron microscope (FESEM, JEOL 7100F) and transmission electron microscope (TEM, TECNAI F20) were used to characterise the morphology of samples. X-ray photoelectron spectroscopy (XPS) was acquired on a Kratos Axis ULTRA X-ray photoelectron spectrometer with a 165 mm hemispherical electron energy analyser and a monochromatic Al Kα (1486.6 eV) radiation at 225 W (15 kV, 15 mA). Argon sorption isotherms were measured on Tristar II 3020 at the liquid argon temperature. Before measurement, the samples were degassed at 150 °C for 24 h. The pore size distribution curves were obtained by the density functional theory (DFT) method. Thermal gravimetric analysis (TGA) was conducted on a Perkin-Elmer STA 6000 in air from room temperature up to 700 °C at a heating rate of 5 °C min−1.Electrochemical measurements
All electrodes were prepared by mixing 70 wt% of an active material, 20 wt% of an electrical conductor (carbon black), and 10 wt% of a binder (carboxymethyl cellulose, CMC) in D.I. water to form a slurry, which was subsequently coated on a copper foil. After drying at 60 °C overnight in a vacuum oven, the copper foil was punched into circular discs. The mass loadings of the samples were all about 1 mg cm−2. A NIB was assembled using a 2032-type coin cell with the discs as the anode, sodium foil as the counter electrode, glass fibre (Whatman, GF/C, USA) as the separator and 1 M NaPF6 dissolved in diethylene glycol dimethyl ether solvent as the electrolyte. Both the electrolyte preparation and the coin cell fabrication were performed in an argon-filled glovebox. Galvanostatic charge and discharge (GCD) tests were performed on a Neware battery tester (CT3008). The specific capacities of the composites were calculated based on the weight of the entire composites. Cyclic voltammetry (CV) and electrochemical impedance spectroscopy (EIS) measurements were conducted on an electrochemical workstation (CHI-600D).3. Results and discussion
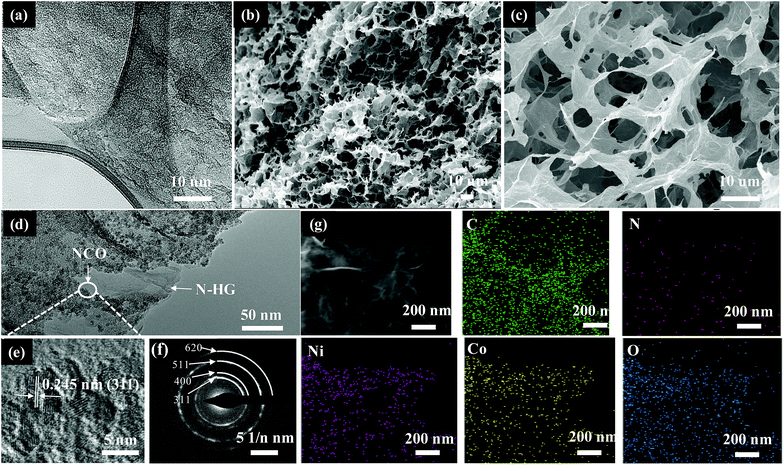
Scheme 1 illustrates the procedure for preparing of the 3D TMO@N-HG. HGO was firstly prepared by etching the carbon atoms around the defective sites of GO with H2O2.24,34 TMO@G were prepared in a hydrothermal method. In this process, oxygen-containing groups (carboxyl, hydroxyl and epoxy groups) in GO served as the active sites for nucleation and growth of TMO nanoparticles (NPs). In the meantime, GO was reduced.34 TMO@N-HG was then prepared by co-assembly of the aforementioned HGO and TMO@G. Briefly, the obtained TMO@G was crushed and dispersed in a urea dissolved aqueous HGO suspension for a hydrothermal treatment. During this treatment, the HGO linked with TMO@G via oxygen-containing groups to self-assemble into 3D hydrogels. Simultaneously, HGO was reduced and doped with nitrogen by urea. After freeze-drying and thermal treatment, a TMO@N-HG with macroporous channels derived from 3D assembly, as well as nanoporous channels derived from the etched nanoholes in graphene sheets formed. The details of sample preparation are provided in the experimental section.Fig. 1a shows the TEM image of N-HG, which was synthesized by etching GO with H2O2 followed by a hydrothermal reaction in the presence of urea. The N-HG sheets exhibited abundant in-plane nanoholes of diameters ranging from 1.0 to 3.5 nm. This confirmed that H2O2 can partially oxidize and etch GO, leaving behind nanoholes in GO to form HGO.27 The HGO assembled with NCO@G (Fig. S1a†) to prepare 3D NCO@N-HG composite based on the synthetic procedure in Scheme 1. As expected, the composite exhibited various cumulative volumes of pores (Fig. S2†), and the pore size distribution curve indicates the presence of both micropores peaked at 1.1 nm and prominent mesopores peaked at 3.2 nm, which is consistent with the TEM study in Fig. 1a. Fig. 1b–g show the SEM and TEM images of sample NCO@N-HG. A 3D graphene framework with interconnected macrospores ranging from sub-micrometers to several micrometers can be seen from Fig. 1b and c. The TEM image and the high-resolution TEM (HRTEM) image (Fig. 1d and e) of NCO@N-HG show that many NCO NPs with sizes of about 5 nm were on the graphene sheets. The lattice fringes of NCO NP with a space of 0.245 nm agrees well with the d-space of the (311) plane of the NCO crystal.35 Meanwhile, the selected area electron diffraction (SAED) pattern show diffraction rings (Fig. 1f) of (311), (400), (511), and (620) which were well indexed to the crystal planes of NCO.10 The high-angle annular dark-field scanning TEM (HAADF-STEM) image and elemental mapping results of NCO@N-HG (Fig. 1g) confirmed the existence of elements C, N, Ni, Co, and O, suggesting that N has been doped in the graphene sheets. The unique macro- and nanoporous feature of NCO@N-HG combined with nitrogen doping is favourable for electrolyte accessibility and rapid sodium ions transport.
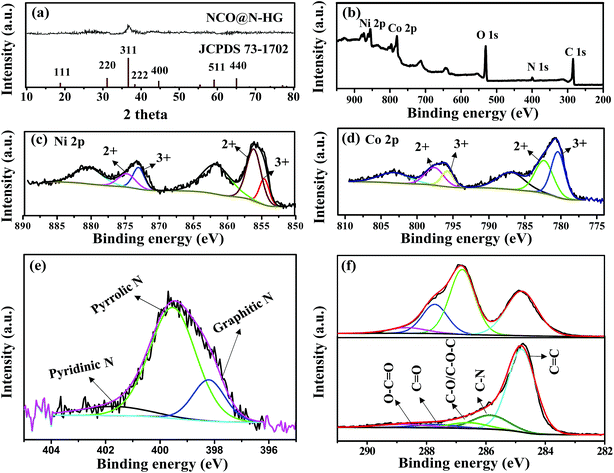
Fig. 2a shows the XRD pattern of sample NCO@N-HG. The broad diffraction peak at 36.7 degrees two theta confirmed that the size of the NCO crystals is in the nanometer range, which is consistent with the TEM data. The small diffraction hump appearing in the range of 22–28 degrees two theta is attributed to the re-stacked graphene sheets as confirmed by the XRD pattern of sample N-HG shown in Fig. S3,† which compares the XRD patterns of samples N-HG and GO. For sample N-HG, a broad peak in the two theta ranges of 20–30 degrees can be seen. However, the peak at 11.2 degrees two theta disappeared, indicating the GO sheets were reduced after the hydrothermal treatment, leading to sheet stacking.
Fig. 2b shows the XPS survey scan of sample NCO@N-HG. The binding energies of 284.8, 399.8, 530.8, 779.8 and 854.8 eV corresponded to C 1s, N 1s, O 1s, Co 2p and Ni 2p, respectively, confirming the integration of NCO and N-HG. Fig. 2c and d present the high-resolution XPS spectra of Ni 2p and Co 2p of NCO@N-HG, respectively. The Ni 2p and Co 2p spectra were deconvoluted with two peaks assigned to Ni2+/Ni3+ and Co2+/Co3+, respectively, with two satellite peaks as well. This matched well with previously reported XPS spectra of Ni 2p and Co 2p in NCO.11Fig. 2e shows the high-resolution XPS spectrum of N 1s, which can be resolved into three components centered at 398.2, 399.6 and 401.6 eV, representing the pyridinic, pyrrolic and graphitic types of N atoms, respectively. In addition, the XPS results revealed that the N-doping level was 6.0 at% in N-HG. Doping N in graphene not only enhances its electronic conductivity, but also improves the wettability between graphene and the organic electrolyte.28Fig. 2f compares the C 1s high resolution XPS spectra of GO and NCO@N-HG; the dramatic loss of oxygen-containing functional groups (C–O/C–O–C and C![[double bond, length as m-dash]](https://www.rsc.org/images/entities/char_e001.gif) O) further confirmed the reduction of GO. Therefore, the XRD and XPS results confirmed the formation of NCO and N-HG composite, the reduction of GO and the successful N-doping in graphene.
O) further confirmed the reduction of GO. Therefore, the XRD and XPS results confirmed the formation of NCO and N-HG composite, the reduction of GO and the successful N-doping in graphene.
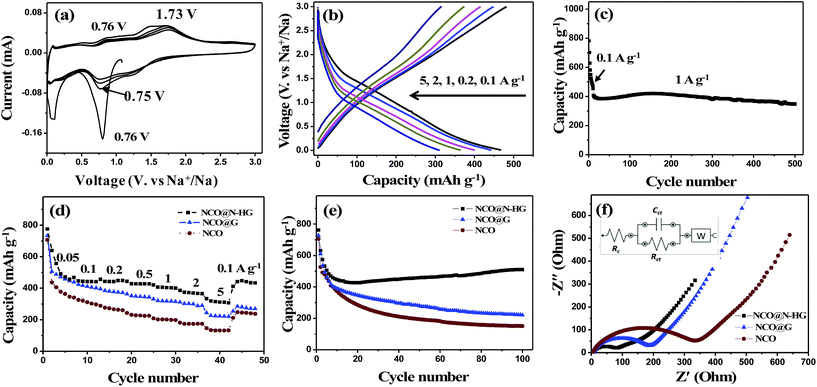
Fig. 3a shows the CV curves of the NCO@N-HG electrode for the first four cycles in the potential range of 0.005 to 3.000 V (vs. Na+/Na) at a scan rate of 0.2 mV s−1. For the first cathodic scan, the strong reduction peak observed at 0.76 V corresponds to the reduction of Ni2+/Ni3+ and Co2+/Co3+ to Ni0 and Co0, and the formation of a solid electrolyte interphase (SEI). For the subsequent anodic scan, two broad peaks appeared at 0.76 V and 1.73 V, which are attributed to the oxidation of Ni0/Co0 to Ni2+/Co2+, and Co2+ further to Co3+, respectively. The electrochemical conversion reaction of NCO in a NIB during charge/discharge can be described by the following equations:10
In the first discharge:
| NiCo2O4 + 8Na+ + 8e → Ni + 2Co + 4Na2O |
In the following charge/discharge:
| Ni + Na2O ↔ NiO + 2Na+ + 2e |
Fig. 3b shows the GCD profiles of NCO@N-HG at current densities ranging from 0.1 to 5.0 A g−1. NCO@N-HG produced GCD profiles without a noticeable plateau at all current densities. This indicates that the reaction mechanism between sodium ions and NCO@N-HG not only involves in phases conversion but also has a large contribution of surface capacitive behaviour.36 The NCO@N-HG electrode also displayed a long cycling performance, as shown in Fig. 3c. After activated at 0.1 A g−1 for the first few cycles, NCO@N-HG remained the capacity of 348 mA h g−1 at 1 A g−1 at the 500th cycle with a capacity retention of 85.7%.
An electrochemical study compared with NCO@G (Fig. S1a†) and NCO (Fig. S1b†) electrodes was performed in Fig. 3d–f. Fig. 3d shows the rate performance of samples NCO@N-HG, NCO@G and NCO. All electrodes exhibited continuously decrease in capacity in the first few cycles. The capacity loss can be attributed to the formation of solid electrolyte interphase (SEI) on the electrode surface. In the subsequent cycles, electrode NCO@N-HG delivered capacities of 639, 446, 442, 427, 403, 370, and 310 mA h g−1 at current rates of 0.05, 0.1, 0.2, 0.5, 1, 2 and 5 A g−1, respectively. When the current rate was reversed back to 0.1 A g−1, the electrode capacity was about 443 mA h g−1, very close to 446 mA h g−1, indicating an excellent rate performance of this electrode. In contrast, the capacities of NCO and NCO@G electrodes dropped fast in the first 20 cycles, and the specific capacities in the subsequent cycles at different current rates were much lower than that of electrode NCO@N-HG.
Fig. 3e compares the cycling performance of the three electrodes measured at 0.1 A g−1. Despite the decay in the initial few cycles, NCO@N-HG exhibited the best cycling performance with a capacity which was slowly increased to 510 mA h g−1 at the 100th cycle. This capacity-increasing trend with cycling was related to the electrode structure. With cycling going on, the electrolyte gradually wet the surfaces of small cavities formed between graphene sheets,37 allowing the electrolyte to access to more and more electrochemically active sites for redox reactions with sodium ions. Thus, the capacity of electrode NCO@N-HG gradually increased in the first 100 cycles. In contrast, the capacities of NCO@G and NCO were rapidly decreased to 221 and 150 mA h g−1 under the same measurement conditions, respectively. For comparison, the electrochemical performance of N-HG was also measured and the data was included in Fig. S4.† At a current rate of 0.1 A g−1, the N-HG electrode contributed a reversible specific capacity of 228 mA hg−1 at the 100th cycle in NIBs, which was higher than that of previously reported nitrogen-doped graphene (205 mA h g−1)36 and graphene (146 mA h g−1)38 electrodes by our group. Although the content of graphene in NCO@N-HG was higher than that in NCO@G (31.9% vs. 12.9%) (see the TGA data in Fig. S5†), the capacity of the former was higher than the latter in all cycles. This is because the presence of N-HG promoted electrolyte diffusion, thus facilitating ion transport during charge/discharge.
Fig. 3f compares the Nyquist plots of electrodes, along with a fitted circuit. Both plots showed a single semicircle in the high-to-medium frequency region and the charge-transfer kinetics at the electrode/electrolyte interface (Rct), as well as a slope in the low frequency region which stands for the diffusive Warburg impedance (W). Rc is the resistance of the electrolyte. According to the fitting results, NCO@N-HG showed a smaller resistance of Rct (63 Ω) than that of NCO@G and NCO (128 and 227 Ω, respectively), further demonstrating that addition of N-HG indeed improved the electron transport kinetics of the electrode materials.
The superior rate and cycling performance of NCO@N-HG was attributed to the structure robustness of 3D N-HG foam, which could buffer the volume change of NCO during charge/discharge process. Meanwhile, the high electronic conductivity of the graphene enhanced the electron transport, and the unique pore structure consists of macrospores in the 3D network and nanopores in the graphene sheets facilitated the sodium ions transport.
The 3D Fe3O4@N-HG architecture was also constructed based on the synthetic procedure in Scheme 1. Fe3O4@N-HG (Fig. 4a and b) showed a similar morphology to that of NCO@N-HG, exhibiting the macroporous structure arising from the 3D graphene architecture. DFT analysis (Fig. S6a and b†) of Fe3O4@N-HG confirmed the presence of the nanopores peaking at about 1.0 and 3.3 nm which were mainly derived from the addition of holey graphene. The percentage by mass of graphene in Fe3O4@G and Fe3O4@N-HG composites were about 13.5 wt% and 34.3 wt%, respectively (Fig. S5†). TEM images (Fig. 4c and d) show that graphene sheets were anchored with nanoparticles with sizes about 20 to 35 nm. The lattice fringes of NP (Fig. 4d) with a space of 0.253 nm corresponds to the d-space of the (311) plane in Fe3O4, and the diffraction rings of (220), (311), (400), (422), (511) and (440) in the SAED patterns (Fig. 4e) further confirmed that the nanoparticles were Fe3O4 crystals. This is in consistent with the XRD patterns in Fig. S6c.† The HAADF-STEM image and elemental mapping results of Fe3O4@N-HG (Fig. 4f) confirmed the existence of elements C, N, Fe and O, suggesting that N has been doped in the graphene sheets.
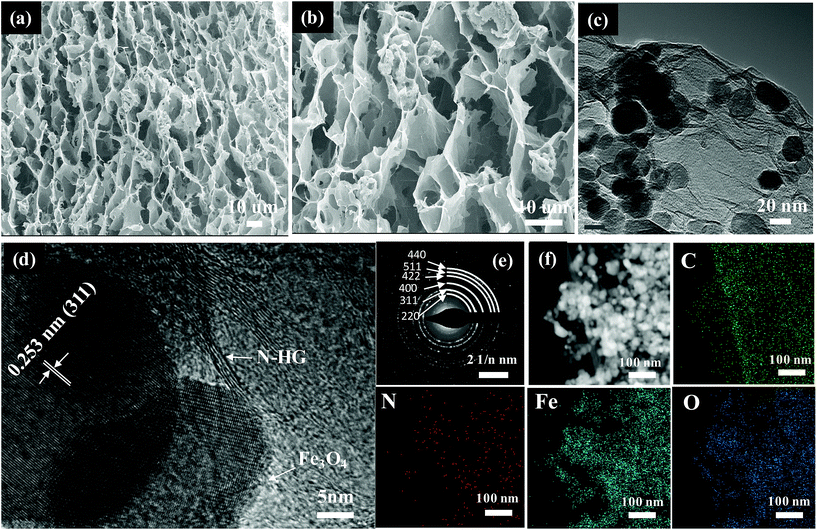 | ||
| Fig. 4 (a, b) SEM images, (c, d) TEM images, (e) SAED pattern and (f) HAADF-STEM image with elemental mapping results of the Fe3O4@N-HG. | ||
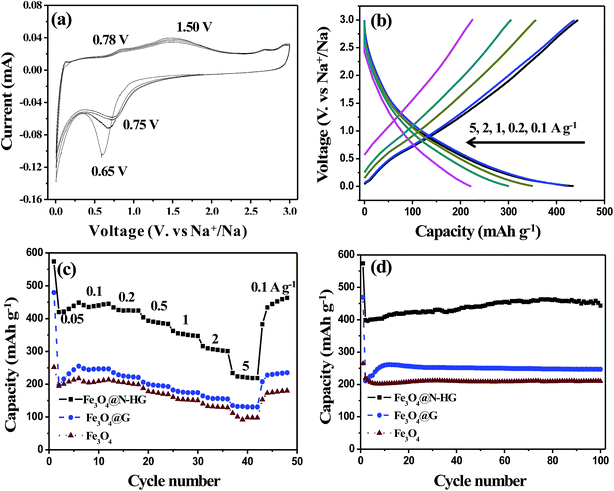
Fig. 5a shows the CV curves of the Fe3O4@N-HG electrode for the first four cycles in the potential range of 0.005 to 3.000 V (vs. Na/Na+) at a scan rate of 0.2 mV s−1. For the first cathodic scan, the strong reduction peak observed at 0.65 V corresponds to the reduction of Fe2+/Fe3+ to Fe0, and the formation of a SEI.12,30 For the anodic scan, two broad peaks appeared at 0.78 V and 1.50 V, which are attributed to the oxidation of Fe0 to Fe2+, and further to Fe3+, respectively.18 In the subsequent cycles, the full sodiation potential is characterized by a high voltage at 0.75 V. This potential change from 0.65 to 0.75 V is mainly in virtue of the improved kinetics of Fe3O4@N-HG, originating from the inherent nanosize effects in the TMO electrode during cycling.39
The electrochemical conversion reaction of Fe3O4 in a NIB during charge/discharge can be described by the following equation:12,30
| Fe3O4 + 8Na+ + 8e ↔ 3Fe + 4Na2O |
Fig. 5b shows the GCD profiles of Fe3O4@N-HG at current densities ranging from 0.1 to 5.0 A g−1. The slope charge–discharge curves reveal that the sodium storage in Fe3O4@N-HG involved in both the capacitive and diffusion-controlled process.40
Fig. 5c compares the rate performance of the Fe3O4@N-HG, Fe3O4@G and Fe3O4 electrodes. Electrode Fe3O4@N-HG delivered capacities of about 448, 442, 425, 390, 350, 310, and 220 mA h g−1 at current rates of 0.05, 0.1, 0.2, 0.5, 1, 2 and 5 A g−1, respectively. When the current rate was reversed back to 0.1 A g−1, the electrode capacity was about 444 mA h g−1, very close to 442 mA h g−1. By contrast, the specific capacities of Fe3O4@G and Fe3O4 at different current rates were much lower than those of Fe3O4@N-HG. For example, Fe3O4@G and Fe3O4 showed the low capacities of only 205 and 245 mA h g−1 at 0.1 A g−1, respectively. At a current rate of 2 A g−1, low capacities of 155 and 130 mA h g−1 were exhibited, respectively. The low capacities were mainly due to the aggregation of Fe3O4@G (Fig. S1c†) and Fe3O4 (Fig. S1d†) during electrode preparation, thus lowering the active sites accessible to the electrolyte. The cycling performance of the three samples is shown in Fig. 5d. The capacity of Fe3O4@N-HG was also superior to that of Fe3O4@G and Fe3O4 electrodes. The Fe3O4@N-HG sample kept a capacity-increasing trend with a capacity of 443 mA h g−1 at the 100th cycle at 0.1 A g−1, which was higher than the reported Fe3O4 based materials for NIBs.12,13,18,30 The enhanced electrochemical performance of Fe3O4@N-HG was mainly attributed to the bi-continuous pathways for both sodium ions and electrons constructed by the N-HG framework.
4. Conclusions
We have demonstrated an effective approach to preparing high-performance sodium-ion battery anode materials by loading nickel cobaltite and magnetite nanoparticles in three-dimensional nitrogen holey graphene framework. The thin graphene sheets buffer the volume change and the unique macroporous architecture in combination with the presence of nanopores in graphene sheets facilitate ion transport during charge/discharge, contributing to the observed high capacity and good cycling performance. Specifically, charge storage capacities of 510 mA h g−1 and 443 mA h g−1 were achieved with electrodes NCO@N-HG and Fe3O4@N-HG, respectively, at the 100th cycle at 0.1 A g−1 in NIBs, manifesting the NCO@N-HG and Fe3O4@N-HG composite materials as promising anodes for NIBs. While only NCO and Fe3O4 were investigated in this work, it is believed that the approach can be extended to modify other transition metal oxides for sodium ion storage, such as Co3O4, NiO, Fe2O3, and TiO2.Conflicts of interest
There are no conflicts to declare.Acknowledgements
This research was supported by The Australian Research Council (ARC) under the ARC Laureate Fellowship Program (FL170100101). DY wishes to thank the China Scholarship Council for providing a scholarship. The authors gratefully acknowledge the facilities and technical assistance of the Australian Microscopy and Microanalysis Research Facility at the UQ Centre for Microscopy and Microanalysis.Notes and references
- H. Pan, Y.-S. Hu and L. Chen, Energy Environ. Sci., 2013, 6, 2338–2360 RSC.
- S.-W. Kim, D.-H. Seo, X. Ma, G. Ceder and K. Kang, Adv. Energy Mater., 2012, 2, 710–721 CrossRef CAS.
- H. Hou, X. Qiu, W. Wei, Y. Zhang and X. Ji, Adv. Energy Mater., 2017, 7, 1602898 CrossRef.
- D. A. Stevens and J. R. Dahn, J. Electrochem. Soc., 2000, 147, 1271–1273 CrossRef CAS.
- M. Zhou, Y. Xu, C. Wang, Q. Li, J. Xiang, L. Liang, M. Wu, H. Zhao and Y. Lei, Nano Energy, 2017, 31, 514–524 CrossRef CAS.
- G. Longoni, R. L. Pena Cabrera, S. Polizzi, M. D'Arienzo, C. M. Mari, Y. Cui and R. Ruffo, Nano Lett., 2017, 17, 992–1000 CrossRef CAS PubMed.
- L. Yang, Y.-E. Zhu, J. Sheng, F. Li, B. Tang, Y. Zhang and Z. Zhou, Small, 2017, 13, 1702588 CrossRef PubMed.
- F. Liu, X. Cheng, R. Xu, Y. Wu, Y. Jiang and Y. Yu, Adv. Funct. Mater., 2018, 28, 1800394 CrossRef.
- Y. Wang, H. Huang, Q. Xie, Y. Wang and B. Qu, J. Alloys Compd., 2017, 705, 314–319 CrossRef CAS.
- D. Yang, X. Sun, K. Lim, R. Ranganathan Gaddam, N. Ashok Kumar, K. Kang and X. S. Zhao, J. Power Sources, 2017, 362, 358–365 CrossRef CAS.
- R. Alcántara, M. Jaraba, P. Lavela and J. L. Tirado, Chem. Mater., 2002, 14, 2847–2848 CrossRef.
- H. Liu, M. Jia, Q. Zhu, B. Cao, R. Chen, Y. Wang, F. Wu and B. Xu, ACS Appl. Mater. Interfaces, 2016, 8, 26878–26885 CrossRef CAS PubMed.
- X. Ding, X. Huang, J. Jin, H. Ming, L. Wang and J. Ming, Electrochim. Acta, 2018, 260, 882–889 CrossRef CAS.
- S. Hariharan, K. Saravanan, V. Ramar and P. Balaya, Phys. Chem. Chem. Phys., 2013, 15, 2945–2953 RSC.
- C. Yuan, H. B. Wu, Y. Xie and X. W. D. Lou, Angew. Chem., Int. Ed., 2014, 53, 1488–1504 CrossRef CAS.
- Y. Jiang, M. Hu, D. Zhang, T. Yuan, W. Sun, B. Xu and M. Yan, Nano Energy, 2014, 5, 60–66 CrossRef CAS.
- D. Li, D. Yan, X. Zhang, T. Lu, G. Yang and L. Pan, J. Mater. Sci.: Mater. Electron., 2017, 28, 10411–10419 CrossRef CAS.
- Y. Fu, Q. Wei, X. Wang, G. Zhang, H. Shu, X. Yang, A. C. Tavares and S. Sun, RSC Adv., 2016, 6, 16624–16633 RSC.
- M. Pumera, Energy Environ. Sci., 2011, 4, 668–674 RSC.
- R. Atif and F. Inam, Beilstein J. Nanotechnol., 2016, 7, 1174–1196 CrossRef CAS PubMed.
- B. Wang, W. A. Abdulla, D. Wang and X. S. Zhao, Energy Environ. Sci., 2015, 8, 869–875 RSC.
- W. Wei, S. Yang, H. Zhou, I. Lieberwirth, X. Feng and K. Müllen, Adv. Mater., 2013, 25, 2909–2914 CrossRef CAS PubMed.
- B. Gill Choi, S.-J. Chang, Y. Boo Lee, J. Seong Bae, H. Jin Kim and Y. Suk Huh, Nanoscale, 2012, 4, 5924–5930 RSC.
- H. Sun, L. Mei, J. Liang, Z. Zhao, C. Lee, H. Fei, M. Ding, J. Lau, M. Li and C. Wang, Science, 2017, 356, 599–604 CrossRef CAS PubMed.
- X. Zhao, C. M. Hayner, M. C. Kung and H. H. Kung, ACS Nano, 2011, 5, 8739–8749 CrossRef CAS PubMed.
- Z. Jiang, B. Pei and A. Manthiram, J. Mater. Chem. A, 2013, 1, 7775–7781 RSC.
- Y. Xu, Z. Lin, X. Zhong, X. Huang, N. O. Weiss, Y. Huang and X. Duan, Nat. Commun., 2014, 5, 4554 CrossRef CAS PubMed.
- J. Xu, M. Wang, N. P. Wickramaratne, M. Jaroniec, S. Dou and L. Dai, Adv. Mater., 2015, 27, 2042–2048 CrossRef CAS PubMed.
- X. Q. Zhang, Y. C. Zhao, C. G. Wang, X. Li, J. D. Liu, G. H. Yue and Z. D. Zhou, J. Mater. Sci., 2016, 51, 9296–9305 CrossRef CAS.
- P. R. Kumar, Y. H. Jung, K. K. Bharathi, C. H. Lim and D. K. Kim, Electrochim. Acta, 2014, 146, 503–510 CrossRef CAS.
- Z. Xiong, L. Li Zhang, J. Ma and X. S. Zhao, Chem. Commun., 2010, 46, 6099–6101 RSC.
- Y. Xu, C.-Y. Chen, Z. Zhao, Z. Lin, C. Lee, X. Xu, C. Wang, Y. Huang, M. I. Shakir and X. Duan, Nano Lett., 2015, 15, 4605–4610 CrossRef CAS PubMed.
- Q. Wang, L. Jiao, H. Du, Y. Wang and H. Yuan, J. Power Sources, 2014, 245, 101–106 CrossRef CAS.
- Z.-S. Wu, G. Zhou, L.-C. Yin, W. Ren, F. Li and H.-M. Cheng, Nano Energy, 2012, 1, 107–131 CrossRef CAS.
- Y. Fu, C. Peng, D. Zha, J. Zhu, L. Zhang and X. Wang, Electrochim. Acta, 2018, 271, 137–145 CrossRef CAS.
- D. Yang, Q. Zhao, L. Huang, B. Xu, A. K. Nanjundan and X. S. Zhao, J. Mater. Chem. A, 2018, 6, 14146–14154 RSC.
- B. Xu, J. Zhang, Y. Gu, Z. Zhang, W. Al Abdulla, N. A. Kumar and X. S. Zhao, Electrochim. Acta, 2016, 212, 473–480 CrossRef CAS.
- A. K. Nanjundan, R. Gaddam, S. Varanasi, D. Yang, S. K. Bhatia and X. S. Zhao, Electrochim. Acta, 2016, 214, 319–325 CrossRef.
- B. Xu, X. Guan, L. Y. Zhang, X. Liu, Z. Jiao, X. Liu, X. Hu and X. S. Zhao, J. Mater. Chem. A, 2018, 6, 4048–4054 RSC.
- S. Li, J. Qiu, C. Lai, M. Ling, H. Zhao and S. Zhang, Nano Energy, 2015, 12, 224–230 CrossRef CAS.
Footnote |
| † Electronic supplementary information (ESI) available. See DOI: 10.1039/c8ta09188a |
| This journal is © The Royal Society of Chemistry 2019 |


