 Open Access Article
Thermodynamic analysis of high temperature steam and carbon dioxide systems in solid oxide cells†
Petr
Vágner
 *ab,
Roman
Kodým
a and
Karel
Bouzek
a
aUniversity of Chemistry and Technology Prague, Technická 5, Prague, Czech Republic. E-mail: petr.vagner@vscht.cz; Fax: +420 220 444 410; Tel: +420 220 444 019
bFaculty of Mathematics and Physics, Charles University, Sokolovská 49/83, 186 75 Prague, Czech Republic
First published on 19th June 2019
Abstract
A thermodynamic analysis of the process in solid oxide cells with H2O and CO2 (SOCc) was performed based on the data available in the open literature. This analysis identified a range of operating parameters (temperature and pressure) and the composition of the feed gas mixture ensuring the stability of the system and important reactions with respect to the desired process. Primarily, the thermodynamic equilibrium in the system was determined on the basis of minimizing the Gibbs free energy of the reaction system. Temperature and pressure were the operational parameters studied in the range of 600 °C to 1000 °C and 1 bar to 50 bar, respectively. The admissible components in the reaction system were: oxygen, hydrogen, water vapor, carbon dioxide, carbon monoxide, methane, ethane, ethene, formic acid, formaldehyde, methanol and solid carbon (graphitic form). The model predicts the equilibrium mixture composition from which the equilibrium voltage of the cell is computed. The composition of the equilibrium mixture is expressed by means of ternary diagrams as a function of the elemental ratio of carbon, hydrogen and oxygen, known as the C![[thin space (1/6-em)]](https://www.rsc.org/images/entities/char_2009.gif) :
:![[thin space (1/6-em)]](https://www.rsc.org/images/entities/char_2009.gif) H
H![[thin space (1/6-em)]](https://www.rsc.org/images/entities/char_2009.gif) :
:![[thin space (1/6-em)]](https://www.rsc.org/images/entities/char_2009.gif) O ratio. The following species appear in negligible amounts in the aforementioned condition ranges in the equilibrium mixture: methanol, formaldehyde, formic acid and oxygen. A strong possibility of solid carbon forming was identified at high conversion of water vapor and carbon dioxide under co-electrolysis conditions. The results of this thermodynamic analysis serve for an evaluation of the degree of conversion with respect to the equilibrium of the outlet gas mixture obtained during the experimental characterization of the solid oxide cell.
O ratio. The following species appear in negligible amounts in the aforementioned condition ranges in the equilibrium mixture: methanol, formaldehyde, formic acid and oxygen. A strong possibility of solid carbon forming was identified at high conversion of water vapor and carbon dioxide under co-electrolysis conditions. The results of this thermodynamic analysis serve for an evaluation of the degree of conversion with respect to the equilibrium of the outlet gas mixture obtained during the experimental characterization of the solid oxide cell.
1 Introduction
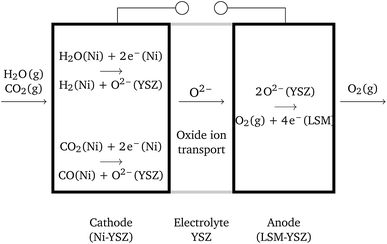
Solid oxide cells (SOCs) are electrochemical devices – electrolyzers producing fuel, e.g. hydrogen, or fuel cells producing electric current – with a solid oxide ceramic electrolyte operating at temperatures ranging between 600 °C and 1100 °C. Solid oxide cells represent a promising branch of hydrogen-energy technology, which has been thoroughly investigated in the last few decades.1,2 A large number of research efforts are presently being dedicated to the investigation of new electrode materials with improved physical characteristics, long-term stability and durability, e.g. see ref. 3–5. The final aim is the development of marketable SOCs. Solid oxide electrolysis cells (SOECs) as well as reversible solid oxide fuel cells (RSOFCs) are still far from technical maturity, in contrast to solid oxide fuel cells (SOFCs).6,7 The main challenges to be overcome are connected with system durability. Structural degradation is observed in both oxygen and fuel electrodes. Although the percolation of individual phases is crucial, the role of the micro-structure (particularly grain size) of the cell components is still not clear.6 On the oxygen side, the production of gas causes delamination of the electrode.Solid oxide co-electrolysis cells (SOcoECs) represent SOECs with water vapor and carbon dioxide used as reactants,8 see Fig. 1. The carbon dioxide addition to the system leads to the following considerable chemical effects:
• The simultaneous electrolysis of water vapor and carbon dioxide yields a mixture of hydrogen and carbon monoxide syngas, and hence it could serve as a source for subsequent synthesis of methane and other hydrocarbons.9
 | (1) |
 | (2) |
• Methane and other hydrocarbons could be produced directly under certain operating conditions.10
• Solid carbon soot could appear as an unwanted by-product, forming layers on the electrochemically active surface of the cathode or blocking the electrode pores.11
The last point could lead to a considerable reduction of the lifetime of the whole system. It is, therefore, of essential interest to describe and understand this phenomenon. All the above-mentioned points are, in principle, valid even if the cell is operated in fuel cell mode. A complex overview and undistorted description of the chemical behavior of the solid oxide cell with a carbon dioxide and water vapor system (SOCc) by means of equilibrium thermodynamics are the subject of this study. The major focus of the study and the literature discussed is devoted to SOcoECs.
2 Thermodynamic modeling of the SOEC and the SOcoEC
The development of a detailed model describing the SOC requires employing complex methods, e.g. non-equilibrium thermodynamics.12 This study is restricted to a scenario in which the state of the cell (or its part) is, at least temporarily, sufficiently close to equilibrium with its surroundings and, hence, the use of equilibrium thermodynamics (ET), see e.g.ref. 13, is substantiated. Otherwise a definite thermodynamic state cannot be assigned to the cell as a whole. This can apply not only to the gas at the inlet/outlet of the cell but also to the regions of electrodes where the electron transfer reactions vanish and the reaction equilibrium can occur. In the context of ET, an arbitrary cell exchanges with its surroundings:• Gaseous species, e.g. H2, H2O and air (inlet and outlet of both electrodes).
• Electric work – electrons, through an external circuit.
• Heat.
This setting allows for the determination of an overall energetic balance and hence for an estimation, for example, of the minimal amount of heat to be removed during an operation in the fuel cell mode, or the heat energy needed for self-sufficient electrolytic operation, cf. thermoneutral voltage.
A description of the reactions occurring is more complicated in the case of the SOcoEC. Hence, in order to extend the usual ET machinery, introduced in the following section, the adoption of assumptions regarding the type and extent of electrochemical and chemical reactions is inevitable.
The electrochemical and chemical reactions in the cathode compartment could, in principle, form all kinds of hydro-carbon chemical compounds, depending, in the case of ET, predominantly on temperature, pressure and the C![[thin space (1/6-em)]](https://www.rsc.org/images/entities/char_2009.gif) :
:![[thin space (1/6-em)]](https://www.rsc.org/images/entities/char_2009.gif) H
H![[thin space (1/6-em)]](https://www.rsc.org/images/entities/char_2009.gif) :
:![[thin space (1/6-em)]](https://www.rsc.org/images/entities/char_2009.gif) O ratio of the gaseous mixture. Hence, from now on it is assumed that at least CO2, CO, H2O and H2 are potentially present in the cathode compartment of the co-electrolysis cell. This minimum assumption is common to all literature referenced below, if not specified otherwise.
O ratio of the gaseous mixture. Hence, from now on it is assumed that at least CO2, CO, H2O and H2 are potentially present in the cathode compartment of the co-electrolysis cell. This minimum assumption is common to all literature referenced below, if not specified otherwise.
Consequently, a reaction mechanism needs to be specified. For example, all the admissible chemical and electrochemical reactions could be named in advance, as Broers and Treijtel14 did in their early study of carbon deposition in fuel cells. They assumed the presence of gaseous methane and solid carbon in addition to the minimum assumption. They also assumed the occurrence of the water-gas shift reaction,
| CO(g) + H2O(g) ⇌ CO2(g) + H2(g), | (3) |
| CH4(g) + H2O(g) ⇌ 3H2(g) + CO(g), | (4) |
| 2CO(g) ⇌ C(s) + CO2(g). | (5) |
The other option is to assume that all reactions, respecting mass balances, are admissible, as Sasaki and Teraoka did in ref. 15. They assumed the presence of ca. 300 gaseous compounds consisting of carbon, hydrogen, oxygen, and solid carbon. They minimized the Gibbs energy for a given C![[thin space (1/6-em)]](https://www.rsc.org/images/entities/char_2009.gif) :
:![[thin space (1/6-em)]](https://www.rsc.org/images/entities/char_2009.gif) H
H![[thin space (1/6-em)]](https://www.rsc.org/images/entities/char_2009.gif) :
:![[thin space (1/6-em)]](https://www.rsc.org/images/entities/char_2009.gif) O ratio, temperature and pressure in order to obtain the equilibrium concentrations. The detailed characterization of the C
O ratio, temperature and pressure in order to obtain the equilibrium concentrations. The detailed characterization of the C![[thin space (1/6-em)]](https://www.rsc.org/images/entities/char_2009.gif) :
:![[thin space (1/6-em)]](https://www.rsc.org/images/entities/char_2009.gif) H
H![[thin space (1/6-em)]](https://www.rsc.org/images/entities/char_2009.gif) :
:![[thin space (1/6-em)]](https://www.rsc.org/images/entities/char_2009.gif) O system equilibria provided in Sasaki and Teraoka's subsequent paper16 yielded the composition of the gaseous compounds with solid carbon, and the reversible potential dependency on temperature, pressure and the C
O system equilibria provided in Sasaki and Teraoka's subsequent paper16 yielded the composition of the gaseous compounds with solid carbon, and the reversible potential dependency on temperature, pressure and the C![[thin space (1/6-em)]](https://www.rsc.org/images/entities/char_2009.gif) :
:![[thin space (1/6-em)]](https://www.rsc.org/images/entities/char_2009.gif) H
H![[thin space (1/6-em)]](https://www.rsc.org/images/entities/char_2009.gif) :
:![[thin space (1/6-em)]](https://www.rsc.org/images/entities/char_2009.gif) O ratio. The reversible potential is evaluated for the air-filled anode at 1000 °C. Apart from this, no further electrochemical considerations were included in this study.
O ratio. The reversible potential is evaluated for the air-filled anode at 1000 °C. Apart from this, no further electrochemical considerations were included in this study.
In order to describe the co-electrolysis, an additional model of the electrochemical reactions is necessary. Then an overall energy balance is admissible and, for example, the thermoneutral voltage can be defined.
Assabumrungrat et al. thermodynamically investigated the possibility of carbon formation in a SOC using methanol injection.17 They assumed the presence of gaseous methanol and solid carbon over and above the defined minimum assumption. The hydrogen oxidation reaction (1) taking place is the only electrochemical reaction considered by the authors. In addition to this, they assumed the occurrence of the methanol decomposition reaction,
CH3OH(g) ⇌ 2H2(g) + CO(g)![[thin space (1/6-em)]](https://www.rsc.org/images/entities/char_2009.gif) , , | (6) |
| CO(g) + H2(g) ⇌ C(s) + H2O(g). | (7) |
Wendel and Pejman18 investigated the possibility of reversible solid oxide co-electrolysis cell operation with the assumed presence of CH4. They balanced the enthalpy change due to water vapor reduction (1) (as the only electrochemical step) along with the water gas shift reaction (3) and methane-steam reforming reaction (4). The change of enthalpy is recorded between two “equilibrium” states of the gaseous mixture specified by pressure, temperature, the C![[thin space (1/6-em)]](https://www.rsc.org/images/entities/char_2009.gif) :
:![[thin space (1/6-em)]](https://www.rsc.org/images/entities/char_2009.gif) H
H![[thin space (1/6-em)]](https://www.rsc.org/images/entities/char_2009.gif) :
:![[thin space (1/6-em)]](https://www.rsc.org/images/entities/char_2009.gif) O ratio and the amount of removed/added oxygen. Wendel et al.'s incomplete (missing) description of the procedure used to determine the equilibrium states of the gaseous mixtures makes it difficult to deduce whether this procedure allows for compatibility between the initial and the final equilibrium states. This also suggests that the proposed enthalpy balance based on the enthalpy change due to the three assumed reactions may not capture the full extent of the enthalpy change between the initial and the final state. The employed definition of the reversible potential is also disputable, since the reversible potential corresponds to a currentless, equilibrium state. In Wendel et al.'s study, the reversible potential was defined as the rate of change of Gibbs free energy divided by the electric current.
O ratio and the amount of removed/added oxygen. Wendel et al.'s incomplete (missing) description of the procedure used to determine the equilibrium states of the gaseous mixtures makes it difficult to deduce whether this procedure allows for compatibility between the initial and the final equilibrium states. This also suggests that the proposed enthalpy balance based on the enthalpy change due to the three assumed reactions may not capture the full extent of the enthalpy change between the initial and the final state. The employed definition of the reversible potential is also disputable, since the reversible potential corresponds to a currentless, equilibrium state. In Wendel et al.'s study, the reversible potential was defined as the rate of change of Gibbs free energy divided by the electric current.
Sun et al. investigated methods of synthetic hydrocarbon fuel production in a pressurized SOcoEC in ref. 10. They assumed methane and solid carbon to be present in the cathode compartment. The scrutinized reaction system contained reactions (1)–(3), the Boudouard reactions (5) and (7), and the carbon monoxide decomposition reaction,
 | (8) |
The above analysis of the state-of-the-art shows that, despite the intensive research, the thermodynamic description of the SOC is not satisfactory. The already published research constitutes a useful basis but further discussion is required. The main aims of this work are to support and augment the current knowledge, mainly by clarifying the admissible species and the equilibrium mechanism, together with a discussion of the admissible electrochemical steps and finally by providing a specification of the intended cell operation regime and the surroundings.
3 Equilibrium model
The physical reality of solid oxide cells is excruciatingly difficult; therefore, several assumptions defining the physical regime of the described cell are given in the paragraph below. These assumptions frame the scenario where the application of equilibrium thermodynamics is substantiated.It is assumed that the SOcoEC anode is filled with oxygen at a constant pressure and the cathode, the fuel electrode, is filled with an arbitrary mixture of hydrogen, water vapor, carbon dioxide and carbon monoxide at a constant total pressure.
3.1 Assumptions
The whole cell is assumed to be isothermal at a temperature T and a constant pressure p of the gaseous mixture is retained throughout the respective electrodes. The ionically conductive phase, that is, the electrolyte and the parts of the electrodes made of YSZ, is assumed to be an electric insulator. Open circuit conditions, i.e. the circuit connecting the electrodes in Fig. 1 is open, are assumed throughout the paper. Electrochemical potentials of charged species are assumed to be constant within the cell, and for the definition of the electrochemical potential see Subsection 4.2. Finally, the gradients of chemical potentials of gaseous species are assumed to be locally negligible.3.2 Corollaries
First, all electric currents, that is, the fluxes of oxide ions and electrons, are vanishing, although the electrochemical potentials of electrons in the respective electrodes are different.Secondly, as a consequence, any charged species produced due to an electrochemical reaction are instantly consumed in a parallel electrochemical reaction. For example, if carbon dioxide is being reduced,
| CO2 + 2e− ⇌ CO + O2− | (9) |
| H2 + O2− ⇌ H2O + 2e−, | (10) |
Ultimately, only chemical reactions of neutral species require being accounted for.
Macroscopically, the gaseous mixture in the electrode undergoes chemical reactions. The assumption of vanishing chemical potentials of the gaseous species could be interpreted in at least, two ways: either the electrode is not in contact with the mixture and the chemical equilibrium is attained or the gaseous mixture flows through the electrode in a way that the diffusion could be neglected and the gas is in a local chemical equilibrium.
The above outlined reduction of the cell dynamics to a level of equilibrium thermodynamics could be viewed as the separation of three different time scales: relaxation of charged species, relaxation of electrochemical reactions and relaxation of chemical reactions. The mode of transport of gaseous species is assumed so that it can be neglected.
As a consequence, the use of equilibrium thermodynamics is justified.
3.3 Model description
The following process is modeled: a mixture of N gaseous species with a given initial molar composition ninitg = (ninit1,…,ninitN) is in contact with solid carbon ninitC and this mixture is kept under constant pressure p and temperature T until the mixture reaches the equilibrium composition neq = (neqg, neqC) given by the Gibbs energy minimum of the mixture.The Gibbs energy of such a mixture can be written as
 | (11) |
 | (12) |
 | (13) |
Solid carbon is assumed, besides the chemical reactions, not to interact with the gaseous mixture. Hence, the carbon chemical potential does not depend on the pressure and the mixture composition. Conversely, the chemical potentials of gases do not depend on the moles of the carbon atoms. This means that μC(T) only depends on the temperature. Thus the influence of the boundary between the gaseous phase and solid carbon is neglected and the model cannot, in principle, capture the complicated reality of carbon formation in a real SOC cathode, where the geometry of carbon soot whiskers‡ and different carbon forms, see ref. 20 and 21, should be taken into account. The finally employed form of the Gibbs energy reads as
 | (14) |
| Compound | Phase | #C | #H | #O |
|---|---|---|---|---|
| Molecular hydrogen H2 | G | 0 | 2 | 0 |
| Molecular oxygen O2 | G | 0 | 0 | 2 |
| Water vapor H2O | G | 0 | 2 | 1 |
| Carbon dioxide CO2 | G | 1 | 0 | 2 |
| Carbon monoxide CO | G | 1 | 0 | 1 |
| Methane CH4 | G | 1 | 4 | 0 |
| Formic acid HCOOH | G | 1 | 2 | 2 |
| Formaldehyde CH2O | G | 1 | 2 | 1 |
| Methanol CH3OH | G | 1 | 4 | 1 |
| Ethane C2H6 | G | 2 | 6 | 0 |
| Ethene C2H4 | G | 2 | 4 | 0 |
| Carbon C (graphite) | S | 1 | 0 | 0 |
| a: = (aC, aH, aO) = M(ninitg, ninitC)T, | (15) |
The element matrix M is defined according to Table 1. The element vector a contains information about the amount of elements in the cathode and, due to the conservation of mass, remains constant during the minimization of G.
4 Results
The equilibrium composition of the mixture predicted by the model depends only on the C![[thin space (1/6-em)]](https://www.rsc.org/images/entities/char_2009.gif) :
:![[thin space (1/6-em)]](https://www.rsc.org/images/entities/char_2009.gif) H
H![[thin space (1/6-em)]](https://www.rsc.org/images/entities/char_2009.gif) :
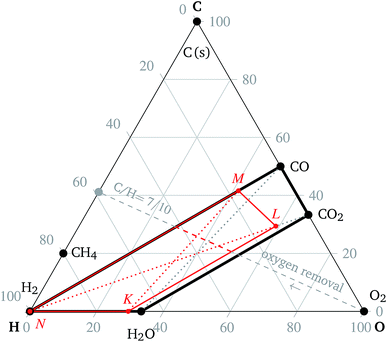
:![[thin space (1/6-em)]](https://www.rsc.org/images/entities/char_2009.gif) O ratio, which is normalized element vector a, see eqn (15), temperature and pressure, but not on the particular mixture composition. It is, therefore, advantageous to render the minimization results in the form of ternary diagrams, see Fig. 2.
O ratio, which is normalized element vector a, see eqn (15), temperature and pressure, but not on the particular mixture composition. It is, therefore, advantageous to render the minimization results in the form of ternary diagrams, see Fig. 2.
The value of the C![[thin space (1/6-em)]](https://www.rsc.org/images/entities/char_2009.gif) :
:![[thin space (1/6-em)]](https://www.rsc.org/images/entities/char_2009.gif) H
H![[thin space (1/6-em)]](https://www.rsc.org/images/entities/char_2009.gif) :
:![[thin space (1/6-em)]](https://www.rsc.org/images/entities/char_2009.gif) O ratio is not the sole factor determining the composition of the mixture. In order to illustrate the relationship between the ternary diagram and co-electrolysis, for the remainder of this paragraph only mixtures usually used for co-electrolysis are assumed: mixtures of water vapor, carbon dioxide and hydrogen. The mixtures listed below are not necessarily in equilibrium. The C
O ratio is not the sole factor determining the composition of the mixture. In order to illustrate the relationship between the ternary diagram and co-electrolysis, for the remainder of this paragraph only mixtures usually used for co-electrolysis are assumed: mixtures of water vapor, carbon dioxide and hydrogen. The mixtures listed below are not necessarily in equilibrium. The C![[thin space (1/6-em)]](https://www.rsc.org/images/entities/char_2009.gif) :
:![[thin space (1/6-em)]](https://www.rsc.org/images/entities/char_2009.gif) H
H![[thin space (1/6-em)]](https://www.rsc.org/images/entities/char_2009.gif) :
:![[thin space (1/6-em)]](https://www.rsc.org/images/entities/char_2009.gif) O ratios corresponding to mixtures of H2O with CO2, and of H2 with CO are denoted by solid black line segments in Fig. 2. The region delimited by solid black lines in Fig. 2 represents the C
O ratios corresponding to mixtures of H2O with CO2, and of H2 with CO are denoted by solid black line segments in Fig. 2. The region delimited by solid black lines in Fig. 2 represents the C![[thin space (1/6-em)]](https://www.rsc.org/images/entities/char_2009.gif) :
:![[thin space (1/6-em)]](https://www.rsc.org/images/entities/char_2009.gif) H
H![[thin space (1/6-em)]](https://www.rsc.org/images/entities/char_2009.gif) :
:![[thin space (1/6-em)]](https://www.rsc.org/images/entities/char_2009.gif) O ratios of all mixtures of H2, H2O, CO and CO2 and is referred to as the co-electrolysis region in the rest of the article. In particular, the black dotted line segments denote the C
O ratios of all mixtures of H2, H2O, CO and CO2 and is referred to as the co-electrolysis region in the rest of the article. In particular, the black dotted line segments denote the C![[thin space (1/6-em)]](https://www.rsc.org/images/entities/char_2009.gif) :
:![[thin space (1/6-em)]](https://www.rsc.org/images/entities/char_2009.gif) H
H![[thin space (1/6-em)]](https://www.rsc.org/images/entities/char_2009.gif) :
:![[thin space (1/6-em)]](https://www.rsc.org/images/entities/char_2009.gif) O ratios corresponding to the mixtures of H2 with CO2, and of H2O with CO, respectively.
O ratios corresponding to the mixtures of H2 with CO2, and of H2O with CO, respectively.
Note the particular mixture of CO2 and H2O and the corresponding C![[thin space (1/6-em)]](https://www.rsc.org/images/entities/char_2009.gif) :
:![[thin space (1/6-em)]](https://www.rsc.org/images/entities/char_2009.gif) H
H![[thin space (1/6-em)]](https://www.rsc.org/images/entities/char_2009.gif) :
:![[thin space (1/6-em)]](https://www.rsc.org/images/entities/char_2009.gif) O ratio in Fig. 2. If all carbon dioxide in such a mixture is replaced by carbon monoxide, e.g. via the reduction reaction (9), the new resulting mixture will lie on the intersection of the line segment connecting CO and H2O and the oxygen removal line with the corresponding C/H ratio. Conversely, if all water vapor is replaced by hydrogen, e.g. via the reduction reaction (10), then the resulting C
O ratio in Fig. 2. If all carbon dioxide in such a mixture is replaced by carbon monoxide, e.g. via the reduction reaction (9), the new resulting mixture will lie on the intersection of the line segment connecting CO and H2O and the oxygen removal line with the corresponding C/H ratio. Conversely, if all water vapor is replaced by hydrogen, e.g. via the reduction reaction (10), then the resulting C![[thin space (1/6-em)]](https://www.rsc.org/images/entities/char_2009.gif) :
:![[thin space (1/6-em)]](https://www.rsc.org/images/entities/char_2009.gif) H
H![[thin space (1/6-em)]](https://www.rsc.org/images/entities/char_2009.gif) :
:![[thin space (1/6-em)]](https://www.rsc.org/images/entities/char_2009.gif) O ratio will lie on the intersection of the line segment connecting H2 and CO2 and the corresponding oxygen removal line. If both H2O and CO2 are replaced by H2 and CO, respectively, the resulting C
O ratio will lie on the intersection of the line segment connecting H2 and CO2 and the corresponding oxygen removal line. If both H2O and CO2 are replaced by H2 and CO, respectively, the resulting C![[thin space (1/6-em)]](https://www.rsc.org/images/entities/char_2009.gif) :
:![[thin space (1/6-em)]](https://www.rsc.org/images/entities/char_2009.gif) H
H![[thin space (1/6-em)]](https://www.rsc.org/images/entities/char_2009.gif) :
:![[thin space (1/6-em)]](https://www.rsc.org/images/entities/char_2009.gif) O ratio will be given by the intersection of the line segment connecting H2 and CO with the corresponding oxygen removal line. In principle, the process of co-electrolysis removes oxygen from the gaseous mixture, whilst the ratio of atomic carbon and hydrogen remains constant. Such points are represented by line segments beginning at point O2. The action of the electrochemical steps (9) and (10) cannot be distinguished in the ternary diagram. The trapezoid
O ratio will be given by the intersection of the line segment connecting H2 and CO with the corresponding oxygen removal line. In principle, the process of co-electrolysis removes oxygen from the gaseous mixture, whilst the ratio of atomic carbon and hydrogen remains constant. Such points are represented by line segments beginning at point O2. The action of the electrochemical steps (9) and (10) cannot be distinguished in the ternary diagram. The trapezoid  , marked by the red solid lines in Fig. 2, represents all possible mixtures of H2, H2O, CO2 and CO, supplemented by 20% hydrogen gas, which might be the case in applications.
The co-electrolysis region in the ternary diagram is defined as the trapezoid given by vertices corresponding to H2O, CO2, CO and H2, see Fig. 2 and the oxidation region as the triangle given by vertices corresponding to O2, H2O and CO2, see Fig. 2.
4.1 Temperature and pressure effects on equilibrium composition
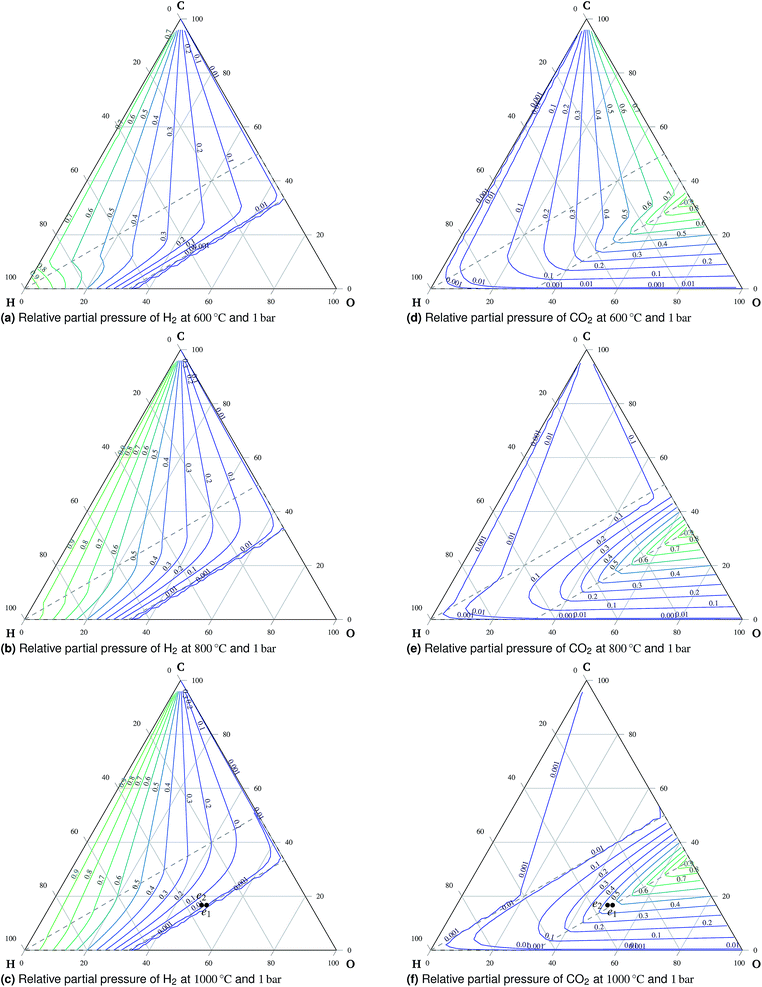
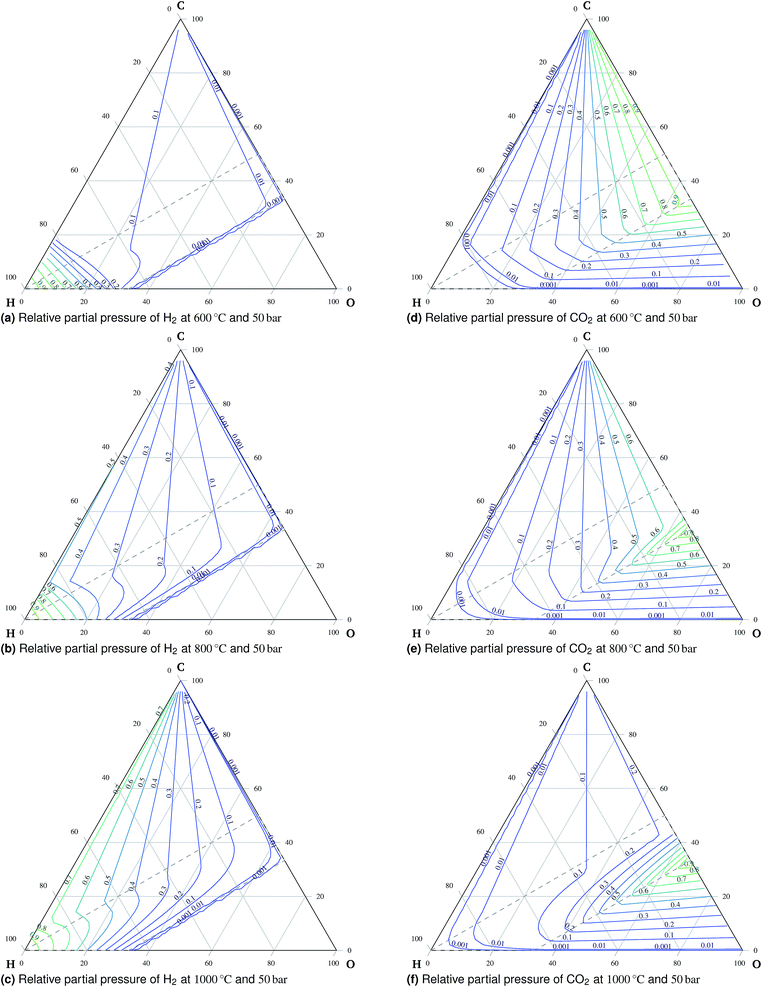
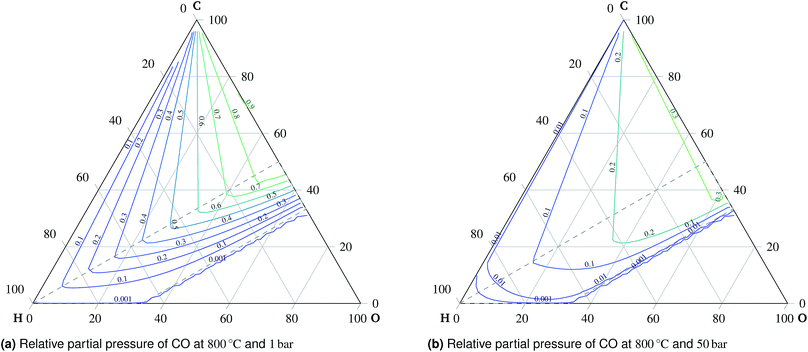
A total of 11 species and oxygen, see Table 1, were admitted to be potentially present in the equilibrated gaseous mixture in the cathode compartment. The conditions investigated ranged from 600 °C to 1000 °C and from 1 bar to 50 bar. The following species do not appear in these condition ranges in the equilibrium: methanol, formaldehyde, formic acid, ethane, ethene and oxygen. This finding is in agreement with Sasaki's results.16 The main trends of mixture behavior are described in the following paragraphs. The ternary diagrams of H2O and additional ternary diagrams of CO and CH4 are presented in the ESI.†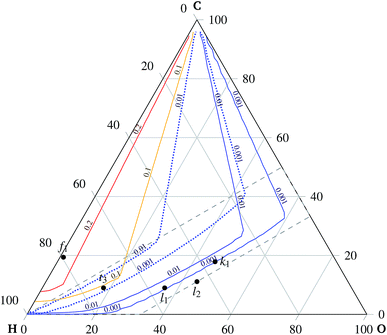 | ||
| Fig. 5 Partial pressure of CH4 in the gaseous mixture at 1 bar. Dotted lines denote 800 °C and solid lines 600 °C. | ||
![[thin space (1/6-em)]](https://www.rsc.org/images/entities/char_2009.gif) :
:![[thin space (1/6-em)]](https://www.rsc.org/images/entities/char_2009.gif) H
H![[thin space (1/6-em)]](https://www.rsc.org/images/entities/char_2009.gif) :
:![[thin space (1/6-em)]](https://www.rsc.org/images/entities/char_2009.gif) O ratio is in the oxidation region, carbon is present exclusively in the form of carbon dioxide. An important observation is the preference of carbon monoxide over carbon dioxide at high temperatures outside the oxidation region, which means that carbon monoxide is stable if formed there. Therefore, carbon monoxide will remain in the gaseous mixture once formed during co-electrolysis, see Fig. 6. This is mainly the case at higher temperatures and atmospheric pressure due to the effects of reaction (3).
O ratio is in the oxidation region, carbon is present exclusively in the form of carbon dioxide. An important observation is the preference of carbon monoxide over carbon dioxide at high temperatures outside the oxidation region, which means that carbon monoxide is stable if formed there. Therefore, carbon monoxide will remain in the gaseous mixture once formed during co-electrolysis, see Fig. 6. This is mainly the case at higher temperatures and atmospheric pressure due to the effects of reaction (3).
Torrell et al.24 observed continuous conversion of a H2O![[thin space (1/6-em)]](https://www.rsc.org/images/entities/char_2009.gif) :
:![[thin space (1/6-em)]](https://www.rsc.org/images/entities/char_2009.gif) CO2 = 1
CO2 = 1![[thin space (1/6-em)]](https://www.rsc.org/images/entities/char_2009.gif) :
:![[thin space (1/6-em)]](https://www.rsc.org/images/entities/char_2009.gif) 1 mixture into approximately H2O
1 mixture into approximately H2O![[thin space (1/6-em)]](https://www.rsc.org/images/entities/char_2009.gif) :
:![[thin space (1/6-em)]](https://www.rsc.org/images/entities/char_2009.gif) CO2
CO2![[thin space (1/6-em)]](https://www.rsc.org/images/entities/char_2009.gif) :
:![[thin space (1/6-em)]](https://www.rsc.org/images/entities/char_2009.gif) H2
H2![[thin space (1/6-em)]](https://www.rsc.org/images/entities/char_2009.gif) :
:![[thin space (1/6-em)]](https://www.rsc.org/images/entities/char_2009.gif) CO = 22
CO = 22![[thin space (1/6-em)]](https://www.rsc.org/images/entities/char_2009.gif) :
:![[thin space (1/6-em)]](https://www.rsc.org/images/entities/char_2009.gif) 22
22![[thin space (1/6-em)]](https://www.rsc.org/images/entities/char_2009.gif) :
:![[thin space (1/6-em)]](https://www.rsc.org/images/entities/char_2009.gif) 2
2![[thin space (1/6-em)]](https://www.rsc.org/images/entities/char_2009.gif) :
:![[thin space (1/6-em)]](https://www.rsc.org/images/entities/char_2009.gif) 1 during co-electrolysis in a symmetric cell with a LaSrCrMnO electrode at 900 °C while the applied current density was 150 A cm−2. The initial and the final composition are denoted as e1 and e2, respectively, in Fig. 3c and f. The existence of H2 is clearly favored for the final composition of the mixture as predicted by the model.¶
1 during co-electrolysis in a symmetric cell with a LaSrCrMnO electrode at 900 °C while the applied current density was 150 A cm−2. The initial and the final composition are denoted as e1 and e2, respectively, in Fig. 3c and f. The existence of H2 is clearly favored for the final composition of the mixture as predicted by the model.¶
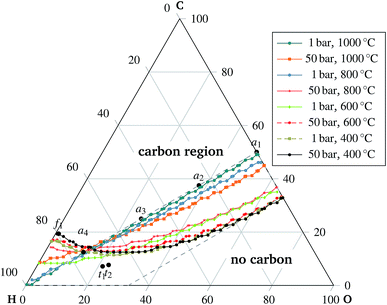 | ||
| Fig. 7 Carbon deposition. The curves indicate, for the given temperature and pressure, the predicted border of the carbon formation region and the carbon-free region. The curves indicate the contour of 0.001 moles of carbon. The co-electrolysis region is delimited by the dashed line, cf.Fig. 2. | ||
Experimental observations of solid carbon formation confirming the presented results were reported in ref. 25–30. First, the mixtures of carbon dioxide and carbon monoxide (no hydrogen) were prone to carbon deposition as shown in ref. 25 for a 1![[thin space (1/6-em)]](https://www.rsc.org/images/entities/char_2009.gif) :
:![[thin space (1/6-em)]](https://www.rsc.org/images/entities/char_2009.gif) 1 mixture at 700 °C discharging at 0.7 V. Direct methane decomposition led to carbon deposition onto an electrode in ref. 26 under OCV conditions at 1000 °C. Electrolysis of mixtures with a higher C/H ratio was also reportedly a source of electrode carbonization as in ref. 27. Mixtures of H2 and CO, i.e. points a2, a3, and a4 indicated in Fig. 7, were studied under open circuit and mild anodic polarization (10 mA cm−2) conditions. Both regimes revealed the highest share of deposited carbon for a 1
1 mixture at 700 °C discharging at 0.7 V. Direct methane decomposition led to carbon deposition onto an electrode in ref. 26 under OCV conditions at 1000 °C. Electrolysis of mixtures with a higher C/H ratio was also reportedly a source of electrode carbonization as in ref. 27. Mixtures of H2 and CO, i.e. points a2, a3, and a4 indicated in Fig. 7, were studied under open circuit and mild anodic polarization (10 mA cm−2) conditions. Both regimes revealed the highest share of deposited carbon for a 1![[thin space (1/6-em)]](https://www.rsc.org/images/entities/char_2009.gif) :
:![[thin space (1/6-em)]](https://www.rsc.org/images/entities/char_2009.gif) 3 ratio of H2 to CO, see point a4 in Fig. 7, decreasing with increasing concentration of hydrogen. The amount of deposited carbon was slightly lower for the polarized case. A considerable carbon deposition under OCV conditions is observed for pure CO in ref. 27 at 800 °C and in ref. 30 for a mixture of 0.004% CO and 99.996% N2 at 600 °C, whereas there is no carbon deposition at 700 °C.
3 ratio of H2 to CO, see point a4 in Fig. 7, decreasing with increasing concentration of hydrogen. The amount of deposited carbon was slightly lower for the polarized case. A considerable carbon deposition under OCV conditions is observed for pure CO in ref. 27 at 800 °C and in ref. 30 for a mixture of 0.004% CO and 99.996% N2 at 600 °C, whereas there is no carbon deposition at 700 °C.
An extensive carbon deposition under OCV conditions is observed in ref. 29 for both dry CH4 and a mixture of CH4![[thin space (1/6-em)]](https://www.rsc.org/images/entities/char_2009.gif) :
:![[thin space (1/6-em)]](https://www.rsc.org/images/entities/char_2009.gif) H2O = 19.3
H2O = 19.3![[thin space (1/6-em)]](https://www.rsc.org/images/entities/char_2009.gif) :
:![[thin space (1/6-em)]](https://www.rsc.org/images/entities/char_2009.gif) 1 at 600 °C for a Ni-YSZ porous electrode, see Fig. 7 point f1. The deposition is diminished, though not eliminated, by 1 wt.% Mo doping.
1 at 600 °C for a Ni-YSZ porous electrode, see Fig. 7 point f1. The deposition is diminished, though not eliminated, by 1 wt.% Mo doping.
No carbon deposition is reported for pure carbon monoxide inlet gas under mild anodic polarization at 800 °C for 50 mA cm−2 in ref. 25 and 10 mA cm−2 in ref. 27. Although the model predicts carbon deposition for pure carbon monoxide, see point a1 in Fig. 7, the mild polarization could lead to non-equilibrium conditions. Experimental evidence suggests that the kinetics of the carbon monoxide disproportionation reaction (5) on a nickel surface is slower than the rate of the carbon monoxide reduction reaction (7), as reported in ref. 27. The kinetic constant of reaction (5) is reportedly ten times smaller than the kinetic constant of reaction (7). Hence, the equilibrium might not have been attained in this case. The presented thermodynamics model fails to replicate the observed carbon deposition reported in ref. 26, studied under conditions of steam reforming of C2H6 and C2H4, indicated by points t1 and t2 in Fig. 7, respectively. Moreover the experimental work26 reports different behaviors of the solid carbon phase for different alkali metal dopings. Therefore, this points to the conclusion that the thermodynamic equilibrium might not have been attained in this case either.
All the presented experimental studies were performed with an atmospheric pressure with occasional introduction of an inert gas.
The formation of stable methane during electrolysis of the mixture of CO2, H2O, and H2 at 650 °C under open circuit conditions, see point l1 indicated in Fig. 5, is in agreement with the model prediction reported in ref. 31. The assessment of quantitative agreement is not possible due to certain discrepancies in ref. 31. Moreover, no methane is detected in ref. 31 for the mixture of the same type indicated by point l2 in Fig. 5, which also agrees with the model prediction. In accordance with the prediction, the findings presented in ref. 32 show negligible methane formation during co-electrolysis of a H2O–CO2-rich mixture with H2 and CO at temperatures around 800 °C and 1.8 V, using helium as an inert gas halving the effective partial pressure of the active components, see point k1 in Fig. 5. The temperature-increasing conversion of steam-reformed methane reported in ref. 26 agrees with the trend of methane stability shown by the modeling results. The reported methane conversion is more than 99% at 800 °C, see point t3 indicated in Fig. 5.
The stable presence of methane is observed by Finnerty et al.29 for both dry CH4 and a mixture of CH4![[thin space (1/6-em)]](https://www.rsc.org/images/entities/char_2009.gif) :
:![[thin space (1/6-em)]](https://www.rsc.org/images/entities/char_2009.gif) H2O = 19.3
H2O = 19.3![[thin space (1/6-em)]](https://www.rsc.org/images/entities/char_2009.gif) :
:![[thin space (1/6-em)]](https://www.rsc.org/images/entities/char_2009.gif) 1 at 600 °C, see Fig. 5 point f1. This is in agreement with the model prediction. They report greater selectivity towards CO in the case of humidified CH4.
1 at 600 °C, see Fig. 5 point f1. This is in agreement with the model prediction. They report greater selectivity towards CO in the case of humidified CH4.
4.2 Open circuit potential
The mixture is assumed to be in equilibrium, and hence the overall rates of all chemical and electrochemical reactions vanish. This is equivalent to the vanishing electrochemical affinities of the respective reactions. The electrochemical potential of a charged species is defined as![[small mu, Greek, tilde]](https://www.rsc.org/images/entities/i_char_e0e0.gif) = μ + zFφ, = μ + zFφ, | (16) |
 | (17) |
 | (18) |
 | (19) |
In eqn (18), the symbol μO2 denotes the chemical potential of oxygen at the anode, whereas μH2 and μH2O stand for the chemical potential of hydrogen and water vapor in the cathode, respectively. The assumed ideal gas approximation, see eqn (13), is used to derive eqn (19). The open circuit potential plots are shown in Fig. 8 for temperatures 600 °C, 800 °C and 1000 °C, and pressures 1 bar and 50 bar. Temperature dependence in the range studied is similar to that observed in the case of hydrogen fuel cells: the lower the temperature, the higher the OCP due to the increasing Gibbs free energy of the water vapor formation. Increasing the total pressure leads to an increase in OCP, and hence the partial pressure of oxygen in eqn (19) has a higher impact than the change in composition. The temperature dependence is altered by high pressure as well. As shown in Fig. 8 the OCP depends on the initial composition of the gaseous mixture in the cathode. Hence the OCP could be lowered by selecting a specific composition of the inlet gas at high temperatures.
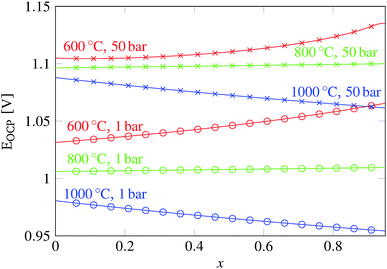 | ||
| Fig. 8 Plot of the open circuit potential computed according to eqn (19) for the gas mixture with an initial composition xCO2 + (1 − x) H2O + 0.05H2 and 0.21O2 + 0.79N2 at the oxygen electrode. The value of the pressure at the oxygen counter-electrode is assumed to be the same as the total pressure in the fuel electrode. | ||
5 Conclusion
The presented model aims to describe the behavior of gases and carbon in the cathode of a solid oxide co-electrolysis cell close to and in equilibrium.The obtained results are relevant to all parts of the SOEC/SOFC where the conditions allow the chemical equilibrium to be reached. This is the case whenever the composition of the mixture changes mainly due to the assumed reactions and effects of the other phenomena, for example, in the case that electron-transfer reactions and diffusion are negligible. This may hold true, for instance at the cell/stack entrance and outlet, but also locally inside the pores of the electrode where the electron-transfer reaction is, for some reason, limited.
For the sake of simplicity and due to lack of experimental data, the model takes into account the ideal behavior of the gaseous species and their mutual interactions. Only the graphite form of carbon was considered as a solid component in the cathode. The different types of solid carbon appearing in the SOCc fuel electrode were neglected due to the lack of reliable experimental data, see ref. 20. The key advantage of the model is the chemical reaction mechanism adopted which permits all stoichiometric chemical reactions to be taken into account. A comprehensive comparison of the model prediction with the experimental data is difficult due to the magnitude of possible C![[thin space (1/6-em)]](https://www.rsc.org/images/entities/char_2009.gif) :
:![[thin space (1/6-em)]](https://www.rsc.org/images/entities/char_2009.gif) H
H![[thin space (1/6-em)]](https://www.rsc.org/images/entities/char_2009.gif) :
:![[thin space (1/6-em)]](https://www.rsc.org/images/entities/char_2009.gif) O ratios and their realization with different compounds.
O ratios and their realization with different compounds.
The predicted carbon formation at ambient pressure is in agreement with the presented experimental results when the assumed gaseous mixture falls in the carbon deposition region given by the line connecting pure hydrogen and carbon monoxide in the ternary diagram, with the exception of pure carbon monoxide itself. The predicted carbon formation deviates at high pressures from the line connecting CO and H2 at a low C/H ratio.
The absence of the solid carbon phase is, as expected, evident if the C![[thin space (1/6-em)]](https://www.rsc.org/images/entities/char_2009.gif) :
:![[thin space (1/6-em)]](https://www.rsc.org/images/entities/char_2009.gif) H
H![[thin space (1/6-em)]](https://www.rsc.org/images/entities/char_2009.gif) :
:![[thin space (1/6-em)]](https://www.rsc.org/images/entities/char_2009.gif) O mixture ratio falls behind the line of stoichiometric oxidation of carbon and hydrogen, the line connecting water vapor and carbon dioxide. Here the model failed to predict the observed carbon formation, see the points t2 and t3 indicated in Fig. 7. The model prediction of methane equilibrium behavior within the above-mentioned region shows a fair agreement with the experimental results. Thus a significant, direct, methane formation inside the SOC cell is possible either at significantly elevated pressure or at a low temperature.
O mixture ratio falls behind the line of stoichiometric oxidation of carbon and hydrogen, the line connecting water vapor and carbon dioxide. Here the model failed to predict the observed carbon formation, see the points t2 and t3 indicated in Fig. 7. The model prediction of methane equilibrium behavior within the above-mentioned region shows a fair agreement with the experimental results. Thus a significant, direct, methane formation inside the SOC cell is possible either at significantly elevated pressure or at a low temperature.
The discrepancies between the model prediction and the kinetic experiment may have occurred due to insufficient relaxation to equilibrium. This also includes kinetic limitations and gas transport limitations.
The developed model is principally in good agreement with the available experimental data and therefore represents a foundation for the subsequent step to be undertaken, i.e. evaluation of the cathodic reaction kinetics on the basis of kinetic experiments.
Conflicts of interest
There are no conflicts to declare.Acknowledgements
This project received funding from the Fuel Cells and Hydrogen 2 Joint Undertaking under grant agreement No. 671481. This Joint Undertaking receives support from the European Union's Horizon 2020 research and innovation programme, Hydrogen Europe and Hydrogen Europe research. PV gratefully acknowledges partial support through grant SVV-2017-260455.Notes and references
- B. Steele and A. Heinzel, Nature, 2001, 414, 345–352 CrossRef CAS PubMed
.
- A. B. Stambouli and E. Traversa, Renewable Sustainable Energy Rev., 2002, 6, 433–455 CrossRef CAS
.
- J. T. S. Irvine, D. Neagu, M. C. Verbraeken, C. Chatzichristodoulou, C. Graves and M. B. Mogensen, Nat. Energy, 2016, 1, 15014 CrossRef CAS
.
- M. P. Carpanese, D. Clematis, A. Bertei, A. Giuliano, A. Sanson, E. Mercadelli, C. Nicolella and A. Barbucci, Solid State Ionics, 2017, 301, 106–115 CrossRef CAS
.
- A. Bertei, M. Carpanese, D. Clematis, A. Barbucci, M. Bazant and C. Nicolella, Solid State Ionics, 2017, 303, 181–190 CrossRef CAS
.
- S. Y. Gómez and D. Hotza, Renewable Sustainable Energy Rev., 2016, 62, 155–174 CrossRef
.
- Y. Zheng, J. Wang, B. Yu, W. Zhang, J. Chen, J. Qiao and J. Zhang, Chem. Soc. Rev., 2017, 46, 1427–1463 RSC
.
- C. Graves, S. D. Ebbesen and M. Mogensen, Solid State Ionics, 2011, 192, 398–403 CrossRef CAS
.
- Y. Tao, S. D. Ebbesen and M. Mogensen, ECS Trans., 2013, 50, 139–151 CrossRef
.
- X. Sun, M. Chen, S. H. Jensen, S. D. Ebbesen, C. Graves and M. Mogensen, Int. J. Hydrogen Energy, 2012, 37, 17101–17110 CrossRef CAS
.
- J. Rostrup-Nielsen and D. L. Trimm, J. Catal., 1977, 48, 155–165 CrossRef CAS
.
-
S. R. de Groot and P. Mazur, Non-equilibrium Thermodynamics, Dover Publications, New York, 1984 Search PubMed
.
-
J. Waldram, The Theory of Thermodynamics, Cambridge University Press, 1985 Search PubMed
.
- G. Broers and B. Treijtel, Adv. Energy Convers., 1965, 5, 365–382 CrossRef CAS
.
- K. Sasaki and Y. Teraoka, J. Electrochem. Soc., 2003, 150, A878–A884 CrossRef CAS
.
- K. Sasaki and Y. Teraoka, J. Electrochem. Soc., 2003, 150, A885–A888 CrossRef CAS
.
- S. Assabumrungrat, N. Laosiripojana, V. Pavarajarn, W. Sangtongkitcharoen, A. Tangjitmatee and P. Praserthdam, J. Power Sources, 2005, 139, 55–60 CrossRef CAS
.
- C. H. Wendel, P. Kazempoor and R. J. Braun, J. Power Sources, 2016, 301, 93–104 CrossRef CAS
.
- T. Devin, M. Schwager and W. Mérida, J. Power Sources, 2014, 269, 424–429 CrossRef
.
- D. Chen, R. Lødeng, A. Anundskås, O. Olsvik and A. Holmen, Chem. Eng. Sci., 2001, 56, 1371–1379 CrossRef CAS
.
- Z. Jaworski, B. Zakrzewska and P. Pianko-Oprych, Rev. Chem. Eng., 2017, 33, 217–235 CAS
.
-
M. W. Chase, NIST-JANAF Thermochemical Tables, Data reported in NIST standard reference database 69, June 2005 release: NIST Chemistry WebBook, J. Phys. Chem. Ref. Data, Monograph 9, 1998, pp. 1–1951 Search PubMed
.
-
NASA and CEA, NASA computer program for calculating of the Chemical Equilibrium with Applications, NASA Glenn Research Center, Cleveland, OH, 2015 Search PubMed
.
- M. Torrell, S. García-Rodríguez, A. Morata, G. Penelas and A. Tarancón, Faraday Discuss., 2015, 182, 241–255 RSC
.
- Y. Shi, Y. Luo, N. Cai, J. Qian, S. Wang, W. Li and H. Wang, Electrochim. Acta, 2013, 88, 644–653 CrossRef CAS
.
- T. Takeguchi, Y. Kani, T. Yano, R. Kikuchi, K. Eguchi, K. Tsujimoto, Y. Uchida, A. Ueno, K. Omoshiki and M. Aizawa, J. Power Sources, 2002, 112, 588–595 CrossRef CAS
.
- V. Alzate-Restrepo and J. M. Hill, J. Power Sources, 2010, 195, 1344–1351 CrossRef CAS
.
- L. Z. Bian, Z. Y. Chen, L. J. Wang, F. S. Li and K. C. Chou, Int. J. Hydrogen Energy, 2017, 42, 14246–14252 CrossRef CAS
.
- C. M. Finnerty, N. J. Coe, R. H. Cunningham and R. M. Ormerod, Catal. Today, 1998, 46, 137–145 CrossRef CAS
.
- J. Kuhn and O. Kesler, J. Power Sources, 2014, 246, 430–437 CrossRef CAS
.
- W. Li, H. Wang, Y. Shi and N. Cai, Int. J. Hydrogen Energy, 2013, 38, 11104–11109 CrossRef CAS
.
- L. Kleiminger, T. Li, K. Li and G. Kelsall, Electrochim. Acta, 2015, 179, 565–577 CrossRef CAS
.
- M. Pavelka and F. Maršík, Int. J. Hydrogen Energy, 2013, 38, 7102–7113 CrossRef CAS
.
- M. Pavelka, F. Wandschneider and P. Mazur, J. Power Sources, 2015, 293, 400–408 CrossRef CAS
.
- P. Vágner, M. Pavelka and F. Maršík, J. Non-Equilib. Thermodyn., 2017, 42, 201–216 Search PubMed
.
Footnotes |
| † Electronic supplementary information (ESI) available. See DOI: 10.1039/c9se00030e |
| ‡ Thin, intertwined, graphite fibers. |
| § The reactions change the moles ninit into neq, i.e., the reactions act on the quantity. |
| ¶ The ternary diagrams of CO are contained in the ESI. |
| This journal is © The Royal Society of Chemistry 2019 |

