 Open Access Article
A “Double-Locked” and enzyme-activated molecular probe for accurate bioimaging and hepatopathy differentiation†
Yongchao
Liu
,
Lili
Teng
,
Chengyan
Xu
,
Hong-Wen
Liu
 ,
Shuai
Xu
,
Haowei
Guo
,
Lin
Yuan
,
Shuai
Xu
,
Haowei
Guo
,
Lin
Yuan
 and
Xiao-Bing
Zhang
 *
*
State Key Laboratory of Chemo/Biosensing and Chemometrics, College of Chemistry and Chemical Engineering, Collaborative Innovation Center for Chemistry and Molecular Medicine, Hunan University, Changsha, 410082, P. R. China. E-mail: xbzhang@hnu.edu.cn
First published on 16th October 2019
Abstract
Molecular probes activated by a single enzyme have been extensively used in bioimaging and disease diagnosis; however, imaging and identification in an accurate manner remains a challenge for such probes. Here, based on the specificity of enzyme recognition, we engineered a “double-locked” and enzyme-activated molecular probe (NML) for accurate bioimaging and hepatopathy differentiation. Triggered by the successive reactions with leucine aminopeptidase (LAP, first “key”) and monoamine oxidase (MAO, second “key”), the emissive fluorophore (NF) was released. NML can be activated only in the presence of both LAP and MAO and can be silenced when either enzyme is inhibited. Benefiting from the “double-locked” strategy, NML showed higher accuracy for imaging of drug-induced liver injury (DILI) than the “single-locked” probe. With serum testing, NML showed significant differences in mouse models of both CCl4-induced liver cirrhosis and DILI. Significantly, NML can be applied to accurately distinguish serum samples from clinical patients with different hepatopathies. Our smart molecular probe may hold great potential for hepatopathy diagnosis and clinical transformation.
Introduction
Hepatopathy encompasses hepatitis and cirrhosis which are major afflictions across the globe resulting in a high annual mortality rate.1 This alarming statistic appears to stem from an inability to accurately diagnose and differentiate these diseases at an early stage. In fact, hepatopathy in its early stages is often symptomatically generalized, thus limiting reliable identification of the type of hepatopathy in hand. Currently, standard diagnostic methods for hepatopathy detection, such as histopathology or molecular medical imaging, are usually ineffective in the middle and late stages of the disease, leading to delayed diagnosis and the resultant elevated mortality.2 Therefore, it would be desirable to develop a simple and convenient tool able to assist in the accurate visual bioimaging and diagnosis as well as differentiation of different liver disorders at an early stage.Serum testing has become an important procedure for the clinical diagnosis of hepatopathy due to its high efficiency.3 However, the current clinical detection methods of markers in serum, such as radiological and immunological methods, are often characterized by high detection thresholds and false positives.4 Fluorescence-based molecular imaging, on the other hand, with its excellent spatiotemporal sampling capabilities, holds great promise for diagnosis and imaging of hepatopathy because of its high sensitivity and noninvasiveness.5 In particular, a combination of serum testing and in vivo molecular fluorescence imaging would be expected to deliver simplicity and reliability. Many hepatopathy models overexpress biomarkers of interest, including enzymes, which have become particularly important owing to their high specificity.6 Of course, detection of these enzymes requires the availability of imaging probes acting as artificial substrates. In the past few years, activatable molecular probes have been extensively applied for selective activation by only one enzyme known to be upregulated in diseased tissues.7 However, using only one marker as a criterion for the diagnosis of hepatopathy runs the risk of misdiagnosis, as a false positive signal might also be observed in healthy tissue.8 Application of a probe responding to just one enzymatic biomarker might therefore turn out to be unsatisfactory. To overcome this problem, the addition of a second selection criterion might be the best choice. Importantly, due to successive cleavage by two enzymes, the probe may show a lower background fluorescence when the two enzymes are less expressed, which makes it more accurate in the field of bioimaging. Following this trend, design of a two-enzyme biomarker activatable molecular probe for accurate imaging and differentiation of hepatopathy may hold great potential in clinic.
Leucine aminopeptidase (LAP) is an important metallopeptidase which selectively catalyzes the hydrolytic removal of leucine residues from the N-terminus of proteins and peptides.9 Importantly, researchers have reported that diseased hepatocytes have higher LAP activity than normal hepatocytes.2c Thus, LAP might serve as a specific marker for the differentiation between diseased and normal hepatocytes. Monoamine oxidase (MAO) belongs to a family of flavoenzymes that are produced in most cell types and catalyzes the oxidative conversion of monoamines into aldehydes and ammonia or amines.10 The measurement of MAO contributes to the diagnosis and differential diagnosis of hepatopathy, especially for early diagnosis of cirrhosis of the liver.11 Although some enzyme-activated molecular probes activated only by LAP or MAO have been developed,12 their nonspecific activation by less expressed but ubiquitous proteases in tissues may cause false positive signals and limit their clinical applications (Scheme 1A). Thus, we decided to explore the hypothesis that dual-activation and imaging of LAP and MAO in serum may lead to a more accurate diagnosis of hepatopathy.
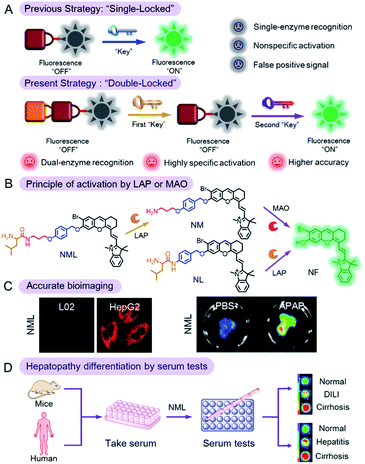
Therefore, in this work, we reported a molecular probe (NML) which can be unlocked by successive chemical conversion by two specific biomarkers of hepatopathy: LAP and MAO (the two “keys”). Compared with the previous strategy of a “single-locked” probe, NML, which operates by a “double-locked” two enzyme sequential activation strategy, has higher specificity and accuracy (Scheme 1B). We then demonstrated the utility of NML for the accurate diagnosis of hepatopathy through serum testing (Scheme 1C and D). NML contains a masked fluorophore (NF) that, in its unmasked form, emits in the near-infrared (NIR) region, thus avoiding interference of serum background fluorescence.13 The phenolic nature of the chosen fluorophore allows for the silencing of its fluorescence when incorporated into NML (Table S1†). The probe was designed by linking a leucine (first “lock”) to a propylamine unit (second “lock”) via a pseudo-peptide bond, which in turn is linked via an ether bond to the silenced NIR fluorophore via an elimination-type spacer, a para-hydroxybenzyl group. The pseudo-peptide bond can be cleaved by LAP (first “key”), while exposure of the resulting amino group to MAO (second “key”) results in oxidation and β-elimination to release the fluorophore, accompanied by fluorescence emission at 720 nm. NML can be activated in vitro and in vivo only in the presence of both LAP and MAO but remains silent when either of the enzymes is absent or inhibited.
Results and discussion
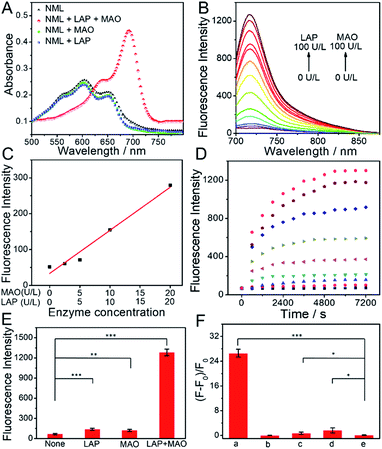
Fig. 1 shows the spectroscopic properties of NML and its response to LAP or MAO. Four different scenarios were tested under physiological conditions: (i) the presence of both LAP and MAO, (ii) LAP alone, (iii) MAO alone, and (iv) no enzyme (Fig. 1A). Only in the presence of both enzymes do we see a pronounced red shift of absorption and a sharp increase of fluorescence emission at 720 nm (Fig. 1A and B). Fluorescence at 720 nm rose with increasing concentrations of LAP or MAO and showed a linear relationship at a low enzyme concentration (0–20 U L−1 for LAP and for MAO) (Fig. 1C). In addition, when one of the enzymes is saturated, the fluorescence intensity of NML depends on the concentration of the other enzyme (Fig. S1†). Probe response plots at 720 nm in the presence of both enzymes at different concentrations are shown in Fig. 1D. A higher concentration of LAP and MAO could induce a faster cleavage reaction and an increased fluorescence signal, reaching a plateau in about 2 h. In addition, the kinetics of the reaction of LAP with NML (50 μM) at a concentration of 1000 U L−1 for different durations (0–50 min) were also recorded by HPLC under physiological conditions. As shown in Fig. S2,†NML was completely converted into NM in 40 min, and the response reached a plateau. Therefore, in the two-step cleavage reaction, we can conclude that the first step is a faster step and the second step is the rate-limiting step. Of the four scenarios, only the one in the presence of both LAP and MAO led to a brisk response in fluorescence. By contrast, in the absence of either of the enzymes, no change in fluorescence was observed (Fig. 1E). In fact, the intact probe NML shows residual fluorescence which we attribute to the ether nature of the link between the spacer and the phenolic hydroxyl. Interestingly, the fact that three successive chemical reactions have to occur before the fluorophore is released does not compromise the signal build-up. In addition, we studied the effects of varying pH on the fluorescence of NML in the presence of LAP and MAO. As shown in Fig. S3,† the build-up of fluorescence is largely affected by changing the pH from 4.0 to 9.0. A maximum fluorescence increase was observed at pH 7.4, which boded well for tests in authentic biological samples including in vivo applications. These results indicate that NML can be efficiently activated only in the presence of both LAP and MAO to produce a turn-on NIR fluorescence signal.To confirm the specificity of the probe's response, two specific inhibitors, bestatin (LAP inhibitor) and clorgiline (MAO inhibitor), were applied in further tests. As displayed in Fig. 1F, 100 μM bestatin and 10 nM clorgiline produce decreased fluorescence compared to the control group without an inhibitor. Even in the presence of only one inhibitor, NML could not be activated. Thus, the off–on response of the probe toward LAP and MAO is indeed caused by enzymatic activation. On the other hand, the presence of species potentially interfering with the mode of action of NML, even at excess concentrations, does not lead to a change in the fluorescence of the sample (Fig. S4†), thereby proving the specificity of our probe for the two target enzymes. The reaction mechanism of NML with both LAP and MAO was further explored by mass analysis (Fig. S5†). Upon reaction with LAP only, a new main peak (m/z = 625.1, M+) was observed which represents NML without the leucine moiety, while upon reaction with MAO only, no new peak was observed except a peak at m/z = 740.3(M+) which represents NML. In the presence of both LAP and MAO, a peak at m/z = 426.1(M+) was observed, corresponding to the released fluorophore. The reaction mechanism was also analyzed by HPLC (Fig. S6†). When NML was incubated with LAP for 30 min, a new peak at 9.987 min was observed, which belongs to NM. When NML was incubated with MAO for 2 h, no new peak was observed, which suggests that MAO alone cannot activate the sensor. When NML was incubated with LAP and MAO for 2 h, a new peak at 13.929 min was observed, which belongs to NF. These results demonstrated that NML can be converted to NM by LAP and NM can be converted to NF by MAO, which corresponds to the mechanism depicted in Scheme 1B. In addition, for comparison, we synthesized two other reference probes NL and NM, which were activated only by LAP and MAO, respectively. The response characteristics of the reference probes NL and NM toward LAP and MAO were also tested in vitro, respectively, and excellent spectroscopic properties were obtained (Fig. S7–S9†). The results indicated that NL or NM can serve as a specific molecular probe for detection of single enzymes.
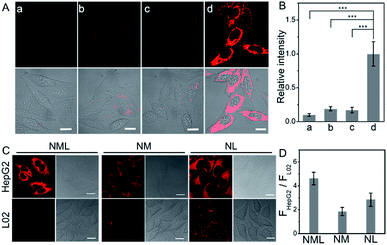
As reported, LAP and MAO are both overexpressed in HepG2 cells.9,10 Our colocalization experiments show that NML, NL and NM mainly accumulate in mitochondria (Fig. S10 and S11†). A standard CCK-8 cell viability assay using HepG2 cells demonstrated low cytotoxicity for NML, NL and NM, suggesting good biocompatibility (Fig. S12†). The kinetic response of NML to LAP and MAO in live cells was also investigated via real-time imaging (Fig. S13†). Fluorescence in cells gradually increased and reached a plateau in approximately 2 h, indicating good cell permeability of the probe and reaction with intracellular LAP and MAO. For NL and NM, gradually enhanced fluorescence was observed within 30 min and 2 h, respectively (Fig. S14†). Negative controls with known inhibitors (bestatin and clorgiline) for the two enzymes support the notion that the observed fluorescence change within cells is due to enzymatic activation. Under identical conditions, fluorescence only develops in the absence of inhibitors, while fluorescence in either bestatin- or clorgiline-treated cells remains negligible (Fig. 2A and B). In addition, the strong fluorescence of NL and NM in HepG2 cells can also be inhibited by bestatin and clorgiline (Fig. S15†). When NML, NL and NM were used to treat HepG2 cells (hepatoma cell line) and L02 cells (normal hepatocyte cell line), they all showed stronger fluorescence in HepG2 cells (Fig. 2C). Importantly, NML showed a higher ratio of fluorescence intensity (FHepG2/FL02) compared with NL and NM (Fig. 2D). Similar results were observed in HepG2 and L02 cell lysates (Fig. S16†). These fluorescence differences represent the relative level of intracellular LAP or MAO between HepG2 and L02 cells. Since NML needs to be recognized sequentially by two enzymes, when the probe binds to LAP first, it will increase the steric hindrance recognized by MAO. This will make NML insensitive to lower concentrations of the enzymes and will significantly increase its detection limit (Table S2†), resulting in NML exhibiting weaker fluorescence in L02 cells. However, in HepG2 cells, NML, NL and NM can be effectively activated, making the fluorescence intensity ratio (FHepG2/FL02) of NML higher than that of NL and NM. We then proceeded to investigate the suitability of NML as a molecular probe for in vivo imaging in live mice. We thus monitored changes in fluorescence following the direct injection of a dose of NML in PBS buffer into a HepG2 tumor of the BALB/C mice. Over six hours, the tumor region (d = 8 mm) showed a gradual increase in fluorescence (Fig. S17†). Importantly, when such HepG2 tumors were pretreated with either bestatin or clorgiline or both, fluorescence was largely suppressed compared to that in a control group.
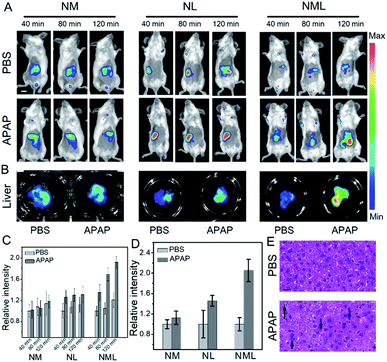
Liver injury, for example, drug-induced liver injury (DILI), is a major public affliction affecting patients and doctors. Acetaminophen (APAP), a classic antipyretic and analgesic, has been reported to have severe hepatotoxicity in excess.14 Therefore, development of molecular probes with high accuracy for distinguishing normal and injured livers is quite necessary. We then applied NML for accurate bioimaging of DILI. As shown in Fig. 3A, representative images show higher fluorescence enhancement in the liver area from 40 to 120 min after administration of NML compared with NL and NM. Fluorescence images of dissected livers injected with NML showed more distinct differentiation between normal and injured livers (Fig. 3B). In addition, we also explored the biodistribution of NM, NL and NMLin vivo. The results showed that the probes were mainly accumulated in the liver and kidney after intravenous administration (Fig. S18†). Furthermore, quantitative data within the liver region also showed that NML has higher fluorescence enhancement for imaging APAP-induced hepatotoxicity than NM and NL (Fig. 3C and D). Moreover, hematoxylin and eosin (H&E) staining of liver tissues was performed to identify the different histological changes, and cellular shrinkage and enlargement of cell nuclei were observed (Fig. 3E). All these imaging results demonstrated that the double-enzyme activated probe (NML) may have higher accuracy in bioimaging compared with the single-enzyme activated probes (NM and NL).
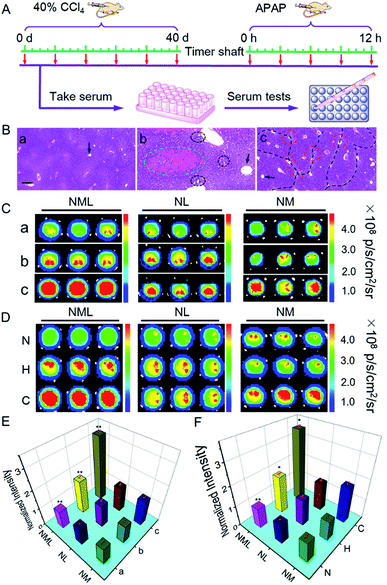
Having demonstrated the excellent spectroscopic and imaging properties of NML both in vitro and in vivo, we proceeded to evaluate NML for the imaging of LAP and MAO in the serum of different mouse models (Fig. 4A). Firstly, in order to build a reliable cirrhotic model, KM mice were subcutaneously injected with tetrachloromethane (CCl4) to induce hepatotoxicity on a daily basis for 40 days.15 Then all the mice were sacrificed and liver tissues were harvested. H&E staining clearly showed fibrotic bands (black dotted line) and a large number of necrotic hepatocytes (red circle) after administration for 40 days, thus demonstrating the establishment of the cirrhotic model (Fig. 4B and S19†). On the other hand, the drug-induced liver injury (DILI) mouse model was established through intraperitoneal injection of acetaminophen (APAP).16 As shown in Fig. 4B and S20,† observations showed nonuniform morphology of the hepatocytes, hemorrhage (green circle), and inflammatory cell infiltration (black circle) in H&E staining, indicating APAP-induced liver injury. As indicators for evaluating the degree of liver damage, the levels of ALT and AST in the serum for different administration periods were tested (Fig. S21†). These results indicated the deterioration of the mouse liver by treatment for different periods.
Next, we applied NML, NL and NM for distinguishing different degrees of DILI or cirrhosis through serum tests in 96-well plates.6a As shown in Fig. S22 and S23,†NML, NL and NM all exhibited a certain degree of fluorescence enhancement in the serum of both DILI and cirrhotic mice after administration for different periods, suggesting the overexpression of LAP or MAO in DILI and cirrhotic mouse serum. Compared with NL and NM, NML showed a higher fluorescence enhancement in both DILI and cirrhotic mouse models for different administration periods. In order to confirm the reliability of our results, we tested the LAP and MAO levels in the serum for different administration periods by using a commercial kit. As shown in Fig. S24,† the levels of both LAP and MAO increased in the serum of CCl4-administered cirrhotic mice, while only the level of LAP increased in the serum of APAP-treated DILI mice. Therefore, using NL, it is hard to distinguish cirrhotic serum from DILI serum because of the overexpression of LAP in both of the two models. Using NM, it is hard to distinguish normal serum from DILI serum because of the low-expression of MAO in both of the models (Fig. 4C). Compared with NL and NM, NML is suitable for distinguishing cirrhotic serum (3.3 ± 0.15 times enhancement) from DILI serum (1.8 ± 0.12 times enhancement) and normal serum with high accuracy (Fig. 4E). We can conclude that LAP is the key enzymatic biomarker for the differentiation of normal serum and DILI serum, while MAO is the key enzymatic biomarker for the differentiation of DILI serum and cirrhotic serum. Equipped with the “double-locked” strategy, NML needs to undergo two-step successive enzymatic cleavage to release the fluorophore (NF), which results in a lower background fluorescence in the serum of normal mice. Therefore, NML is able to show differentiated fluorescence in different models of mouse serum, thus enabling differentiation of different hepatopathies. These combined results indicated that NML-assisted serum imaging serves as a useful tool with which to differentiate cirrhotic mice from normal and DILI mice. Significantly, we applied NML for identifying the serum of patients with different hepatopathies by using NL and NM as reference probes (Fig. 4D and F). The observations showed that NML is useful to accurately differentiate the serum of cirrhotic patients with the overexpression of both LAP and MAO from that of normal and hepatitis B patients (Fig. S25†), suggesting that NML may have great potential for hepatopathy diagnosis in clinic.
Conclusions
In summary, we demonstrated that our “double-locked” molecular probe NML serves to detect and image two “enzyme keys” (LAP and MAO) which are biomarkers for hepatopathy. The fluorescence intensity of NML at 720 nm correlates with the expression levels of LAP and MAO which are found at pathologically high levels in hepatopathy. Equipped with the “double-locked” mode, NML showed higher accuracy for imaging DILI than the “single-locked” probes, NM and NL. To our delight, application of NML allows for the accurate distinction of the serum of normal, DILI and cirrhotic mice. Through intensity variations for LAP and MAO in serum, NML can distinguish not only cirrhosis and DILI in different periods but also normal, DILI and cirrhotic mice. We believe that our dual-enzyme activated probe may hold great promise for the clinical diagnosis of cirrhosis and hepatitis. The progressive “double-locked” and “dual-enzyme-activated” strategy might facilitate various interventional procedures in clinic, such as image-guided serum testing or fluorescence-guided accurate surgery of liver tissues.Conflicts of interest
There are no conflicts to declare.Acknowledgements
This work was supported by the National Natural Science Foundation of China (Grants 21890744 and 21877029), the Science and Technology Project of Hunan Province (2016RS2009 and 2016WK2002) and a project funded by the China Postdoctoral Science Foundation (2019M652750). All animal procedures were performed in accordance with the Guidelines for Care and Use of Laboratory Animals of Hunan University and experiments were approved by the Animal Ethics Committee of the College of Biology (Hunan University).Notes and references
- (a) R. Williams, Hepatology, 2006, 44, 521–526 CrossRef PubMed; (b) D. L. Thomas, Nat. Med., 2013, 19, 850–858 CrossRef CAS.
- (a) Y. Urano, M. Sakabe, N. Kosaka, M. Ogawa, M. Mitsunaga, D. Asanuma, M. Kamiya, M. R. Young, T. Nagano, P. L. Choyke and H. Kobayashi, Sci. Transl. Med., 2011, 3, 110–119 Search PubMed; (b) S. Harrison, Am. J. Gastroenterol., 2003, 98, 2042–2047 CrossRef PubMed; (c) X. He, L. Li, Y. Fang, W. Shi, X. Li and H. Ma, Chem. Sci., 2017, 8, 3479–3483 RSC; (d) E. M. Brunt, S. Ramrakhiani, B. G. Cordes, B. A. Neuschwander-Tetri, C. G. Janney, B. R. Bacon and A. M. Di Bisceglie, Mod. Pathol., 2003, 16, 49–56 CrossRef PubMed.
- (a) A. Fraser, S. Ebrahim, G. D. Smith and D. A. Lawlor, Hepatology, 2007, 46, 158–165 CrossRef CAS PubMed; (b) N. Callewaert, H. V. Vlierberghe, A. V. Hecke, W. Laroy, J. Delanghe and R. Contreras, Nat. Med., 2004, 10, 429–434 CrossRef CAS PubMed; (c) L. Liu, T. Li, S. Zhang, P. Song, B. Guo, Y. Zhao and H. C. Wu, Angew. Chem., Int. Ed., 2018, 57, 11882–11887 CrossRef CAS PubMed.
- (a) A. J. McCullough, Clin. Liver Dis., 2004, 8, 521–533 CrossRef PubMed; (b) D. E. Kleiner, E. M. Brunt, M. Van Natta, C. Behling, M. J. Contos, O. W. Cummings, L. D. Ferrell, Y. C. Liu, M. S. Torbenson, A. Unalp-Arida, M. Yeh, A. J. McCullough and A. J. Sanyal, Hepatology, 2005, 41, 1313–1321 CrossRef PubMed; (c) S. Saadeh, Z. M. Younossi, E. M. Remer, T. Gramlich, J. P. Ong, M. Hurley, K. D. Mullen, J. N. Cooper and M. J. Sheridan, Gastroenterology, 2002, 123, 745–750 CrossRef PubMed.
- (a) X. Li, X. Gao, W. Shi and H. Ma, Chem. Rev., 2014, 114, 590–659 CrossRef CAS PubMed; (b) J. Zielonka, J. Joseph, A. Sikora, M. Hardy, O. Ouari, J. Vasquez-Vivar, G. Cheng, M. Lopez and B. Kalyanaraman, Chem. Rev., 2017, 117, 10043–10120 CrossRef CAS PubMed; (c) W. Sun, S. Guo, C. Hu, J. Fan and X. Peng, Chem. Rev., 2016, 116, 7768–7817 CrossRef CAS PubMed.
- (a) L. Li, W. Shi, Z. Wang, Q. Gong and H. Ma, Anal. Chem., 2015, 87, 8353–8359 CrossRef CAS PubMed; (b) X. Wu, L. Li, W. Shi, Q. Gong, X. Li and H. Ma, Anal. Chem., 2016, 88, 1440–1446 CrossRef CAS PubMed.
- (a) M. H. Lee, A. Sharma, M. J. Chang, J. Lee, S. Son, J. L. Sessler, C. Kang and J. S. Kim, Chem. Soc. Rev., 2018, 47, 28–52 RSC; (b) M. Gao, F. Yu, C. Lv, J. Choo and L. Chen, Chem. Soc. Rev., 2017, 46, 2237–2271 RSC; (c) R. Kumar, W. S. Shin, K. Sunwoo, W. Y. Kim, S. Koo, S. Bhuniya and J. S. Kim, Chem. Soc. Rev., 2015, 44, 6670–6683 RSC.
- (a) M. Prost and J. Hasserodt, Chem. Commun., 2014, 50, 14896–14899 RSC; (b) J. L. Kolanowski, F. Liu and E. J. New, Chem. Soc. Rev., 2018, 47, 195–208 RSC.
- (a) Z. Zhou, F. Wang, G. Yang, C. Lu, J. Nie, Z. Chen, J. Ren, Q. Sun, C. Zhao and W. H. Zhu, Anal. Chem., 2017, 89, 11576–11582 CrossRef CAS PubMed; (b) W. Zhang, F. Liu, C. Zhang, J. G. Luo, J. Luo, W. Yu and L. Kong, Anal. Chem., 2017, 89, 12319–12326 CrossRef CAS PubMed.
- (a) L. Li, C. W. Zhang, G. Y. Chen, B. Zhu, C. Chai, Q. H. Xu, E. K. Tan, Q. Zhu, K. L. Lim and S. Q. Yao, Nat. Commun., 2014, 5, 3276 CrossRef PubMed; (b) X. Wu, W. Shi, X. Li and H. Ma, Angew. Chem., Int. Ed., 2017, 56, 15319–15323 CrossRef CAS PubMed.
- N. Tryding, S. E. Nilsson, G. Tufvesson, R. Berg, S. Carlström, B. Elmfors and J. E. Nilsson, Scand. J. Clin. Lab. Invest., 2009, 23, 79–84 CrossRef PubMed.
- H. W. Liu, L. Chen, C. Xu, Z. Li, H. Zhang, X. B. Zhang and W. Tan, Chem. Soc. Rev., 2018, 47, 7140–7180 RSC.
- (a) L. Yuan, W. Lin, S. Zhao, W. Gao, B. Chen, L. He and S. Zhu, J. Am. Chem. Soc., 2012, 134, 13510–13523 CrossRef CAS PubMed; (b) H. W. Liu, X. X. Hu, K. Li, Y. Liu, Q. Rong, L. Zhu, L. Yuan, F. L. Qu, X. B. Zhang and W. Tan, Chem. Sci., 2017, 8, 7689–7695 RSC.
- H. Ye, L. J. Nelson, M. G. del Moral, E. Martínez-Naves and F. J. Cubero, World J. Gastroenterol., 2018, 24, 1373–1385 CrossRef CAS PubMed.
- T. B. Ren, W. Xu, Q. L. Zhang, X. X. Zhang, S. Y. Wen, H. B. Yi, L. Yuan and X. B. Zhang, Angew. Chem., Int. Ed., 2018, 57, 7473–7477 CrossRef CAS PubMed.
- (a) D. Li, S. Wang, Z. Lei, C. Sun, A. M. El-Toni, M. S. Alhoshan, Y. Fan and F. Zhang, Anal. Chem., 2019, 91, 4771–4779 CrossRef CAS PubMed; (b) D. Cheng, J. Peng, Y. Lv, D. Su, D. Liu, M. Chen, L. Yuan and X. Zhang, J. Am. Chem. Soc., 2019, 141, 6352–6361 CrossRef CAS PubMed.
Footnote |
| † Electronic supplementary information (ESI) available. See DOI: 10.1039/c9sc03628h |
| This journal is © The Royal Society of Chemistry 2019 |

