 Open Access Article
Creative Commons Attribution 3.0 Unported Licence
Installation of internal electric fields by non-redox active cations in transition metal complexes†
Kevin
Kang‡
a,
Jack
Fuller‡
III
b,
Alexander H.
Reath
a,
Joseph W.
Ziller
a,
Anastassia N.
Alexandrova
 *bc and
Jenny Y.
Yang
 *a
*a
aDepartment of Chemistry, University of California, Irvine 92697, USA. E-mail: j.yang@uci.edu
bDepartment of Chemistry and Biochemistry, University of California, Los Angeles, Los Angeles, CA 90095, USA. E-mail: ana@chem.ucla.edu
cCalifornia NanoSystems Institute, Los Angeles, CA 90095, USA
First published on 9th September 2019
Abstract
Local electric fields contribute to the high selectivity and catalytic activity in enzyme active sites and confined reaction centers in zeolites by modifying the relative energy of transition states, intermediates and/or products. Proximal charged functionalities can generate equivalent internal electric fields in molecular systems but the magnitude of their effect and impact on electronic structure has been minimally explored. To generate quantitative insight into installing internal fields in synthetic systems, we report an experimental and computational study using transition metal (M1) Schiff base complexes functionalized with a crown ether unit containing a mono- or dicationic alkali or alkaline earth metal ion (M2). The synthesis and characterization of the complexes M1 = Ni(II) and M2 = Na+ or Ba2+ are reported. The electronic absorption spectra and density functional theory (DFT) calculations establish that the cations generate a robust electric field at the metal, which stabilizes the Ni-based molecular orbitals without significantly changing their relative energies. The stabilization is also reflected in the experimental Ni(II/I) reduction potentials, which are shifted 0.12 V and 0.34 V positive for M2 = Na+ and Ba2+, respectively, compared to a complex lacking a proximal cation. To compare with the cationic Ni complexes, we also synthesized a series of Ni(salen) complexes modified in the 5′ position with electron-donating and -withdrawing functionalities (–CF3, –Cl, –H, –tBu, and –OCH3). Data from this series of compounds provides further evidence that the reduction potential shifts observed in the cationic complexes are not due to inductive ligand effects. DFT studies were also performed on the previously reported monocationic and dicatonic Fe(II)(CH3CN) and Fe(III)Cl analogues of this system to analyze the impact of an anionic chloride on the electrostatic potential and electronic structure of the Fe site.
Introduction
Directional electric fields can play a critical role in directing the rate and selectivity of chemical catalysis by manipulating activation energies and the relative energies of catalytic intermediates.1,2 Electrostatic fields are believed to be key contributors to the accelerated reactivity or selectivity observed in a wide-range of environments, from enzymatic active sites3,4 to zeolite pores.5,6Quantum mechanical studies have described harnessing directional electric fields as a ‘smart reagent’ for mediating chemical reactivity.7 Recent experimental studies have illustrated the utility of applied (or external) electrostatic fields in mediating reactivity. For example, Kanan et al. demonstrated the use of electric fields generated at electrode surfaces to control metal oxide catalyzed epoxide rearrangement8 and a carbene reaction.9 Additionally, electric fields generated between an STM tip and surface can accelerate localized isomerization reactions,10 a single molecule Diels–Alder reaction,11 or cleavage of a C–O bond.12 Localized electric fields from electrode nanostructures also plays a significant role in electrocatalysis, with a prominent case revealing significantly improved selectivity for CO2 reduction to hydrocarbons.13 These experiments demonstrate the power of electric fields to accelerate or induce desirable reactivity. However, the magnitude of an external electric field generated at an electrode diminishes rapidly, limiting its effect. Similarly, electric field generation at an STM tip is limited to localized or single molecule reactivity. Additionally, higher external fields can result in dielectric breakdown or deleterious faradaic processes.
In contrast, installation of an internal electric field in a molecular system can provide a predictable, directional, and consistent electric field at each active site. Electric fields generated by internal dipoles have been increasingly cited in selective or increased reactivity for organic synthesis.14–30 Kanan et al. have demonstrated that the field generated by ion pairing modifies the regioselectivity of Au(I)-catalyzed hydroarylation of 3-substituted phenyl propargyl ethers.31 Coote et al. have also reported using pH switchable fields that rely on protonation–deprotonation to vary radical stability.32
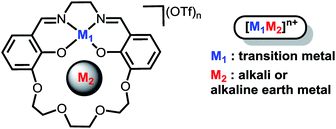
Our efforts to generate controllable and directional internal electric fields have focused on installation of non-redox active cations proximal to redox-active reaction sites. We first reported the cobalt derivatives of the salen-crown complex shown in Chart 1. The crown moiety appended to the four-coordinate Schiff-base ligand can accommodate a large range of cationic metal centers (M2). Alkali and alkaline earth metals were utilized because they are known to generate significant electric fields in enzymes33,34 and zeolite cavities.35 A significant shift in the Co(II/I) redox potential was observed upon installation of the redox-inactive cation. Electronic absorption spectroscopy indicated the ligand field is not significantly perturbed by M2. Instead, we suggested the shifts in redox potential were likely due to the electrostatic field generated by M2, which was supported by modelling M2 as a point charge.36 A subsequent study on the iron analogues of the ligand in Chart 1 found the magnitude of the Fe(III/II) redox potential also had a strong dependence on both M2 and whether a counterion was coordinated to the Fe.37 However, our initial studies lacked definitive evidence for the magnitude of the electric field, its impact on the electronic structure of the redox-active center, and the effect of inner-sphere anions. These details are critical to effectively utilize cations to generate directional electric fields to optimize reaction rates or selectivity.
In order to investigate the electric field effect in more detail, we have synthesized the Ni(II) (M2) analogue of the ligand with Na+ and Ba2+ cations as M2 (Scheme 1). As electric fields scale with charge, we would expect dications to have a larger effect on the magnitude than monocations. The salen framework easily accommodates a square-planar closed-shell Ni(II) coordination environment. In this study, we detail the synthesis and spectroscopic properties of Ni(II) complexes with Na+ or Ba2+ incorporated in the crown with computational methods to more fully understand the changes in redox potential and electronic properties. Computational methods are also applied to the previously reported iron complexes in this framework to understand the impact of anion coordination on the electronic structure and redox potential. Additionally, we have synthesized a series of Ni(salen) complexes with varying electron-donating and -withdrawing functionalities in the 5′ position. We find that the relationship between the spectroscopic properties and reduction potential contrast with that of 2M, indicating minimal inductive ligand effects with the latter. Taken together, this study provides a detailed and quantitative examination of how positioned cations can be utilized in synthetic systems to install electric field of fixed magnitude and direction.
Results and discussion
Synthesis
The 1M Schiff base ligands (Scheme 1) were synthesized using a modified literature procedure.38 A dialdehyde with an ether chain was templated with an alkali or alkaline earth metal triflate salt, which subsequently underwent macrocyclization via condensation with one equivalent of ethylene diamine. 1Na(OTf) and 1Ba(OTf)2 were synthesized using the corresponding metal triflate salts. They were purified via recrystallization by layering diethyl ether on a methanol solution of the crude product (Scheme 1, M = Na+, Ba2+).1M (M = Na+, Ba2+) ligand and an equivalent of Ni(OAc)2 were refluxed in methanol to synthesize the heterobimetallic 2M Ni(II) complexes (Scheme 1). Synthesis was followed by removal of methanol and acetic acid in vacuo. The heterobimetallic complexes were purified and recrystallized by vapor diffusion of diethyl ether into the methanol solutions of each compound. The compound identities were confirmed using high resolution mass spectrometry and single crystal X-ray diffraction analysis. Purities were determined by elemental analysis. Ni(3′-OCH3-salen) (3′-OCH3-salen = N,N′-bis(3-methoxysalicylidene)-1,2-diaminoethane) was synthesized according to a literature procedure39 to compare with the 2M complexes.
The compounds were characterized by 1H NMR spectroscopy, shown in Fig. S2 and S3.† Compared to Ni(3′-OCH3-salen), each 2M complex exhibited a downfield shift in the imine proton signal with a greater shift correlating with higher cationic charge. However, the imine proton in 1M complexes was shifted even farther downfield than in the corresponding 2M complexes.
The 5′-R salen ligands (R = CF3, Cl, tBu, OCH3) were synthesized using a modified literature procedure.39 Two equivalents of 2-hydroxy-5-R-benzaldehyde were dissolved in methanol and condensed with one equivalent of ethylenediamine to form the substituted salen ligand. Each 5′-R-salen ligand and an equivalent of Ni(OAc)2 were refluxed in methanol to form the Ni(5′-R-salen) complexes. The products were isolated by removal of methanol and acetic acid under reduced pressure. 1H NMR spectra for each Ni complex is shown in Fig. S4–S8.†
Structural studies
Single crystals for X-ray diffraction were grown by diffusion of diethyl ether into methanol solutions of the 2M triflate salts; the solid-state structures are shown in Fig. 1. In each heterobimetallic complex, the triflate counteranions are bound to the M2 cation. In 2Na(OTf), the Na+ ion only appears bound to 5 of the 6 available oxygen donors. In 2Ba(OTf)2, two triflate anions are coordinated to the Ba2+ and form a symmetric bridge to an adjacent 2Ba(OTf)2 complex. The mass spectrum does not contain peaks consistent with a dimer, suggesting that the dimeric species only exists in the solid-state form. A methanol molecule is also coordinated to each Ba2+ cation.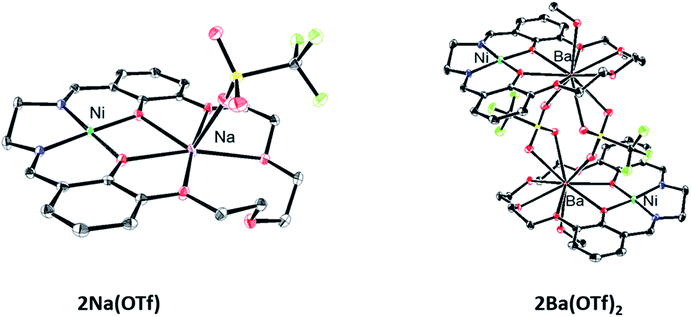 | ||
| Fig. 1 Solid-state structures of 2Na(OTf) and 2Ba(OTf)2. Thermal ellipsoids are drawn to 50% probability. Hydrogen atoms, outer-sphere anions, and solvent molecules have been omitted for clarity. | ||
Each complex contains a minimally distorted square planar nickel ion with the M2 cation inhabiting the crown ether pocket. The τ4 values describing the coordination around the Ni(II) ions are listed in Table 1 and confirm similar coordination environments between the compounds.40 The distances between the Ni(II) ion and M2 cations are also listed in Table 1.
| Complex | E 1/2 Ni(II/I)a, V | ΔEb, V | Ni⋯M, Å | Ni(II) ion, τ4c |
ν(C![[double bond, length as m-dash]](https://www.rsc.org/images/entities/char_e001.gif) N), cm−1 N), cm−1 |
λ(d → d), nm (ε, M−1 cm−1) | Calc. λ(d → d), nm | λ(π → π*)e, nm (ε, M−1 cm−1) | Calc. λ (π → π*), nm | λ(MLCT)e, nm (ε, M−1 cm−1) | Calc. λ(MLCT), nm |
|---|---|---|---|---|---|---|---|---|---|---|---|
| a Reduction potentials referenced to Fe(C5H5)2+/0. b Difference between the reduction potential of 2M and Ni(3′-OCH3-salen). c τ 4 value describing the coordination geometry around the Ni(II) ions, where τ4 = 1 for a tetrahedral geometry and τ4 = 0 for a square planar geometry. d From ref. 40. e Assignment based on ref. 42. | |||||||||||
| Ni(3′-OCH3-salen) | −2.11 | — | — | 0.0152d | 1545 | 547 (111) | 563 | 349 (8033) | 345 | 415 (5019) | 390 |
| 2Na(OTf) | −1.99 | 0.12 | 3.4374(6) | 0.0217 | 1553 | 552 (113) | 565 | 345 (9800) | 333 | 406 (5695) | 389 |
| 2Ba(OTf)2 | −1.77 | 0.34 | 3.7095(4) | 0.0882 | 1554 | 555 (105) | 607 | 344 (9358) | 327 | 404 (5176) | 386 |
Electrochemistry
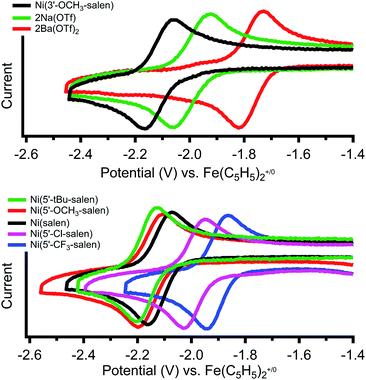
Cyclic voltammetry of Ni(3′-OCH3-salen) in dimethylformamide versus Fe(C5H5)2+/0 reveals a reversible reduction at −2.11 V that we assign to a Ni(II/I) redox event (Fig. 2, top, individual CVs are shown in Fig. S26–S28†). The corresponding Ni(II/I) reduction events in 2Na and 2Ba are also reversible and found at −1.99 and −1.77 V, respectively. Compared to Ni(3′-OCH3-salen), the redox potential for 2Na and 2Ba are shifted positive by 120 mV and 340 mV, respectively. The increased difference in redox potential correlates with increased cationic charge, which we have also observed in similar complexes.36Cyclic voltammetry of the Ni(5′-R-salen) (R = CF3, Cl, tBu, OCH3) compounds are also reversible as shown in Fig. 2 (bottom) and summarized in Table 2. As expected, the appended inductive groups result in changes to the Ni(II/I) reduction potential. Compared to Ni(salen), addition of the trifluoromethyl and chloro electron-withdrawing substituents resulted in positive shifts in redox potential by 190 mV and 140 mV, respectively. Conversely, the addition of the methoxy and tert-butyl electron-donating groups caused the redox potential to shift negatively by 50 mV and 90 mV, respectively.
| Complex | E 1/2 Ni(II/I)a, V |
ν(C![[double bond, length as m-dash]](https://www.rsc.org/images/entities/char_e001.gif) N), cm−1 N), cm−1 |
λ(d → d)b, nm (ε, M−1 cm−1) | λ(π–π*)b, nm (ε, M−1 cm−1) | λ MLCT , nm (ε, M−1 cm−1) |
|---|---|---|---|---|---|
| a Reduction potentials referenced to Fe(C5H5)2+/0. b Assignment based on ref. 42. | |||||
| Ni(5′-tBu-salen) | −2.17 | 1525 | 538 (163) | 335 (9328) | 416 (7071) |
| Ni(5′-OCH3-salen) | −2.15 | 1538 | 551 (200) | 344 (5947) | 434 (6932) |
| Ni(salen) | −2.12 | 1533 | 532 (141) | 334 (8500) | 410 (6548) |
| Ni(5′-Cl-salen) | −1.99 | 1527 | 534 (180) | 337 (7738) | 417 (6205) |
| Ni(5′-CF3-salen) | −1.91 | 1541 | 528 (144) | 336 (6249) | 400 (5289) |
Electronic and vibrational spectroscopy
Solid state infrared spectroscopy of the complexes was taken to compare the electronic environment of the nickel center (Fig. S29–S32†). As cationic charge increases, the vibrational frequency of the imine C![[double bond, length as m-dash]](https://www.rsc.org/images/entities/char_e001.gif) N stretch increases (Table 1). Ni(5′-R-salen) displayed shifts in vibrational frequency of the C
N stretch increases (Table 1). Ni(5′-R-salen) displayed shifts in vibrational frequency of the C![[double bond, length as m-dash]](https://www.rsc.org/images/entities/char_e001.gif) N stretch over a range of 14 cm−1 compared to Ni(salen). These shifts did not correlate with electron-donating or -withdrawing capability (Table 2).
N stretch over a range of 14 cm−1 compared to Ni(salen). These shifts did not correlate with electron-donating or -withdrawing capability (Table 2).
The compounds were examined by electronic absorption and infrared spectroscopy to further probe the electronic effects of the Na+ and Ba2+ cation on the Ni(II) ligand field. The electronic absorption spectra in dimethylformamide are shown in Fig. S10–S15† and are summarized in Table 1. The absorption spectrum of Ni(3′-OCH3-salen) displays a π → π* transition at 349 nm and a d → π* (MLCT) transition at 415 nm.41,42 The 2M complexes exhibit a slight blue shift in both their π → π* bands (≤5 nm) and MLCT bands (≤11 nm) relative to Ni(3′-OCH3-salen). Additionally, Ni(3′-OCH3-salen) has a d → d absorption band at 547 nm, which appears in 2M with a small red shift (≤8 nm). Molar absorptivity for each transition for 2M is comparable to Ni(3′-OCH3-salen). Changes in absorption in 2M compared to Ni(3′-OCH3-salen) indicate that the presence of M has a small influence on the ligand field around the Ni(II) center.
The electronic absorption spectra of the monometallic compounds are shown in Fig. S16–S25† and are summarized in Table 2. Ni(salen) displays a d → d absorption band at 532 nm. Compared to Ni(salen), the same transition appears in the Ni(5′-R-salen) complexes with a small red shift (≤9 nm) with the exception of Ni(5′-OCH3-salen) which shifted this transition by 23 nm. As expected, modifying the ligand with electron withdrawing functionalities shifts the reduction potential positive. The inductive effect on the ligand field is reflected in the increasing energy of the d–d band, which correlates to changes in the HOMO–LUMO gap (although R = OCH3 does not fit the trend). In contrast, addition of the cations in 2M show slightly smaller changes in their d–d band absorption despite larger changes in reduction potential. The absorption wavelength for 2M also shifts to slight lower energies as the reduction potential shifts positive, or the opposite trend observed in the monomeric complexes.
Computational studies
Nickel complexes
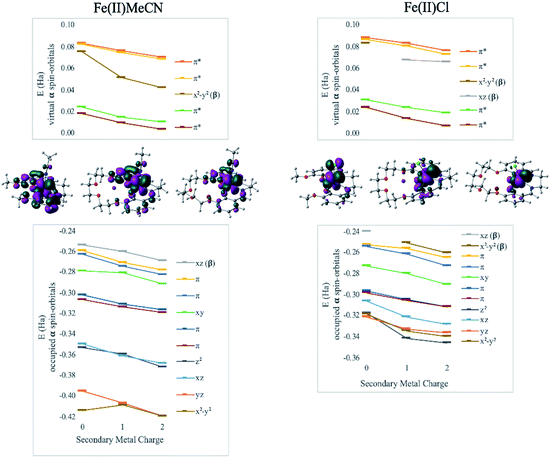
To clarify the effect of the secondary cation, density functional theory (DFT) calculations were performed using the ωB97X-D functional.43 The def2-SVP basis set was used for geometry optimizations and the def2-TZVP basis for final electronic energies and spectra.44 Solvent was modeled using the SMD solvent model45 with the corresponding parameters for dimethylformamide or acetonitrile. Calculations were performed using Gaussian 09 (ref. 46) and electrostatic potential maps were plotted using ChemCraft.47Electronic absorption spectra simulated using time-dependent DFT (TD-DFT)48 showed fairly good agreement with experimental spectra with errors less than 0.2 eV (typical errors for TD-DFT being 0.1–0.5 eV);48 only small shifts in wavelengths were observed for different secondary cations (Table 1). However, all the frontier orbitals shift in energy by a similar magnitude with increasing cationic charge, as shown in Fig. 3. The small relative changes in orbital energies is consistent with the modest differences observed in absorption spectra. In addition, the energies of all the MOs near the HOMO–LUMO gap trend in response to the field in a nearly parallel fashion. Hence, minimal spectral changes can be seen. Both the experimental and computational results indicate the major impact of the secondary cations is electrostatic as they do not significantly alter the ligand field at the redox site. Instead, as the LUMO energy decreases from Ni(3′-OCH3-salen) to 2Na (by −0.27 eV) and to 2Ba (by −0.42 eV), the reduction potential shifts positive.
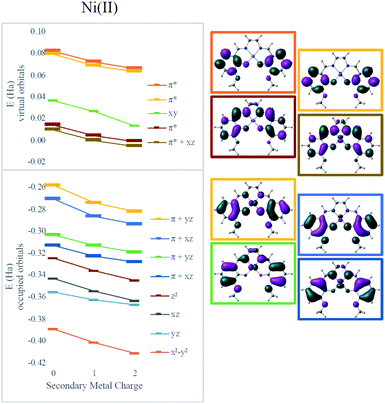 | ||
| Fig. 3 Effect of secondary metals on orbital energies in Ni complexes. Orbitals involved in MLCT are bolded in the graph and plotted on the right for the Ni(salen–OMe) complex. | ||
Iron complexes
The synthesis, structure, and characterization of several iron analogues were previously reported.37 Specifically, complexes with M1 = Fe(II)(CH3CN) or Fe(III)Cl and M2 = K+ and Ba2+ were prepared. Both the Fe(II) and Fe(III) complexes displayed a similar trend in redox potential to the Ni complexes (i.e. positive shift was larger for M2 = Ba2+ than M2 = K+ and both were shifted relative to the congener without any proximate cation as described in Table 3). The Fe(III/II) reduction potential of M1 = Fe(II)(CH3CN) were shifted by 440 mV (M2 = K+) and 640 mV (M2 = Ba2+) more positive than Fe(II)(salen). In contrast, when M1 = Fe(III)Cl, the equivalent potential was only 70 mV (M2 = K+) and 230 mV (M2 = Ba2+) more positive compared to Fe(III)(salen)Cl. Both reductions are electrochemically reversible, indicating ligand loss upon electron transfer is not impacting the observed reduction potentials. Hence, unlike in the Ni(II/I) case, the pure effect of the secondary metal gets entangled with the effect of the auxiliary ligand on Fe, suggesting that the intramolecular field effects are affected. We sought to explain the difference between the Ni and Fe complexes using computational techniques.| Compound (M1–M2) | Fe–M distance, Å | τ 5 | Fe–Cl distance, Å | E 1/2 (Fe(III/II))b, V |
|---|---|---|---|---|
| a τ 5 = 0 for a square pyramidal geometry and τ5 = 1 for a trigonal bipyramidal geometry. b Reduction potentials in acetonitrile referenced to ferrocene/ferrocenium. | ||||
| Fe(II)(CH3CN)–K+ | — | — | — | −0.29 |
| Fe(II)(CH3CN)–Ba2+ | 3.6592(4) | 0.11 | — | −0.09 |
| Fe(II)(salen) | — | — | — | −0.73 |
| Fe(III)Cl–K+ | 3.6596(6) | 0.36 | 2.218 | −0.69 |
| Fe(III)ClBa2+ | 3.8115(3) | 0.13 | 2.228 | −0.53 |
| [Fe(III)(Cl)(salen)] | — | 0.20 | 2.238 | −0.76102 |
DFT calculations revealed geometry distortions in the Fe(III)Cl complexes in the presence of the secondary metals. In the reduced form of each complex, the chloride ligand was bent toward the secondary metal, significantly distorting the square pyramidal ligand field, and considerably reducing the ligand field splitting (notice a much more compressed MO manifold in this case, Fig. 4). The distortion causes electronic changes to the redox active metal and its coordination. The HOMO of Fe(II)salen, which is also the LUMO of Fe(III)salen, is delocalized over the d-AO on Fe and the p-AO on Cl. As the distortion occurs in the presence of the secondary metal, the HOMO acquires a pure d-character. Due to symmetry breaking, the nature of the HOMO in Fe(II)Cl changes from dxz in Fe(II)salen to dx2−y2 when the secondary metal is present. Nevertheless, the field exerted by the secondary metal shifts all the orbital energies in a predictable downward trend with the increase of the charge of the secondary metal. Furthermore, the trend lines for MO energies as a function of the secondary metal charge have similar slopes for the two Fe(II) complexes, indicating that the field experienced by Fe is similar in strength in the two complexes.
Hence, the redox-inactive cation may cause not only the shift in orbital energies by exerting an electric field, but also a significant perturbation to geometric and electronic structures of the redox-active metal. In this case, the redox-active metal structurally distorts as the anionic axial chloride ligand moves towards the cation. When the axial ligand is missing, as in the case of Ni, or does not hold a negative charge, as in Fe(II)CH3CN, the isolated field effect of the secondary metal is seen. Hence, the ligand environment must be sufficiently rigid for the addition of a secondary metal to have a purely electrostatic effect. However, even accounting for geometric effects the electrostatic effect is still robust and predictable.
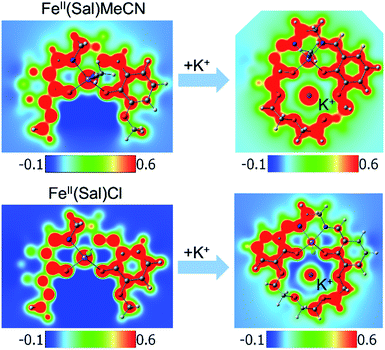
Another way to illustrate the presence or absence of significant distortions to the electronic structure of the redox site is the electrostatic potential maps of the complexes (Fig. 5). For Fe(II) complexes with acetonitrile, the maps for Fe(3′-OCH3-salen) and Fe(II)(CH3CN)–K+ look nearly indistinguishable at first sight, apart from the magnitude of the potential (seen in the scale bars), confirming a clean intramolecular field effect of the secondary metal. In the case of the Fe(II)Cl analogues, the change of the magnitude of the electrostatic potential upon the addition of the secondary metal is still seen, but smaller. However, the potential gains a significant asymmetry, in accord with the changing geometry of the complex.
Conclusions
Our study demonstrates the use of proximal cations to install directional internal electric fields in transition metal complexes and the resulting effects on electronic structure. Computational methods quantified the impact of the field, which shifts the frontier orbitals to a similar degree while their relative energies are minimally affected. For the nickel complexes, the field shifts the reduction potentials by up to 340 mV with minimal changes to the ligand field. Computational methods were also used to investigate the variable shift in the Fe(III/II) potential in the presence of a neutral (CH3CN) or anionic (Cl−) axial ligand. We find the anionic ligand is involved in a structural distortion of the Fe(II) complex in response to the direction of the electrostatic field, which also impacts the electronic structure. Although, the Fe experiences the effects of the field in both cases, the structural distortion results in a smaller positive shift in redox potential for the Cl− analogue (70 mV for K+ and 230 mV for Ba2+) versus the CH3CN analogue (440 mV for K+ and 640 mV for Ba2+).Even with some geometric distortion in the framework, it is clear the cation exerts significant internal electric fields. Consistent with an electrostatic effect, the impact of a dication is always larger than the monocation. Evidence for the electric field by changes in the redox potential is also notable because the measurements are made in solutions containing ∼100-fold excess of electrolyte. Hence, the rigid positioning of the cation and molecular architecture results in an electric field that is not easily quenched by solvation or presence of ions in high concentrations.
Electric fields have emerged as an important tool for accelerated or selective reactivity.8–32 We have previously described examples of how these types of cationic compounds disrupt traditional linear free energy relationships.37,49 Other potential applications of directional fields include stabilizing polar transition states to improve reaction rates. Additionally, directional fields can enable product selectivity by selectively stabilizing intermediates that would otherwise be comparable in energy in the absence of a field. Rate acceleration and improved selectivity have been demonstrated using external electric fields. This study demonstrates how the magnitude and direction of internal electric fields can be controlled through synthetic design. Incorporating a field into each reaction site does not require any external distance-dependent field source and can now be scaled.
Conflicts of interest
There are no conflicts to declare.Acknowledgements
KK, AHR, and JYY would like to acknowledge support from NSF CAREER Award (CHE-1554744). KK would also like to thank the UCI Summer Undergraduate Research Program for support. JYY is grateful for support as a Sloan Foundation Fellow, Camille Dreyfus Teacher-Scholar, and CIFAR Azrieli Global Scholar in the Bio-inspired Energy Program. JF(III) and ANA would like to acknowledge support from NSF CAREER Award (CHE-1351968). Calculations were performed on the UCLA IDRE shared computer cluster, Hoffman2. JYY and ANA would also like to acknowledge support from NIH grant 1R01GM134047-01.Notes and references
- S. Ciampi, N. Darwish, H. M. Aitken, I. Díez-Pérez and M. L. Coote, Chem. Soc. Rev., 2018, 47, 5146–5164 RSC
.
- S. Shaik, R. Ramanan, D. Danovich and D. Mandal, Chem. Soc. Rev., 2018, 47, 5125–5145 RSC
.
- A. Warshel, J. Biol. Chem., 1998, 273, 27035–27038 CrossRef CAS PubMed
.
- A. Warshel, P. K. Sharma, M. Kato, Y. Xiang, H. Liu and M. H. M. Olsson, Chem. Rev., 2006, 106, 3210–3235 CrossRef CAS PubMed
.
- F. Blatter, H. Sun, S. Vasenkov and H. Frei, Catal. Today, 1998, 41, 297–309 CrossRef CAS
.
- C. J. Rhodes, Chem. Pap., 2016, 70, 4–21 CAS
.
- S. Shaik, D. Mandal and R. Ramanan, Nat. Chem., 2016, 8, 1091 CrossRef CAS PubMed
.
- C. F. Gorin, E. S. Beh and M. W. Kanan, J. Am. Chem. Soc., 2012, 134, 186–189 CrossRef CAS PubMed
.
- C. F. Gorin, E. S. Beh, Q. M. Bui, G. R. Dick and M. W. Kanan, J. Am. Chem. Soc., 2013, 135, 11257–11265 CrossRef CAS PubMed
.
- M. Alemani, M. V. Peters, S. Hecht, K.-H. Rieder, F. Moresco and L. Grill, J. Am. Chem. Soc., 2006, 128, 14446–14447 CrossRef CAS PubMed
.
- A. C. Aragonès, N. L. Haworth, N. Darwish, S. Ciampi, N. J. Bloomfield, G. G. Wallace, I. Diez-Perez and M. L. Coote, Nature, 2016, 531, 88 CrossRef PubMed
.
- L. Zhang, E. Laborda, N. Darwish, B. B. Noble, J. H. Tyrell, S. Pluczyk, A. P. Le Brun, G. G. Wallace, J. Gonzalez, M. L. Coote and S. Ciampi, J. Am. Chem. Soc., 2018, 140, 766–774 CrossRef CAS PubMed
.
- M. Liu, Y. Pang, B. Zhang, P. De Luna, O. Voznyy, J. Xu, X. Zheng, C. T. Dinh, F. Fan, C. Cao, F. P. G. de Arquer, T. S. Safaei, A. Mepham, A. Klinkova, E. Kumacheva, T. Filleter, D. Sinton, S. O. Kelley and E. H. Sargent, Nature, 2016, 537, 382 CrossRef CAS PubMed
.
- R. Maji and S. E. Wheeler, J. Am. Chem. Soc., 2017, 139, 12441–12449 CrossRef CAS PubMed
.
- B. Chattopadhyay, J. E. Dannatt, I. L. Andujar-De Sanctis, K. A. Gore, R. E. Maleczka, D. A. Singleton and M. R. Smith, J. Am. Chem. Soc., 2017, 139, 7864–7871 CrossRef CAS PubMed
.
- J. M. Um, D. A. DiRocco, E. L. Noey, T. Rovis and K. N. Houk, J. Am. Chem. Soc., 2011, 133, 11249–11254 CrossRef CAS PubMed
.
- H. Yang and M. W. Wong, J. Am. Chem. Soc., 2013, 135, 5808–5818 CrossRef CAS PubMed
.
- E. Lyngvi, J. W. Bode and F. Schoenebeck, Chem. Sci., 2012, 3, 2346–2350 RSC
.
- D. A. DiRocco, E. L. Noey, K. N. Houk and T. Rovis, Angew. Chem., Int. Ed., 2012, 51, 2391–2394 CrossRef CAS PubMed
.
- T. J. Seguin and S. E. Wheeler, ACS Catal., 2016, 6, 2681–2688 CrossRef CAS
.
- Q. N. N. Nguyen, M. W. Lodewyk, S. Bezer, M. R. Gagné, M. L. Waters and D. J. Tantillo, ACS Catal., 2015, 5, 1617–1622 CrossRef CAS
.
- K. Lee, D. L. Silverio, S. Torker, D. W. Robbins, F. Haeffner, F. W. van der Mei and A. H. Hoveyda, Nat. Chem., 2016, 8, 768–777 CrossRef CAS PubMed
.
- T. J. Seguin and S. E. Wheeler, Angew. Chem., Int. Ed., 2016, 55, 15889–15893 CrossRef CAS PubMed
.
- A. C. Doney, B. J. Rooks, T. Lu and S. E. Wheeler, ACS Catal., 2016, 6, 7948–7955 CrossRef CAS
.
- C. R. Kennedy, J. A. Guidera and E. N. Jacobsen, ACS Cent. Sci., 2016, 2, 416–423 CrossRef CAS PubMed
.
- G. Xiao, G. A. Cintron-Rosado, D. A. Glazier, B.-m. Xi, C. Liu, P. Liu and W. Tang, J. Am. Chem. Soc., 2017, 139, 4346–4349 CrossRef CAS PubMed
.
- M. C. Holland, S. Paul, W. B. Schweizer, K. Bergander, C. Mück-Lichtenfeld, S. Lakhdar, H. Mayr and R. Gilmour, Angew. Chem., Int. Ed., 2013, 52, 7967–7971 CrossRef CAS PubMed
.
- A. L. Chan, J. Estrada, C. E. Kefalidis and V. Lavallo, Organometallics, 2016, 35, 3257–3260 CrossRef CAS
.
- J. B. Smith and A. J. M. Miller, Organometallics, 2015, 34, 4669–4677 CrossRef CAS
.
- C. C. Lu and J. C. Peters, J. Am. Chem. Soc., 2002, 124, 5272–5273 CrossRef CAS PubMed
.
- V. M. Lau, W. C. Pfalzgraff, T. E. Markland and M. W. Kanan, J. Am. Chem. Soc., 2017, 139, 4035–4041 CrossRef CAS PubMed
.
- M. Klinska, L. M. Smith, G. Gryn'ova, M. G. Banwell and M. L. Coote, Chem. Sci., 2015, 6, 5623–5627 RSC
.
- A. Morgenstern, M. Jaszai, M. E. Eberhart and A. N. Alexandrova, Chem. Sci., 2017, 8, 5010–5018 RSC
.
- D. T. Major, ACS Catal., 2017, 7, 5461–5465 CrossRef CAS
.
- B. Barrachin and E. C. de Lara, J. Chem. Soc., Faraday Trans. 2, 1986, 82, 1953–1966 RSC
.
- A. H. Reath, J. W. Ziller, C. Tsay, A. J. Ryan and J. Y. Yang, Inorg. Chem., 2017, 56, 3713–3718 CrossRef CAS PubMed
.
- T. Chantarojsiri, J. W. Ziller and J. Y. Yang, Chem. Sci., 2018, 9, 2567–2574 RSC
.
- C. J. Van Staveren, J. Van Eerden, F. C. J. M. Van Veggel, S. Harkema and D. N. Reinhoudt, J. Am. Chem. Soc., 1988, 110, 4994–5008 CrossRef CAS
.
- D.-F. Liu, X.-Q. Lü and R. Lu, Transition Met. Chem., 2014, 39, 705–712 CrossRef CAS
.
- K. Ayikoe, R. J. Butcher and Y. Gultneh, Acta Crystallogr., Sect. E: Struct. Rep. Online, 2011, 67, m328 CrossRef CAS PubMed
.
- C. J. Hipp and W. A. Baker, J. Am. Chem. Soc., 1970, 92, 792–798 CrossRef CAS
.
- B. Bosnich, J. Am. Chem. Soc., 1968, 90, 627–632 CrossRef CAS
.
- J.-D. Chai and M. Head-Gordon, Phys. Chem. Chem. Phys., 2008, 10, 6615–6620 RSC
.
- F. Weigend and R. Ahlrichs, Phys. Chem. Chem. Phys., 2005, 7, 3297–3305 RSC
.
- A. V. Marenich, C. J. Cramer and D. G. Truhlar, J. Phys. Chem. B, 2009, 113, 6378–6396 CrossRef CAS PubMed
.
-
M. J. Frisch, G. W. Trucks, H. B. Schlegel, G. E. Scuseria, M. A. Robb, J. R. Cheeseman, G. Scalmani, V. Barone, B. Mennucci, G. A. Petersson, H. Nakatsuji, M. Caricato, X. Li, H. P. Hratchian, A. F. Izmaylov, J. Bloino, G. Zheng, J. L. Sonnenberg, M. Hada, M. Ehara, K. Toyota, R. Fukuda, J. Hasegawa, M. Ishida, T. Nakajima, Y. Honda, O. Kitao, H. Nakai, T. Vreven, J. A. Montgomery Jr, J. E. Peralta, F. Ogliaro, M. Bearpark, J. J. Heyd, E. Brothers, K. N. Kudin, V. N. Staroverov, T. Keith, R. Kobayashi, J. Normand, K. Raghavachari, A. Rendell, J. C. Burant, S. S. Iyengar, J. Tomasi, M. Cossi, N. Rega, J. M. Millam, M. Klene, J. E. Knox, J. B. Cross, V. Bakken, C. Adamo, J. Jaramillo, R. Gomperts, R. E. Stratmann, O. Yazyev, A. J. Austin, R. Cammi, C. Pomelli, J. W. Ochterski, R. L. Martin, K. Morokuma, V. G. Zakrzewski, G. A. Voth, P. Salvador, J. J. Dannenberg, S. Dapprich, A. D. Daniels, O. Farkas, J. B. Foresman, J. V. Ortiz, J. Cioslowski, and D. J. Fox, Gaussian 09, Revision D.01, Gaussian, Inc., Wallingford CT, 2013 Search PubMed
.
- https://www.chemcraftprog.com .
- A. Dreuw and M. Head-Gordon, Chem. Rev., 2005, 105, 4009–4037 CrossRef CAS PubMed
.
- T. Chantarojsiri, A. H. Reath and J. Y. Yang, Angew. Chem., Int. Ed., 2018, 57, 14037–14042 CrossRef CAS PubMed
.
Footnotes |
| † Electronic supplementary information (ESI) available: Experimental methods, synthetic procedures, 1H NMR spectra, electronic absorption spectra, cyclic voltammetry, infrared spectra, crystallographic data, computational data and coordinates. CCDC 1922171 and 1922172. For ESI and crystallographic data in CIF or other electronic format see DOI: 10.1039/c9sc02870f |
| ‡ These authors contributed equally. |
| This journal is © The Royal Society of Chemistry 2019 |

