DOI:
10.1039/C9SC00084D
(Edge Article)
Chem. Sci., 2019,
10, 4497-4501
Near-infrared aggregation-induced enhanced electrochemiluminescence from tetraphenylethylene nanocrystals: a new generation of ECL emitters†
Received
7th January 2019
, Accepted 11th March 2019
First published on 15th March 2019
Abstract
Herein, we observed near-infrared electrochemiluminescence (NIR ECL) emission from tetraphenylethylene nanocrystals (TPE NCs), which exhibit high ECL efficiency and excellent biocompatibility compared with the current NIR ECL emitters (such as semiconductor quantum dots and metal nanoclusters). The strong ECL signal of TPE NCs originates from the aggregation-induced enhanced ECL emission via improvement of the efficiency of electron hole recombination and suppression of the nonradiative transition. Impressively, the TPE NCs exhibit an enormous red-shifted ECL emission (678 nm) relative to the blue-light photoluminescence (PL) emission (440 nm). Compared to fluorescence imaging which is limited by photobleaching and autofluorescence, the NIR ECL emission of TPE NCs is highly favorable to diminish background interference over visible light and realize deeper tissue penetration, which expands the ECL emission of organic nanomaterials to the NIR region for broader biological applications.
Introduction
Near-infrared (NIR) emission, with the excellent merits of lower background interference, less photochemical damage, and deeper tissue penetration, has attracted continuous interest in biological sensing and imaging fields.1,2 Noticeably, compared to NIR fluorescence, which is still faced with the inevitable limitations of autofluorescence and photobleaching in bioanalysis, electrochemiluminescence (ECL) with NIR emission has emerged as a powerful analysis tool in biomedical and diagnostic fields in terms of its versatility, high stability, near-zero background signal, and excellent controllability.3,4 Commonly, various types of semiconductor quantum dots (QDs) (CdTe,5,6 CdSeTe/ZnS,7 PbS,8etc.) as traditional NIR ECL emitters have been intensively investigated, while heavy metal-containing QDs were highly biotoxic causing severe health concerns.9,10 To explore the ECL emission in the NIR region with low toxicity components, noble metal nanoclusters (NCs)11 consisting of a few to dozens of atoms are significantly attractive in bioanalysis applications. Wang and co-workers synthesized lipoic acid stabilized Au22 NCs covalently cross-linked with N,N-diethylethylenediamine as the coreactant and reported the NIR ECL of aqueous soluble AuNCs.12 Despite the remarkable progress of the proposed NIR ECL emitters, the ECL efficiency of semiconductor QDs and metal NCs was still restricted. Lately, organic materials with specific performances of flexible preparation and low toxicity have been proposed for application in biological fluorescence imaging,13,14 organic light-emitting diodes (OLEDs)15 and organic field-effect transistors.16 Significantly, the exploration of ECL emissions of organic nanoparticles (NPs)17,18 has experienced increasing attention and progress. Bard and co-workers investigated a series of organic NPs (such as polyaromatic compounds and their derivatives,19 and organic polymers20,21) and were dedicated to improving the ECL efficiency of organic NPs as good candidates for ECL devices. However, the poor biocompatibility and blue-light ECL emission of the above organic NPs limited their further applications in ECL sensing and bioimaging. In view of these deficiencies, it is of critical significance to develop highly efficient ECL emitters with NIR ECL properties and low biotoxicity.
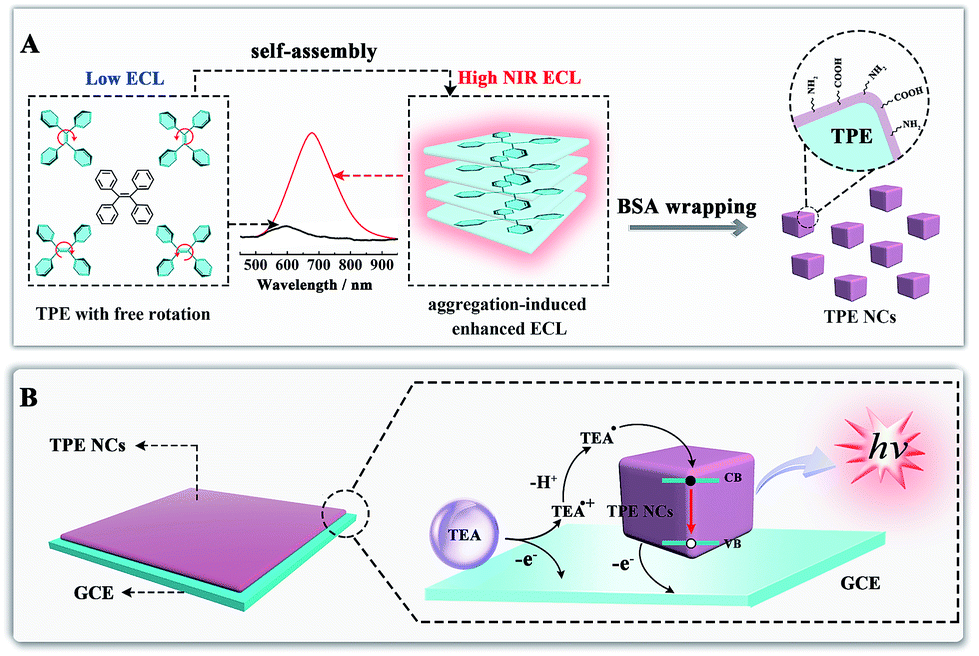
Aggregation-induced emission (AIE), an effective fluorescence enhancement strategy, has potential applications in optoelectronic devices and cell imaging, because strong FL emission was found when individual organic molecules aggregated together, while the individual ones in dilute solutions were non-emissive.22 More recently, Carrara et al. pioneered the aggregation-induced ECL properties of square-planar Pt(II) complexes, which paved a new way to improve the ECL efficiency of the next generation of brilliant emitters.23 However, noble metal complexes as ECL emitters not only increase the experimental cost, but also show biotoxicity and poor biocompatibility. It is essential to develop metal-free ECL emitters with aggregation-induced enhanced ECL properties for ECL biosensing and imaging applications. In this paper, we synthesized tetraphenylethylene nanocrystals (TPE NCs) and observed the aggregation-induced enhanced NIR ECL emission phenomenon in aqueous solution, while the ECL signal of individual TPE molecules is basically invisible in organic solvents (Scheme 1A). The strong ECL emission of TPE NCs is ascribed to two possible reasons. Firstly, energy gaps were reduced when the individual TPE molecules aggregated together to form TPE NCs, which achieved high efficiency of electron hole recombination to obtain the excited state via the ECL route.24 Moreover, the intramolecular free rotation of phenyl rings in the TPE NCs was restricted after the aggregation, which reduced the non-radiative relaxation to realize further ECL enhancement. Interestingly, compared to the maximum emission peak of the PL spectra (440 nm) and EL spectra (442 nm) from TPE NCs, the ECL emission peak of TPE NCs at 678 nm was observed, which expanded the study on the aggregation-induced ECL emission of organic NPs to the NIR region. The NIR ECL emission mechanism of TPE NCs may be correlated with the high conjugation degree of the aggregation of TPE molecules in TPE NCs and the narrow energy gaps of the surface states of TPE NCs via the ECL route, which distinguished from the band gap transition of PL.25 Furthermore, compared with conventional organic ECL emitters, the TPE NCs exhibit favorable biocompatibility because bovine serum albumin (BSA) with abundant amino acid residues was employed as the capping agent. The preparation and ECL properties of TPE NCs are exhibited in Scheme 1. Initially, the TPE NCs were synthesized from individual TPE by self-assembly. Meanwhile, BSA was wrapped on the TPE NCs to offer a hydrophilic surface (part A). Impressively, as shown in part B, the TPE NCs were covered on the electrode surface to afford an intense ECL signal with the coreactant of triethylamine (TEA). Inspired by the intense NIR ECL emission and good biocompatibility, the TPE NCs as a new generation of ECL emitters are expected to show great promise in ECL sensing and bioimaging.
 |
| | Scheme 1 (A) Schematic illustration of the preparation of TPE NCs by self-assembly and the NIR aggregation-induced enhanced ECL properties; (B) illustration of the possible ECL mechanism of the TPE/TEA system. | |
Experimental section
Preparation of TPE nanocrystals (NCs)
The TPE nanocrystals (NCs) were prepared via the desolvation method. Briefly, TPE powder (0.5 mg) was dissolved in 0.5 mL of tetrahydrofuran (THF) to obtain a homogeneous colorless TPE solution (1 mg mL−1). Subsequently, 5 mL of deionized water was used to disperse 10 mg of BSA under sonication at room temperature. Then, 0.5 mL of TPE solution was slowly injected into the BSA solution under sonication, followed by stirring at room temperature for 2 hours. Ultimately, after removing the THF and washing with deionized water, the TPE NCs were obtained by vacuum desiccation.
Results and discussion
Characterization of TPE nanocrystals (NCs)
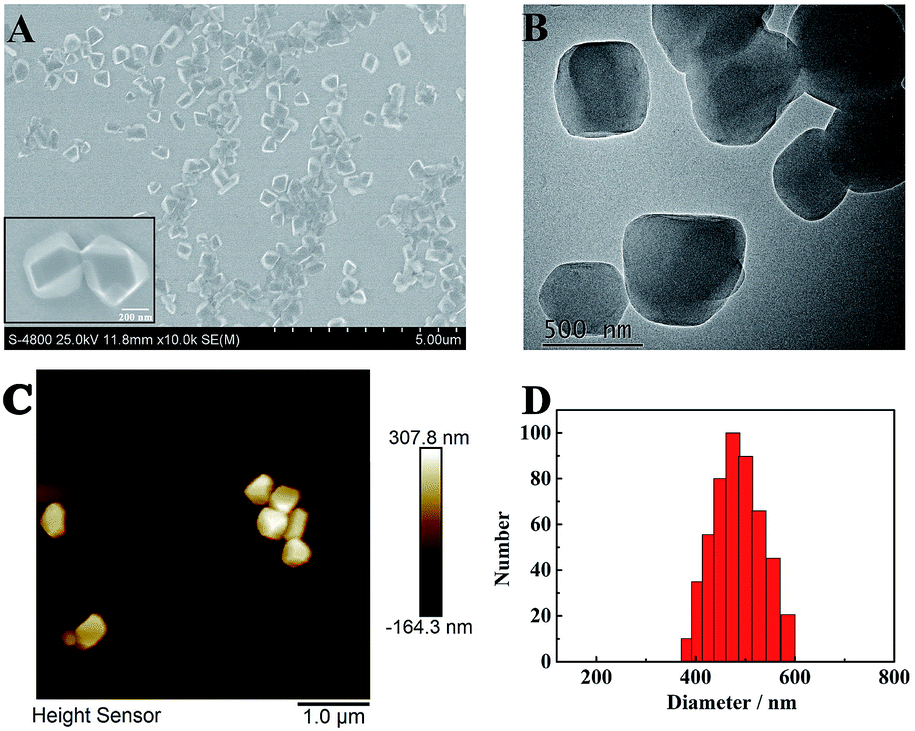
The morphology of TPE nanocrystals (NCs) was investigated. As depicted in Fig. 1A, the SEM results indicate that TPE NCs with an average size of 450 nm ± 50 nm are clearly observed. Meanwhile, the TPE NCs presented homogeneous diameters within a larger field of vision. Additionally, TEM and AFM were also performed to characterize the features of TPE NCs. As shown in Fig. 1B and C, both the images of TPE NCs reveal nanoblock structures, which conformed to the SEM results. To further investigate the particle size distribution, dynamic light scattering (DLS) was employed to analyze the TPE NCs. As illustrated in Fig. 1D, TPE NCs are well distributed with an average size of 500 nm ± 100 nm, and are slightly bigger than the size of TPE NCs in SEM images, attributed to the hydrogen bonding between the amidogen of TPE NCs and H2O.
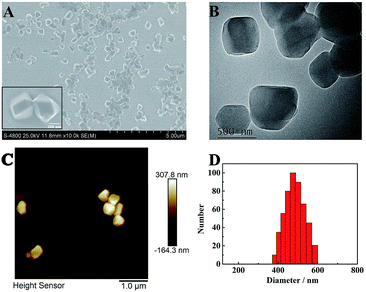 |
| | Fig. 1 (A) SEM, (B) TEM, and (C) AFM images, and (D) size distribution of the TPE NCs. | |
Furthermore, the crystallographic structure of TPE NCs was confirmed to be monoclinic by X-ray diffraction (XRD). As displayed in Fig. 2A, the peaks of TPE NCs (curve a) perfectly correspond to the peak of the standard PDF card (curve b) of the TPE crystal (CCDC code TPHETY), which is consistent with the previous literature.26 Meanwhile, the predicted structure of TPE NCs is simulated in Fig. 2B, and the formation of an ordered monoclinic crystal structure is attributed to the aromatic stacking interactions among the TPE molecules (Fig. 2C).
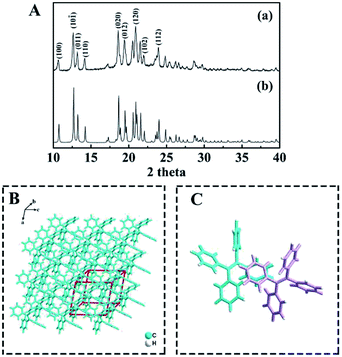 |
| | Fig. 2 (A) XRD patterns of (a) the TPE NCs and (b) the standard PDF card of the TPE crystal, (B) the predicted morphology of TPE crystals, and (C) the predicted interaction between the two TPE molecules represented in different colors. | |
Spectral characteristics of the TPE NCs
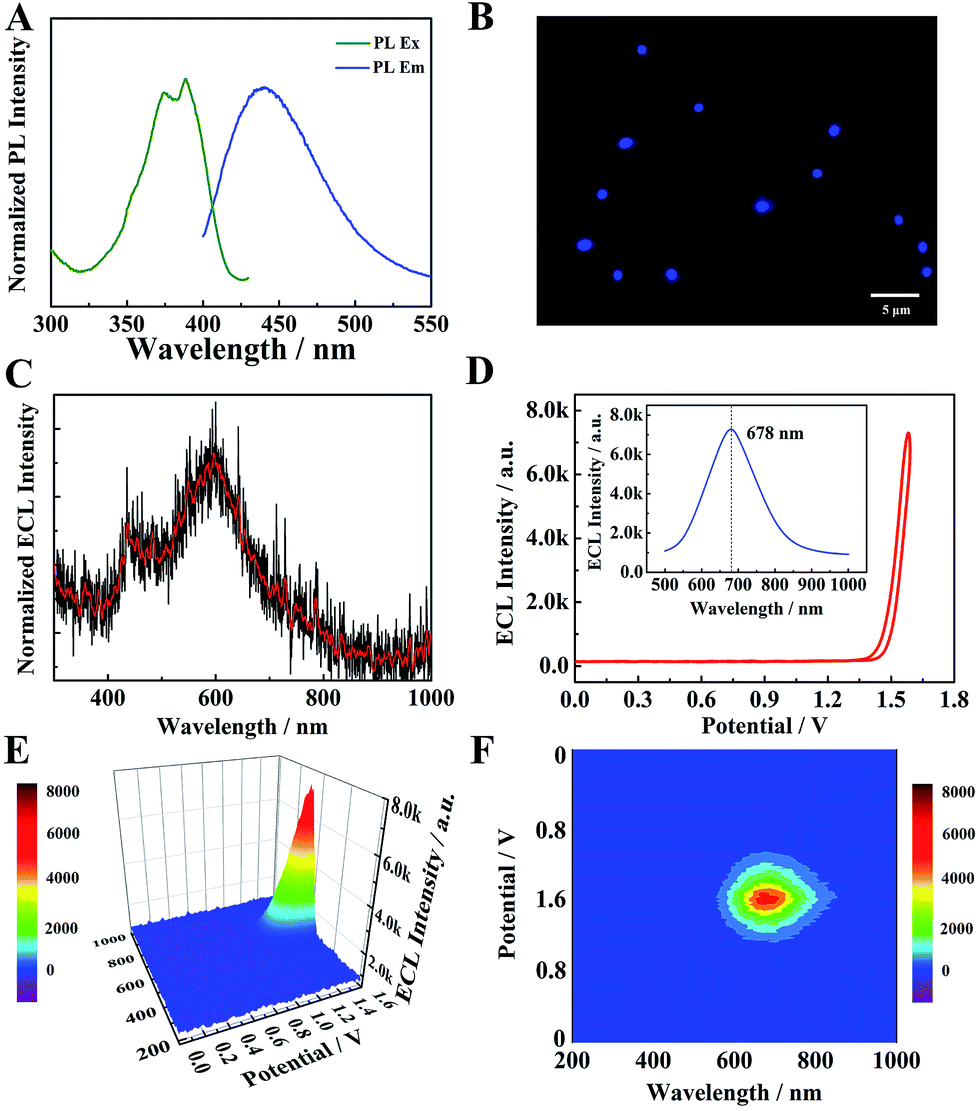
The optical properties of TPE NCs were measured by UV-vis absorption, photoluminescence (PL) and ECL spectra, respectively. As depicted in Fig. S1,† a distinct absorption peak of TPE dissolved in tetrahydrofuran (THF) is observed at 308 nm (curve a). However, the UV-vis absorption peak of TPE NCs (curve b) is red-shifted to 380 nm, which indicates that the TPE NCs aggregated in solution with the help of BSA. As depicted in Fig. 3A, the PL excitation peaks of TPE NCs are at 371 nm and 387 nm, and the maximum PL emission peak is located at 440 nm. Under the excitation light of 488 nm, the TPE NCs emitted strong blue fluorescence, and the morphology and size of TPE NCs in the fluorescence microscopic image (Fig. 3B) were in accordance with those of TPE NCs in the TEM image. Interestingly, the ECL spectra of individual TPE molecules in acetonitrile by spectral accumulation displayed an ECL emission peak (600 nm) and a weak shoulder ECL peak (440 nm) which is in accordance with the PL spectra (Fig. 3C), originating from the dimers and monomers of the TPE molecule, respectively.27 However, an intense NIR ECL emission peak (678 nm) of the TPE NCs was obtained in the presence of TEA via ECL spectral analysis (Fig. 3D–F), exhibiting a significant red shift (Δλ = 238 nm) compared with the PL spectra. In addition, the electroluminescence (EL) emission peak of the TPE film (Fig. S2†) was measured at 442 nm (basically consistent with the PL spectra) with an exciplex emission of 492 nm, which demonstrated that both the luminescence mechanisms of PL and EL are different from that of ECL in TPE NCs. In order to further investigate the large red shift of ECL spectra, the energy levels of TPE NCs were evaluated using the cyclic voltammogram (CV) of the TPE NCs modified GCE in 0.1 M Bu4NBF4 acetonitrile solution bubbled with N2 for 30 min (Fig. S3A†). During the anodic scan, an oxidation wave with an onset potential of 0.995 V vs. Ag/Ag+ was obtained, while the reduction wave was detected at −0.705 V. Accordingly, the valence band (VB) and conduction band (CB) were calculated to be −5.40 eV and −3.54 eV, respectively, and the energy gap was estimated to be approximately 1.86 eV, which is far less than the energy gap (3.04 eV) calculated from the lowest exciton absorption peak of TPE NCs at 408 nm by UV-vis diffuse reflectance spectra (DRS) (Fig. S3B†). Simultaneously, the emission state energy of TPE NCs was calculated to be 2.82 eV from the PL spectra by ES (eV) = 1240/λ (nm), which is very approximate to the optical energy gap (3.04 eV). It is speculated that the electron injected into the surface trap of TPE NCs28 results in a relatively small energy gap via the ECL route to produce a red-shifted wavelength, which is different from the PL mechanisms originating from the nuclear band gap pathway. Therefore, the NIR ECL mechanism of TPE NCs was attributed to the higher conjugation degree of the aggregation of TPE molecules in TPE NCs and the surface states of TPE NCs via the ECL route.
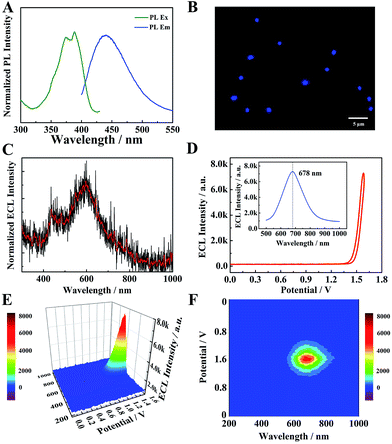 |
| | Fig. 3 (A) Normalized PL excitation spectra and PL emission spectra of TPE NCs in PBS solution. (B) Fluorescence microscopy image of TPE NCs. (C) The ECL spectra of individual TPE molecules in acetonitrile with TEA as a coreactant. (D) The ECL–potential curve of TPE NCs. The inset of (D) the 2D ECL spectra of TPE NCs in PBS solution with TEA as a coreactant. The ECL–potential–wavelength of TPE NCs via a 3D surface image (E) and 3D heat map image (F). | |
Furthermore, to study the aggregation-induced ECL enhancement mechanism, the cyclic voltammograms (CV) and ECL of individual TPE molecules and TPE NCs in acetonitrile were recorded, respectively. As depicted in Fig. 4A, the individual TPE molecules exhibit two extremely weak ECL emission peaks at −1 V and 1.6 V, for the free TPE molecules in acetonitrile had a wide energy gap which made the excited state unobtainable via the ECL route. However, the two corresponding ECL emission peaks of the TPE NCs in acetonitrile zoomed to approximately 4000 a.u (Fig. 4B) which was 20-fold higher than that of the free TPE molecules. Comparing the ECL intensity of single TPE molecules with that of TPE NCs, the aggregated TPE molecules in TPE NCs showed an intense ECL signal, which was attributed to the following causes. On the one hand, the reduced energy gaps in the ordered crystal structure made the excited state easily obtainable via the ECL route. On the other hand, the intramolecular motions of phenyl rings in the TPE NCs were limited inhibiting the non-radiative channels and realizing the radiative transition for further ECL enhancement. Interestingly, a relatively strong anodic ECL signal of TPE NCs in PBS was obtained from −2–1.6 V without cathodic ECL emission (Fig. S4†), which provided evidence that the radical cation of TPE (TPE+) was more stable than the radical anion. In consequence, we chose the anode ECL signal of the TPE NCs for further study. Moreover, the [Ru(bpy)3]2+/TPA system was selected as the standard to calculate the relative ECL efficiency of the TPE NCs/TPA system (the detailed formula is shown in the ESI†) and it was found to be 1.35%, which was higher than those of polyaniline-[Ru(bpy)2PIC]2+ (1.0%)29 and Mn@CdInS films (0.8%).30
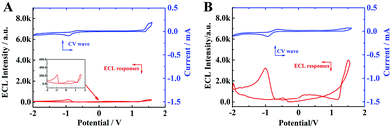 |
| | Fig. 4 CV curves (blue line) and the corresponding ECL–potential profiles (red line) of (A) 2 mM TPE and (B) TPE NCs in 0.1 M Bu4NBF4 acetonitrile solution. | |
Possible ECL mechanism of the TPE/TEA system
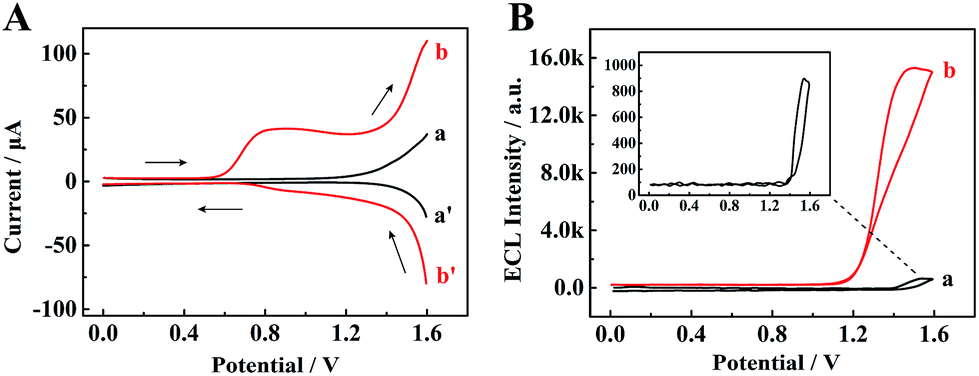
To identify the ECL mechanism of the TPE/TEA system, correlative DPV and ECL curves are shown in Fig. 5. Firstly, when the TPE NCs modified GCE was measured in PBS, the DPV showed inconspicuous oxidation and reduction peaks (curve a and curve a′, Fig. 5A). Meanwhile, the ECL signal with approximately 910 a.u. could be observed (curve a, Fig. 5B). However, an oxidation peak appeared and both the redox currents from 0.6 to 1.6 V were significantly enhanced (curve b and curve b′, Fig. 5A) after adding TEA as the coreactant into PBS, which was attributed to the generation of the TEA radical cation (TEA+) for further dehydrogenation to form a strong reductant TEA˙ (∼−1.7 V vs. Ag/AgCl).31 Subsequently, an electron from TEA˙ was transferred to the deep surface traps of TPE NCs with lower energies to achieve radiative recombination between the electrons and holes at the surface states of TPE NCs resulting in the excited state of TPE (TPE*). When the TPE* transited back to the ground state, an intense ECL emission was achieved, which was 16.8-fold higher than that of the TPE NCs modified GCE detected in individual PBS (curve b, Fig. 5B). The possible ECL mechanisms of the TPE/TEA system are depicted as follows:| | | TPE+ + TEA˙ → TPE* + product | (4) |
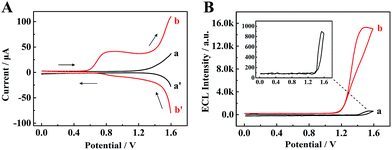 |
| | Fig. 5 (A) Differential pulse voltammetry (DPV) and (B) ECL–potential profiles of the TPE NCs modified GCE in (a) PBS solution and (b) PBS + 18 mM TEA solution. | |
Conclusions
In summary, unlike the low ECL efficiency and poor biocompatibility of traditional NIR ECL emitters, tetraphenylethylene nanocrystals (TPE NCs) offer an intense NIR ECL signal thanks to the aggregation-induced enhanced ECL emission via improvement of the efficiency of electron hole recombination and suppression of the nonradiative transition. Impressively, compared with the blue-light photoluminescence (PL) emission (440 nm), the TPE NCs show strong ECL emission (678 nm) in the NIR region, and hold great promise in ECL sensing and bioimaging due to lower background interference over visible light and deeper tissue penetration. Notably, the described TPE NCs reveal a new avenue to explore highly efficient ECL emitters for biological applications.
Conflicts of interest
There are no conflicts to declare.
Acknowledgements
This work was financially supported by the NNSF of China (21775124, 21575116, 21675129, and 51473136), and the Fundamental Research Funds for the Central Universities (XDJK2018AA003), China.
References
- T. Rauch, M. Böberl, S. F. Tedde, J. Fürst, M. V. Kovalenko, G. Hesser, U. Lemmer, W. G. Heiss and O. Hayden, Nat. Photonics, 2009, 3, 332–336 CrossRef CAS.
- T. A. Redchuk, A. A. Kaberniuk and V. V. Verkhusha, Nat. Protoc., 2018, 13, 1121–1136 CrossRef CAS PubMed.
- K. N. Swanick, M. Hesari, M. S. Workentin and Z. F. Ding, J. Am. Chem. Soc., 2012, 134, 15205–15208 CrossRef CAS PubMed.
- S. Voci, B. Goudeau, G. Valenti, A. Lesch, M. Jovic, S. Rapino, F. Paolucci, S. Arbault and N. Sojic, J. Am. Chem. Soc., 2018, 140, 14753–14760 CrossRef CAS PubMed.
- N. Gaponik, I. L. Radtchenko, G. B. Sukhorukov, H. Weller and A. L. Rogach, Adv. Mater., 2002, 14, 879–882 CrossRef CAS.
- Y. P. He, F. Zhang, B. Zhang and G. Z. Zou, Anal. Chem., 2018, 90, 5474–5480 CrossRef CAS PubMed.
- A. J. Stewart, K. Brown and L. Dennany, Anal. Chem., 2018, 90, 12944–12950 CrossRef CAS PubMed.
- M. Hesari, K. N. Swanick, J. S. Lu, R. Whyte, S. Wang and Z. F. Ding, J. Am. Chem. Soc., 2015, 137, 11266–11269 CrossRef CAS PubMed.
- A. M. Derfus, W. C. W. Chan and S. N. Bhatia, Nano Lett., 2004, 4, 11–18 CrossRef CAS PubMed.
- K. Wu, Y. S. Park, J. Lim and V. I Klimov, Nat. Nanotechnol., 2017, 12, 1140–1147 CrossRef CAS PubMed.
- M. Hesari, M. S. Workentin and Z. F. Ding, Chem. Sci., 2014, 5, 3814–3822 RSC.
- T. Y. Wang, D. C. Wang, J. W. Padelford, J. Jiang and G. L. Wang, J. Am. Chem. Soc., 2016, 138, 6380–6383 CrossRef CAS PubMed.
- H. Wan, J. Y. Yue, S. J. Zhu, T. Uno, X. D. Zhang, Q. L. Yang, K. Yu, G. S. Hong, J. Y. Wang, L. L. Li, Z. R. Ma, H. P Gao, Y. T. Zhong, J. Su, A. L. Antaris, Y. Xia, J. Luo, Y. Y. Liang and H. J Dai, Nat. Commun., 2018, 9, 1171 CrossRef PubMed.
- Q. Miao and K. Pu, Adv. Mater., 2018, 30, 1801778 CrossRef PubMed.
- W. X. Zeng, H. Y. Lai, W. K. Lee, M. Jiao, Y. J. Shiu, C. Zhong, S. L. Gong, T. Zhou, G. H. Xie, M. Sarma, K. T. Wong, C. C. Wu and C. L. Yang, Adv. Mater., 2018, 30, 1704961 CrossRef PubMed.
- A. Lv, M. Freitag, K. M. Chepiga, A. H. Schäfer, F. Glorius and L. F. Chi, Angew. Chem., Int. Ed., 2018, 57, 4792–4796 CrossRef CAS PubMed.
- D. O'Carroll, D. Iacopino, A. O'Riordan, P. Lovera, É. O'Connor, G. A. O'Brien and G. Redmond, Adv. Mater., 2008, 20, 42–48 CrossRef.
- F. Rizzo, F. Polo, G. Bottaro, S. Fantacci, S. Antonello, L. Armelao, S. Quici and F. Maran, J. Am. Chem. Soc., 2017, 139, 2060–2069 CrossRef CAS PubMed.
- K. M. Omer and A. J. Bard, J. Phys. Chem. C, 2009, 113, 11575–11578 CrossRef CAS.
- J. Suk, Z. Wu, L. Wang and A. J. Bard, J. Am. Chem. Soc., 2011, 133, 14675–14685 CrossRef CAS PubMed.
- Y. L. Chang, R. E. Palacios, F. R. F. Fan, A. J. Bard and P. F. Barbara, J. Am. Chem. Soc., 2008, 130, 8906–8907 CrossRef CAS PubMed.
- Y. Hong, J. W. Lam and B. Z. Tang, Chem. Soc. Rev., 2011, 40, 5361–5388 RSC.
- S. Carrara, A. Aliprandi, C. F. Hogan and L. De Cola, J. Am. Chem. Soc., 2017, 139, 14605–14610 CrossRef CAS PubMed.
- S. L. Liu, Q. H. Zhang, L. Zhang, L. Gu, G. Z. Zou, J. C. Bao and Z. H. Dai, J. Am. Chem. Soc., 2016, 138, 1154–1157 CrossRef CAS PubMed.
- S. Liu, Q. H. Zhang, L. Zhang, L. Gu, G. Z. Zou, J. C. Bao and Z. H. Dai, J. Am. Chem. Soc., 2016, 138, 1154–1157 CrossRef CAS PubMed.
- I. Ino, L. P. Wu, M. Munakata, T. Kuroda-Sowa, M. Maekawa, Y. Suenaga and R. Sakai, Inorg. Chem., 2000, 39, 5430–5436 CrossRef CAS PubMed.
- E. F. Fabrizio, I. Prieto and A. J. Bard, J. Am. Chem. Soc., 2000, 122, 4996–4997 CrossRef CAS.
- S. L. Liu, Q. Q. Zhang, L. Gu, L. Zhang, G. Z. Zou, J. C. Bao and Z. H. Dai, J. Am. Chem. Soc., 2016, 138, 1154–1157 CrossRef CAS PubMed.
- K. M. Molapo, A. Venkatanarayanan, C. M. Dolan, U. Prendergast, P. G. Baker, E. I. Iwuoha, T. E. Keyes and R. J. Forster, Electrochem. Commun., 2014, 48, 95–98 CrossRef CAS.
- F. Wang, J. Lin, T. Zhao, D. Hu, T. Wu and Y. Liu, J. Am. Chem. Soc., 2016, 138, 7718–7724 CrossRef CAS PubMed.
- R. Y. Lai and A. J. Bard, J. Phys. Chem. A, 2003, 107, 3335–3340 CrossRef CAS.
Footnote |
| † Electronic supplementary information (ESI) available: Reagents and materials, apparatus, and Fig. S1–S4. See DOI: 10.1039/c9sc00084d |
|
| This journal is © The Royal Society of Chemistry 2019 |
Click here to see how this site uses Cookies. View our privacy policy here. 
 Open Access Article
 This Open Access Article is licensed under a Creative Commons Attribution-Non Commercial 3.0 Unported Licence
 ,
Ya-Qin
Chai
,
Ya-Qin
Chai