
 Open Access Article
 This Open Access Article is licensed under a Creative Commons Attribution-Non Commercial 3.0 Unported Licence
Radical theory of hydride atomization confirmed after four decades – determination of H radicals in a quartz hydride atomizer by two-photon absorption laser-induced fluorescence†
Pavel
Dvořák
 a,
Marek
Talába
a,
Jan
Kratzer
b and
Jiří
Dědina
*b
a,
Marek
Talába
a,
Jan
Kratzer
b and
Jiří
Dědina
*b
aDepartment of Physical Electronics, Faculty of Science, Masaryk University, Kotlářská 2, Brno 611 37, Czech Republic
bInstitute of Analytical Chemistry of the Czech Academy of Sciences, Veveří 97, 60200 Brno, Czech Republic. E-mail: dedina@biomed.cas.cz
First published on 14th February 2019
Abstract
In an externally heated quartz atomizer, the most often used hydride atomizer for atomic absorption spectrometry, two-photon absorption laser-induced fluorescence (TALIF) was employed (i) to bring after four decades for the first time conclusive proof of the existence of H radical population sufficient to atomize hydrides thus confirming unambiguously the radical theory of hydride atomization and (ii) to determine the distribution of H radicals in the atomizer. Under typical operating conditions, H radicals are concentrated in an approximately 3 mm long cloud in the center of the optical arm and their peak concentration exceeds 1022 m−3, i.e. four orders of magnitude above the typical analytical concentration of hydride. The lowest detectable H radical concentration is in the order of 1019 m−3. The superb power of TALIF to determine the spatial distribution of H radicals in hydride atomizers for atomic absorption/fluorescence provides a route for elegant optimization of hydride atomization – just by establishing how the atomizer design and parameters influence the distribution of H radicals.
Introduction
Liquid phase sampling inductively coupled plasma mass spectrometry (ICPMS) generally serves as a trademark of unparalleled sensitivity for elemental and speciation analysis.1 However, when replacing sample nebulization with hydride generation (HG), ICPMS can be replaced by much simpler and cheaper atomic fluorescence spectrometry (AFS) or atomic absorption spectrometry (AAS). To reach comparable or even better performance, the final step of the whole procedure of element determination or of speciation analysis based on HG, on-line hydride atomization,2 must be optimized. Such an optimization would offer potential to positively influence analytical procedures for (ultra)trace element and speciation analysis that are required by research disciplines in environmental, biological and biomedical sciences, and in industry and agriculture.In general, various modifications of quartz tube atomizers (QTAs) and miniature flame atomizers, respectively, are most often employed for AAS and AFS.2 In an ideal case, the only form of analyte present in the observation volume of the atomizer should be free atoms, i.e. there is no decay of free atoms and no atomization interferences. Presently, the optimization of hydride atomization has to be performed by the laborious trial-and-error approach. Obviously, it could be done in a straightforward and elegant way based on the knowledge of what really happens in hydride atomizers. The theory describing what happens in atomizers – the radical theory of hydride atomization2–5 – is based on the formation of free hydrogen atoms (H radicals) at a concentration several orders of magnitude above that predicted by thermodynamic equilibrium calculations.5 The radicals are formed by these reactions:5
| H + O2 ⇔ OH + O |
| O + H2 ⇔ OH + H |
| OH + H2 ⇔ H2O + H |
| SeH2 + H → SeH + H2 |
| SeH + H → Se + H2 |
Until recently, there was no relevant information on H radical detection in hydride atomizers. Disregarding unpublished attempts to prove the presence of hydrogen atoms in an (evacuated) QTA based on absorption at 121.6 nm and using a catalytic probe,13 the only published evidence on the distribution of H radicals in a miniature flame hydride atomizer was described by Tesfalidet et al.14 who employed electron spin resonance spectroscopy. Unfortunately this approach cannot yield either acceptable spatial resolution or quantitative information on hydrogen atom distribution.
In general, H radicals can be determined in the gaseous phase at atmospheric pressure by spectroscopic methods. A catalytic probe15 can also be used, which is, however, nonselective. Absorption measurements do not provide spatially resolved data directly and they require wavelengths in the vacuum UV range, which makes them challenging. The disadvantage of resonance-enhanced multiphoton ionization16 is the complicated quantitative calibration. Consequently, two-photon absorption laser-induced fluorescence (TALIF) is currently the most suitable method as demonstrated by the determination of atomic hydrogen concentration in discharges17,18 as well as in flames.16,19–21 When measuring H radical density using TALIF, absorption of intense focused laser light with a wavelength of 205 nm is typically employed. The laser excites hydrogen atoms via two-photon absorption from the ground state (1 2S1/2) to the n = 3 states (3 2S1/2, 3 2D3/2 and 3 2D5/2) and the subsequent Hα fluorescence radiation at 656.3 nm is detected.17,18 Since collisional quenching is an important deexcitation mechanism, decreasing the quantum efficiency of the fluorescence, it is necessary to know the quenching rate constants for excited hydrogen atoms. These quenching rate constants for H (n = 3) were published in ref. 18 and 22. The TALIF of H radicals is usually calibrated by measuring TALIF of krypton at known pressure. The cross-sectional ratio for two-photon excitation of krypton and hydrogen was published in ref. 17 and 18 and the ratio of Einstein coefficients for fluorescence emission in ref. 23.
Recently, we presented the first TALIF measurement of H radical concentrations in a plasma discharge ignited at atmospheric pressure, specifically in a dielectric barrier discharge (DBD) atomizer.24–26 However, the hydride atomization mechanism in a DBD atomizer can be, in principle, completely different from that in other hydride atomizers since the processes in the plasma of DBDs are triggered by energetic electrons. The general target of the present work was the most often employed hydride atomizer for AAS – QTA. Our particular aims were (i) to finally bring conclusive proof of the existence of H radical population (sufficient to atomize hydrides) in QTAs and (ii) to determine the distribution of H radicals in the atomizer under typical experimental conditions.
Results and discussion
Laser & atomizer setup
The general scheme of the experiment is depicted in Fig. 1. Only the most relevant features of the system are discussed here. See the ESI† for a full description. The laser setup produced laser pulses at a wavelength of 205 or 204 nm for the two-photon excitation of atomic hydrogen or krypton, respectively.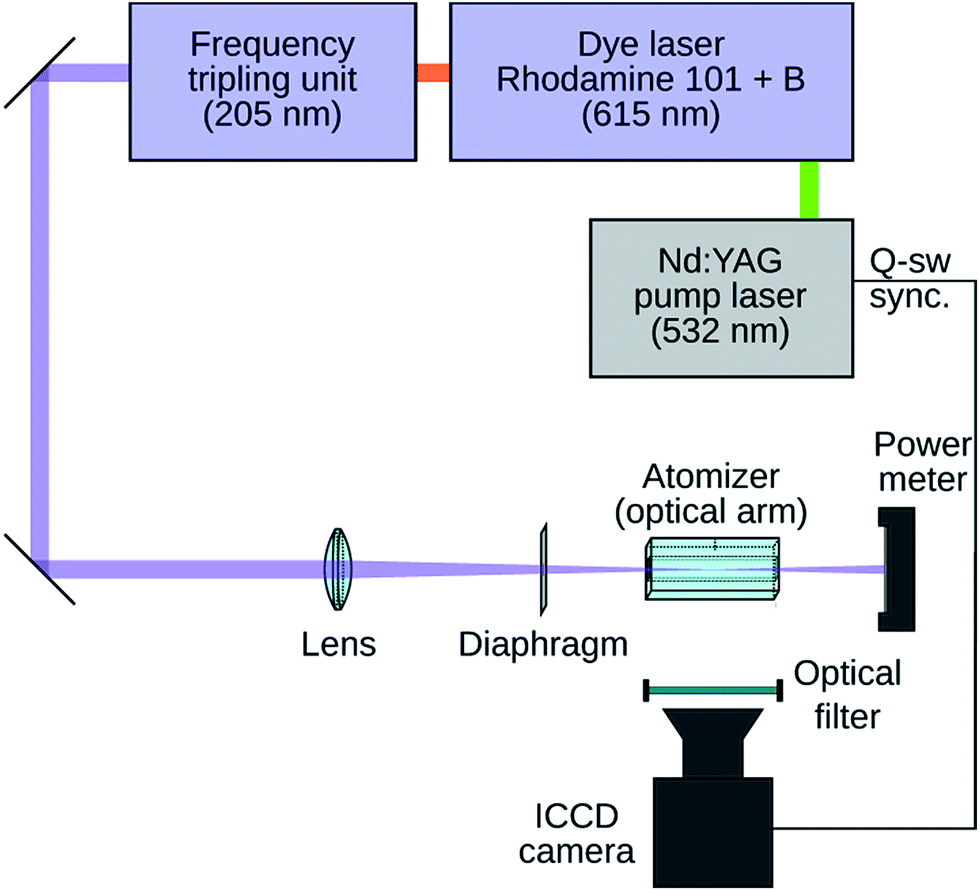 | ||
| Fig. 1 System configuration. | ||
An externally heated quartz atomizer having a rectangular cross-section of the optical (longitudinal) arm with inner dimensions of 7 mm (vertical) × 3 mm (horizontal) and a length of 75 mm was employed (Fig. 2). The optical arm was resistively heated to ca. 850 °C using a wire (not shown in Fig. 2) loosely spiraled around the optical arm to keep the optical arm walls transparent to fluorescence radiation. A quartz tube (2 mm inner diameter, 4 mm outer diameter) was sealed through the center of the bottom horizontal wall of the optical arm to form the vertically oriented inlet arm of the atomizer serving to deliver either Ar with H2 or Kr diluted in Ar. The flow rates of Ar and H2, respectively, were 125 and 15 ml min−1 (H2 flow rate corresponds for example to 1.2 ml min−1 of the delivery rate of 0.5% tetrahydroborate solution27). A silica O2 delivery capillary was centered inside the inlet arm with its tip slid up 1 mm over the junction of the inlet arm with the optical arm.
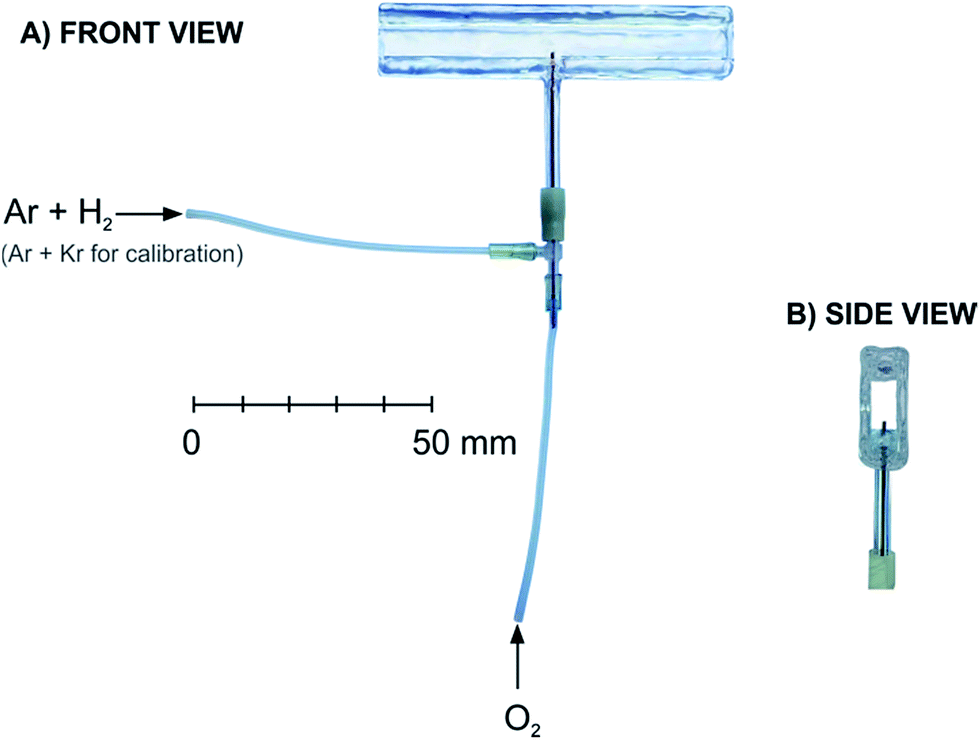 | ||
| Fig. 2 Atomizer. | ||
The laser beam was always (i) parallel to the (longitudinal) axis of the optical arm, (ii) positioned in the middle between the vertical walls of the optical arm and (iii) focused to the center of the optical arm length. Consequently, the axis of the inlet arm always crossed the laser beam in the focus. The following two laser-beam adjustments were used: in the first case designed to maximize the signal-to-noise ratio, a spherical lens was employed to create a circular laser beam cross-section having a diameter in the focus of below 0.1 mm. In the second case designed to realize 2D spatially resolved measurements of the TALIF signal, a cylindrical lens was employed to get a laser beam that was contracted only in the horizontal direction but kept its vertical dimensions. The laser beam cross-section in the focus was ca. 2 mm vertically and below 0.1 mm horizontally. See Fig. S1† for an illustration of the vertical distribution of the relative laser intensity in the focus.
Inside the whole optical arm, the dimensions of the laser beam profile were significantly smaller than the inner dimensions of the optical arm cavity (7 mm × 3 mm). The spatial variations of the laser beam profile were equal for both H detection and Kr calibration. Consequently, the possible decrease of the H TALIF signal outside the focal point of the used lens was reproduced during the calibration measurement and compensated for during the processing of measured data. The fluorescence radiation passing through the vertical wall was recorded perpendicularly using a camera. If not explicitly stated otherwise, the image was corrected to the radiation from the hot resistance wire. The image never included the optical arm sections at a distance higher than ±15 mm from the optical arm centre.
Calculation of H radical concentration
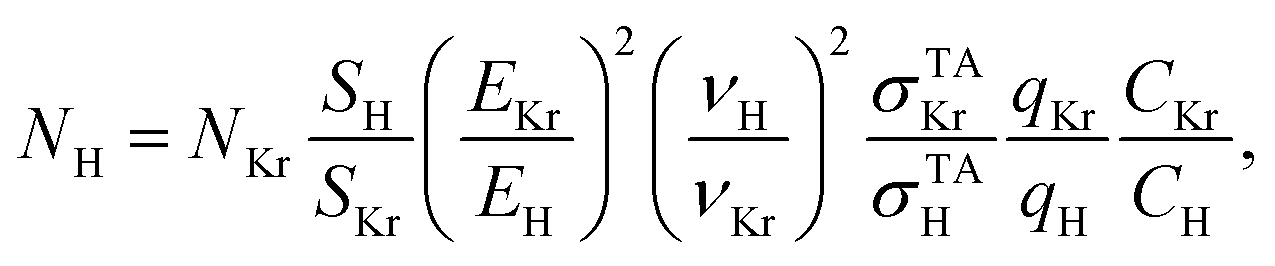
As described in ref. 26, the H concentration was calculated from the ratio of the H TALIF and Kr TALIF signals according to the formulawhere N denotes concentration, S is the measured TALIF signal (spectrally integrated over the whole excitation line), E is the energy of laser pulses, ν is the frequency of laser photons, σTA is the cross-section for two-photon absorption, q is the fluorescence quantum yield and C is the detector sensitivity. The fluorescence signal was measured at sufficiently low laser energy in order to exclude saturation effects. The ratio of the cross-section was taken from ref. 18. The quantum yield ratio qKr/qH was calculated by means of the Einstein coefficient ratio taken from ref. 23 and quenching rate constants published in ref. 18 and 22.
Minimum detectable H radical concentration
Taking into account the uncertainties of all measurements performed to determine H radical concentrations it can be estimated that the lowest detectable H radical concentration is in the order of 1019 m−3 for a laser beam focused using a spherical lens. The limit of detection in the experiments with a cylindrical lens is higher as a result of significantly smaller laser irradiance – in the order of 1021 m−3 in the beam center and it varies with the vertical position due to the vertical variation of laser irradiance.Preliminary observations
All attempts to detect H radicals when no oxygen was supplied to the O2 delivery capillary failed – the detected signals did not significantly differ from those observed in the absence of hydrogen introduced into the atomizer, i.e. in the limiting case when no H radicals can be formed. This applied for various laser beam cross-sections and laser beam positions inside the atomizer’s optical arm. Analogous results were obtained when oxygen at flow rates up to 6 ml min−1 was not delivered to the capillary but to the inlet arm together with Ar and H2.These observations, made under conditions optimum for hydride atomization,2 could seem to disprove the radical theory of hydride atomization in a QTA. However, it should be taken into account that the radical theory predicts the formation of a spatially limited cloud of H radicals at the beginning of the hot zone of the atomizer,2i.e. in the inlet arm 10 to 20 mm upstream from the junction. Consequently, the observations do not contradict the existence of a H radical cloud which is situated in the inlet arm and which vanishes upstream from the junction of the inlet arm with the optical arm. Such a cloud is assumed to fully atomize hydrides. Free analyte atoms formed are thus transported to the optical arm to be detected by AAS.
Since the present experimental arrangement did not make it possible to detect H radicals inside the inlet arm it was necessary to employ in all the following experiments an atomizer setup with an oxygen delivery capillary with its tip slid up 1 mm over the junction of the inlet arm with an optical arm.
Illustration of observed TALIF H signals
Fig. 3 shows the photographic image of the fluorescence intensity distribution at an O2 flow rate of 1 ml min−1 stimulated by a laser beam focused using a spherical lens to the region just above the tip of the O2 delivery capillary. In this case the image was not corrected to the radiation from the hot resistance wire so that the radiation from the wire coils helps to identify the atomizer’s shape. H radicals are located in a short section roughly 3 mm long (longitudinally) in the atomizer just above the inlet arm with the oxygen delivery capillary. This image cannot yield any information regarding H radical presence at heights above the bottom horizontal wall of the optical arm which substantially differ from 1 mm, i.e. in atomizer sections which were not subjected to laser irradiation.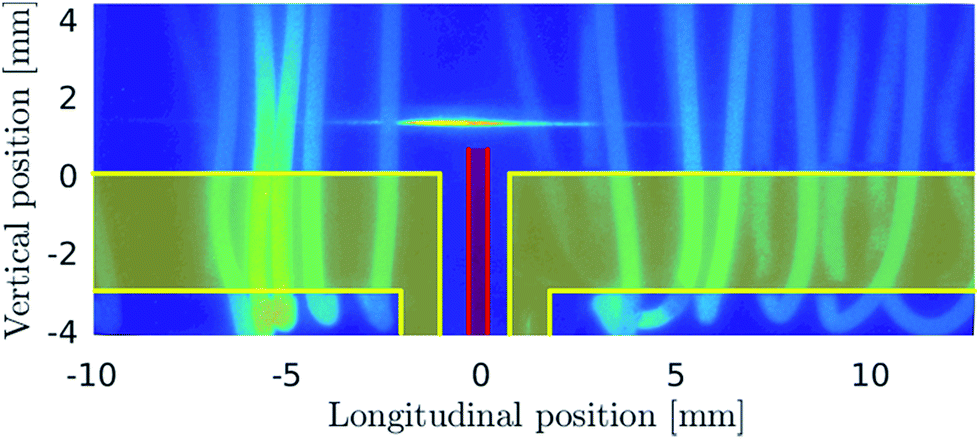 | ||
| Fig. 3 Photographic image of the TALIF H fluorescence in the central lower section of the atomizer’s optical arm. The image is supplemented with a schematically represented cross-section (i) of the appropriate part of the lower horizontal wall (thickness of 3 mm) of the optical arm (including the upper section of the inlet arm) highlighted in yellow and (ii) of the capillary walls highlighted in red. | ||
H-radical distribution
The H concentration calculated from the measurement shown in Fig. 3 is presented in Fig. 4. The graph clearly demonstrates that hydrogen atoms are concentrated namely in an approximately 3 mm long cloud in the center of the optical arm and their peak concentration exceeds 1022 m−3. A small shift of the cloud center to the left side of the optical arm, observed also in Fig. 3, should be attributed to tiny imperfections in the geometry of the capillary/inlet arm setup (the capillary tip could be slightly deflected from the axis of the inlet arm) or to a slightly asymmetric partition of the gas flow to the left and right parts of the optical arm.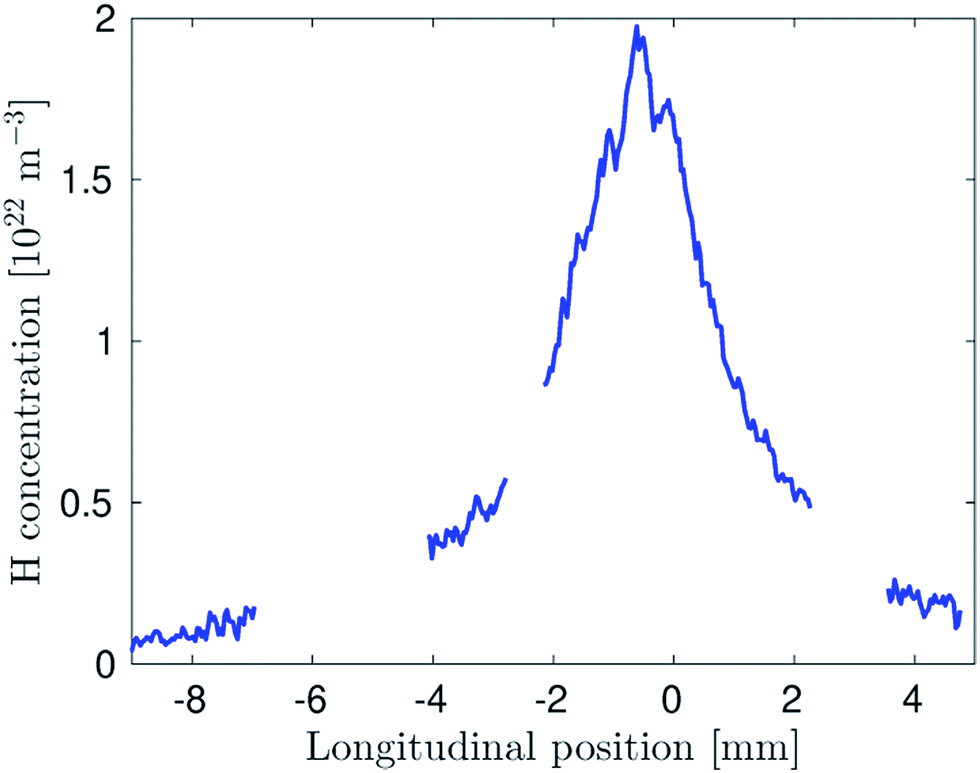 | ||
| Fig. 4 Concentration of H radicals at an O2 flow rate of 1 ml min−1. The interruptions of the shown curve correspond to regions where the TALIF signal was hidden behind the heating wires. | ||
Fig. 5 shows the distribution of H radicals measured with a laser beam focused with a cylindrical lens which enabled the detection of H radicals in an approximately 2 mm high region above the capillary end. The two dimensional graph shows the central section of the optical arm. Even though the oxygen flow rate here is several times higher than in the previous case (Fig. 3 and 4), the longitudinal size of the H radical cloud is around the same with its center above the inlet arm with the oxygen delivery capillary. The reason for the slight left-hand shift of the cloud is explained above. Because of the higher profile of the laser beam, a higher section of the H radical cloud can be observed (Fig. 5). It can be seen that the radical density decreases with increasing height above the capillary. From the measurements with higher beam positions inside the atomizer optical arm (not shown) it can be concluded that H density becomes negligible in the top sections of the atomizer above the capillary.
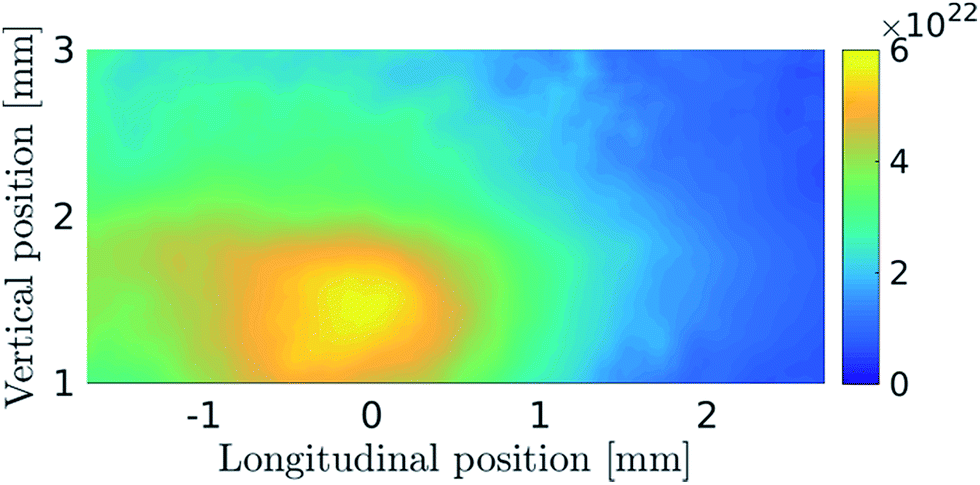 | ||
| Fig. 5 Map of H radical concentration in the atomizer center at an O2 flow rate of 3.2 ml min−1. The laser beam was focused using a cylindrical lens to a vertically oriented ca. 2 mm high sheet. The beginning of the coordinates is located at the junction of the inlet and optical arm, longitudinally in the center of the inlet arm, and vertically at the inner surface of the bottom horizontal wall of the optical arm. | ||
The influence of the oxygen flow rate on H-radical distribution
Additional experiments with various oxygen flow rates indicated that the horizontal size of the H-radical cloud did not depend appreciably on the oxygen flow rate to the capillary but the H-radical density in the cloud depended on the oxygen flow rate markedly (Fig. 6). H radical density increased with the oxygen flow rate up to the value close to the stoichiometric ratio and then the hydrogen atom density decreased. It should be highlighted that the maximum H-radical density was one order of magnitude higher than in the DBD atomizer.26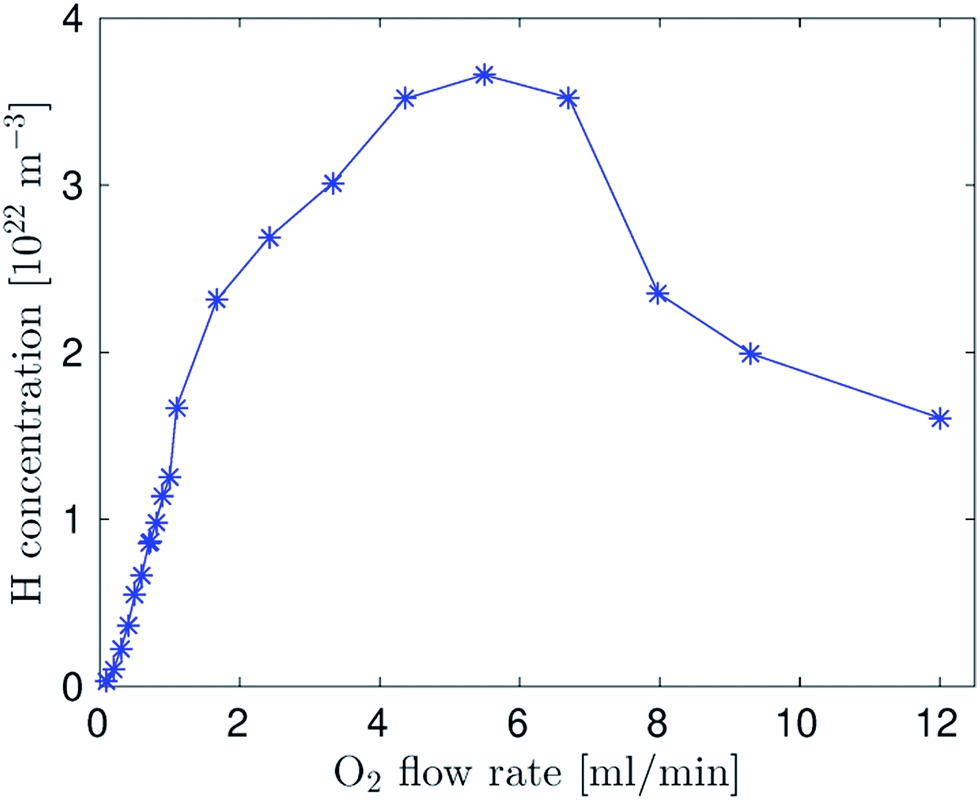 | ||
| Fig. 6 Dependence of H radical density in the cloud on the oxygen flow rate to the capillary. The graph shows concentration values detected for the laser beam focused using a spherical lens to the region just above the tip of the O2 delivery capillary and averaged over a ca. 4 mm long central part of the optical arm. | ||
Conclusions
It can be concluded that TALIF can be effectively used to determine the spatial distribution of H radicals in hydride atomizers. The presented measurements also confirm unambiguously for the first time the radical theory of hydride atomization in an externally heated QTA: there is a cloud of H radicals in the atomizer formed by reactions between oxygen and hydrogen. The cloud covers the whole cross-section of the inlet arm. The H radical density in the cloud is at least several orders of magnitude higher than the analytical concentration of hydride in the atomizer which is around 1018 m−3.27 (This corresponds for example to continuous flow generation of selenium hydride, 4 ml min−1 flow rate of the sample containing 10 ng ml−1 Se, 75 ml min−1 Ar flow rate plus 15 ml min−1 of hydrogen from tetrahydroborate decomposition, see for example ref. 27; and to an atomizer temperature of 800 °C.) It should be highlighted that water vapor which can be introduced into an atomizer during a typical analytical procedure should not have an appreciable effect on the H radical population in the atomizer. The reason is that even though H2O molecules can facilitate H radical recombination by acting as a third body, analogously as argon or as molecular hydrogen, the respective reaction rate constants do not differ substantially.28The present work is original in terms of bringing proof of the existence of H radical population (sufficient to atomize hydrides) and in terms of determination of the H radical distribution in a QTA.
The above discussed outcome of the radical theory of hydride atomization is that free analyte atoms formed from analyte hydrides are stable within the cloud of H radicals. The most important prerequisite for an ideal hydride atomizer is a complete conversion of the analyte to free atoms and no reactions of free atoms in the observed volume.2 Consequently, the proof that TALIF can be effectively used to determine the spatial distribution of H radicals in hydride atomizers for AAS and AFS opens a way for optimization of hydride atomization in a straightforward and elegant way – just by establishing how the atomizer design and parameters influence the distribution of H radicals. Such an optimization offers potential to positively influence analytical procedures for (ultra)trace element and speciation analysis that are required by research disciplines in environmental, biological and biomedical sciences, and in industry and agriculture.
Conflicts of interest
There are no conflicts to declare.Acknowledgements
The work was supported by the Czech Science Foundation, contract 17-04329S, by the Czech Academy of Sciences, Institute of Analytical Chemistry (Institutional Research Plan no. RVO: 68081715), by European Regional Development Fund (project CZ.1.05/2.1.00/03.0086) and by Ministry of Education, Youth and Sports of Czech Republic (project LO1411 (NPU I)). The authors are obliged to Dr Inga Petry-Podgórska for preparation of the graphical abstract and Fig. 2.Notes and references
- J. S. Becker, Inorganic Mass Spectrometry, John Wiley & Sons Ltd., Chichester, 2007 Search PubMed.
- J. Dědina, Spectrochim. Acta, Part B, 2007, 62, 846–872 CrossRef.
- J. Dědina and I. Rubeska, Spectrochim. Acta, Part B, 1980, 35, 119–128 CrossRef.
- B. Welz and M. Melcher, Anal. Chim. Acta, 1981, 131, 17–25 CrossRef CAS.
- J. Dědina and D. L. Tsalev, Hydride Generation Atomic Absorption Spectrometry, John Wiley & Sons, Inc., Chichester, 1995 Search PubMed.
- A. D. Campbell, Pure Appl. Chem., 1992, 64, 227–244 CAS.
- M. L. Cervera and R. Montoro, Fresenius' J. Anal. Chem., 1994, 348, 331–340 CrossRef CAS.
- X. P. Yan and Z.-m. Ni, Anal. Chim. Acta, 1994, 291, 89–105 CrossRef CAS.
- T. Nakahara, Adv. At. Spectrosc., 1995, 2, 139–178 CAS.
- A. R. Kumar and P. Riyazuddin, TrAC, Trends Anal. Chem., 2010, 29, 166–176 CrossRef CAS.
- A. R. Kumar and P. Riyazuddin, Anal. Sci., 2005, 21, 1401–1410 CrossRef CAS PubMed.
- B. Welz and M. Sperling, Atomic Absorption Spectrometry, Wiley-VCH, Weinheim, 3rd edn, 1999 Search PubMed.
- P. Stauss, Doktor der Naturwissenschaften thesis, Fakultat fur Chemie der Universitat Konstanz, 1993.
- S. Tesfalidet, G. Wikander and K. Irgum, Anal. Chem., 1999, 71, 1225–1231 CrossRef CAS.
- M. Mozetic, M. Drobnic, A. Pregelj and K. Zupan, Vacuum, 1996, 47, 943–945 CrossRef CAS.
- S. A. Redman, C. Chung, K. N. Rosser and M. N. R. Ashfold, Phys. Chem. Chem. Phys., 1999, 1, 1415–1424 RSC.
- M. G. H. Boogaarts, S. Mazouffre, G. J. Brinkman, H. W. P. van der Heijden, P. Vankan, J. A. M. van der Mullen, D. C. Schram and H. F. Dobele, Rev. Sci. Instrum., 2002, 73, 73–86 CrossRef CAS.
- K. Niemi, V. Schulz-von der Gathen and H. F. Dobele, J. Phys. D: Appl. Phys., 2001, 34, 2330–2335 CrossRef CAS.
- N. Georgiev and M. Alden, Appl. Spectrosc., 1997, 51, 1229–1237 CrossRef CAS.
- J. E. Goldsmith, Appl. Opt., 1990, 29, 4841–4842 CrossRef CAS PubMed.
- R. P. Lucht, J. T. Salmon, G. B. King, D. W. Sweeney and N. M. Laurendeau, Opt. Lett., 1983, 8, 365–367 CrossRef CAS PubMed.
- J. Bittner, K. Kohsehoinghaus, U. Meier and T. Just, Chem. Phys. Lett., 1988, 143, 571–576 CrossRef CAS.
- J. Jolly and J. P. Booth, J. Appl. Phys., 2005, 97, 103305 CrossRef.
- V. Procházka, Z. Tučeková, P. Dvořák, D. Kováčik, P. Slavíček, A. Zahoranová and J. Voráč, Plasma Sources Sci. Technol., 2018, 27, 015001 CrossRef.
- M. Mrkvičková, J. Ráhel, P. Dvořák, D. Trunec and T. Morávek, Plasma Sources Sci. Technol., 2016, 25, 055015 CrossRef.
- P. Dvořák, M. Talába, A. Obrusník, J. Kratzer and J. Dědina, Plasma Sources Sci. Technol., 2017, 26, 085002 CrossRef.
- O. Duben, J. Boušek, J. Dědina and J. Kratzer, Spectrochim. Acta, Part B, 2015, 111, 57–63 CrossRef CAS.
- G. Y. Gerasimov and O. P. Shatalov, J. Eng. Phys. Thermophys., 2013, 86, 987–995 CrossRef CAS.
Footnote |
| † Electronic supplementary information (ESI) available: Materials and methods, Fig. S1, notes and references. See DOI: 10.1039/c8sc05655b |
| This journal is © The Royal Society of Chemistry 2019 |