 Open Access Article
Chemical operations on a living single cell by open microfluidics for wound repair studies and organelle transport analysis†
Sifeng
Mao
 a,
Qiang
Zhang
 a,
Wu
Liu
a,
Qiushi
Huang
a,
Wu
Liu
a,
Qiushi
Huang
 a,
Mashooq
Khan
 a,
Wanling
Zhang
a,
Caihou
Lin
b,
Katsumi
Uchiyama
a,
Wanling
Zhang
a,
Caihou
Lin
b,
Katsumi
Uchiyama
 c and
Jin-Ming
Lin
 *a
*a
aDepartment of Chemistry, Beijing Key Laboratory of Microanalytical Methods and Instrumentation, MOE Key Laboratory of Bioorganic Phosphorus Chemistry & Chemical Biology, Tsinghua University, Beijing 100084, China. E-mail: jmlin@mail.tsinghua.edu.cn
bDepartment of Neurosurgery, Fujian Medical University Union Hospital, Fuzhou, Fujian 350001, China
cDepartment of Applied Chemistry, Graduate School of Urban Environmental Sciences, Tokyo Metropolitan University, Minamiohsawa, Hachioji, Tokyo 192-0397, Japan
First published on 4th December 2018
Abstract
Single cells are increasingly recognized to be capable of wound repair that is important for our mechanistic understanding of cell biology. The lack of flexible, facile, and friendly subcellular treatment methods has hindered single-cell wound repair studies and organelle transport analyses. Here we report a laminar flow based approach, we call it fluid cell knife (Fluid CK), that is capable of precisely cutting off or treating a portion of a single cell from its remaining portion in its original adherent state. Local operations on portions of a living single cell in its adherent culture state were applied to various types of cells. Temporal wound repair was successfully observed. Moreover, we successfully stained portions of a living single cell to measure the organelle transport speed (mitochondria as a model) inside a cell. This technique opens up new avenues for cellular wound repair and subcellular behavior analyses.
Introduction
Commonly, complex organisms are built from one, then two, then four seemingly identical cells of an embryo.1–4 Single cell analysis for cell type and activity has been confirmed a greater challenge than conventional studies on populations of cells.5–9 The importance of single-cell biology has sharply increased in recent years. Advances in new tools allow biologists to explore the characteristics of an individual cell. Single-cell biology promotes scientists to dissect the mysteries of life, one cell at a time.10,11 Wound repair is an essential feature for differentiating living beings from non-living matter, and these repair activities can also be observed at the single-cell level.12 More and more scientists have tried to understand wound repair at the single-cell level.13Massive efforts have been made into new approaches for single-cell analysis,14,15 including optical tweezers,16,17 microfluidic chips,18–20 dual capillary probes,21 and microfluidic probes.22 These technologies have greatly promoted single-cell research, such as single-cell metabolism,23–25 whole-genome sequencing analysis26,27 from single cells and cell-cycle dynamics of single cells.28 However, the cell itself is not homogeneous, and more efforts should be made in developing new tools for subcellular studies to understand the regional differences of a single cell. Moreover, operations on a portion of a cell are vital for understanding cell wound repair, signal transduction and molecule transfer in cells.
Microsampling methods,29–31 and fluidic force microscopy32–34 have performed well for the sampling of cellular contents. The use of a nanopipette has been demonstrated to be a convenient approach for precise drug infusion into a cell. The requirements of these technologies to have cell insertion operations means that they are harmful to live cells. Physical operations of tissues and cells by a knife or a needle have suffered from low spatial resolution. Microdissection35 has become the best choice for tissue and cell separation with high resolution. Yet, it is still difficult to operate on a portion of a cell, because the resolution is not high enough. Laminar flow in a microfluidic chip36,37 has been reported as a powerful tool for subcellular positioning and microenvironment control. However, cells should be cultured in the microchannel for treatment, because laminar flow is generated in a closed microchannel.36 Recently, microfluidic probes38,39 and chemical pens40–42 have been reported as promising approaches for fluid and laminar flow control in open spaces. Yet, precise operations and treatments of portions of a cell in situ are still of vital importance for subcellular studies.
In this work, we report a fluid cell knife, a highly flexible microfluidic methodology, which provides users with the abilities to cut off a portion of a living single cell at a precise position and treat portions of cells. The Fluid CK enables local excision of a desired single-cell and microenvironment control of a partial cell. In conventional methods43–45 for generating confined flow in an open space, the interface of the solution of interest with the adjacent one has remarkable positional fluctuations caused by the elasticity of the pathway and vibrations of pumps. It is difficult to maintain a stable interface at a precise position. The present device was designed with a symmetrical geometry, so the two solutions could contact each other to counteract the fluctuation. Benefiting from the symmetrical geometry, the interface of the two adjacent solutions was extremely stable.
Results and discussion
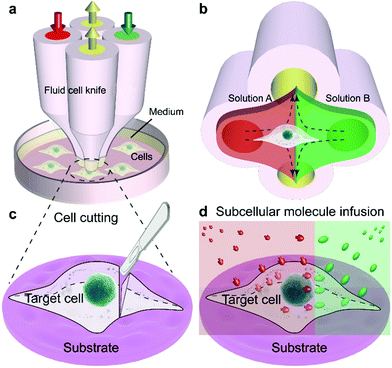
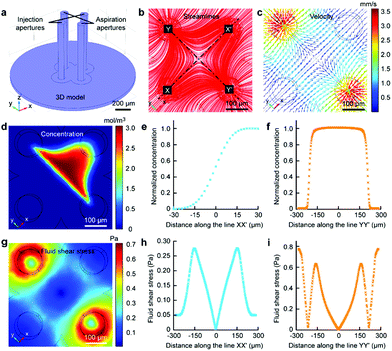
The Fluid CK was designed with symmetrical geometry containing four identical apertures (Fig. 1a). The manufacture of the device is detailed in Fig. S1.† The tip of the Fluid CK was placed perpendicular to the cell sample surface, and both were immersed in the surrounding medium (Fig. 1a and S2†). A “gap” existed between the tip of the Fluid CK and the sample surface. Solution A (red) and solution B (green) were injected into the device through two opposite apertures that were connected to two individual gas-tight syringes driven by one pump. The other two apertures were for solution aspiration by the connection to two individual gas-tight syringes driven by another pump. A planar interface across the centers of the two aspiration apertures was generated. The cell was manipulated to make the interface at a desirable subcellular position, resulting in one portion of the cell being immersed in solution A and the other portion in solution B (Fig. 1b). In one case, solution A was cell culture medium and solution B was cell lysis buffer. The portion in solution B would be cut off, while the other portion was well protected by the cell culture medium and left on the substrate (Fig. 1c). Therefore, the Fluid CK functioned as a lancet to slice a single cell. In another case, solution A and solution B contained different species, so different portions of the cell were infused with different types of molecules (Fig. 1d). Subcellular molecular infusions were achieved for partial cell staining and analyses of organelle transport. In the later experiments, the injected solutions were stopped first while aspirations were maintained. Thus, all solutions injected out would be totally aspirated back into the device. Then, the device was removed away and operations were finished.Finite element analysis (FEA) for the fluid underneath the Fluid CK was carried out using the commercially available software COMSOL Multiphysics 5.3 (Comsol). Navier–Stoke-equations and convection–diffusion equation were coupled in the FEA. The geometry of the model was identical to the device used in the experiments (Fig. 2a). Unless stated otherwise, the injection flow rate (Ri) = 1 μL min−1, the aspiration flow rate (Ra) = 10 μL min−1, and the gap = 50 μm. The injected solution containing fluorescein (1 μg mL−1, equal to 3 μM) as a diffusive species indicated the microjet region. The diffusion coefficient of fluorescein is 500 μm2 s−1.37 The bottom views of the streamlines and the velocity field at the substrate are shown in Fig. 2b and c, respectively. Both appeared to have symmetrical distributions.
The velocity profiles along line XX′ and YY′ were calculated (Fig. S3†). The concentration distribution of the species (Fig. 2d) had a planar interface along line YY′. A concentration gradient existed along line XX′ (Fig. 2e). Significantly, a uniform concentration was observed along line YY′ near the center (Fig. 2f), which indicated proper function of the laminar flow within this spatial range. As cells are sensitive to fluid shear stress (FSS),46,47 FSS distributions near the substrate were calculated (Fig. 2g). The FSS at the point near the center (with a distance smaller than 50 μm) was sufficiently lower than 0.1 Pa (Fig. 2h and i), which would not harm the cell.46 Negative pressure relative to atmospheric pressure existed between the two apertures at the substrate (Fig. S4†). The maxima of FSS (Fig. S5†), velocity (Fig. S6†) and pressure (Fig. S7†) were linear with the flow ratio as well as the injection flow rate. We could adjust those elements conveniently to meet further requirements in applications.
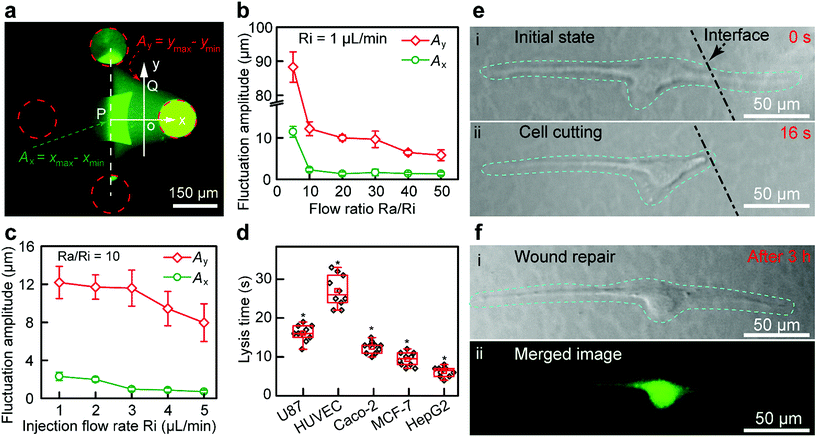
The structure of the Fluid CK (ESI Fig. S8a and b†) and the flatness of the tip surface (Fig. S8c†) were characterized using a scanning electron microscope (SEM). The zone of injected flow was confirmed using a fluorescein solution (Fig. 3a), and it was consistent with the results of the FEA. The boundaries were defined as 10% of the local maximum of fluorescence intensity. A planar interface with high stability was observed. Because of the flow fluctuations caused by the stepper motor in the pump and the elasticity of the Fluid CK and the connecting tube, the fluctuation amplitude (Ay) of the boundaries at the y-axis (point Q in Fig. 3a) was extremely large (Fig. 3b). In contrast, the flow fluctuation amplitude (Ax) at the x-axis (point P) was extremely small because the symmetry of the two injected solutions offset the undesirable fluctuations (Fig. 3b), which suggested a stable interface. Ax showed no significant change when the ratio was higher than 10 (Fig. 3b and S9†). Thus, the optimal ratio was selected as 10. Keeping a constant Ra/Ri, Ax and Ay decreased with increasing Ri. Ax was as small as 1 μm (Fig. 3c and S10†) when Ri was 1 μL min−1. The resolution was high enough for subcellular analysis. Those conditions were optimal in the latter experiments. The results suggested that the Fluid CK was capable of generating an extremely stable interface between two adjacent miscible solutions, and the reason for this is due to the symmetrical design.
A portion of a single cell was immersed in a certain solution environment near the interface. Therefore, the molecules in this solution environment would selectively treat the desired portion of the cell. In the subcellular cutting operation, RIPA non-denaturing tissue lysis buffer was injected into the upper right aperture, and cell culture medium was injected into the lower left aperture. The lysis buffer functioned for cutting portions of the cell, while the cell culture medium functioned for protecting other portions of the cell. The injection and aspiration flow rates were 1 and 10 μL min−1, respectively. The gap was 50 μm. Laminar flows were generated underneath the Fluid CK and a planar interface existed (the white dotted line in Fig. 3e-i). The target cell (an adherent cultured U87 cell) was positioned in the cell culture medium environment first (Fig. S11a†), and then moved towards and crossed the interface gradually. The portion of cell immersed in the lysis buffer environment was cut off rapidly (less than 20 s) (Fig. S11b, ESI Movie S1†). The lysis time is defined as the time from the initial immersion of a portion of a cell in the lysis buffer zone (Fig. 3e-i) until it is entirely cut (Fig. 3e-ii). The lysis time for individual U87 cells was varied within the range of 10 to 20 s (Fig. 3d). To investigate the applicability of the device, four more types of adherent cells, including HUVEC (Fig. S12†), Caco-2 (Fig. S13†), MCF-7 (Fig. S14†) and HepG2 cells (Fig. S15†), were successfully cut at desired positions. The results indicated that the Fluid CK was applicable to various types of adherent cells. The lysis times for any two different types of cells showed significant differences. The secretion levels of cell surface proteins and cytoskeleton proteins may contribute to these differences. In further research, mass spectrometric analysis and immunofluorescence analysis may be helpful to understand the differences.
After the entire cutting procedure (Fig. 3e-ii), the cell was cultured in an incubator for wound repair analysis. After 3 h, the cells were co-stained using a Live/Dead kit containing 4.5 μmol L−1 propidium iodide (PI) and 2 μmol L−1 calcein-AM (Thermo Fisher Scientific, USA) for 15 min. The live cell component is based on a cell-permeable dye for staining of live cells. The dead cell component is a cell-impermeable dye for the staining of dead and dying cells, which are characterized by compromised cell membranes. As shown in Fig. 3f-i, cell spreading was observed. The strong green fluorescence in the merged image (Fig. 3f-ii) indicates the high viability of the cell. Moreover, no red fluorescence was observed in Fig. 3f-ii, which means that the cell had complete cell membranes. The results demonstrate that the cell underwent wound repair.
As the cutting operation was based on destroying the removed part of a cell, it was difficult to avoid damage to the cell. In fact, membrane rupture occurred. The high viability (Fig. 3f-ii) after 3 h indicated that the operation was safe for the cell. Wound repair of cell plasma is a vital feature distinguishing living from non-living cells.48 In some microfluidics approaches,49 the probe or key functional part was integrated into the closed microchannel and it was not possible to perform spatial movements. As a result, the cells should move toward the probe or functional part with the fluid, and thus this is not applicable to adherent cells. The Fluid CK technique generated a stable laminar flow with a linear interface in open space that was convenient for treating any target adherent cell. Yet, the Fluid CK cannot be applied to cells in suspension, because the laminar flow is required to keep the cell in the same position. Here, our method provides a new avenue for cell cutting and wound repair studies for adherent cells at single-cell resolution. Furthermore, it is possible to improve the device for opening a cell by generating a curved stream confined by two adjacent flows.
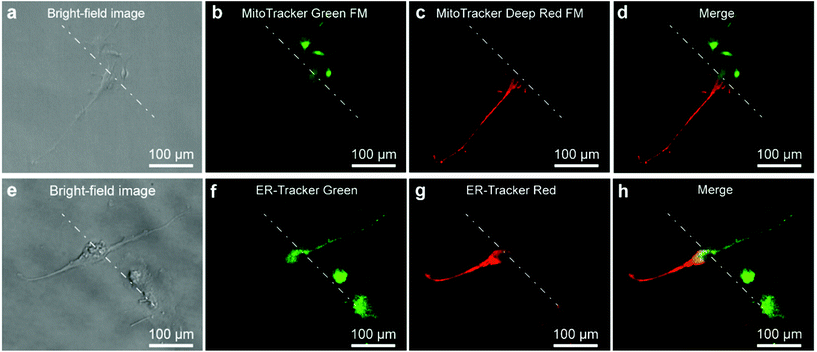
As the stable interface could control the microenvironment for portions of a cell, it was expected to perform well in subcellular molecular infusion. MitoTracker Green FM (1 μM) and MitoTracker Deep Red FM (0.5 μM) were prepared as the two injection solutions. A single U87 cell was positioned at the interface to carry out subcellular molecular infusion (Fig. 4a). One portion of the cell was stained with MitoTracker Green FM (Fig. 4b), while the other portion was stained with MitoTracker Deep Red FM (Fig. 4c). The mitochondria in the different portions of the cell appeared with different fluorescent colors after 3 min. A clear planar interface was observed between the portion with green fluorescence and the other portion with red fluorescence in the merged fluorescent image the cell (Fig. 4d). In the same manner, ER-Tracker Green (1 μM) and ER-Tracker Red (1 μM) were used for partial staining of the endoplasmic reticulum in a cell for 5 min (Fig. 4e–h). All of the results demonstrate that the Fluid CK has excellent performance in subcellular molecular infusion.
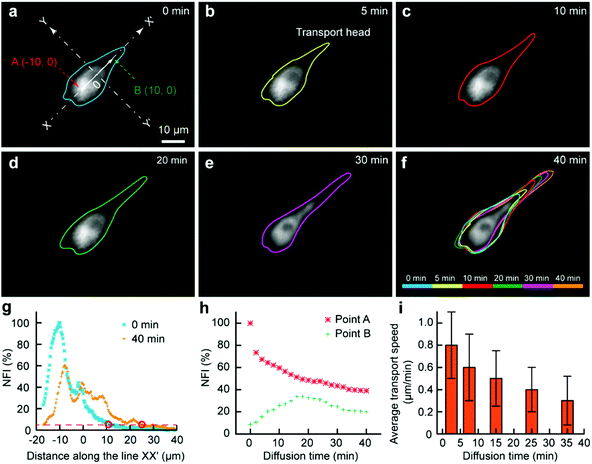
As some organelles usually float in the cell contents, we would like to assess the transport of organelles in intracellular environments. The mitochondria were selected as a model organelle. MitoTracker Deep Red FM (0.5 μM) and cell culture medium were the two injection solutions, where the cell culture medium was just used for the protection of the portions of the cell immersed in it. The target U87 cell was moved towards and then kept at the interface. After 3 min, the Fluid CK was moved always and the staining was finished (Fig. 5a). It was difficult to record the cell from the beginning, because molecular adsorption on the device caused a big background that had remarkable influences on the cell imaging. For convenience, the recording time for mitochondria transport was defined simply as zero at the time of moving the device away (Fig. 5a). The outlines of the stained portion were set as the boundaries where the fluorescence intensity was three times high than that of the background (S/N = 3). The fluorescent images over time, with outlines of the stained mitochondria distribution zone, are shown in Fig. 5a–f. The cell was tracked for more than 2 h. After 40 min, the fluorescence had reached the opposite boundary of the cell. Although transport may still continue, no significant changes were observed after 40 min. A color overlap of the outlines is shown in Fig. 5f, and significant transport of the stained mitochondria along line XX′ was observed. The profiles of the normalized fluorescence intensity (NFI) at the time of 0 min and the time of 40 min appeared with a significant spatial extension along line XX′ (Fig. 5g). The temporal changes of the fluorescence intensity at point A and point B were recorded (Fig. 5h). The NFI at point A decreased gradually, resulting from the transport of the stained mitochondria towards the upper right and the effect of fluorescence quenching. At the beginning, the NFI of point B increased gradually, and it then decreased under the effects of continuous fluorescence quenching and the decreased transport of stained mitochondria to point B (Fig. 5h). The average transport speed (V) at different time segments was calculated by dividing the moving distance of the transport head (Fig. 5b) by the period of time. The speed decreased gradually because of the continuously decreasing amount of labelled mitochondria at the transport head (Fig. 5i). All the results indicated that our method provides a new approach for subcellular studies and organelle behavior analyses.
Scientists have focused more on single-cell analysis5,10 and subcellular studies.36 The methods for subcellular operations will be applicable to understanding how single cells heal membrane ruptures and restore lost structures. The physical and molecular mechanisms for cell healing remains poorly understood.13 Our method, capable of damaging part of a cell, might be a potential approach for studying membrane rebuilding. Moreover, signal transmission is an essential function in a cell.50 The capability of subcellular molecular infusion will be helpful for investigating signal transmission in a living cell.
Conclusions
In this work, we have established a novel method for chemical operations on single cells, including precise cell cutting operations and subcellular molecular infusion. A fluid cell knife was developed to carry out those tasks. The device was proved to be a universal approach for precise cell cutting operations for various types of adherent cells. Significantly, wound repair was observed for the cut cell. The Fluid CK was capable of subcellular infusion of molecules into portions of a cell. Moreover, the transport behavior of the organelle, mitochondria, was explored, and the transport speed was obtained. Our results indicate that partial treatment using laminar flows in open space generated by the Fluid CK is an effective way to deliver small molecules to selected domains inside a single mammalian cell. This technique opens up avenues for the control of subcellular microenvironments, precise cellular cutting, wound repair analysis and subcellular molecular infusion.Conflicts of interest
There are no conflicts to declare.Acknowledgements
We acknowledge the National Natural Science Foundation of China (No. 21435002, 21727814 and 21621003), the Beijing Natural Science Foundation (2184106) and the China Postdoctoral Science Foundation (2018T110085, 2017M620733).Notes and references
- C. Lombard-Banek, S. A. Moody and P. Nemes, Angew. Chem., Int. Ed., 2016, 55, 2454–2458 CrossRef CAS PubMed.
- R. M. Onjiko, S. A. Moody and P. Nemes, Proc. Natl. Acad. Sci. U. S. A., 2015, 112, 6545 CrossRef CAS PubMed.
- A. M. Klein, L. Mazutis, I. Akartuna, N. Tallapragada, A. Veres, V. Li, L. Peshkin, D. A. Weitz and M. W. Kirschner, Cell, 2015, 161, 1187–1201 CrossRef CAS PubMed.
- S. Mao, W. Zhang, Q. Huang, M. Khan, H. Li, K. Uchiyama and J. M. Lin, Angew. Chem., Int. Ed., 2018, 57, 236–240 CrossRef CAS PubMed.
- A. Giladi and I. Amit, Nature, 2017, 547, 27 CrossRef CAS PubMed.
- H. Yukawa and Y. Baba, Anal. Chem., 2017, 89, 2671–2681 CrossRef CAS PubMed.
- J. Lu, X. Zhong, H. Liu, L. Hao, C. T.-L. Huang, M. A. Sherafat, J. Jones, M. Ayala, L. Li and S.-C. Zhang, Nat. Biotechnol., 2016, 34, 89–94 CrossRef CAS PubMed.
- R. N. Zare and S. Kim, Annu. Rev. Biomed. Eng., 2010, 12, 187–201 CrossRef CAS PubMed.
- L. Hao, J. Johnson, C. B. Lietz, A. Buchberger, D. Frost, W. J. Kao and L. Li, Anal. Chem., 2017, 89, 1138–1146 CrossRef CAS PubMed.
- E. Callaway, Nature, 2017, 547, 20 CrossRef CAS PubMed.
- X. T. Li, S. L. Zhao, H. K. Hu and Y. M. Liu, J. Chromatogr. A, 2016, 1451, 156–163 CrossRef CAS PubMed.
- Y. Gai, C. M. Leong, W. Cai and S. K. Y. Tang, Proc. Natl. Acad. Sci. U. S. A., 2016, 113, 12082–12087 CrossRef CAS PubMed.
- S. K. Y. Tang and W. F. Marshall, Science, 2017, 356, 1022 CrossRef CAS PubMed.
- C. H. Lu, C. L. Zhu, J. Li, J. J. Liu, X. Chen and H. H. Yang, Chem. Commun., 2010, 46, 3116–3118 RSC.
- X. Fu, W. J. Shang, S. S. Wang, Y. P. Liu, J. Y. Qu, X. Chen, P. G. Wang and J. Q. Fang, Chem. Commun., 2017, 53, 3555–3558 RSC.
- M. P. Macdonald, G. C. Spalding and K. Dholakia, Nature, 2003, 426, 421 CrossRef CAS PubMed.
- V. V. Kotlyar, A. A. Kovalev and A. P. Porfirev, J. Appl. Phys., 2016, 120, 023101 CrossRef.
- S. Khakshour, M. P. Labrecque, H. Esmaeilsabzali, F. J. S. Lee, M. E. Cox, E. J. Park and T. V. Beischlag, Sci. Rep., 2017, 7, 7833 CrossRef CAS PubMed.
- M. E. Gallina, T. J. Kim, M. Shelor, J. Vasquez, A. Mongersun, M. Kim, S. K. Y. Tang, P. Abbyad and G. Pratx, Anal. Chem., 2017, 89, 6472–6481 CrossRef CAS PubMed.
- M. Tabuchi, M. Ueda, N. Kaji, Y. Yamasaki, Y. Nagasaki, K. Yoshikawa, K. Kataoka and Y. Baba, Nat. Biotechnol., 2004, 22, 337 CrossRef CAS PubMed.
- A. Ainla, E. T. Jansson, N. Stepanyants, O. Orwar and A. Jesorka, Anal.Chem., 2010, 82, 4529–4536 CrossRef CAS PubMed.
- D. Juncker, H. Schmid and E. Delamarche, Nat. Mater., 2005, 4, 622–628 CrossRef CAS PubMed.
- R.-C. Qian, Y. Cao, L.-J. Zhao, Z. Gu and Y.-T. Long, Angew. Chem., Int. Ed., 2017, 56, 4802–4805 CrossRef CAS PubMed.
- H. Tian, Y. Sun, C. Liu, X. Duan, W. Tang and Z. Li, Anal. Chem., 2016, 88, 11384–11389 CrossRef CAS PubMed.
- Q. Huang, S. Mao, M. Khan, L. Zhou and J. M. Lin, Chem. Commun., 2018, 54, 2598 Search PubMed.
- Y. Fu, H. Chen, L. Liu and Y. Huang, Anal. Chem., 2016, 88, 10795–10799 CrossRef CAS PubMed.
- M. Kaiser, F. Jug, T. Julou, S. Deshpande, T. Pfohl, O. K. Silander, G. Myers and E. van Nimwegen, Nat. Commun., 2018, 9, 212 CrossRef PubMed.
- T. Nagano, Y. Lubling, C. Vaarnai, C. Dudley, W. Leung, Y. Baran, N. M. Cohen, S. Wingett, P. Fraser and A. Tanay, Nature, 2017, 547, 61–68 CrossRef CAS PubMed.
- T. Fujii, S. Matsuda, M. L. Tejedor, T. Esaki, I. Sakane, H. Mizuno, N. Tsuyama and T. Masujima, Nat. Protoc., 2015, 10, 1445–1456 CrossRef CAS.
- H. Mizuno, N. Tsuyama, T. Harada and T. Masujima, J. Mass Spectrom., 2008, 43, 1692–1700 CrossRef CAS PubMed.
- X. Y. Gong, Y. Y. Zhao, S. Q. Cai, S. J. Fu, C. D. Yang, S. C. Zhang and X. R. Zhang, Anal. Chem., 2014, 86, 3809–3816 CrossRef CAS PubMed.
- O. Guillaume-Gentil, T. Rey, P. Kiefer, A. J. Ibáñez, R. Steinhoff, R. Brönnimann, L. Dorwling-Carter, T. Zambelli, R. Zenobi and J. A. Vorholt, Anal. Chem., 2017, 89, 5017–5023 CrossRef CAS PubMed.
- O. Guillaumegentil, R. V. Grindberg, R. Kooger, L. Dorwlingcarter, V. Martinez, D. Ossola, M. Pilhofer, T. Zambelli and J. A. Vorholt, Cell, 2016, 166, 506–516 CrossRef CAS PubMed.
- A. Meister, M. Gabi, P. Behr, P. Studer, J. Vörös, P. Niedermann, J. Bitterli, J. Polesel-Maris, M. Liley, H. Heinzelmann and T. Zambelli, Nano Lett., 2009, 9, 2501–2507 CrossRef CAS PubMed.
- R. A. Moffitt, R. Marayati, E. L. Flate, K. E. Volmar, S. G. H. Loeza, K. A. Hoadley, N. U. Rashid, L. A. Williams, S. C. Eaton, A. H. Chung, J. K. Smyla, J. M. Anderson, H. J. Kim, D. J. Bentrem, M. S. Talamonti, C. A. Iacobuzio-Donahue, M. A. Hollingsworth and J. J. Yeh, Nat. Genet., 2015, 47, 1168 CrossRef CAS PubMed.
- S. Takayama, E. Ostuni, P. LeDuc, K. Naruse, D. E. Ingber and G. M. Whitesides, Nature, 2001, 411, 1016 CrossRef CAS.
- J. Atencia and D. J. Beebe, Nature, 2002, 437, 648–655 CrossRef PubMed.
- M. A. Qasaimeh, T. Gervais and D. Juncker, Nat. Commun., 2011, 2, 464 CrossRef PubMed.
- G. V. Kaigala, R. D. Lovchik and E. Delamarche, Angew. Chem., Int. Ed., 2012, 51, 11224–11240 CrossRef CAS PubMed.
- Y. Zhang, S. Mao, Y. Suzuki, Y. Tanaka, M. Kawaguchi, W. Zhang, H. Zeng, H. Nakajima, M. Yang and K. Uchiyama, Chem. Commun., 2018, 54, 719–722 RSC.
- S. Mao, C. Sato, Y. Suzuki, J. Yang, H. Zeng, H. Nakajima, M. Yang, J.-M. Lin and K. Uchiyama, ChemPhysChem, 2016, 17, 3155–3159 CrossRef CAS PubMed.
- S. Mao, Y. Zhang, H. Li, H. Zeng, J. M. Lin and K. Uchiyama, J. Mater. Chem. C, 2017, 5, 11666–11671 RSC.
- A. Queval, N. R. Ghattamaneni, C. M. Perrault, R. Gill, M. Mirzaei, R. A. McKinney and D. Juncker, Lab Chip, 2010, 10, 326–334 RSC.
- J. Autebert, A. Kashyap, R. D. Lovchik, E. Delamarche and G. V. Kaigala, Langmuir, 2014, 30, 3640–3645 CrossRef CAS PubMed.
- O. Feinerman and E. Moses, J. Neurosci. Methods, 2003, 127, 75–84 CrossRef PubMed.
- M. Abadier, A. B. Pramod, S. McArdle, A. Marki, Z. C. Fan, E. Gutierrez, A. Groisman and K. Ley, Cell Rep., 2017, 21, 3885–3899 CrossRef CAS PubMed.
- Z. He, W. Zhang, S. Mao, N. Li, H. Li and J.-M. Lin, Anal. Chem., 2018, 90, 5540–5545 CrossRef CAS PubMed.
- D. R. Griffin, W. M. Weaver, P. O. Scumpia, D. Di Carlo and T. Segura, Nat. Mater., 2015, 14, 737–744 CrossRef CAS PubMed.
- L. R. Blauch, Y. Gai, J. W. Khor, P. Sood, W. F. Marshall and S. K. Y. Tang, Proc. Natl. Acad. Sci. U. S. A., 2017, 114, 7283 CrossRef CAS PubMed.
- Y. E. Korchev, Y. A. Negulyaev, C. R. W. Edwards, I. Vodyanoy and M. J. Lab, Nat. Cell Biol., 2000, 2, 616 CrossRef CAS PubMed.
Footnote |
| † Electronic supplementary information (ESI) available. See DOI: 10.1039/c8sc05104f |
| This journal is © The Royal Society of Chemistry 2019 |

