
 Open Access Article
 This Open Access Article is licensed under a Creative Commons Attribution-Non Commercial 3.0 Unported Licence
Origin of the low-temperature endotherm of acid-doped ice VI: new hydrogen-ordered phase of ice or deep glassy states?
Alexander
Rosu-Finsen
 and
Christoph G.
Salzmann
*
and
Christoph G.
Salzmann
*
Department of Chemistry, University College London, 20 Gordon Street, London WC1H 0AJ, UK. E-mail: c.salzmann@ucl.ac.uk
First published on 10th October 2018
Abstract
On the basis of a low-temperature endotherm, it has recently been argued that cooling acid-doped ice VI at high pressures leads to a new hydrogen-ordered phase. We show that the endotherms are in fact caused by the glass transitions of deep glassy states related to ice VI. As expected for such endothermic overshoot effects, they display a characteristic dependence on pressure and cooling rate, they can be produced by sub-Tg annealing at ambient pressure, and they can be made to appear or disappear depending on the heating rate and the initial extent of relaxation. It is stressed that the existence of a new crystalline phase, as it has been suggested, cannot depend on the heating rate at which it is heated. X-ray diffraction shows that samples for which the low-temperature endotherm is present, weak or absent, as observed at a heating rate of 5 K min−1, are structurally very similar. Furthermore, we show that the reported shifts of the (102) Bragg peak upon heating are fully consistent with our scenario and also with our earlier neutron diffraction study. Deuterated acid-doped ice VI cooled at high pressure also displays a low-temperature endotherm and its neutron diffraction pattern is consistent with deep glassy ice VI. Accessing deep glassy states of ice with the help of acid doping opens up a fascinating new chapter in ice research. Compared to pure ice VI, the glass transition temperature is lowered by more than 30 K by the acid dopant. Future work should focus on the deep glassy states related to all the other hydrogen-disordered ices including the ‘ordinary’ ice Ih.
Introduction
Ice VI is a tetragonal high-pressure phase of ice that can be crystallised from liquid water in the 0.6 to 2.2 GPa pressure range.1,2 Like all other known liquidus phases of ice, it displays orientational disorder of its fully hydrogen-bonded water molecules and its structure is therefore described as hydrogen-disordered.2,3 Due to insufficiently fast reorientation dynamics at low temperatures, the orientational disorder of the water molecules is frozen-in upon cooling ice VI under pressure.3,4 Only very weak hydrogen-ordering processes at low temperatures have been suggested on the basis of dielectric spectroscopy,5,6 thermal conductivity7 and thermal expansion measurements.8 However, low-temperature Raman and FT-IR spectroscopy did not detect any signs of hydrogen order in ice VI at low temperatures9,10 even if the samples were doped with potassium hydroxide,11 which was found to promote hydrogen ordering of the ‘ordinary’ ice Ih to give ice XI.12A breakthrough in hydrogen ordering ice VI was achieved by Salzmann et al. who used hydrochloric acid (HCl) as a dopant,13 which they had previously shown to enable hydrogen ordering of ices V and XII.14–18 The newly discovered hydrogen-ordered counterpart of ice VI was named ice XV.13 On the basis of neutron diffraction data, it was shown that ice XV is antiferroelectric and pseudo-orthorhombic with P![[1 with combining macron]](https://www.rsc.org/images/entities/char_0031_0304.gif) space group symmetry.13,19 Hydrofluoric and hydrobromic-acid doping were recently shown to facilitate the formation of ice XV as well.20 However, HCl was still found to be the most effective dopant, which was attributed to a favourable combination of high solubility in ice VI and its high acid strength.20 In addition to a Raman spectroscopic study of ice XV,21 the hydrogen-ordering of ice VI has been the focus of several computational studies.22–25
space group symmetry.13,19 Hydrofluoric and hydrobromic-acid doping were recently shown to facilitate the formation of ice XV as well.20 However, HCl was still found to be the most effective dopant, which was attributed to a favourable combination of high solubility in ice VI and its high acid strength.20 In addition to a Raman spectroscopic study of ice XV,21 the hydrogen-ordering of ice VI has been the focus of several computational studies.22–25
Using neutron diffraction and differential scanning calorimetry (DSC), it was shown that the most ordered ice XV can be obtained upon slow-cooling at ambient pressure, whereas cooling under pressure suppresses the hydrogen ordering.13,19,26 DCl-doped D2O samples either quenched at 1.0 GPa or slow-cooled at 1.4 GPa displayed diffraction patterns consistent with fully hydrogen-disordered ice VI.26 Upon heating such samples at ambient pressure, the hydrogen-disordered samples were found to undergo a transient ordering process, which went along with the appearance of the Bragg peaks and changes in lattice constants characteristic for ice XV, followed by hydrogen-disordering to ice VI.26 Using DSC, the transient ordering was seen in the form of an initial exotherm which was immediately followed by an endotherm signalling the disordering to ice VI.19 The extent of the transient ordering was found to depend strongly on the heating rate, and whether H2O or D2O samples were investigated. It is noted that a similar transient ordering feature has also been observed from the changes in lattice constants upon heating a pressure-cooled ice XIII sample at ambient pressure.16 Ice IX samples cooled at different cooling rates under pressure displayed slightly different lattice constants also indicating the sensitivity of lattice constants towards the extent of hydrogen (dis)order.27
After slow-cooling at ambient pressure, which yields the most highly ordered ice XV prepared so far, the transient ordering feature is no longer observed.19,20 Instead, the hydrogen-disordering of ice XV upon heating takes place in two distinct stages starting with a broad endotherm at ∼102 K which is followed by a sharp endothermic peak with an onset temperature of ∼130 K.19,20 Analysis of the calorimetric data shows that the transition of the most ordered ice XV to ice VI goes along with a change of ∼50% of the Pauling entropy, which reflects the expected entropy change for a transition from fully hydrogen-ordered to fully hydrogen-disordered ice.28 Since ice VI is fully hydrogen-disordered, this indicates residual disorder in ice XV, which has also been found in neutron diffraction.13,26,29
Very recently, Gasser et al. have shown that slow-cooling HCl-doped ice VI at 3.0 K min−1 at pressures between 1.45 and 2.0 GPa leads to the appearance of low-temperature endotherms centred at ∼110 K upon heating at ambient pressure.30 This irreversible calorimetric feature was assigned to the phase transition of a new hydrogen-ordered phase of ice to ice XV. Gasser et al. stated that the new phase of ice is more hydrogen-ordered and more thermodynamically stable than ice XV.30 Furthermore, it was noted that the preparation of a corresponding D2O phase was unsuccessful.
Here we critically test these claims by investigating the conditions that lead to the appearance of the low-temperature endotherm in detail. This includes extensive DSC measurements as well as X-ray and neutron diffraction experiments. We show that the conclusions reached by Gasser et al.30 are incompatible with our new experimental data and we provide a new explanation for the origin of the low-temperature endotherms of HCl-doped ice VI/XV.
Experimental methods
Preparation of doped ice VI/XV samples
For the preparation of doped H2O ice VI/XV samples, a 0.01 M HCl solution (purchased as standard solution from Sigma Aldrich) was pipetted into an indium cup inside a hardened-steel pressure die pre-cooled with liquid nitrogen. The samples were then pressurised with a 30-tonne hydraulic press to 1.0, 1.4 or 1.8 GPa, heated isobarically to 250 K and either quenched with liquid nitrogen (∼40 K min−1) or slow-cooled at 2.5 K min−1 to 77 K while maintaining a constant pressure. For the 1.0 and 1.4 GPa samples, 0.7 mL of the solutions were injected into the indium cups in a 1.0 cm diameter pressure die, whereas the 1.8 GPa samples were made from 0.3 mL solutions in a 0.8 cm diameter pressure die. Once 77 K was reached, the pressure was slowly released to ambient pressure. Finally, the samples were recovered under liquid nitrogen and freed from the indium. In addition to the H2O samples, corresponding 0.01 M DCl-doped D2O samples were prepared by heating to 250 K at 1.8 GPa and quenching.Differential scanning calorimetry
A few small pieces of the doped ices were transferred into stainless-steel capsules under liquid nitrogen. These were then quickly transferred into a pre-cooled Perkin Elmer DSC 8000 advanced double-furnace differential scanning calorimeter with a base temperature of 93 K. Selected samples were first annealed in the DSC at 93 K for two or six hours. Annealed as well as as-made samples were then heated from 93 to 263 K at a range of different heating rates from 2 to 30 K min−1. A few samples were first heated to 138 K followed by cooling back to 93 K at 5 K min−1. These samples were then reheated to 263 K like the previous samples. After this, the respective heating/cooling regimes were repeated but with now ice Ih in the capsule to record data for background corrections of the previously recorded DSC scans. The moles of H2O (D2O) in the DSC capsules were determined by recording the melting of ice Ih at 0 °C (4 °C), and using 6012 (6280) J mol−1 as the enthalpy of melting of H2O (D2O) ice Ih. Finally, the DSC signal of the background-corrected thermograms was divided by the number of moles of H2O or D2O and the heating/cooling rate yielding a quantity with J mol−1 K−1 as the unit.Powder X-ray and neutron diffraction
Powders of the recovered H2O ice samples were transferred under liquid nitrogen into a purpose-built Kapton-window sample holder mounted on a Stoe Stadi P X-ray diffractometer with Cu Kα1 radiation at 40 kV, 30 mA and monochromated by a Ge 111 crystal. Data were immediately collected after the sample transfer using a Mythen 1K linear detector and the temperature of the samples was maintained at 95 K with an Oxford Instruments CryojetHT. For collecting neutron diffraction patterns, powders of the D2O samples were transferred into 8 mm diameter cylindrical vanadium cans under liquid nitrogen and transferred into an AS Scientific ‘Orange’ cryostat precooled to 80 K on the POLARIS beamline at the ISIS neutron and muon source.Results and discussion
In the following, we show that the low-temperature endotherm of HCl-doped ice VI/XV is a kinetic feature due to an underlying glass transition associated with the unfreezing of reorientation dynamics. This means that it cannot be assigned to a thermodynamic first-order type transition from a new, thermodynamically stable phase of ice to ice XV as proposed by Gasser et al.30 Before presenting the new experimental data, a brief overview of the thermodynamics and kinetics of hydrogen-ordering phase transitions in ice is given.Fig. 1 shows a schematic illustration of the processes that can take place in terms of enthalpy changes upon isobaric cooling of a hydrogen-disordered phase of ice such as ice VI.31 The hydrogen-disordered state is thermodynamically stable at high temperatures and characterised by dynamic reorientations of the water molecules. Upon lowering the temperature, the reorientations dynamics slow down and, as observed for pure ice VI, the sample undergoes a glass transition at Tg(pure) where the reorientation dynamics are frozen-in on the experimental time scale and a glassy state is obtained (pathway 1).19,32 It is emphasised that the term ‘glassy’ refers only to the reorientation dynamics of the water molecules in this case since the oxygen atoms are held in place by the hydrogen bonding with the neighbouring water molecules. More extensive discussions regarding the distinction of glassy hydrogen-disordered ices from traditional glasses obtained by supercooling liquids are given in ref. 32. The relationship between hydrogen disorder in ice and small positional disorder of the oxygen atoms is discussed in ref. 22, 33 and 34.
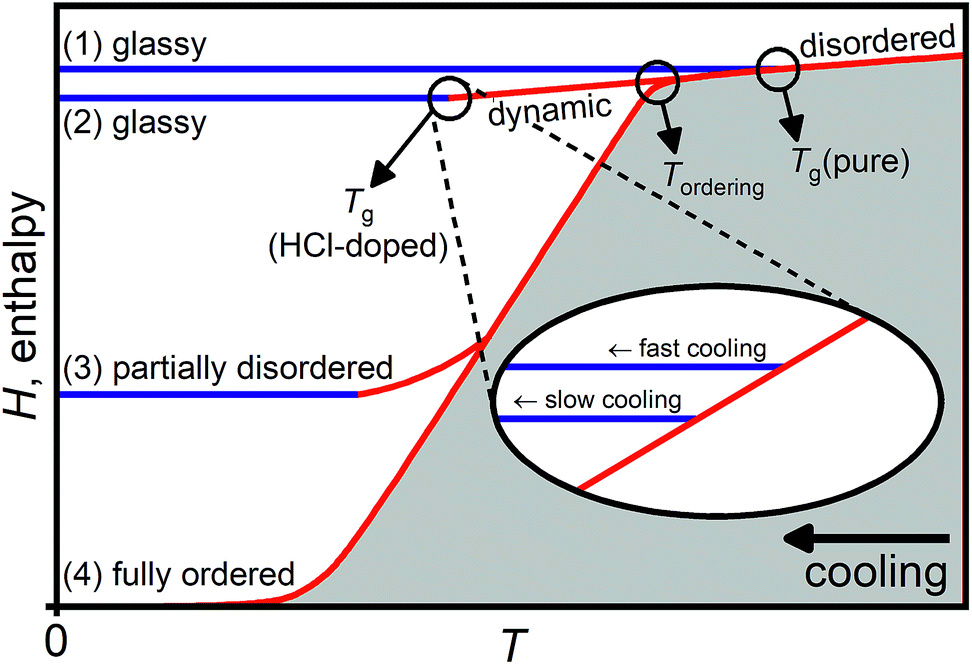 | ||
| Fig. 1 Schematic illustration of the various processes that can take place upon cooling pure and HCl-doped hydrogen-disordered ice VI leading to glassy, partially hydrogen-disordered or fully hydrogen-ordered states, respectively. The inset shows how the formation of glassy states at the glass transition temperature of HCl-doped ice VI is affected by the cooling rate. Adapted from ref. 31. | ||
The effect of HCl-doping on ice VI is that the reorientation dynamics are accelerated13,19,21,26 and Tg is shifted to a temperature well below the onset temperature of hydrogen ordering at Tordering. Therefore, upon cooling HCl-doped ice VI, hydrogen ordering and the phase transition to ice XV is observed.13,19–21,26 In principle, if the cooling was sufficiently slow, full hydrogen order could be reached (pathway 4). However, this is difficult to achieve experimentally in case of ice XV and even upon cooling very slowly,13,19,26 the sample drops out of equilibrium during the hydrogen-ordering process leading to a partially hydrogen-disordered ice XV (pathway 3).31
Pathway 2 illustrates the process upon cooling HCl-doped ice VI if hydrogen ordering can be suppressed. In this case, a glassy state is reached below Tg(HCl-doped) which is lower in enthalpy and hence a “deeper” glassy state compared to the state obtained upon cooling pure ice VI which has a higher glass transition temperature at Tg(pure). In general, deep glassy states are characterised by very slow relaxation dynamics.35–38
In analogy to the formation of glasses from liquids, pathway 2 can be taken if sufficiently fast cooling rates are employed. In case of traditional glasses, fast cooling avoids crystallisation whereas in the case of the hydrogen-disordered ice VI, only the “crystallisation” of the hydrogen atoms (i.e. hydrogen ordering) is avoided. A way to slow-down hydrogen ordering in ice at a given cooling rate is also to make use of the isotope effect by changing from H2O to D2O.15,19 As shown in the inset in Fig. 1, the cooling rate determines the final degree of relaxation of the glassy state with lower cooling rates leading to more relaxed and hence deeper glassy states as the sample departs from the dynamic equilibrium line at a lower temperature.39,40 While the various glassy states are nominally different in enthalpy, the structural differences between differently relaxed glasses can be very small.
In the case of ice VI/XV, it has been shown that pressure strongly affects the kinetics of hydrogen-ordering.13,19,26 Consistent with a small volume increase observed in neutron diffraction for the ice VI → ice XV phase transition upon cooling,26 the most ordered ice XV so far has been obtained upon slow-cooling at ambient pressure.19,26 Slow-cooling at ∼0.9 GPa gives a substantially more disordered ice XV (ref. 13) and essentially fully hydrogen-disordered ice VI is obtained upon quenching DCl-doped D2O ice VI at 1.0 GPa as well as upon slow-cooling at 1.4 GPa.26 These observations suggest that the application of pressure opens up the pathway to reaching Tg(HCl-doped).
Fig. 2(a) shows a range of DSC scans obtained upon heating HCl-doped H2O ice VI/XV after quenching (1a, 2a, 3a) or slow-cooling at the indicated pressures (1b, 2b, 3b). Consistent with our earlier study,19 the sample quenched at 1.0 GPa (1a) shows a transient ordering feature upon heating followed by an endothermic feature corresponding to the hydrogen-disordering phase transition to ice VI. This sequence of phase transitions has also been observed in a neutron diffraction study of the corresponding D2O sample where quenched DCl-doped ice VI first underwent transient hydrogen ordering upon heating, as indicated by the appearance of Bragg peaks characteristic for ice XV, followed by the hydrogen-disordering transition to ice VI.26 In case of a traditional glass, this sequence of phase transitions would correspond to glass → crystal → liquid, which is often observed.39
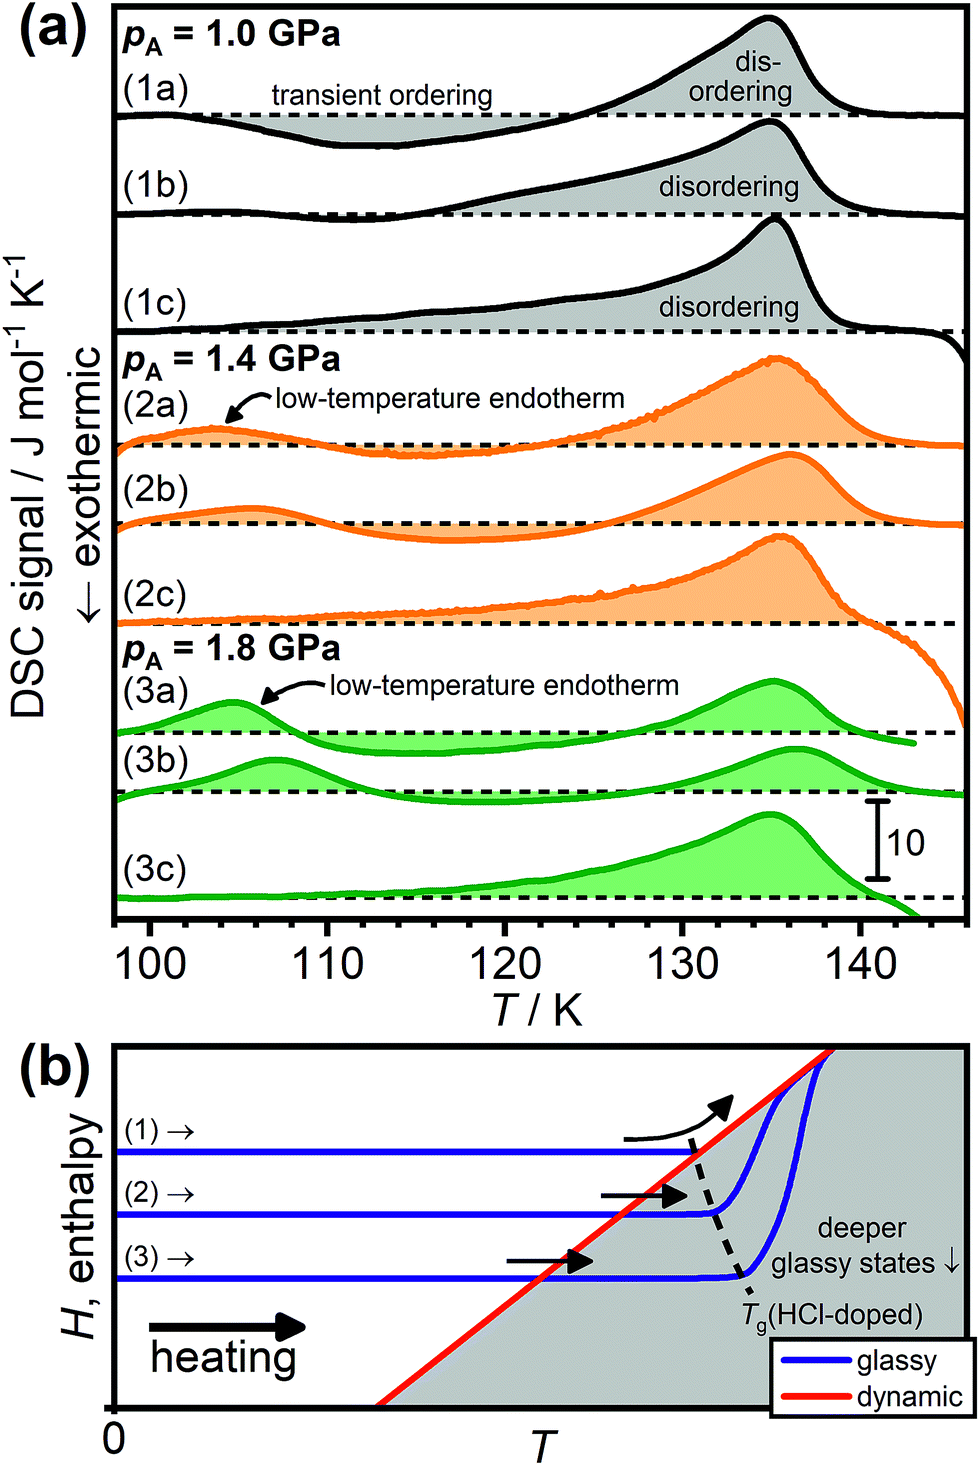 | ||
| Fig. 2 (a) DSC scans of HCl-doped H2O ice VI/XV samples recorded after quenching at ∼40 K min−1 at 1.0, 1.4 or 1.8 GPa (1a, 2a, 3a), after slow-cooling at 2.5 K min−1 at 1.0, 1.4 and 1.8 GPa (1b, 2b, 3b), and after cooling from 138 K at 5 K min−1 at ambient pressure (1c, 2c, 3c). All scans were recorded upon heating at 5 K min−1. The dashed black lines indicate the boundary between endothermic and exothermic processes for each of the scans. (b) Schematic illustration of how glassy states with different degrees of enthalpy relaxation behave upon heating as the dynamic equilibrium line is crossed. The dashed black line shows how the experimentally observed glass-transition temperature increases for deeper glassy states. Adapted from ref. 39. | ||
After slow-cooling at 1.0 GPa (1b), the transient ordering feature is less pronounced which means that the heating was started from a somewhat hydrogen-ordered sample. Scan (1c) was obtained after cooling from 138 K at ambient pressure at 5 K min−1 which is known to deliver a quite ordered ice XV.19,26 As previously shown,19,26 the hydrogen-disordering of highly ordered ice XV proceeds in a two-stage process with a slow endothermic process starting at around 102 K followed by a sharp endotherm with an onset temperature of ∼130 K. In ref. 30 it has been repeatedly stated that the ice XV → ice VI phase transition starts at 129 K. However, inspection of previously reported DSC scans,19,20 scans (1c), (2c) and (3c) in Fig. 2 as well as the changes of lattice constants in ref. 26 clearly show that this statement is incorrect.
A low-temperature endotherm is observed after cooling HCl-doped ice VI at 1.4 GPa (2a, b) and its intensity increases upon increasing the pressure to 1.8 GPa (3a, b). Gasser et al. recently reported such low-temperature endotherms for samples slow-cooled at 3 K min−1 under high pressure. However, as can be seen from scans (2a) and (3a), they are also observed for the samples quenched at ∼40 K min−1. This shows that the appearance of the low-temperature endotherms is caused primarily by pressure, whereas the cooling rate seems to have a minor influence. Slow-cooling at a given pressure only leads to a small shift of the low-temperature endotherm towards higher temperatures.
Heating to 138 K at ambient pressure and subsequent slow-cooling seems to “erase” the previous thermal history and the DSC features characteristic for the ice XV → ice VI phase transition19 are observed in scans (2c) and (3c). As concluded previously, HCl-doped ice VI is in dynamic equilibrium at temperatures above the disordering endotherm.26
Fig. 2(b) shows a schematic illustration of the processes that lead to the observed DSC scans in terms of how the enthalpies, H, of the samples change upon heating. The DSC signal is related to the heat capacity of the sample and can therefore be understood as the first derivative of the enthalpy with respect to temperature at constant pressure according to CP = (dH/dT)p.39 Scan (1a) in Fig. 2(a) can be rationalised in terms of pathway (1) in Fig. 2(b). Reaching the onset of the transient ordering coincides with the glass transition temperature where the reorientation dynamics are unfrozen so that the thermodynamically-driven ordering of the metastable disordered state can begin. A clear glass transition is not observed before the transient ordering feature. Glass transitions corresponding to the unfreezing of the reorientation dynamics in ice are typically signalled by ΔCP steps of about 1 J K−1 mol−1.31,32 It is possible that a weak ΔCP feature would be observable if the heating could be started at lower temperatures. Due to the use of liquid nitrogen as the cooling medium, this is not possible with our DSC. But also, perhaps the increase in heat capacity due to the glass transition is simply obscured by the exothermic transient ordering feature in case of scan (1a). As soon as the dynamic equilibrium line is reached, hydrogen ordering sets in due to the gained reorientation mobility. The sample then “falls down” in enthalpy upon further heating until the dynamic equilibrium line of the hydrogen-ordering pathway is reached when hydrogen-disordering sets in.
In case of scan (1b), which corresponds to a partially disordered ice XV, a very weak endothermic feature can be seen at low temperatures which is followed by a weak transient ordering feature.
The low-temperature endotherms seen after cooling at 1.4 and 1.8 GPa can now be explained in terms of the behaviour of deeper, more relaxed glassy states as indicated by pathways (2) and (3) in Fig. 2(b). It is well-known that deeper glassy states can produce endothermic “over-shoot” peaks upon heating.5,15 Due to their more relaxed nature and associated slow dynamics, the dynamic equilibrium line is crossed upon heating and the samples only “catch up” with the dynamic equilibrium line at higher temperatures which marks the end of the enthalpic recovery process.41 In general, for deeper glassy states, the overshoots are expected to be more pronounced.39,40
It is important to note that such kinetic overshoots do not produce latent heat.39 The heat taken up in the form of an overshoot feature only reflects the amount of heat that was initially missed as the dynamic equilibrium line was first crossed. On this basis, it is incorrect to calculate entropy changes from the integrated peak areas of the low-temperature endotherms as it has been done by Gasser et al.30 Entropy changes can only be calculated from latent heat that is either taken up or released in a reversible fashion.39
The gradual appearance of the low-temperature endotherms upon increasing the pressure from 1.0 to 1.8 GPa in Fig. 2(a) indicates that cooling at higher pressures leads to deeper glassy states. This implies that the kinetics of the glass transition around Tg(HCl-doped) and the hydrogen ordering around Tordering show opposite responses with respect to pressure. Pressure suppresses hydrogen ordering but it enables deeper glassy states to be reached.
The experimentally observed glass-transition temperatures are expected to increase upon going to deeper glassy states as illustrated by the black dashed line in Fig. 2(b).41 This may seem somewhat counter-intuitive at first since the dynamic equilibrium line is crossed at lower temperatures, but it reflects the slower dynamics present in the deeper glassy states.39–41 Consistent with this, the positions of the low-temperature endotherms shift slightly towards higher temperatures upon going from the quenched to the slow-cooled samples in Fig. 2(a). Slow-cooling at the highest pressure of 1.8 GPa therefore leads to the deepest glassy state.
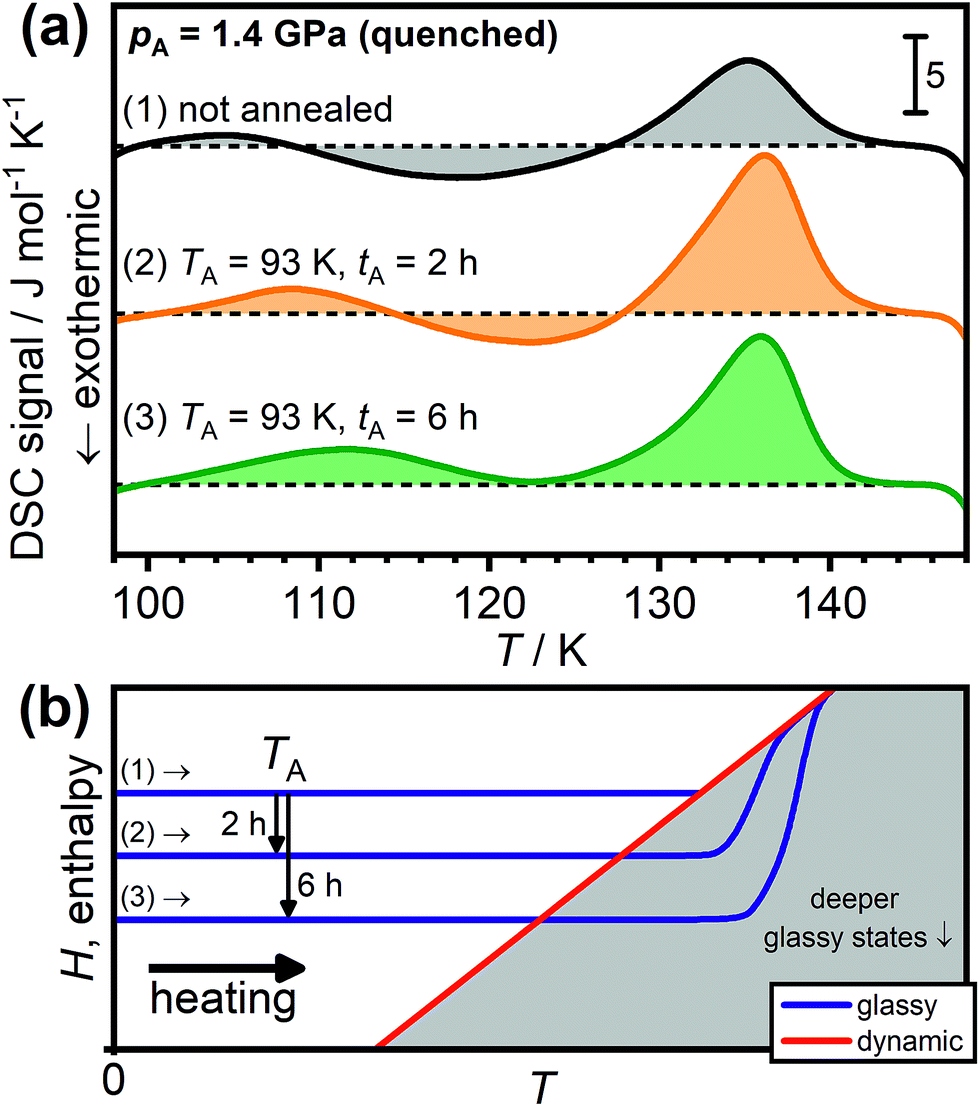
We now continue by showing that the low-temperature endotherms display several more hallmark features of glass transitions. First, we demonstrate that sub-Tg annealing at ambient pressure also leads to deeper glassy states and hence to the appearance of endothermic overshoot features as it has been observed for a wide range of other glasses.39,40,42 A particular impressive recent example was the pronounced endothermic overshoot feature observed for a natural amber sample that was “annealed” at ambient temperatures for 20 million years.42
Fig. 3(a) shows the DSC scans of HCl-doped ice VI/XV after quenching at 1.4 GPa. As already shown in Fig. 2, scan (1) of the unannealed sample shows a weak low-temperature endotherm upon heating. Annealing at 93 K for 2 hours leads to a more intense low-temperature endotherm in scan (2) which is shifted towards higher temperatures. After annealing for 6 hours at 93 K, the low-temperature endotherm is even more pronounced in scan (3) to the effect that the transient ordering seems to already overlap with the subsequent disordering feature. The shift in temperature of the low-temperature endotherm as a function of the annealing time clearly illustrates the kinetic origin of this feature since a thermodynamic 1st order phase transition must always appear at the same temperature, independent of the previous thermal history. In fact, the same argumentation applies for the observed temperature shifts of the low-temperature endotherms shown in Fig. 2(a).
 | ||
| Fig. 3 (a) Effect of sub-Tg annealing on the DSC scans of HCl-doped H2O ice VI/XV quenched at 1.4 GPa. Scan (1) shows the unannealed sample whereas scans (2) and (3) were recorded after annealing at 93 K for 2 and 6 hours, respectively. The dashed black lines indicate the boundary between endothermic and exothermic processes for each of the scans. All scans were recorded upon heating at 5 K min−1. (b) Schematic illustration of the effect of sub-Tg annealing on the subsequent heating. Adapted from ref. 39 and 41. | ||
Fig. 3(b) shows that the appearance of low-temperature endotherms upon sub-Tg annealing can be understood in terms of the enthalpy changes of the samples. As indicated by the arrows, the annealing at TA leads to enthalpy relaxation and consequently the formation of deeper glassy states which then display increasingly more pronounced kinetic overshoot effects depending on the annealing time.39,40 In this context, it is noted that endothermic overshoot features have also been observed for the glass transitions of pure ice V, ice XII and low-density amorphous ice after sub-Tg annealing.43 Transient ordering features were of course absent in those cases since the unfreezing of the reorientation dynamics took place well above the hydrogen-ordering temperatures (cf.Fig. 1).
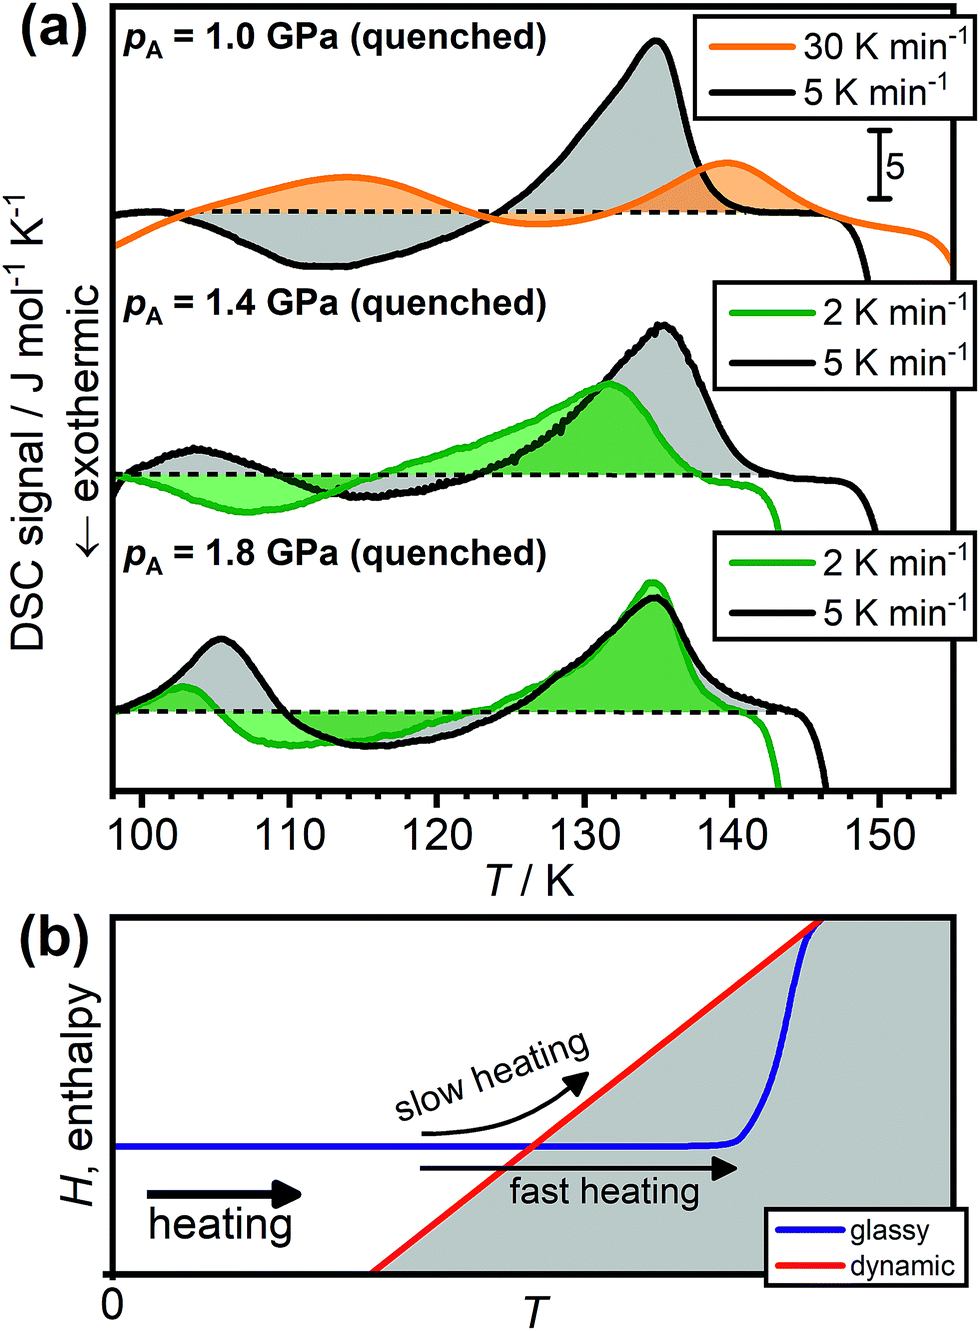
Due to the kinetic origin of the endothermic overshoot effects, their appearance and intensity is generally expected to depend on the heating rate.39–41Fig. 4(a) shows that this is also the case for the low-temperature endotherms of HCl-doped ice VI/XV. As previously shown in Fig. 2(a), the sample quenched at 1.0 GPa does not display a low-temperature endotherm upon heating at 5 K min−1. However, upon increasing the heating rate to 30 K min−1, a low-temperature endotherm appears in a quite spectacular fashion. This can be understood by considering the two pathways shown in Fig. 4(b). Upon slow heating, the sample has enough time available to immediately follow the dynamic equilibrium line as it is reached,41 which then leads to the transient ordering as explained earlier. Faster heating on the other hand allows the dynamic equilibrium line to be crossed, which consequently results in an endothermic overshoot feature in the DSC signal.41
 | ||
| Fig. 4 (a) Effect of heating rate on the appearance of the ice VI/XV low-temperature endotherm. The DSC scans were recorded upon heating HCl-doped H2O ice VI/XV quenched at 1.0, 1.4 or 1.8 GPa with a range of different heating rates as indicated. The dashed black lines indicate the boundary between endothermic and exothermic processes for each of the scans. (b) Schematic illustration of the effect of heating a glassy state at different heating rates. Adapted from ref. 39 and 41. | ||
The same trend can be observed for the sample quenched at 1.4 GPa as shown in Fig. 4(a). Heating at 5 K min−1 shows a low-temperature endotherm whereas lowering the heating rate to 2 K min−1 causes the low-temperature endotherm to disappear. The lower heating rate required to make the low-temperature endotherm disappear compared to the 1.0 GPa sample again illustrates that the 1.4 GPa sample is in a deeper glassy state. Consequently, in case of the 1.8 GPa sample, which is in an even deeper glassy state, reducing the heating rate from 5 to 2 K min−1 results only in a reduction of peak area of the low-temperature endotherm. This means that the overshoot effect is only reduced but not entirely prevented. We expect that the low-temperature endotherm of the 1.8 GPa sample would disappear completely for heating rates well below 2 K min−1. However, such measurements are difficult with our power-compensated DSC.
In any case, the disappearance of the low-temperature endotherms at low heating rates shows very clearly that the low-temperature endotherms are not caused by a first-order type phase transition from a new more stable phase of ice to ice XV as suggested by Gasser et al.30 Needless to say, it is impossible that the existence of a distinct crystalline phase is dependent on the heating rate at which it is heated.
Fig. 5 shows X-ray diffraction data of the HCl-doped ice VI/XV samples quenched at 1.0, 1.4 and 1.8 GPa, respectively. As shown in Fig. 2(a), heating these samples at 5 K min−1 gives no low-temperature endotherm for the 1.0 GPa sample, a weak low-temperature endotherm for the 1.4 GPa sample and a strong low-temperature endotherm for the 1.8 GPa sample. While X-ray diffraction is not sensitive towards the positions and occupancies of the hydrogen sites, it can nevertheless be used to detect the extent of hydrogen ordering in ice if the hydrogen-ordering transition goes along with a change of the space group symmetry which affects the positions of the oxygen atoms.20
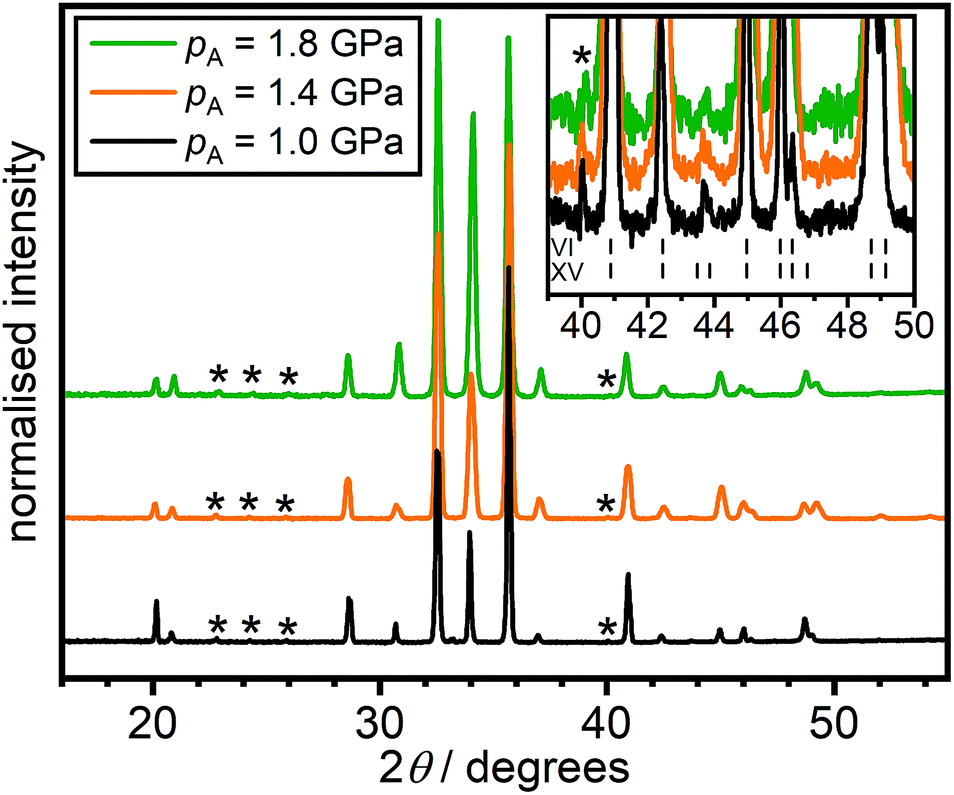 | ||
| Fig. 5 X-ray diffraction patterns of HCl-doped H2O ice VI/XV quenched at 1.0, 1.4 or 1.8 GPa recorded at 95 K and ambient pressure. The inset shows the region where weak Bragg peaks characteristic for ice XV appeared. The tickmarks indicate the expected peak position for ice VI and ice XV.2,13 | ||
Apart from small differences in peak intensities, which are due to preferred-orientation effects, the three X-ray diffraction patterns are very similar in terms of the observed Bragg peaks. This implies that the different extents of structural relaxation of the three samples, as manifested by the low-temperature endotherms upon heating at 5 K min−1, have little impact on their structures. The inset in Fig. 5 shows the region where Bragg peaks characteristic for ice XV appear as indicated by the tick marks.13,20,26 Very weak ice XV features are observed upon large magnification for all three samples at just below 44 degrees. For DCl-doped D2O ice VI/XV samples, this was previously not observed, and the samples after quenching at 1.0 GPa and slow-cooling at 1.4 GPa were essentially fully hydrogen-disordered ice VI.26 This difference could imply that quenching at ∼40 K min−1 under pressure is not fast enough to prevent a small amount of hydrogen ordering at Tordering before the glassy state is reached (cf.Fig. 1). In any case, this data shows that the 1.8 GPa sample is certainly not more and also not differently ordered in terms of its space group symmetry than the 1.0 GPa sample as has been suggested by Gasser et al.30
Changes in lattice constants have previously been shown to be highly sensitive indicators for the ice VI ↔ ice XV phase transition.26 Specifically, the a and b lattice constants have been shown to contract during the phase transition from ice VI to ice XV, whereas a significant expansion in the c parameter was observed.26 Unfortunately, Gasser et al. did not report a full set of lattice constants in their study.30 Instead, shifts of the (102) Bragg peak were reported upon ambient-pressure heating of HCl-doped H2O ice VI/XV after cooling at 1.8 GPa. On the basis of these, a sequence of phase transitions from a new phase of ice to ice XV and finally ice VI was proposed (cf. Fig. 10(c) in ref. 30).
Using the lattice constants determined by us upon heating a DCl-doped D2O ice VI sample pressure-quenched at 1.0 GPa,26 which did not display a low-temperature endotherm upon heating at 10 K min−1,19 the corresponding positions of the (102) Braggs peaks were calculated. These are compared with the values obtained by Gasser et al.30 in Fig. 6. The global shift of the peak positions is due to the volume isotope effect44 but also the zero-shift of the diffraction experiments in ref. 30 is unknown. Otherwise, the observed trends of both samples are very similar. Heating both the H2O as well as the D2O sample right after cooling under pressure show a change in d-spacings consistent with the transient ordering towards the expected values of ice XV. The peak position of the (102) Bragg peak is most strongly affected by the expansion in the c lattice constant upon hydrogen ordering. In case of the D2O sample, this process has been shown to go along with the appearance of Bragg peaks characteristic for ice XV. Further heating leads to decreases in the (102) peak position consistent with the phase transition to ice VI. Overall, the transient ordering feature appears to be somewhat more pronounced in case of the H2O sample, which is consistent with the fact that hydrogen ordering is generally faster for H2O than it is for D2O. Unfortunately, the heating rate of the H2O sample was not reported in ref. 30. The heating rate for the D2O data shown in Fig. 6 was 0.05 K min−1 and we have also shown that the transient ordering can be suppressed to some extent by increasing the heating rate to 0.4 K min−1.26
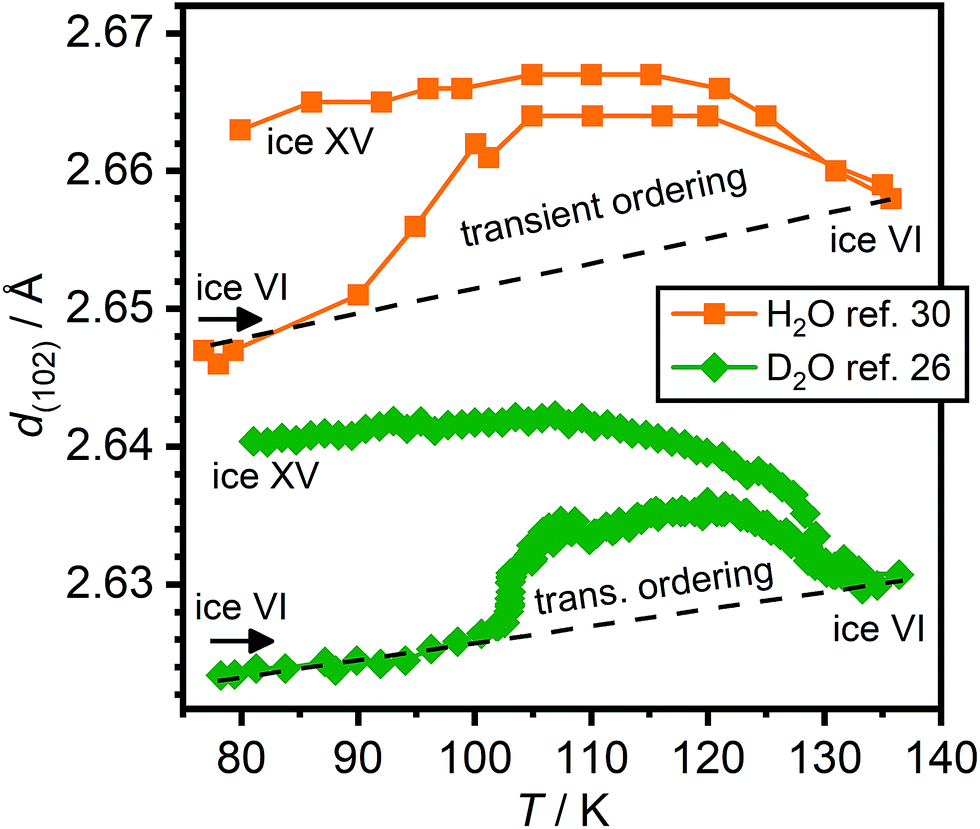 | ||
| Fig. 6 Changes of the position of the (102) Bragg peak upon heating HCl-doped H2O and DCl-doped D2O ice VI/XV samples. The data for the HCl-doped H2O sample was taken from Fig. 10(c) in ref. 30 whereas the position of the (102) peak of the DCl-doped D2O sample was calculated from the lattice constants shown in Fig. 4 of ref. 26. | ||
All in all, the X-ray diffraction data reported by Gasser et al.30 are fully consistent with our previous neutron diffraction data of a corresponding D2O material26 and do therefore not support the existence of a new hydrogen-ordered phase of ice at low temperatures.
Regarding DCl-doped D2O ice VI, Gasser et al. noted, without showing any data, that they did not observe low-temperature endotherms for any of their D2O samples and they attributed this to a strong isotope effect.30 In Fig. 7(a), we show DSC traces of DCl-doped D2O ice VI quenched at 1.8 GPa. Very clearly, a low-temperature endotherm can be seen upon heating at 10 K min−1 and, consistent with the trends for H2O shown in Fig. 4(a), the low-temperature endotherm becomes more intense upon heating at 30 K min−1. This means that DCl-doped D2O ice VI can also be found in a deep glassy state after cooling at 1.8 GPa. Remarkably, the DSC trace upon heating at 30 K min−1 is even dominated by the low-temperature endotherm and the hydrogen-disordering endotherm just below 140 K is almost absent. This means that following the overshoot effect, fast heating at 30 K min−1 can almost completely prevent the transient ordering and hence the subsequent hydrogen disordering.
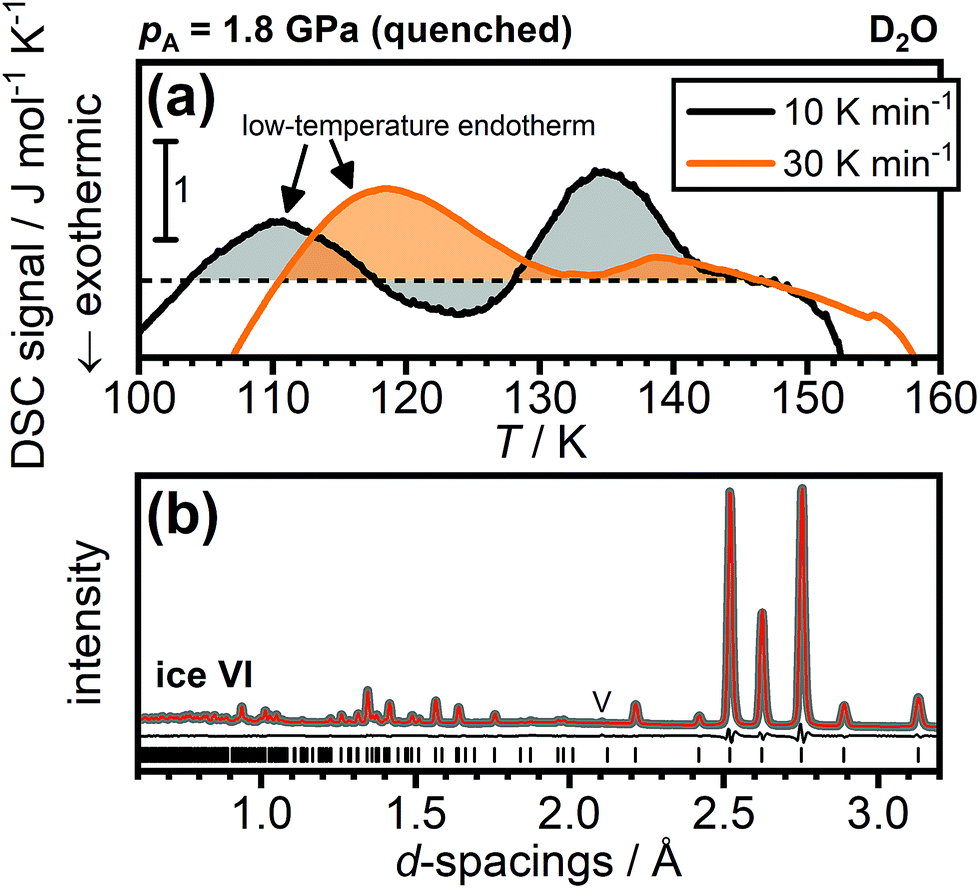 | ||
| Fig. 7 Calorimetry and neutron diffraction of DCl-doped D2O ice VI. (a) DSC scans recorded upon heating DCl-doped ice VI/XV quenched at 1.8 GPa at either 10 or 30 K min−1. (b) Powder neutron diffraction patterns at ambient pressure of DCl-doped ice VI at 80 K after quenching at 1.8 GPa. The experimental data is shown as a thick grey line, the Rietveld fit as a thin red line, and the differences between the experimental and fitted data as a thin black line. Tickmarks indicate the positions of the Bragg peaks of ice VI. A small peak due to vanadium at ∼2.1 Å is marked with a “V”. | ||
Since the deuterated sample cooled at 1.8 GPa displays a low-temperature endotherm, it is now interesting to turn to neutron diffraction. In addition to the appearance of new Bragg peaks if the space group symmetry changes upon hydrogen ordering, the large neutron scattering length of deuterium means that even subtle changes in the degree of hydrogen (dis)order manifest in the relative intensities of the Bragg peaks. The neutron diffraction pattern of a DCl-doped D2O sample cooled at 1.8 GPa is shown in Fig. 7(b). As can be seen, the fully hydrogen-disordered ice VI model allows an excellent Rietveld fit to the diffraction data. Ice XV displays a range of additional Bragg peaks at d-spacings below 2.2 Å.13,26 The presence of a phase more hydrogen-ordered than ice XV, as claimed by Gasser et al.,30 would therefore have to show up very clearly in neutron diffraction. This is clearly not the case and the neutron diffraction data of the DCl-doped D2O sample cooled at 1.8 GPa is fully consistent with a deep glassy state of ice VI.
Finally, we also believe that the Raman spectra reported in ref. 30 are consistent with the scenario of the deep glassy states outlined here. For example, the peak-intensity ratios of the librational modes reported in Fig. 9(c) in ref. 30 agree well with a transition from a deep glassy state towards the value characteristic for ice XV during the transient ordering followed by a shift back to the peak-intensity ratio of ice VI. In fact, the peak-intensity ratio used in ref. 30 and the positions of the (102) Bragg peaks shown in Fig. 6 seem to be very similar indicators for the phase transitions that take place upon heating a deep glassy state. The spectroscopic trends in the librational modes in ref. 30 appear to be fully consistent with those reported earlier by Whale et al.21
Conclusions
We have shown that the low-temperature endotherms of HCl-doped ice VI/XV are kinetic features related to glass transitions of deep glassy states. The low-temperature endotherms (i) display a characteristic dependence on pressure and cooling rate, (ii) they can be produced by sub-Tg annealing at ambient pressure, and (iii) they appear/disappear depending on the heating rate and the initial extent of relaxation. It is emphasised again that the existence of a distinct crystalline phase cannot depend on the heating rate at which it is heated. An endotherm recorded upon heating a stable phase cannot disappear as the heating rate is lowered. Furthermore, with the aid of X-ray diffraction, we have shown that the presence or absence of a low-temperature endotherm (as observed at 5 K min−1 heating rate) does not go along with major structural differences, which would be required for drastically different hydrogen-ordered states as suggested by Gasser et al.30 Also, the changes in the position of the (102) Bragg peak reported by Gasser et al. upon heating a H2O sample that displayed a low-temperature endotherm (upon heating at 10 K min−1) were fully consistent with our previously recorded diffraction data of a corresponding D2O sample that did not display a low-temperature endotherm when heated at 10 K min−1.19 Furthermore, we have shown that DCl-doped D2O ice VI cooled at 1.8 GPa also displays a low-temperature endotherm and that its neutron diffraction pattern is consistent with deep glassy ice VI. All of this taken together provides overwhelming evidence that the ice VI/XV low-temperature endotherms cannot be attributed to a new hydrogen-ordered phase of ice that is more hydrogen-ordered and more stable than ice XV as proposed by Gasser et al.30It is now interesting to note that HCl-doping cannot only be used to achieve hydrogen ordering in ice.13,14,31 If the hydrogen ordering can be successfully suppressed, then HCl-doping also allows accessing deep glassy states which display a range of complex kinetic phenomena around their glass transition temperatures. The glass transition of pure H2O ice VI was found at ∼134 K at ambient pressure.19,32 Judging on the basis of the onset temperatures of the low-temperature endotherm, this means that the HCl-doping is capable of lowering the glass transition of ice VI by at least 30 K. The difference in fictive temperatures, i.e. the temperatures where the dynamic equilibrium lines are crossed upon heating,39 would of course be even larger (cf.Fig. 2(b)).
The highly relaxed nature of deep glassy states as well as the cross-over to the transient ordering process upon heating seem to be in very good agreement with the changes in activation energies deduced from dielectric spectroscopy in ref. 30. For the deep glassy state, an unusually high activation energy was reported30 which is in fact expected for such a highly relaxed glassy state with ultraslow dynamics.35–38
We have also shown that glass-transition phenomena are not only observed for the fully hydrogen-disordered but also for partially ordered states. Apart from the fully hydrogen-ordered and therefore completely static state, all other states spanning the range from fully disordered to almost fully ordered are expected to display some sort of glass transition behaviour below the ordering temperature. However, in case of highly ordered samples, such glass transitions will be very difficult to detect on the experimental time scale.
An interesting question now arises with respect to the structures of the deep glassy states of the fully hydrogen-disordered ice. In case of ice VI, the symmetry of its space group forbids any long-range hydrogen ordering. However, as shown in Fig. 1, the deep glassy state must be somewhat lower in enthalpy and hence configurational entropy than its higher temperature glassy counterparts. It is intriguing to speculate that subtle and very local hydrogen-ordering processes take place as deep glassy states are formed. Consequently, due the presence of very small and to some extent randomly-oriented ordered domains, the average long-range structure of a deep glassy state could still be very close to the fully hydrogen-disordered ice VI. It is noted that local ordering processes in the hydrogen-disordered ices have been discussed by Johari.45 Small distortions of the lattice constants could be the most sensitive indicators for minor structural differences between deep glassy ice VI and high-temperature ice VI. Furthermore, it seems possible that accessing deep glassy states leads to broadening of the Bragg peaks. In fact, the XRD patterns shown in Fig. 4 show broadening of the Bragg peaks as deeper glassy states are accessed with increasing pressure and similar trends can be seen in Fig. 10(b) of ref. 30 as well. In any case, future research will have to explore the deep glassy states in more detail. This should not only focus on ice VI but also on the other hydrogen-disordered phases of ice including the ‘ordinary’ ice Ih.
Conflicts of interest
There are no conflicts to declare.Acknowledgements
We thank the Royal Society for a University Research Fellowship (CGS, UF150665), M. Vickers for help with the X-ray diffraction measurements, J. K. Cockcroft for access to the Cryojet, ISIS for granting access to the POLARIS instrument and R. Smith for help with the neutron diffraction measurements. This project has received funding from the European Research Council (ERC) under the European Union's Horizon 2020 research and innovation program (grant agreement no. 725271).Notes and references
- P. W. Bridgman, Proc. Am. Acad. Arts Sci., 1912, 47, 441–558 CrossRef.
- B. Kamb, Science, 1965, 150, 205–209 CrossRef CAS PubMed.
- W. F. Kuhs, J. L. Finney, C. Vettier and D. V. Bliss, J. Chem. Phys., 1984, 81, 3612–3623 CrossRef CAS.
- W. F. Kuhs, H. Ahsbahs, D. Londono and J. L. Finney, Phys. Rev. B: Condens. Matter Mater. Phys., 1989, 156–157, 684–687 CrossRef CAS.
- G. P. Johari and E. Whalley, J. Chem. Phys., 1976, 64, 4484–4489 CrossRef CAS.
- G. P. Johari and E. Whalley, J. Chem. Phys., 1979, 70, 2094–2097 CrossRef CAS.
- R. G. Ross, P. Andersson and G. Bäckström, J. Chem. Phys., 1978, 68, 3967–3972 CrossRef CAS.
- O. Mishima, N. Mori and S. Endo, J. Chem. Phys., 1979, 70, 2037–2038 CrossRef CAS.
- J. E. Bertie, H. J. Labbé and E. Whalley, J. Chem. Phys., 1968, 49, 2141–2144 CrossRef CAS.
- B. Minceva-Sukarova, G. E. Slark and W. F. Sherman, J. Mol. Struct., 1986, 143, 87–90 CrossRef CAS.
- B. Minceva-Sukarova, G. Slark and W. F. Sherman, J. Mol. Struct., 1988, 175, 289–293 CrossRef CAS.
- Y. Tajima, T. Matsuo and H. Suga, Nature, 1982, 299, 810–812 CrossRef CAS.
- C. G. Salzmann, P. G. Radaelli, E. Mayer and J. L. Finney, Phys. Rev. Lett., 2009, 103, 105701 CrossRef PubMed.
- C. G. Salzmann, P. G. Radaelli, A. Hallbrucker, E. Mayer and J. L. Finney, Science, 2006, 311, 1758–1761 CrossRef CAS PubMed.
- C. G. Salzmann, P. G. Radaelli, J. L. Finney and E. Mayer, Phys. Chem. Chem. Phys., 2008, 10, 6313–6324 RSC.
- C. G. Salzmann, P. G. Radaelli, A. Hallbrucker, E. Mayer and J. L. Finney, in Physics and Chemistry of Ice, ed. W. F. Kuhs, The Royal Society of Chemistry, Cambridge, 2007, pp. 521–528 Search PubMed.
- C. G. Salzmann, A. Hallbrucker, J. L. Finney and E. Mayer, Chem. Phys. Lett., 2006, 429, 469–473 CrossRef CAS.
- C. G. Salzmann, A. Hallbrucker, J. L. Finney and E. Mayer, Phys. Chem. Chem. Phys., 2006, 8, 3088–3093 RSC.
- J. J. Shephard and C. G. Salzmann, Chem. Phys. Lett., 2015, 637, 63–66 CrossRef CAS.
- A. Rosu-Finsen and C. G. Salzmann, J. Chem. Phys., 2018, 148, 244507 CrossRef PubMed.
- T. F. Whale, S. J. Clark, J. L. Finney and C. G. Salzmann, J. Raman Spectrosc., 2013, 44, 290–298 CrossRef CAS.
- J.-L. Kuo and W. F. Kuhs, J. Phys. Chem. B, 2006, 110, 3697–3703 CrossRef CAS PubMed.
- C. Knight and S. J. Singer, J. Phys. Chem. B, 2005, 109, 21040–21046 CrossRef CAS PubMed.
- K. D. Nanda and G. J. O. Beran, J. Phys. Chem. Lett., 2013, 4, 3165–3169 CrossRef CAS.
- M. Del Ben, J. VandeVondele and B. Slater, J. Phys. Chem. Lett., 2014, 5, 4122–4128 CrossRef CAS PubMed.
- C. G. Salzmann, B. Slater, P. G. Radaelli, J. L. Finney, J. J. Shephard, M. Rosillo-Lopez and J. Hindley, J. Chem. Phys., 2016, 145, 204501 CrossRef PubMed.
- J. D. Londono, W. F. Kuhs and J. L. Finney, J. Chem. Phys., 1993, 98, 4878–4888 CrossRef CAS.
- L. Pauling, J. Am. Chem. Soc., 1935, 57, 2680–2684 CrossRef CAS.
- K. Komatsu, F. Noritake, S. Machida, A. Sano-Furukawa, T. Hattori, R. Yamane and H. Kagi, Sci. Rep., 2016, 6, 28920 CrossRef CAS PubMed.
- T. M. Gasser, A. V. Thoeny, L. J. Plaga, K. W. Köster, M. Etter, R. Böhmer and T. Loerting, Chem. Sci., 2018, 9, 4224–4234 RSC.
- C. G. Salzmann, P. G. Radaelli, B. Slater and J. L. Finney, Phys. Chem. Chem. Phys., 2011, 13, 18468–18480 RSC.
- J. J. Shephard and C. G. Salzmann, J. Phys. Chem. Lett., 2016, 7, 2281–2285 CrossRef CAS PubMed.
- F. Fujara, S. Wefing and W. F. Kuhs, J. Chem. Phys., 1988, 88, 6801–6809 CrossRef CAS.
- R. J. Nelmes, J. S. Loveday and W. G. Marshall, Phys. Rev. Lett., 1998, 81, 2719–2722 CrossRef CAS.
- R. A. Venditti and J. K. Gillham, J. Appl. Polym. Sci., 1992, 45, 1501–1516 CrossRef CAS.
- K. Adrjanowicz, M. Paluch and K. L. Ngai, J. Phys.: Condens. Matter, 2010, 22, 125902 CrossRef CAS PubMed.
- B. Ruta, G. Baldi, Y. Chushkin, B. Rufflé, L. Cristofolini, A. Fontana, M. Zanatta and F. Nazzani, Nat. Commun., 2014, 5, 3939 CrossRef CAS PubMed.
- V. M. Boucher, D. Cangialosi, A. Alegría and J. Colmenero, J. Chem. Phys., 2017, 146, 203312 CrossRef PubMed.
- G. Höhne, W. Hemminger and H.-J. Flammersheim, Differential Scanning Calorimetry – An Introduction for Practitioners, Springer, Berlin, 1996 Search PubMed.
- C. T. Moynihan, P. B. Macedo, C. J. Montrose, C. J. Montrose, P. K. Gupta, M. A. DeBolt, J. F. Dill, B. E. Dom, P. W. Drake, A. J. Easteal, P. B. Elterman, R. P. Moeller, H. Sasabe and J. A. Wilder, Ann. N. Y. Acad. Sci., 1976, 279, 15–35 CrossRef CAS.
- R. Surana, A. Pyne, M. Rani and R. Suryanarayanan, Thermochim. Acta, 2005, 433, 173–182 CrossRef CAS.
- J. Zhao, S. L. Simon and G. B. McKenna, Nat. Commun., 2013, 4, 1783 CrossRef PubMed.
- C. G. Salzmann, I. Kohl, T. Loerting, E. Mayer and A. Hallbrucker, Phys. Chem. Chem. Phys., 2003, 5, 3507–3517 RSC.
- K. Umemoto, E. Sugimura, S. de Gironcoli, Y. Nakajima, K. Hirose, Y. Ohishi and R. M. Wentzcovitch, Phys. Rev. Lett., 2015, 115, 173005 CrossRef PubMed.
- G. P. Johari, Chem. Phys., 2000, 258, 277–290 CrossRef CAS.
| This journal is © The Royal Society of Chemistry 2019 |