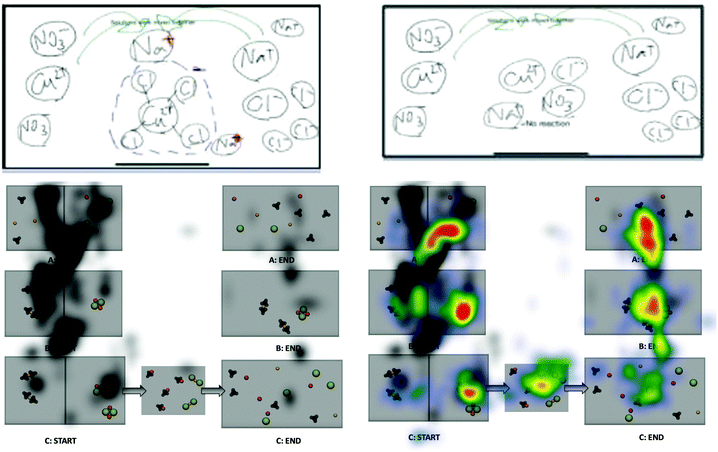
Critical consumption of chemistry visuals: eye tracking structured variation and visual feedback of redox and precipitation reactions†
S. J. R.
Hansen
 *a,
B.
Hu
a,
D.
Riedlova
a,
R. M.
Kelly
 b,
S.
Akaygun
 c and
A.
Villalta-Cerdas
d
aDepartment of Chemistry, Columbia University, New York, NY 10027, USA. E-mail: sjh2115@columbia.edu
bChemistry Department, San José State University, San José, CA 95192, USA
cDepartment of Mathematics and Science Education, Bogazici University, Istanbul 34342, Turkey
dDepartment of Chemistry, Sam Houston State University, Huntsville, TX 77340, USA
First published on 3rd July 2019
Abstract
This mixed method study investigation uses eye tracking and qualitative analysis to investigate the impact of animation variation and visual feedback on the critique of submicroscopic representations of experimental phenomena. Undergraduate general chemistry students first viewed an experimental video of a precipitation or oxidation reduction (redox) reaction. Next, they viewed the corresponding animations and were shown a visualization of where they had looked. Critique of the chemically relevant features in the animations and viewing pattern were monitored using participant generated drawings, verbal responses, graphic organizers, and eye tracking. Viewing and critique of chemically relevant features were found to increase after engaging with structured animations and visual feedback. Findings from this study support the use of structured variations and visual feedback in developing critical consumers of visual information, empowering students to describe and develop their understanding of chemical phenomena and become more purposeful visual consumers.
“All models are wrong but some are useful.” (Box and Draper, 1987)
“In academic discourse knowing why a wrong answer is wrong can be just as important as knowing why the right answer is right.” (Henderson, 2015)
Introduction
Students in chemistry courses encounter visual representations of chemical phenomena in a variety of forms. Some are static images, some are dynamic simulations or animations, but most are attempting to convey the phenomena as scientifically accurately as possible. The opportunity to critique examples designed to be scientifically inaccurate is rarely offered to students.However, there is increasing evidence that contrasting incorrect and correct examples can support learning outcomes. In an example from mathematics education, viewers saw incorrect features based on misconceptions which allowed them to contrast substantive differences in the examples shown (Große and Renkl, 2007). In a study of decimal magnitude, Durkin and Rittle-Johnson (2012) found incorrect examples helped students focus on the concepts and differentiate between key features, resulting in more discussion of the concept being studied.
Henderson et al. (2015) found that the majority of students can engage in counter-critique (select a wrong image and explain why it is wrong) arguing that critique needs to play a central role in science education. By making learning visible and providing students with justifications for the ideas, we also want them to know why incorrect ideas are wrong. Students presented with alternative ideas gain an opportunity to respond to counter arguments and rebut alternative ideas. Henderson argues that this shift towards a more student-centered learning environment can increase motivation, self-regulated learning, and more accurately portray the practice of science. Argumentation and critique provide integral epistemic activities needed for the construction of new knowledge (Billing, 1996). Throughout this study, participants were never told which animation was most accurate, nor were they told how they should look. A key aspect of this study is allowing participants space to decide (and hopefully question) what they believe and what they should view.
Instructional approaches that provide opportunities for scientific argumentation are needed, Faize et al. (2017) suggests asking students to provide reasonings for their claim to justify their understanding of the concept. Critical evaluation of scientific claims helps develop critical consumers of science and technology information (NRC, 2012), and extending argumentation and critique to visual representations offers an opportunity to develop critical consumers of visual information. Rickey and Stacy (2000) argue that more research is needed in how to employ metacognitive monitoring in lecture situations effectively. With animations playing a critical role in learning science and chemistry (Kelly and Jones, 2008) investigating the impact of incorrect chemistry animations holds the potential to greatly benefit students. Previous studies by our research team investigated how students link experimental evidence to submicroscopic phenomena and revise their drawings after watching animations with structured variations (animations-in-variation). Critique was found to be a powerful teaching tool, giving students an opportunity to recall prior knowledge, evaluate evidence, and develop a desire to know the correct answer (Kelly et al., 2017).
The animations used in this study are designed for students to engage with the key features of varied animations, to provide opportunities for them to link experimental observations with the molecular phenomena. Previous studies with these animations found students view more features than they mention (Kelly and Hansen, 2017), therefore eye tracking is a critical tool for tracking the animation features students attended to visually. Eye tracking has been used in a variety of chemistry education research studies and found to compliment other forms of data collection (VandenPlas et al., 2018).
This study was designed to encourage participant engagement with the animations through the lens of higher order learning, specifically describing, explaining, arguing, and critiquing (Ohlsson, 1995). Participants were asked to explain their understanding of the phenomena, provide an argument to support their rating of feature accuracy, and critique the varied features as well as their own viewing pattern. A mixed method approach is key when studying argumentation because the qualitative analysis provides insight into the quantitative mechanisms (Schwarz et al., 2003). For this study the quantitative mechanisms being investigated are critique of animation features and viewing feedback.
Theoretical framework
Variation theory is used in this study to document the way participants critique and view visual representations of submicroscopic phenomena. Specifically, this includes animations that differ in their accurate depiction of chemical phenomena and static images that differ in the overlaid eye-tracking pattern.In variation theory, critical features are those features students are aware of and notice while ignoring others. Contrast “allows the learner to create meaning for an object or feature by defining it against things that are different from it.” Separation of features allows for focus, varying one while maintaining other features as constant (Bussey et al., 2013). These critical features are objects that distinguish different ways of thinking (Runesson and Mok, 2004) and the animations-in-variation were designed with critical features based on common student misconceptions (Guo et al., 2012; Kelly and Hansen, 2017; Kelly et al., 2017) while stylistic features (color, size of atoms/ions, scale) were held constant. In this study, we call these varied features chemically relevant features, and they were identified in previous studies of student misconceptions and build off prior work from this group (Kelly, 2014, 2017; Kelly et al., 2017). Researcher Kelly developed these animations-in-variation as groups of animations that feature a more scientifically accurate animation paired with two animations that represent common misconceptions about the reaction phenomena. The features varied between each animation will be referred to as structured variations or chemically relevant features in this paper.
Research questions
The goal of this research is to investigate the relationship between critique and visual attention to chemically relevant features. Specifically, the four variables in this study are:• Independent variables:
∘ Visual attention (from eye tracking).
∘ Critique of animation (from written and verbal responses).
• Dependent variables:
∘ Structured variations (animations-in-variation).
∘ Visual feedback (eye-tracking feedback).
Method
This paper describes a two-phase exploratory study that followed a pilot study.Participants
Each group of participants (12 for the precipitation study and 14 for redox) was composed of unique individuals with data collection occurring during different semesters. Institutional Review Board approval was obtained, and their protocols followed during all steps in this study. Participants were recruited from general chemistry lecture courses at a large research university in the northeastern United States. The recruitment pool was consistent with the university's demographics, and the majority of the students enrolled in the general chemistry lecture at this university were first-year students or first-year post-baccalaureate students. Participants were selected with no preference for gender, ethnicity, or previous chemistry background before enrolling in the lecture course. All participants were over the age of 18 and received a gift card as compensation for their voluntary participation. Care was taken to minimize participant fatigue by building in a five-minute break between the animations in variation and visual feedback with the entire data collection session lasting 60–90 minutes (each participant was given as much time as they wanted to describe and draw their responses).Eye tracking
The eye-tracking system used for this study is able to reliably track pupil movement regardless of eye-color or the presence of contacts or glasses however participants with a history of epilepsy were excluded from the study (as eye-tracking equipment has the potential to trigger photosensitive epilepsy). Some students enroll in the one-semester laboratory course concurrently while others choose to take the lab after completing a year of the lecture. Although it is impossible to recruit an entirely representative study population, the volunteers for this study were all students attending a general chemistry lecture and an instructor teaching redox or precipitation may encounter students with a similar learning profile in any general chemistry course.The study took place in a clinical setting with ambient light and minimal distractions. All visual stimuli were displayed on a laptop connected to a SensoMotoric Instruments (SMI) REDn 60 Hz eye tracker, participant responses were recorded using the iPad application Vittle, which simultaneously records audio and written responses as well as any erasing and changes made. Data collection and analysis was conducted using the SMI iview X screen based mounting set-up on an integrated monitor. SMI software BeGaze 3.7 and Experiment Center 3.7 were used for the data collection and analysis. All data was collected using a binocular setting at the default settings with participants positioned between 60 and 80 cm from the monitor. A five-point calibration was employed and X/Y eye deviation accepted at 0.20° and below (or a note was added by the researcher indicating calibration deviation above this threshold). All data was collected with a pseudonym, and no link between individual participants and their pseudonym was maintained.
Eye tracking can provide insight into how decisions are made (Ryan et al., 2017; Khedher et al., 2017) and eye tracking is well-established in the study of how individuals engage with visual stimuli (Holmqvist et al., 2015). More recently eye tracking has become an established tool in chemistry education research (VandenPlas et al., 2018). The eye-tracking system allows the participant to sit comfortably and move their head freely. To help set the participant at ease interviews were conducted by an undergraduate student researcher who had been trained by and worked closely with researcher Hansen. Although participants knew they were eye-tracked, awareness of being eye-tracked has been found to only influence less socially acceptable objects—none of which were included in this study (Risko and Kingstone, 2011).
Impact of pilot study
Qualitative analysis of pilot study transcripts and drawings along with the quantitative analysis of the eye-tracking data led the authors to develop the current interview protocol. The graphic organizers used in this study (Appendix 1, ESI†) are based on emergent themes from the pilot study data.One big theme in the transcripts was a lack of understanding of conductivity, as participants struggle to understand what the conductivity meter is measuring and the role of free ions in solution. Throughout the pilot study and subsequent phases, participants were never told which animation was most accurate, nor when they told how they should look. A key aspect of this study is allowing participants space to decide (and hopefully question) what they believe and what they should view.
Data collection
Each data collection session consisted of three parts: experimental video, animations-in-variation, and visual feedback (Fig. 1). | ||
| Fig. 1 Overview of experiment with instruments associated: an experimental video, viewing structured animations, and visual feedback. | ||
Between each part participants were asked to document their understanding of the chemistry phenomena through drawings, completing graphic organizers, and/or responding to structured questions. After calibrating the eye tracker, participants viewed a macro-scale experimental video detailing a redox reaction between solid copper and aqueous silver nitrate. After viewing the experimental video, participants were asked to draw then describe what was happening at the sub-microscopic level during the experiment. An open-ended drawing prompt provided insight into the participant's understanding of the particulate level phenomena (Nyachwaya et al., 2011) and was provided on an iPad. The participant was asked to draw the reaction at the molecular level. After watching a macro-scale experimental video participants were given a drawing prompt and asked to construct a submicroscopic image of the phenomena. Three animations-in-variation were shown, two that varied chemically relevant features based on previously studied misconceptions with a third scientifically accurate animation. While viewing a static composite image of the animations participants completed an accurate/inaccurate grid rating each animation based on experimental evidence from the macro-scale video. A short break allowed an opportunity to edit the initial drawing then participants critiqued their eye-tracking pattern and viewed the static composite image a final time. To increase the opportunities for reflection the redox trials included a second accurate/inaccurate grid rating each animation.
Precipitation experimental video
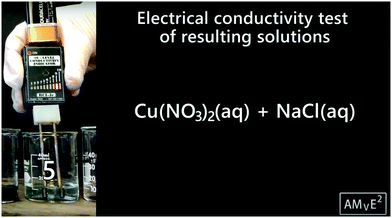
The video of precipitation reactions begins with distilled water being poured into four separate beakers, and then all beakers were tested with a conductivity tester that displays a scale showing conductivity. All four tests showed no evidence for conductivity. Next, the following solids were added to the beakers: silver nitrate, copper(II) nitrate, sodium sulfide, and sodium chloride. Each beaker was once again tested for electrical conductivity with the meter, and they displayed the highest value – level 10. After that the video focuses only on solutions 3 and 5. For solution 3, aqueous silver nitrate and aqueous sodium chloride were mixed in a test tube, and a white precipitate formed in the previously clear mix. For solution 5, aqueous copper(II) nitrate and aqueous sodium chloride were mixed in a test tube, and no reaction occured. These two solutions were then tested for conductivity: solution 3 resulted in a high 9, and solution 5 resulted in a high conductivity near the top of the visual scale (Fig. 2).Each reaction was depicted in a separate drawing prompt. The drawing prompt for solution 3 (Fig. 3) showed the formation of a precipitate while the drawing prompt for solution 5 showed no visible reaction after the solutions were mixed. Each experiment included conditions where a reaction occurred and at least one condition where no reaction occurred.
Redox experiment
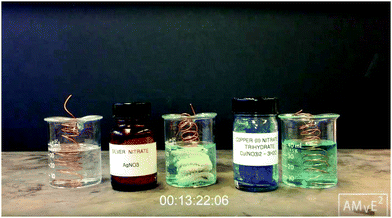
The redox experiment begins with three beakers of water (Fig. 4), the conductivity of each beaker is measured in the case of the precipitation reactions.Solid copper(II) nitrate is added to one beaker and solid silver nitrate is added to another, the third beaker is left with only water. The conductivity meter returns and the conductivity of the copper and silver solution are shown to register a higher conductivity reading than the water alone. After taking conductivity readings from the initial solutions, the video shows the addition of copper wire to each of the three beakers. After a sped up 13 minutes, the wire in the silver solution has visible deposition while the wires in the other two solutions remain unchanged (Fig. 4). The wire is removed from each solution, final conductivity readings are taken, and the wire with deposited metal is zoomed in showing a silver/black solid that can be brushed off. Only the copper wire reacting with silver nitrate was featured in the animations-in-variation. The redox drawing prompt included a start and end image of the reaction depicted in the experimental video.
Animations-in-variation
The accurate animations were developed according to experts’ ideas and representations. The inaccurate animations were created after extensive research into student misconceptions of the phenomena and pilot studies were conducted to refine their presentation. During this development, eye tracking was used to confirm that viewers were able to visually attend to the chemically relevant features of each animation (Kelly et al., 2017). Three animations-in-variation were created for each chemical interaction and participants viewed each animation with a short break between each viewing for writing notes. Each animation varied slightly in their length but lasted approximately 27 seconds. The color scheme of each animation was selected to increase access by participants with color vision deficiency.Precipitation animations
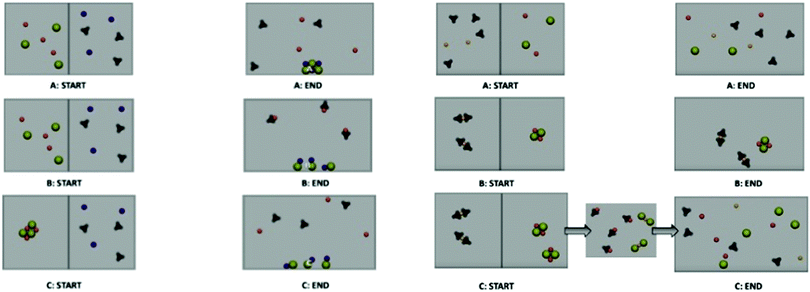
All precipitation animations depict two separate solutions (separated by a bar) that mix when the bar rises. The features varied in each animation relate to the experimental evidence of conductivity and the formation of a solid. For solution 3 (the precipitation reaction that results in the formation of a solid) animation A is the most scientifically accurate while animations B and C vary in their depiction of the aqueous and solid species. Fig. 5 shows the start and end frames of each animation for solution 3. Among the animations depicting solution 5 (the mixing that produced no reaction), animation A is again the most scientifically accurate animation, while animations B and C vary in their depiction of the aqueous species the pairing of ions. The animations-in-variation for solution 5 vary the presence of a reaction, the depiction of free ions, and the depiction of a reaction occurring or not. Animation A begins with free ions mixing but not resulting in the formation of a precipitate. Animation B incorrectly shows molecular species at the start that mix but do not react, resulting in the same molecular species at the end of the animation. Animation C inaccurately shows molecular species that switch the anion and cation, and then dissociate to accurately represent free ions in mixed aqueous solutions.During the experimental video for solution 5, the mixing of these two solutions did not result in the formation of a precipitate. Unmixed solutions at the start are shown by two separate spaces divided by a bar, during the animation the bar lifts allowing the solutions to mix. Animation A is the most scientifically accurate representation, showing free ions at the start and end of the mixing. Animation B inaccurately depicts the starting aqueous ions as paired up, copper(II) nitrate is shown with two nitrates paired with a copper 2+ ion. The aqueous sodium chloride is shown as a free-floating solid lattice, two sodium and two chloride ions all lumped together. After mixing this animation shows no change at all to the depiction of the species in solution. Animation C begins similar to animation B (all species are paired up), after mixing free-floating molecular solids are formed then dissociate to results in free floating ions at the end of the animation. Because this animation has a middle state, there is an additional frame for animation C.
Redox animations
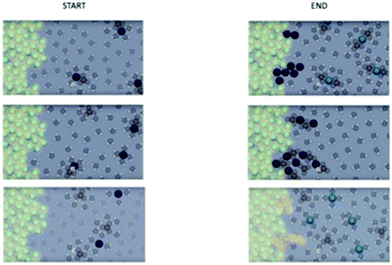
The redox animations varied in their depiction of the aqueous ions and the composition of the silver solid deposited on the wire (Fig. 6).These features link to the experimental evidence in the macro-scale video shown before the animations. Specifically the conductivity evidence can be explained by free ions in aqueous solution, the color change of the silver solution can be explained by the presence of free copper 2+ ions, and the depositing of metal onto the wire can be explained by silver solid. Animation C (the bottom images) is the most scientifically accurate while animations A and B are less scientifically accurate in their depiction of the ions in solution and the solid deposited. Animation A is less chemically accurate in that the aqueous species are depicted as molecular in nature. Animation B also shows aqueous molecular species and adds the inaccuracy of nitrate depositing as a solid along with silver atoms. After watching the animations participants were given an accurate/inaccurate grid (Fig. 7) and asked to select the most accurate animation. The precipitation reaction tool focuses participant's critique of the animation accuracy to four aspects: the species ratios, free ions, the representation of the solid, and whether or not a reaction occurred. The redox grid focuses on: deposition of silver solid, solution color change, and conductivity evidence.
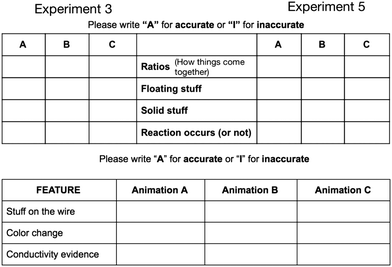 | ||
| Fig. 7 The accurate/inaccurate grid for the precipitation reactions on top with the grid for the redox reaction on the bottom. Each was phrased to minimize the reliance on chemistry vocabulary. | ||
Visual feedback
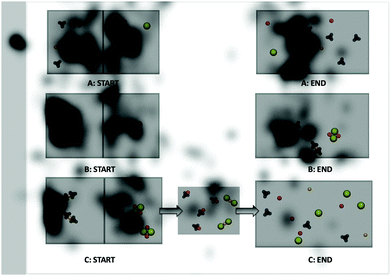
Visual feedback was created by exporting an inverse opacity image (recorded fixations are translated into shading, areas viewed more are darker leaving areas not viewed undarkened) for each participant's viewing of the static composite images then importing it into a new eye-tracking experimental file. Fig. 8 is an example of eye-tracking feedback stimuli. Participants were given a short explanation of the image and allowed to ask questions if they did not understand the visualization. The interviewer explained that the depth of shading indicates the amount of viewing recorded with light gray areas briefly reviewed and darker black areas viewed longer.Results and discussion
Impact of structured variations and eye-tracking feedback on visual attention
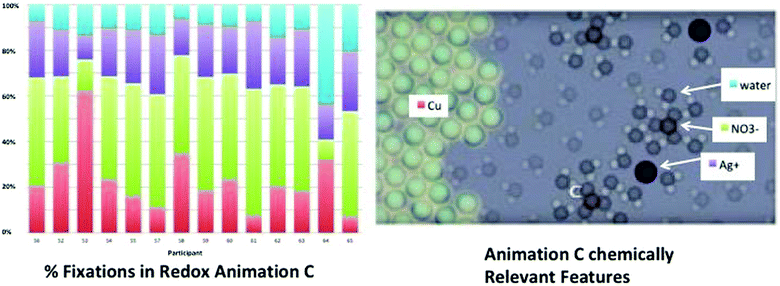
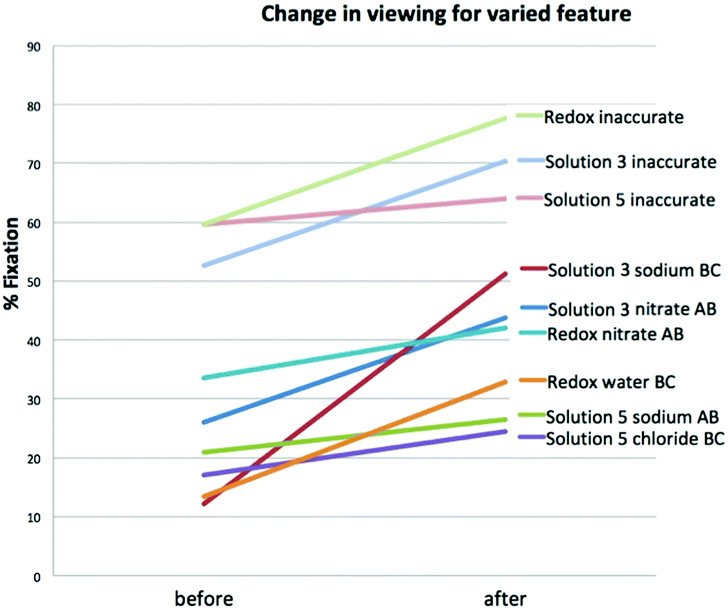
For this study, we were only interested in which features were attended to when viewing the sub-microscopic representations of atoms/molecules/ions (chemically relevant features). By calculating the percentage of fixations among each of the chemically relevant features we were able to account for variations in the length of each animation and ignore any viewing of the white space or glances away from the screen. Eye-tracking data for all three viewings of each animation were aggregated together. Areas of interest were defined for each reaction and the total number of fixations over all three animations were totaled then converted to a percentage (e.g. the total fixations for all nitrate ions in all three viewings of animation A were summed then divided by the total fixation time in all three viewings of animation A for nitrate, chloride, sodium, and silver). Fig. 9 shows an example of the areas of redox areas of interest and percentage fixations for each participant viewing a single animation. Due to decreased tracking reliability for select trials (eye-tracking data below the threshold of detection for a single participant viewing a specific stimuli) the number of samples in each analysis varies slightly. Rather than discard an entire participant the data recorded for each stimuli was analyzed. One area of interest in each animation was selected as a proxy for the variation between animations, the incorrect animations were selected for the static images. For solution 3 nitrate behavior changes between animations A and B. In animation A the nitrate is a free ion after mixing but nitrate inaccurately pairs with sodium in animation B. Sodium was selected to analyze the change in viewing between animations B and C because sodium formed a free floating molecule in animation B but returned to being accurately represented as a free floating ion in animation C. Overall a positive trend was observed in viewing varied features between animations-in-variation (Fig. 10 and Table 1). When the nitrate shifted behavior between animation A and B in solution 3 the average percentage viewing increased. This trend extends to the static composite images for the animations viewed after visual feedback. After eye-tracking feedback the average percentage viewing for the inaccurate animations increased, participants looked at the variations in the static images more after being shown where they initially looked. Because each species varies in the role, time on screen, and space occupied in the stimuli the data was analyzed using t-tests looking at changes in viewing before and after viewing feedback.| t | df | Sig. (2 tailed) | Mean difference | ||
|---|---|---|---|---|---|
| Solution 3 | Nitrate AB | 2.50 | 10 | 0.021 | 17.8 |
| Sodium BC | 7.42 | 11 | <0.00001 | 39.1 | |
| Solution 5 | Sodium AB | 1.12 | 9 | 0.28 | 5.6 |
| Chloride BC | 1.63 | 9 | 0.12 | 7.4 | |
| Redox | Nitrate AB | 1.61 | 13 | 0.12 | 8.5 |
| Water BC | 4.57 | 13 | 0.00011 | 19.5 | |
| Solution 3 | Inaccurate | 3.38 | 9 | 0.0033 | 17.7 |
| Solution 5 | Inaccurate | 0.67 | 9 | 0.51 | 4.43 |
| Redox | Inaccurate | 4.31 | 11 | 0.00028 | 18.01 |
Because no species are chemically equivalent we feel the most meaningful comparison is the change in viewing of that particular species rather than comparing between species. Each species plays a unique role in each redox/precipitation reaction. Additionally, the species in the redox animations are not on the screen for the same amount of time, nor do they occupy equal space on the screen. This is why multiple t-tests were selected as the method of analysis, there are only two groups being compared at any time (the before viewing and the after viewing). Statistically significant changes in average viewing were observed for the average gain in viewing nitrate (gain = 17.8) between animations A and B; t(10) = 2.50, p = 0.021. Viewing of the sodium ions between animations B and C in solution 3 increased (gain = 39.1) significantly also; t(11) = 7.42, p = <0.00011. This change in viewing occurs after the sodium inaccurately pairs with nitrate in animation B then accurately remains a free ion in animation C. The variation in sodium behavior resulted in a significant increase in viewing this species.
In the redox animations statically significant changes were observed between animations B and C with an increased viewing of water molecules (gain = 19.5); t(13) = 4.57, p = 0.00011. Animation C is the most scientifically accurate redox animation with water molecules interacting with the free ions in solution, a feature that was varied between animations B and C. When viewing the static images statistically significant changes were observed for the composite images of solution 3 precipitation reaction (gain = 17.7); t(9) = 3.38, p = 0.0033. A significant gain was also observed after visual feedback for the inaccurate animations in the redox reaction (gain = 18.01); t(11) = 4.31, p = 0.00028.
Showing participants animations-in-variation draws their attention to the varied features in the animation. Because these features were selected based on misconceptions, this instructional approach is causing participants to visually engage with a visual representation of the misconception. When participants increased their viewing of the static images of the inaccurate animations after feedback they were again visually engaged with representations of misconceptions when selecting the most accurate animation.
This visual engagement is a vital step in getting participants to critique inaccurate animation features and evaluate animation features with regards to experimental evidence.
“It shows I didn’t look much in the middle area of C, I thought I did but maybe I guess I would have looked there now.” Participant 36 reflection on eye-tracking feedback.
Throughout this study participants told us they stopped looking once they found an animation that matched their understanding of the phenomena. An increase in viewing the inaccurate animation frames suggests participants are looking more closely at animations they may have dismissed. They are becoming more critical of the features represented within each animation-in-variation and looking at the differences, not just stopping once the most accurate animation is selected.
“I missed some molecules on the far right” Participant 55 reflection on eye-tracking feedback.
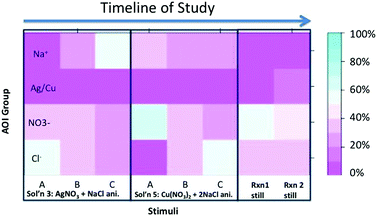
Sample individual viewing patterns over the experiment
Viewing for participant 32 (Fig. 11) shows shifts in viewing pattern over the animations and still images. Participant 32 shifts visual attention between the nitrate and sodium with minimal focus on the cations. After visual feedback this participant shifts the focus from the nitrate to the chloride.“I remembered chloride ions were usually larger…It's interesting to see where you’re cutting corners as far as your focus, focusing on one part of the larger picture and thinking you’re getting the entire picture.” Participant 32's reflection when viewing eye-tracking feedback.
Participant 34 viewed the chloride more in the initial animation then shifted viewing to the sodium and nitrate then finally back to the chloride for the final animation (Fig. 12). Similar to participant 32, 34 recorded minimal fixation time on the cations.
“I saw patterns – tended to concentrate on the top portion; I didn’t actually look at the entire thing which made me rethink how much I was actually looking at…” Participant 34's reflection when viewing eye-tracking feedback.
Impact of structured variations and eye-tracking feedback on critique of animation accuracy
Critique of animation accuracy was assessed by analyzing the animation selected as most accurate and the score on the accurate/inaccurate grid. Additional consideration was given to any edits made to the submicroscopic drawings.Animation selected as most accurate and accurate/inaccurate grid rating
As participants watched the animations-in-variation many told us that their first instinct was to accept what they saw as correct. It was after features varied that participants became critical of the way those features were presented. This was reflected in the verbal responses collected; participants said they trusted what they were shown even though they knew they were critiquing them, it was only after they were forced to select between variations that they questioned which was most accurate. When selecting the most accurate precipitation animation (rating each feature of the animation as accurate or inaccurate with respect to experimental evidence), 58% selected the correct animation for solution 3, while 83% selected the correct animation for solution 5. By the end of each experiment the correct animation was selected the most for each animation set. Greater detail was revealed when the accurate/inaccurate grid was scored (Table 2).| Chemical reaction | A | B | C | Average A/I grid score |
|---|---|---|---|---|
*![[thin space (1/6-em)]](https://www.rsc.org/images/entities/char_2009.gif) The most scientifically accurate animation is marked with an asterisk. The most scientifically accurate animation is marked with an asterisk. |
||||
| Precipitation solution 3 n = 12 | 8* | 3 | 1 | 8.8 ± 2.5 |
| Precipitation solution 5 n = 12 | 10* | 0 | 2 | 7.4 ± 2.0 |
| Redox after variations n = 14 | 6 | 3 | 5* | 5.0 ± 1.8 |
| Redox after visual feedback n = 14 | 5 | 2 | 7* | 5.6 ± 2.0 |
After viewing visual feedback of the animations-in-variation two participants shifted their selection to the correct animation. To better understand the reasoning for each selection, the accurate/inaccurate grids were scored for correct rating. This additional analysis increased the dimensions being considered to 12 for the precipitation animations and 9 for the redox animation, as each rating of accurate/inaccurate was scored individually. A slight gain was observed for the redox reaction scores after critiquing visual feedback. Participants in the redox experiment scenario used the accurate/inaccurate grid before and after viewing visual feedback (Table 2). As a result, the number of correctly marked answers increased from 5.0 ± 2.1 to 5.6 ± 1.8. Although this gain in the selection of the accurate animation and accurate/inaccurate score is not significant, the increase suggests participants are not disadvantaged by viewing visual feedback, and additional studies with visual feedback are warranted.
The greatest gain in correct accurate/inaccurate rating was seen with animation C of the redox animations (Fig. 13). The number of participants correctly identifying the scientifically accurate animation increased slightly from 5 to 7 (Table 2).
 | ||
| Fig. 13 Gain in accurate/inaccurate rating of animation features on the A/I grid for redox animations before and after visual feedback. | ||
Edited submicroscopic drawings
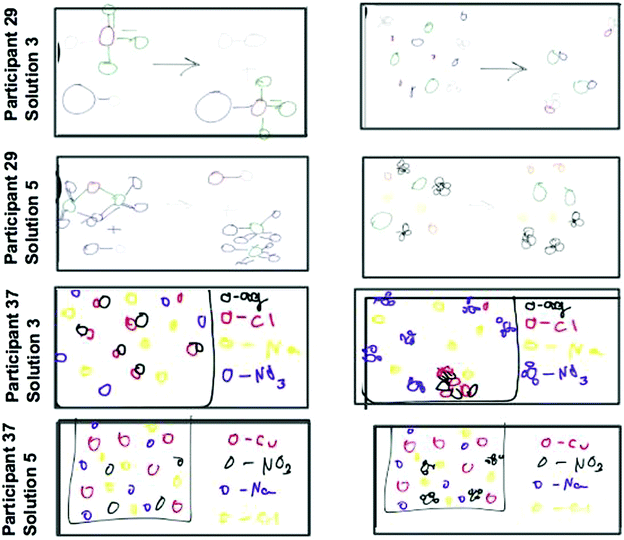
Three of the twelve precipitation participants changed their drawings as a result of seeing the animations-in-variation. All three shifted their drawings to resemble the correct animation (Fig. 14 and 15). The scientific accuracy of participant drawings were evaluated based on the features of the animations varied in this study (e.g. free ions, if a reaction takes place, representations of reactants and products). Three researchers evaluated each drawing and wrote a short description of the drawn features then the researchers discussed how each was classified until a consensus was reached. These three participants changed their drawings to be more scientifically accurate without being told which animation was the most accurate. Participant 28 changed only one of their drawings but modified it to show all free ions with no reaction occurring for solution 5 of the precipitation reaction. Bringing this drawing change together with the eye-tracking evidence (Fig. 14) we see that participant 28 focused primarily on the start frames of reactions A and B. The participant shifted their viewing to the solid floating product in the start frame of animation B, the middle frame of animation C, and the end frames of animations A and B. The new areas viewed differ in the portrayal of paired versus free ions. After considering this new viewed visual information the participant edited their drawing to the more scientifically accurate portrayal of free ions in solution after no visible reaction was observed at the macroscopic level.In the case of participant 29, the drawings (Fig. 15) show the before and after images for solution 3. This participant initially drew a reaction of molecular aqueous species with all species as molecular pairs at the end. After watching the animations-in-variation, both participants changed the initial aqueous species to being free ions but left the final spectator ions as bound in molecular pairs. In the bottom set of images for participant 29, this time the participant changed the molecular aqueous species to free ions at both the start and end of the mixing. The bottom four images of Fig. 15 are the start and end drawings by participant 36, after seeing the animations in variation they changed their drawings to show nitrate as polyatomic and they shifted the silver chloride precipitate to a solid lattice at the bottom of the solution.
Similar to the precipitation experiment, only two redox participants of the 14 chose to edit their drawings after watching the animations-in-variation (Fig. 16).
Although only a few participants in each group (five of the 26 total participants) chose to edit their drawings, participants who did not edit their drawings critiqued incorrect aspects of the drawings that were varied in the animations. This suggests that these participants may have changed their representation of the incorrect features after watching the animations-in-variation if the interview required a new drawing instead of offering an opportunity to edit the previous drawing. The correctly edited drawings suggest participants became more critical of their representations after viewing the animations-in-variation. Thus, shifting the protocol to require a new drawing may lead to additional corrections, other than those observed from voluntary editing.
Conclusions
Viewing structured variations in precipitation and redox animations supports critique and viewing of chemically relevant features. As chemically relevant features vary in accuracy, participants notice the shifts and reconsider the link between the macroscopic experimental evidence and the submicroscopic representations. Presenting animations with structured variations (based on misconceptions) makes participants confront contradicting ideas and forces them to examine which they consider most accurate. This shifts participants away from their initial instinct to accept what they are shown, creating a need to critique, reason, and explain the presented chemical phenomena. Thus, students shift from simply learning what we want them to know, to a critical view of what is presented to them. Presenting students with visual feedback of their viewing creates an opportunity to make behavior accountable and opens the door to more purposeful viewing of chemistry animations. Static images with overlaid eye-tracking patterns are easily interpreted by general chemistry students with minimal guidance. Viewing this feedback helps students shift their visual attention pattern, makes them critical of their viewing behavior, and modestly makes their critique of animation features more accurate.“I got to compare the different possibilities… I was able to think about and reflect on the outcome of the actual experiment.” Participant 28 reflecting on their study participation.
Critiquing the chemically relevant features of the animations resulted in more accurate drawings with regard to the chemically relevant aspects of the animations-in-variation. Animations are useful tools but they are inherently flawed in that they are representations. Being able to critique representations of chemical phenomena in light of experimental evidence moves our students towards more critical consumers of visual information. The following quote exemplifies the impact of the animations-in-variation on student's metacognition and self-reflection in light of the depiction of a submicroscopic chemical phenomena.
“I guess the most helpful part was from the animations, that I got to compare the different possibilities and that allowed me to… from the different possibilities I was able to compare them and think about how they would reflect like in the, how the… how they reflect in the outcome of the actual experiment.” Participant 28
Limitations
The primary limitation of this study is that each participant was only able to engage with one experimental condition. Due to time constraints we were unable to have the same participant engage with all treatment options. As a result, the most scientifically accurate animation appeared in a different viewing order for each part of this study. Similarly, the animations were lettered prior to data collection and the most scientifically accurate redox animation was viewed last while the most scientifically accurate precipitation reaction was viewed first. In future studies we hope to randomize this order and recruit participants for multiple sessions, allowing for the same participant to engage with all treatment options.During the viewing of the static images, participants often shifted their viewing back and forth between the computer screen displaying the image and the iPad showing the accurate/inaccurate grid. This look away behavior changed eye-tracking reliability for the viewing of static images; future studies should be designed to minimize this effect by dedicating separate time to the task of viewing versus completing the grid or shifting the grid to the eye-tracking computer screen. Shifting the accurate/inaccurate grid to the eye-tracking screen would have the added benefit of linking specific feature critique (rating of accurate/inaccurate) to specific viewing areas on the stimuli viewed.
Changes in viewing after visual feedback was analyzed using composite images without visual feedback, because the visual feedback obscured only the areas previously viewed the participants were able to see the areas not previously viewed. The visual presentation was chosen to encourage participants' viewing of new areas on the stimuli but limits the data analysis to the two viewings of the static images. This data analysis was chosen to allow all areas in the image equal viewing time during data collection but does omit analysis of areas viewed during visual feedback, the assumption is that participants view all areas unobscured during the visual feedback. Additional trials are needed to analyze the areas viewed during visual feedback or present the visual feedback without obscuring previously viewed areas.
To facilitate eye-tracking data collection participants were interviewed individually. Although clinical studies allow controlled investigations into participant behavior, the goal of this research is to develop instructional tools to be used in classroom settings. This disconnect between the clinical and naturalistic environments is a limitation to the study. Current iterations of this research are shifting to include multiple participants and opportunities to discuss their critique of the animations and feedback.
Implications
This research represents a shift in how students are used to learning and some participants may be uncomfortable confronting their own misconceptions but liking instruction does not equal learning from it (Adams et al., 2014). If we are to help our students develop their chemistry thinking and critical thinking skills it is imperative they become critical consumers of information. Learning to discern the useful aspects of a representation from the stylistic or inaccurate features holds the potential to empower chemistry learners. Taking time in an introductory chemistry course to ask students to critique animations and viewing patterns creates an opportunity for students to voice their understanding of the visuals without being told what to think or view. In recitation or small group discussion sessions students could critique the animations and debate the accuracy of the features based on experimental evidence. Researcher Kelly polls large lecture classes regarding the accuracy of the structured animations. Researcher Villalta-Cerdas uses the animations in homework assignments. Using these tools, space is created for students to voice their perspectives and learn by critiquing. Eye-tracking feedback could be used in one-on-one sessions to help students reflect on their visual engagement with animations used in a chemistry course. In a small group or lecture course contrasting viewing patterns could be used to spark a discussion about the features of a visual and the information that can be gleaned from features in that chemistry visual.The use of animations-in-variation and visual feedback holds the potential to increase participant critique and visual attention. Using these instructional strategies in individual, small group, and classroom settings holds promise for increasing student-centered learning and metacognitive monitoring in chemistry classrooms.
By critiquing animations and viewing patterns, students have the opportunity to articulate and consider their thinking, and at the same time engage in authentic scientific reasoning. Additionally, instructors can gain insight into how their students construct knowledge when making links between submicroscopic representations and experimental evidence of chemical phenomena. If all models are wrong chemistry students need opportunities to evaluate the aspects that are useful and become critical of visual information they consume.
Conflicts of interest
There are no conflicts of interest to declare.Acknowledgements
The authors wish to thank the reviewers for improving the quality of this manuscript and acknowledge that the National Science Foundation IUSE program Grant No. 1525557 supported this work. Any opinions, findings, and conclusions or recommendations expressed in this paper are those of the authors and do not necessarily reflect the views of the National Science Foundation.References
- Adams D. M., Mclaren B. M., Durkin K., Mayer R. E., Rittle-Johnson B., Isotani S. and Velsen M. V., (2014), Using erroneous examples to improve mathematics learning with a web-based tutoring system, Comput. Human Behav., 36, 401–411 DOI:10.1016/j.chb.2014.03.053.
- Billing M., (1996), Arguing and thinking: a rhetorical approach to social psychology, University Press.
- Box G. E. P. and Draper N. R., (1987), Empirical Model Building and Response Surfaces, New York, NY: John Wiley & Sons.
- Bussey T. J., Orgill M. and Crippen K. J., (2013), Variation theory: A theory of learning and a useful theoretical framework for chemical education research, Chem. Educ. Res. Pract., 14(1), 9–22 10.1039/c2rp20145c.
- Durkin K. and Rittle-Johnson B., (2012), The effectiveness of using incorrect examples to support learning about decimal magnitude, Learn. Instr., 22(3), 206–214 DOI:10.1016/j.learninstruc.2011.11.001.
- Faize F. A., Husain W. and Nisar F., (2017), A Critical Review of Scientific Argumentation in Science Education, Eurasia Journal of Mathematics, Sci. Technol. Educ., 14(1), 475–483, DOI:10.12973/ejmste/80353.
- Große C. S. and Renkl A., (2007), Finding and fixing errors in worked examples: Can this foster learning outcomes? Learn. Instr., 17(6), 612–634 DOI:10.1016/j.learninstruc.2007.09.008.
- Guo J.-P., Pang M. F., Yang L.-Y. and Ding Y., (2012), Learning from Comparing Multiple Examples: On the Dilemma of ‘Similar’ or ‘Different’, Educ. Psychol. Rev., 24(2), 251–269 DOI:10.1007/s10648-012-9192-0.
- Henderson J. B., Macpherson A., Osborne J. and Wild A., (2015), Beyond Construction: Five arguments for the role and value of critique in learning science, Int. J. Sci. Educ., 37(10), 1668–1697 DOI:10.1080/09500693.2015.1043598.
- Holmqvist K., Nystrom M., Andersson R., Dewhurst R., Jarodzka, H. and van de Weijer J., (2015), Eye Tracking: A comprehensive guide to methods and measures, Oxford University Press, p. 560.
- Kelly R. M., (2014), Using Variation Theory with Metacognitive Monitoring To Develop Insights into How Students Learn from Molecular Visualizations, J. Chem. Educ., 91(8), 1152–1161 DOI:10.1021/ed500182g.
- Kelly R. M., (2017), Learning from contrasting molecular animations with a metacognitive monitor activity, Educación Química, 28(3), 181–194 DOI:10.1016/j.eq.2017.02.003.
- Kelly R. and Hansen S. J. R., (2017), Exploring the Design and Use of Molecular Animations that Conflict for Understanding Chemical Reactions, Quim. Nova, 40(4), 476–481 DOI:10.21577/0100-4042.20170043.
- Kelly R. M. and Jones L. L., (2008), Investigating Students' Ability To Transfer Ideas Learned from Molecular Animations of the Dissolution Process, J. Chem. Educ., 85(2), 303 DOI:10.1021/ed085p303.
- Kelly R. M., Akaygun S., Hansen S. J. R. and Villalta-Cerdas A., (2017), The effect that comparing molecular animations of varying accuracy has on students’ submicroscopic explanations, Chem. Educ. Res. Pract., 18(4), 582–600 10.1039/c6rp00240d.
- Khedher A. B., Jraidi I. and Frasson C., (2017), Tracking Students’ Analytical Reasoning Using Visual Scan Paths, 2017 IEEE 17th International Conference on Advanced Learning Technologies (ICALT), http://10.1109/icalt.2017.151.
- National Research Council, (2012), A Framework for K-12 science education: practices, crosscutting concepts, and core ideas, National Academies Press.
- Nyachwaya J. M., Mohamed A.-R., Roehrig G. H., Wood N. B., Kern A. L. and Schneider J. L., (2011), The development of an open-ended drawing tool: an alternative diagnostic tool for assessing students' understanding of the particulate nature of matter, Chem. Educ. Res. Pract., 12(2), 121–132 10.1039/c1rp90017j.
- Ohlsson S., (1995), Learning to do and learning to understand: A lesson and a challenge for cognitive modeling, in Reiman P. and Spade H. (ed.), Learning in humans and machines: Towards an interdisciplinary learning science, Oxford, UK: Elsevier Science, pp. 37–62.
- Rickey D. and Stacy A. M., (2000), The Role of Metacognition in Learning Chemistry, J. Chem. Educ., 77(7), 915 DOI:10.1021/ed077p915.
- Risko E. F. and Kingstone A., (2011), Eyes wide shut: implied social presence, eye tracking and attention, Atten. Percept. Psychophys., 73(2), 291–296, DOI:10.3758/s13414-010-0042-1.
- Runesson U., and Mok I. A. C., (2004), Discernment and the Question, “What Can Be Learned?”, in Marton F. and Tsui A. B. M. (ed.), Classroom Discourse and the Space of Learning, Mahwah, New Jersey: Lawrence Erlbaum Associates, Inc., Publishers, pp. 63–87.
- Ryan M., Krucien N. and Hermens F., (2017), The eyes have it: Using eye tracking to inform information processing strategies in multi-attributes choices, Health Econ., 27(4), 709–721 DOI:10.1002/hec.3626.
- Schwarz B. B., Neuman Y., Gil J. and Ilya M., (2003), Construction of Collective and Individual Knowledge in Argumentative Activity, J. Learn. Sci., 12(2), 219–256 DOI:10.1207/s15327809jls1202_3.
- VandenPlas J. R., Hansen S. J. R. and Cullipher S., (2018), Eye tracking for the chemistry education researcher, American Chemical Society.
Footnote |
| † Electronic supplementary information (ESI) available. See DOI: 10.1039/c9rp00015a |
| This journal is © The Royal Society of Chemistry 2019 |

