
Supporting students’ conceptual understanding of kinetics using screencasts and simulations outside of the classroom
Ryan D.
Sweeder
 *a,
Deborah G.
Herrington
b and
Jessica R.
VandenPlas
b
*a,
Deborah G.
Herrington
b and
Jessica R.
VandenPlas
b
aLyman Briggs College, Michigan State University, 919 E. Shaw Ln, East Lansing, MI 48825, USA. E-mail: sweeder@msu.edu
bDepartment of Chemistry, Grand Valley State University, 312 Padnos Hall, Allendale, MI 49401, USA
First published on 8th May 2019
Abstract
Simulations have changed chemistry education by allowing students to visualize the motion and interaction of particles underlying important chemical processes. With kinetics, such visualizations can illustrate how particles interact to yield successful reactions and how changes in concentration and temperature impact the number and success of individual collisions. This study examined how a simulation exploring particle collisions, or screencast employing the same simulation, used as an out-of-class introduction helped develop students’ conceptual understanding of kinetics. Students either manipulated the simulation themselves using guided instructions or watched a screencast in which an expert used the same simulation to complete an assignment. An iterative design approach and analysis of pretest and follow up questions suggests that students in both groups at two different institutions were able to achieve a common base level of success. Instructors can then build upon this common experience when instructing students on collision theory and kinetics. Eye-tracking studies indicate that the simulation and screencast groups engage with the curricular materials in different ways, which combined with student self-report data suggests that the screencast and simulation provide different levels of cognitive demand. This increased time on task suggests that the screencast may hold student interest longer than the simulation alone.
Introduction
Simulation and animations use in introductory chemistry classrooms is becoming more commonplace. These electronic resources can make visible the otherwise unobservable particulate level interactions that are the underpinning of chemical phenomena. Therefore, these representations can help students explain important chemistry concepts (Akaygun and Jones, 2013). These results may reflect that the simulations provide a valid visualization of particulate level interactions; a level of chemistry that is a common challenge for students (Gabel et al., 1987; Nurrenbern and Pickering, 1987; Sanger, 2005; Chittleborough and Treagust, 2007; Williamson, 2014). Thus, it is not surprising given that in-class use of both animations and simulations have been shown to improve students’ mental models (Williamson and Abraham, 1995; Sanger and Badger, 2001; Yezierski and Birk, 2006; Akaygun and Jones, 2013). Simulations can offer an advantage over animations in these contexts as the students can be actively involved in adjusting parameters and seeing how the system responds. However, animations offer a more controlled presentation that can, if well designed and used effectively in the classroom (Kelly and Jones, 2007; Tasker and Dalton, 2008), direct student attention to the important details of the molecular representation. As part of an ongoing research project, we have been exploring the relative effectiveness of students completing a guided assignment while using a simulation compared to viewing a screencast (an animation consisting of a recording of an expert narrated use of the simulation) as an outside of the classroom introduction to core chemistry concepts. In our previous work looking at the topic of solubility, we saw student learning gains from both the simulation use and the screencast, with the screencast showing slightly stronger learning gains (Herrington et al., 2017). This study aims to understand how these two approaches to using the simulation can influence students’ learning of key concepts associated with kinetics.Student learning of kinetics
Kinetics is one of the Anchoring Concepts in general chemistry. Fully understanding and manipulating chemical reactions requires a solid grasp of reaction rates, what factors affect them, and underlying theories (e.g., collision theory) (Cachapuz and Maskill, 1987; Justi, 2002; Cakmakci and Aydogdu, 2011; Talanquer, 2016). For these reasons, many studies have demonstrated that reaction kinetics is a challenging and important introductory chemistry concept for students (de Vos and Verdonk, 1996; Cachapuz and Maskill, 1987; Justi, 2002; Van Driel, 2002; Cakmakci, 2010). In their recent review, Bain and Towns (2016), conclude that most of the common misconceptions surrounding the learning of kinetics have been identified. Therefore, even though there have been several studies on pedagogical techniques to help students learn reaction kinetics (Justi and Gilbert, 1999; Justi, 2002), identifying better methods to teach this challenging concept is one of the leading problems. Given the ability of online simulations to present the molecular motion that is key in building deep understanding of kinetics, these hold great possibility for helping students learn kinetics without the confusion that static textbook depictions can introduce (Cakmakci, 2009).Theoretical framework
Learning sciences, educational psychology, and cognitive psychology research clearly demonstrates that students learn more when actively engaged in learning activities (Chi and Wylie, 2014). This is consistent with the constructivist theory of learning in which learners construct understanding of concepts through their own experiences with the phenomena (Tobin, 2009). Active construction of knowledge is notably more difficult than passively receiving information; yet, it is this added difficulty that leads to deeper learning, helping the learner consolidate ideas and connect to other knowledge already stored in long-term memory (Brown et al., 2014). Notably, research shows that the common study strategy of rereading a text has little benefit for later retention of information (Callender and McDaniel, 2009), but struggling with a problem prior to being shown how to solve it results in better retention (Brown et al., 2014). Science students who receive instruction in problem solving followed by practice time exhibit poor knowledge transfer compared to students who attempt to solve problems before receiving instruction (Schwartz et al., 2011). This supports the use of simulation/screencast based activities to engage students with an introductory exploration of core chemistry concepts outside of the classroom prior to more formal instruction. This also suggests that students interacting with simulations as opposed to watching the simulation be manipulated by someone else may produce better learning outcomes.Alternatively, cognitive load theory indicates that instruction should be designed to focus the learner's attention on the most relevant features, as a person's working memory can only accommodate a limited number of novel interacting elements (Paas et al., 2003). Though this limitation can be addressed using schemas from long-term memory that chunk multiple pieces of information into a single element for a specific purpose, novice learners tend to have fewer schemas to draw upon. Furthermore, a person's working memory capacity can be further reduced by extraneous cognitive load introduced by instructional materials that contain extra elements that students must attend to, but that do not directly contribute to construction of the desired concept, or that require students to split their attention between multiple representations. This type of cognitive load has been shown to greatly reduce learners’ performance (Chandler and Sweller, 1991). This is in contrast to germane effective cognitive load, the load related to processing, development, and automation of schemas (Paas et al., 2003), which enhances learning. Instructional material design can enhance germane cognitive load by directing the learners to the cognitive process, for example, looking for patterns in the data, which are directly related to the construction of the desired schemas. In the case of complex chemistry simulations that contain multiple simultaneous representations, this supports the use of assignments that guide students in focusing on the patterns and interactions that will help them build conceptual understanding. Further, this suggests that watching an expert manipulate the simulation and point out important features in a screencast may result in better learning than students’ manipulation of the simulations on their own.
Research questions
Given that little is currently known about how screencasts or simulations can best be used to impact student learning of core chemistry concepts outside of the classroom environment, the goal of this study was to examine the following research questions:(1) What are the impacts of outside-of-class usage of simulations or screencasts on students’ conceptual understanding collision theory and rates of reactions?
(2) How and where do students allocate attention while interacting with a simulation, as compared to a screencast, when coupled with a guided assignment?
Methods
Understanding how students use simulations in outside-of-class setting poses specific challenges. Principally, the instructional materials developed to support any learning activity are critical given that they must provide the guidance and support that an instructor's probing questions afford in a classroom or laboratory situation. Identifying best practices for the development and use of these materials requires careful evaluation using both quantitative assessment of the resultant student learning as well as critical qualitative analysis of student responses to ensure that the prompts are effective in directing student attention while simultaneously avoiding potential misinterpretation. This demands an iterative approach to the development and refining of instructional and assessment materials. Further, for computer-based visualizations such as simulations, eye tracking can provide a complementary opportunity to deeply understand how student attention is allocated while engaging with the visual representation. Together these methods can provide deep insight into the student experience of learning while using a simulation.Simulation
Kinetics instruction focuses on reaction rates and the variables that affect those rates. Accordingly, in the teaching and learning of kinetics students are frequently called upon to draw and interpret graphs involving concentration and time. However, a firm grasp of kinetics concepts requires students to be able to connect the graphs to what is happening at the particulate level. Thus, a simulation designed to help students develop this conceptual understanding of kinetics should include these multiple levels of representations and a means to support the connection between them. PhET Interactive Simulations are designed to provide multiple representations, including at the particulate level, connect to the real world, and allow student interaction and inquiry (Moore et al., 2014). Therefore, the PhET Interactive Simulations Reaction & Rates simulation (Reactions & Rates) was selected to use for our investigation because it contains:(1) A Single Collision tab, in which the user can shoot an atom into a molecule to initiate a reaction. The user can vary the speed and angle with which the particles collide and select reaction systems with different reaction coordinate diagrams (varying activation energy and ΔHrxn). The user can also adjust the temperature up and down to see the change in particle motion and how that impacts the success of the collision.
(2) A Many Collisions tab, in which the user can mix differ quantities of particles from within each of the reactions systems in the first tab. In addition to the adjustable temperature and ability to start with a specific number of each species of particle, the tab provides assorted graphical representations of the current number of particles, including a strip chart.
(3) A Rate Experiments tab, which allows the user to precisely create a system with a specified number of starting particles. This tab was not employed in our investigation.
Assignment design
Using the Backward Design (Wiggins and McTighe, 2005) approach outlined in Fig. 1, the following key learning objectives related to understanding collision theory were identified: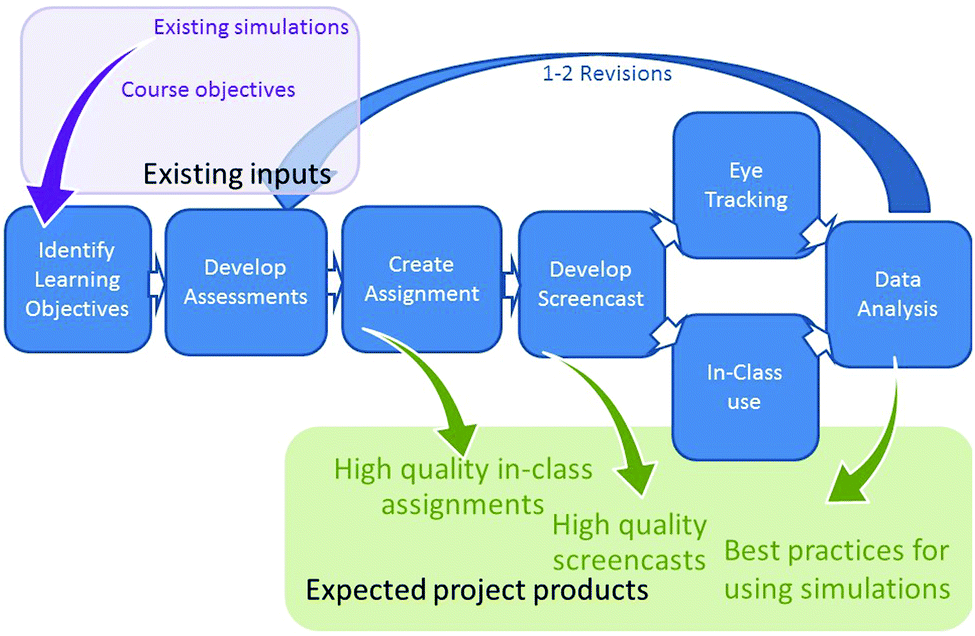 | ||
| Fig. 1 Backward Design used for assignment and screencast creation. | ||
(1) Describe collision theory and use it to explain changes in rates of reactions
(2) Explain how changing the temperature impacts the rate of a reaction
(3) Explain how changing concentration affects the rate of a reaction
Four short, matched (based on learning objective) pretest and follow up questions to assess student knowledge of these learning objectives were developed to identify literature reported misconceptions or common student errors seen by the instructors. Guiding prompts were developed to scaffold students’ interactions with the simulation, focusing their attention on the most salient aspects of the simulation and ensuring that they had the opportunity to develop understanding of the key elements outlined in the learning objectives. Questions were embedded throughout the assignment to require students to reflect on the specific relationships and observations required to understand how temperature and concentration impact reaction rates. The initial assignment was reviewed by undergraduate research students and one external chemistry instructor and revised based on their feedback.
Finally, the revised assignment provided a script for the recording a six-minute screencast using the same simulation (ChemSims Project, 2016). Students using the screencast answered the same or similar questions to the students in the simulation treatment to promote active engagement with the content mirroring that of students who engaged with the simulation themselves. As a result, we attempted to exclusively narrate the video to highlight key observations, but do not provide additional explanation of the core chemistry ideas, leaving this task to the student to match the simulation use. An example of one section of the assignment comparing these treatments is shown in Table 1.
| Simulation assignment | Screencast assignment | Screencast narration |
|---|---|---|
| Part B: Many Collisions | Part B: Many Collisions | Now let's consider the many collisions tab. Here let's again start by choosing the correct reaction, which is A reacting with BC. Let's also make sure we have our energy diagram up top here, and then let's start adding some A to the system. And we can add some molecules of BC to the system. And then if we open up the strip chart, we actually can see how much material of each is present, and then we can see them change over time as these things are allowed to mix together. And so, do we see any reactions that are occurring? So, looking at the system I seem to have relatively flat lines here in the strip chart suggesting that no reaction has actually occurred. Well, let's add in some more A and see if perhaps we can get a reaction to occur this way. So, we see that going up off the scale, so let's adjust that so it fits. Well, and now it looks like we have a slight decrease in A and BC and an increase in the amount of C and AB that is present, and so now it appears that there has been some reaction that's actually occurred. |
| 1. Click on the Many Collisions tab at the top | 1. Reaction between A and BC | |
| 2. In the Initial Conditions box, select the second reaction (with A being green and BC containing a red and blue atom). | a. What happens when the particles collide? | |
| 3. Under options on the far right, choose a chart type (bar, pie, or strip) | b. Is there any reaction? (Y/N) What causes or prevents a reaction from taking place? | |
| 4. Pump some A and some BC into the reaction chamber (try about 3 pumps each) and watch the reaction for a minute or so. | 2. Adding more A | |
| a. What happens when the particles collide? | a. Is there any reaction now? Y/N | |
| b. Is there any reaction? (Y/N) What causes or prevents a reaction from taking place? | b. What causes or prevents a reaction from taking place? | |
| 5. Try adding more A (another 3 pumps) and watch for a minute or so. | ||
| a. Is there any reaction now? Y/N | ||
| b. What causes or prevents a reaction from taking place? |
Further revisions of the assignments, assessment questions and screencast were informed by analysis of student responses. This iterative assignment design and assessment cycle, as outlined in Fig. 1, is critical to ensuring the quality and efficacy of the pre-assessment and follow-up questions. Analysis and revision help allow us to determine if the questions and prompts accurately evaluate student understanding, measure changes in understanding, direct student attention to the most salient features of the resource, and help them construct an understanding of the underlying concepts from a particle level perspective. Further, since simulations have limitations, student responses need to be critically examined to identify ways in which the limitations of the simulation may result in development of incorrect or inconsistent understanding. This is particularly important when students are manipulating the simulation themselves as these issues may not be immediately obvious to experts. For example, in the initial draft of the simulation assignment, students were prompted to increase the temperature and describe what happened to the total energy of the system. A surprisingly large number of students expressed that increasing the temperature resulted in no change in total energy, although many simultaneously expressed that the molecules moved faster. It was determined that this disconnect arose from the fact that in this simulation it was relatively easy for the students to max out the total energy line which meant it stopped increasing as the system was further heated, even though the molecules themselves continued to show the effects of the additional energy. Systematic analysis of student responses allowed us to identify this discrepancy between the answers of the screencast and simulations groups, diagnose its cause, and adjust the prompts in the simulation assignment to first have students decrease the temperature and answer a few questions. This then eliminated the previously identified confusing situation when they subsequently raised the temperature, as evidenced by the fact that we did not see this same answer on subsequent iterations of the assignment.
Designing questions to effectively measure learning is also a challenge. Closed response questions, such as multiple choice, can be appealing as they provide both question context and bounds for the answer and are easy to score. However, these questions can also limit the detection of learning gains as multiple choice questions have been shown to overestimate student understanding (Lee et al., 2011; Hubbard et al., 2017). Our initial pre/post questions were predominantly multiple choice and resulted in very high scores (Fig. 2). The inability of the students to accurately provide constructed responses on follow-up questions indicated that they were lacking the fundamental understanding that their closed response answers suggested. By replacing multiple choice questions with constructed responses, we have seen a decrease in student scores, but an improvement in the ability to discern students’ learning gains.
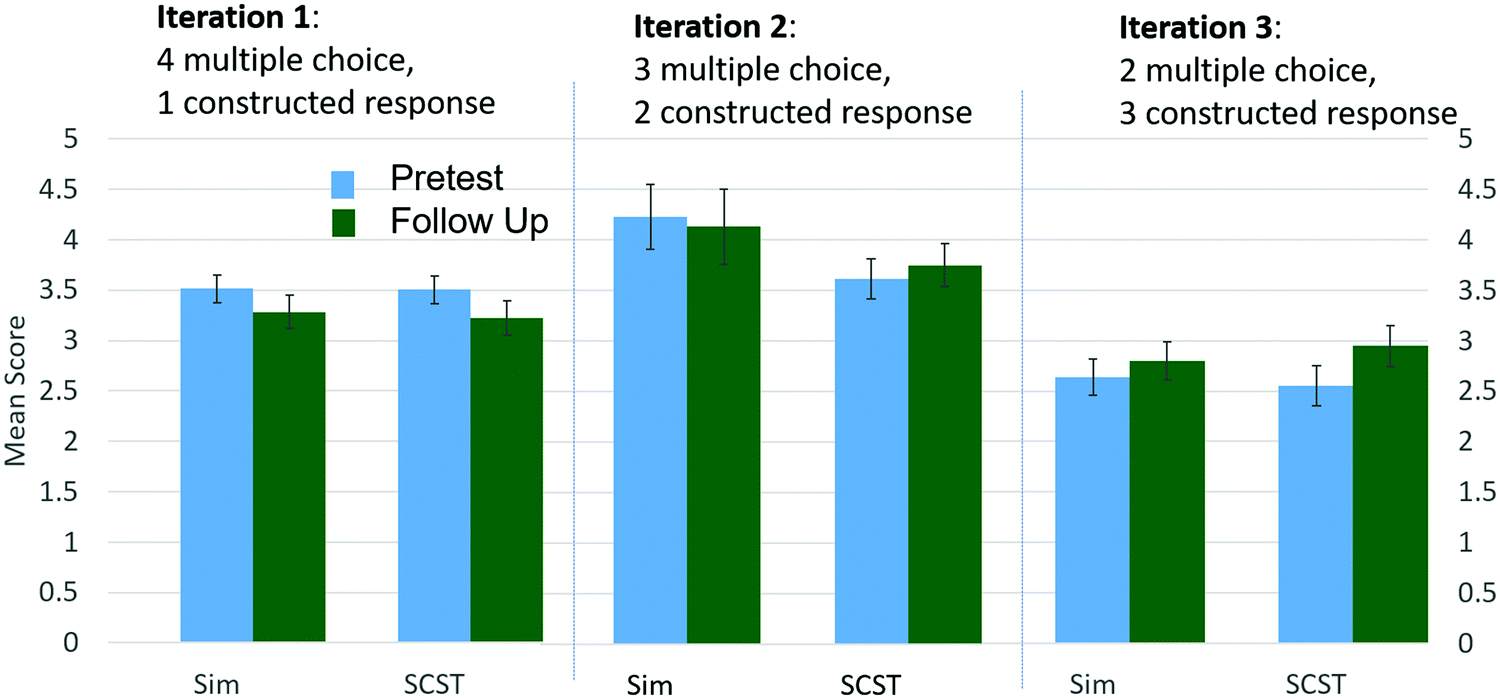 | ||
| Fig. 2 Pretest and follow up scores across revisions. | ||
Classroom study: participants and study design
This study was reviewed and approved as exempt by our Institutional Review Boards (GVSU Ref. No. 16-012-H; MSU x15-799e). The participants for this study were students enrolled in General Chemistry 2 at one of two different large public institution in the Midwest region of the United States. Table 2 shows the number of participants, instructors and institutions involved in each iteration of the study. After each of the first two iterations, adjustments were made to the pretest, follow up questions, assignment, and screencast to address difficulties encountered by the students or to improve the sensitivity of the instruments to showing learning gains. Given the iterative nature, the data analysis will focus predominantly on the 3rd iteration, except where noted.| Iteration | Number of students | Number of sections (instructors) | Number of institutions |
|---|---|---|---|
| 1 | 165 | 4 (2) | 1 |
| 2 | 156 | 3 (2) | 2 |
| 3 | 298 | 4 (2) | 2 |
Students were given a 10–15 minute pretest (Table 3) in the class session immediately before the introduction of Collision Theory. The students also received an instructional packet containing a link to either the simulation or screencast (see Appendices 1 and 2 for assignments). Students completed this homework and returned the completed assignment at the beginning of the next class period and their class instruction then built upon the common experiences that the students had from the simulation or screencast use.
| Pretest | Follow-up |
|---|---|
| Learning objective 1 – collision theory | |
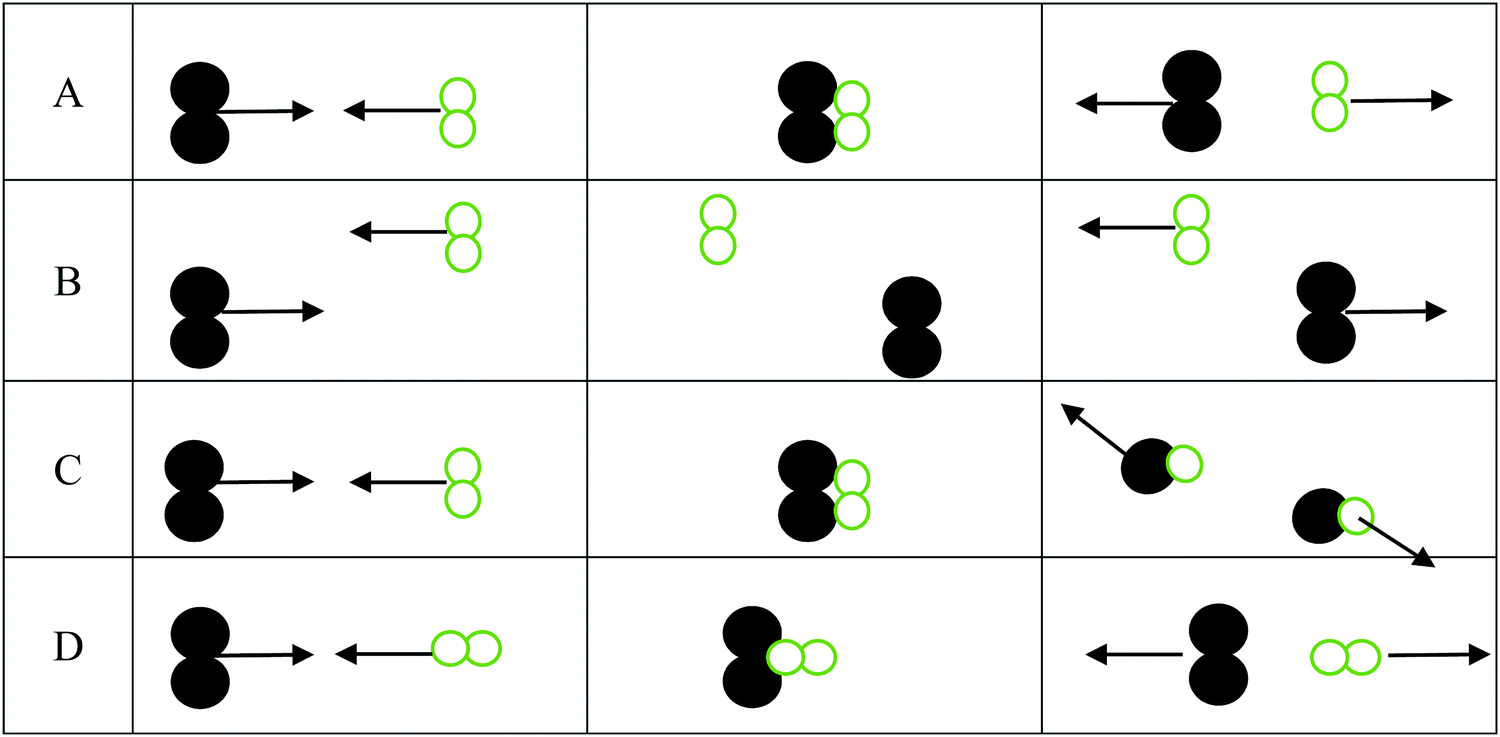
| 1. For a reaction to occur, reactants must collide. Are all collisions successful? | 1. For the three interactions below: |
| a. Yes | a. Identify the scenario that leads to a successful reaction: __________ |
| b. No | b. For those scenarios that were not successful, indicate why products were not formed |
| Explain the reasoning behind your answer above. | i. _______ was not successful because |
| ii. _______ was not successful because | |
| iii. _______ was not successful because | |

|
|
| Learning objective 2 – impact of temperature change | |
| 2. Which of the following is the primary reason for a higher reaction rate at higher temperatures? | 2. The yeast in bread dough causes a reaction that converts sugar into carbon dioxide. Why does the dough rise faster in a warmer area? |
| a. The higher temperature lowers the activation energy, so more particles can pass over the potential energy barrier. | |
| b. Particles increase in size with increasing temperature, providing more surface area for potential collisions. | |
| c. There is a larger fraction of molecules with sufficient kinetic energy to react. | |
| d. The likelihood that molecules and ions will have the required orientation increases at higher temperatures. | |
| Learning objective 3 – effects of changing concentration | |
| 3. The reactants for the reaction X + Y2 → XY2 are shown below. In the blank box provided, draw a picture of a set of reactants (X + Y2) that would result in a faster reaction rate. | 3. Why does a glowing splint of wood burn only slowly in air, but rapidly burst into flames when placed in pure oxygen? |

|
|
| 4. Most chemical reactions do not have a constant rate. Most reactions tend to slow down as the reaction progresses from reactant to product. Suggest one reason that the reaction may get slower as the reactants get converted to product, and explain how this slows down the reaction rate (assume the reaction occurs only in the forward direction). | 4. Most chemical reactions do not have a constant rate. Most reactions tend to slow down as the reaction progresses from reactant to product. Suggest one reason that the reaction may get slower as the reactants get converted to product, and explain how this slows down the reaction rate (assume the reaction occurs only in the forward direction). |
A variety of statistical analyses were completed using the Statistical Package for the Social Sciences (IBM SPSS Statistics 25, 2017) to determine how students’ understanding of collision theory may have changed as a result of the interventions and to compare the effect of the simulation as compared to the screencast. Given the relatively high level of student success on the pre and posttests, normalized change scores were calculated (Marx and Cummings, 2007). Mixed-design analysis of variance (ANOVA) tests were used to determine difference between pretest and follow up scores. Given that nearly all of our data had non-normal distributions as measured by the Shapiro–Wilks test, a Mann–Whitney U was used to determine differences between group based on relative rank.
Open-ended student responses on the pretest, assignment, or follow up questions were evaluated using qualitative methods. Student responses were coded using open-coding to identify common patterns in student responses. We then used a constant comparative approach for subsequent sections to ensure that our codes included all possible student responses (Strauss and Corbin, 1990). The coding was initially established with the first iteration of data collection and was revised as questions were modified for subsequent iterations. Correct answers for each code were given a score of 1. On questions where multiple discreet ideas had to be provided to be deemed fully correct, scores of 0.5 or 0.75 were given when students only provided part of the fully correct answer (with no incorrect information). See Appendix 3 for the coding scheme used.
Eye-tracking study: participants and study design
To address research question 2 and investigate how students focus their attention between the assignment and electronic resources (simulation or screencast), 27 student volunteers were recruited to participate in an eye-tracking study. This sample size is within the range of previously published chemistry education studies involving eye tracking, which span 9–28 participants per study (Havanki and VandenPlas, 2014). These students were recruited from classrooms that had covered the relevant prerequisite chemistry content but did not participate in the larger classroom study. During the eye-tracking sessions, participants engaged in the same activities as students in the classroom study but did so in a condensed timeframe. During the eye-tracking session, students first took the pretest using paper-and-pencil and then completed either the screencast (n = 13) or simulation (n = 14) assignment, answering all questions embedded in the activity, while seated at a Tobii T60 eye tracking system. This system displays a stimulus on a 17 inch computer monitor and samples the participant's eye position at a rate of 60 Hz. Participants sat approximately 24 inches from the monitor, and the system was calibrated to each participant prior to data collection. During the eye-tracking portion of the session, students were shown a split screen, with the simulation/screencast occupying the top half of the screen, and the corresponding assignment displayed on the bottom half (see Fig. 3). Students were able to manipulate the mouse to control the simulation or pause/rewind the screencast as needed. They were also able to scroll through the assignment and follow-up questions and were asked to give all answers aloud to avoid the need for writing. Although the interviewer wrote down the student responses to the assignment questions as they were given, interviews were audio recorded to ensure that all student responses were captured accurately. Participants in both groups were given the opportunity to use the simulation for the follow-up questions if they wanted to do so. These sessions lasted approximately 30 minutes each.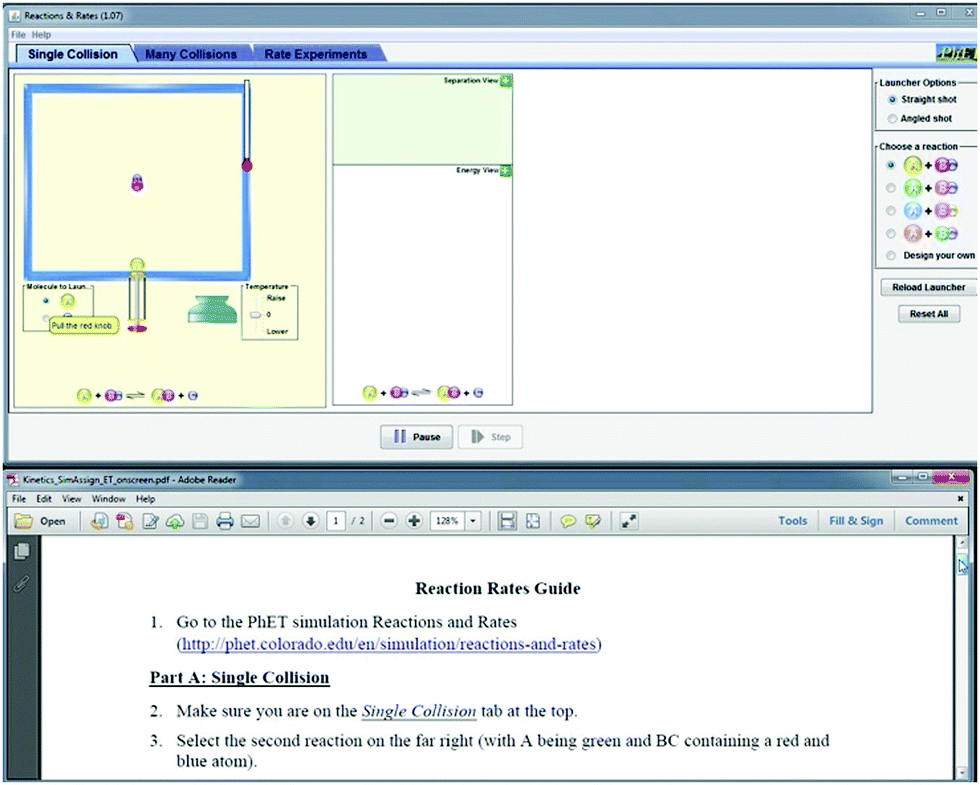 | ||
| Fig. 3 Stimulus presentation for eye-tracking study, showing simulation at the top of screen and assignment at the bottom of the screen. | ||
The eye-tracking data were processed to identify fixations using the Tobii Fixation Filter (Tobii, 2016). Fixations were then mapped to two areas of interest (AOIs): one for the electronic resource on the top half of the screen and one for the assignment itself on the bottom half of the screen. For each of these AOIs, the total amount of time spent in fixations within the AOI (in seconds) and the total number of fixations within the AOI were calculated for all participants. Mixed-design ANOVAs were used to analyze the data. For these models, fixation time or number of fixations were used as dependent variables. Treatment (simulation or screencast) was used as a between-subjects variable, with AOI used as a within-subjects variable.
Results and discussion
Learning gains
Overall, the learning gains between the pretest and follow-up questions for each of the two treatments were relatively small. A mixed-design ANOVA was used to compare student performance from pretest to follow-up based on treatment (simulation or screencast). This test shows a statistically significant main effect for time (F1,252 = 11.0, p < 0.001, ηp2 = 0.04) indicating that, overall, students improved from an average of 2.59 to 2.87 on a 5-point scale. However, neither the main effect for treatment or interaction effect of treatment and time were found to be significant. This suggests that both screencast and simulation treatments were equally effective in improving student performance. Examining the pretest and follow-up scores in Fig. 4 separated by both treatment and location, it is clear that although both of the classes completing the screencast showed improvement, the gains were predominantly achieved by the class that had a lower pretest score. This result is actually quite fascinating, as it suggests that the impact of this particular intervention is to help bring the class average to a relatively consistent level regardless of the pretest scores.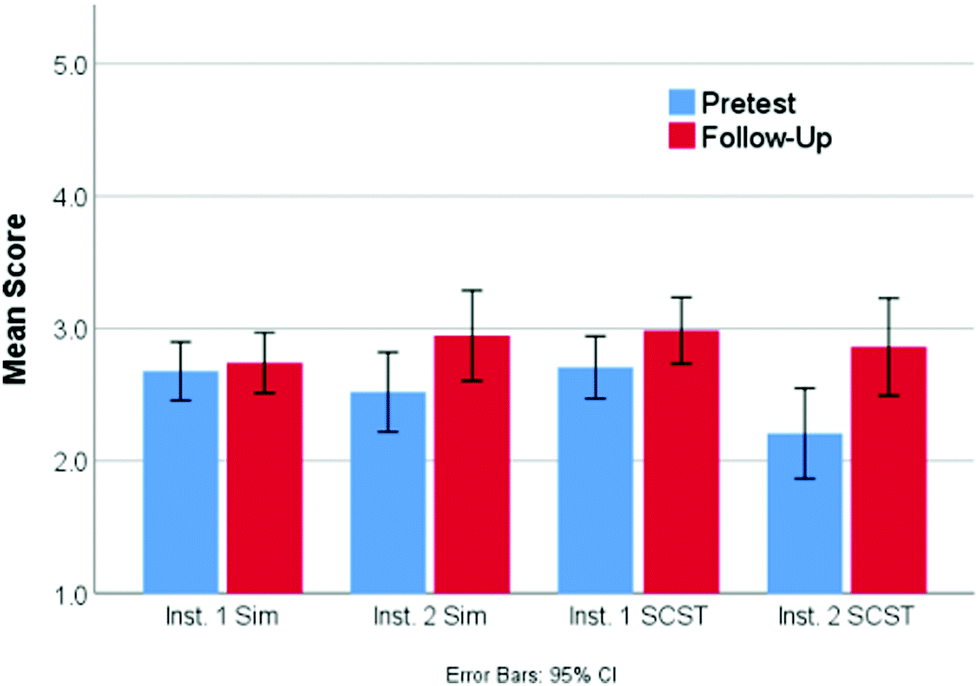 | ||
| Fig. 4 Scores on pretest and follow-up questions. | ||
Although these results may not seem all that promising, a deeper look at the individual questions (Table 3) highlights some interesting results. Question 4, for example, focuses on the role that concentration plays in the determination of rates of reaction. On average, the simulation students score identically on this question from pretest to follow-up (0.61/1 pts), while the screencast students show a moderate improvement (0.61 to 0.72/1 pts). Although this difference was not shown to be statistically significant using a mixed-design ANOVA, it suggests that the screencast students are gaining an understanding of the role that concentration plays in the determination of rates of reactions. Further, using a mixed-design ANOVA, both treatments showed a significant improvement around the idea that both orientation and enough energy were critical to reactions happening on question 1 (Table 3) moving from a score of 1.01 to 1.39/2 (F1,261 = 86.0, p < 0.001, ηp2 = 0.25). Together, this suggests that the current structure of the assignment is helping the students make gains toward learning outcomes 1 and 3.
Given the gains on question 1 and knowing that there was little to no difference in pre- and follow-up, there must be a decrease in score on other paired questions. Both treatments had lower follow-up scores on question 2. This result is perhaps not surprising given the change in question format from multiple choice on the pretest to constructed response on the follow-up. On the pretest, the students were simply required to identify the correct choice regarding how increasing the temperature increase the reaction rate, with 41% choosing the correct answer. However, on the follow-up question, the students had to construct their own answer and a full score was only given if students cited both an increase in the number of collisions (due to moving faster) and also that there would be more energy in the collision. Only 12% of the students identified both components, with another 32% of the students citing just one of the two factors and receiving half credit. The most common incorrect answers cited an increase in energy without linking it to the reaction (38%) or indicating that when temperature increases volume increases (9%). Overall, this led to a statistically lower score on the follow up question (0.28 vs. 0.41, F1,262 = 11.6, p < 0.001, ηp2 = 0.04). As research has demonstrated that students are often able to answer multiple choice questions on a given topic correctly with an incorrect or partially correct conceptual understanding using test taking strategies or other heuristics where they are unable to correctly answer a constructed response question on the same concept (Funk and Dickson, 2011; Hubbard et al., 2017; Couch et al., 2018), the pretest score could certainly be viewed as an over estimate of the student understanding. Taken together, these results suggest that though students may be making some progress on learning objective 2, many still lack a full conceptual understanding of this idea.
Eye-tracking study
Research question 2 focuses on how students allocate attention while interacting with a simulation or screencast and working through a guided assignment. In this study, fixation time was used as a measure of attention allocation. Previous research has shown that the more time an individual spends fixating on an object, the more attention they have paid to this object (Goldberg and Kotval, 1999; Holmqvist et al., 2011). The number of fixations made by an individual also can be used as a measure of attentional focus. In general, a high number of fixations has been shown to correlate both with a low level of expertise and a low level of search efficiency (Goldberg and Kotval, 1999). A high number of fixations may also indicate an unfocused individual, who is spreading their attention over a number of objects indiscriminately. In this study, the number of fixations and total fixation time were found to be significantly correlated for both the resource and the assignment (r = 0.82, p < 0.001). This is consistent with the results of other eye-tracking studies on student problem solving in chemistry education (Stieff, 2011; Tang and Abraham, 2016). For this reason, the remainder of the analysis focuses on fixation duration alone. Total fixation durations for each AOI are given in Table 4.| Mean fixation duration (SD) | ||
|---|---|---|
| Assignment (s) | Resource (s) | |
| Screencast | 385 (86) | 564 (74) |
| Simulation | 312 (53) | 461 (115) |
| Overall | 350 (80) | 515 (107) |
A mixed-design ANOVA with fixation duration as the dependent variable was conducted to investigate the impact of treatment on the division of attention between assignment and resource. Preliminary assumption testing was conducted to check for univariate normality, linearity, univariate and multivariate outliers, homogeneity of variance–covariance matrices, multicollinearity, and equality of error variances, with no violations observed. This test found a significant main effect for AOI (F1,19 = 70.0, p < 0.01, ηp2 = 0.79). On average, all participants spend more time fixating on the resource (mean = 515 s, SD = 107 s) than on the assignment (mean = 350 s, SD = 80 s). In addition, the main effect for treatment was also shown to be significant (F1,19 = 7.7, p = 0.012, ηp2 = 0.29). As can be seen in Table 4, screencast students spent longer fixating on the AOIs than the simulation students. Finally, the interaction effect between AOI and treatment was not significant (F1,19 = 0.6, p = 0.46).
These results suggest that all students spent more time engaging with the electronic resource than with the assignment questions, regardless of whether they were using the screencast or the simulation. Students spent approximately 60% of their viewing time on the resource, and only 40% of their time on the assignment. And although they split their time the same way as simulation students, the screencast students spent significantly more time overall on both the resource and the assignment questions. In general, screencast students spent a greater amount of time engaged with this educational activity than their peers who used the simulation alone. This increased time on task may account for the improved performance for students in the screencast treatment that was seen in the classroom study.
Self-reported working time
Although students spend longer in the eye-tracking study on the screencast assignment, students’ self-reported data consistently shows the opposite result (Fig. 5). Combining iterations 2 and 3, the screencast students (N = 212) report spending significantly less time interacting with the resource (13.0 vs. 23.4 minutes) compared to the simulation students (N = 172) (Mann–Whitney U = 7430, p < 0.001 two-tailed). The students from both groups then report spending an equivalent amount of time on the follow-up questions (15.4 vs. 13.8 min; Mann–Whitney U = 17![[thin space (1/6-em)]](https://www.rsc.org/images/entities/char_2009.gif) 757, p = 0.599 two-tailed). The seeming disconnect between these two results may be an indication that the simulation demands a higher intensity of attention and greater mental effort, leading students to overestimate the time that the activity required due to its perceived difficulty (Tzetzis et al., 2001). Therefore, it may be that the greater mental effort required to answer the questions through manipulation of the simulation makes it feel to the students as though the time on task is longer than it really is. It is also possible that the way students engage with the assignments at home and in a laboratory setting are different. For example, students at home may view the screencast in a single setting, whereas those engaged in exploration via the simulation alone may take more breaks while working on the assignment (an option not exercised by students in the laboratory setting), which may lead to inflated reports of time on task.
757, p = 0.599 two-tailed). The seeming disconnect between these two results may be an indication that the simulation demands a higher intensity of attention and greater mental effort, leading students to overestimate the time that the activity required due to its perceived difficulty (Tzetzis et al., 2001). Therefore, it may be that the greater mental effort required to answer the questions through manipulation of the simulation makes it feel to the students as though the time on task is longer than it really is. It is also possible that the way students engage with the assignments at home and in a laboratory setting are different. For example, students at home may view the screencast in a single setting, whereas those engaged in exploration via the simulation alone may take more breaks while working on the assignment (an option not exercised by students in the laboratory setting), which may lead to inflated reports of time on task.
 | ||
| Fig. 5 Self-reported working times in minutes. | ||
Other interesting patterns arose out of the analysis of the time data. There was weak, but significant negative correlation between a student's pretest score and the amount of time they reported spending on the simulation assignment (−0.204, p = 0.049) suggesting that students who were least successful on the pretest spent more time working on the assignment. This would be meaningful from an instructional standpoint, suggesting that students are innately recognizing their level of success and adjusting their effort accordingly. Separately, there was a strong correlation between the amount of time spent on the assignment and the posttest follow-up questions for the simulation students (0.721, p < 0.001). However, this relationship was not present for those completing the screencast (0.163, p = 0.074); it seems that the length of the screencast drives the amount of time spent on assignment, suggesting that there is very little additional exploration that occurs.
Conclusions and implications
The use of simulations and animations in the teaching and learning of chemistry has notably impacted students’ abilities to visualize the motion and interactions of particles in different situations and how those motions and interactions changes with the manipulation of different system variables (Lowe, 2003). As Johnstone pointed out in his seminal paper (Johnstone, 1982), the ability to explain what is happening at the macroscopic level based on particle motion and interactions is crucial for the conceptual understanding of chemistry that separates experts in the field from novice learners. Though, particularly in the case of the PhET simulations, much research has gone into their design to provide an environment that encourages and scaffolds student exploration and development of conceptual understanding (Lancaster et al., 2013), it still remains that novice learners may fail to notice some of the most germane aspects of the particle motions and interactions without proper scaffolding and direction (Jones et al., 2005). This research indicates that it is possible to design assignments with appropriate scaffolding prompts to help students develop, on their own and outside of class, some foundational understanding of collision theory and how variables such as concentration and temperature affect the rate of collisions and hence reactions. Yet an iterative process is needed to develop the quality materials that provide enough scaffolding to focus student on the most salient aspects of the simulations and help them construct a particle level understanding of the underlying concepts without over scaffolding the interactions such that students are not actively engaged in their learning. The most important findings is that the completion of this assignment as an introduction to collision theory/kinetics appears to bring classes on average to a common starting point (see Fig. 4).This finding has important implications for teaching as the majority of us find ourselves instructing classes of students with vastly different background situations and preparation in chemistry. Though it is dependent upon the student actually engaging meaningfully with the activity, our data from multiple classes with different instructors and different institutions suggests that having students engage with the simulation or screencast version of this assignment prior to instruction has the potential to bring students in the class to approximately the same level of understanding. This allows instructors to begin their instruction of collision theory and kinetics with students’ having a common experience on which to build. This is something that is not often the case, particularly in large lectures with a diverse student population.
Results from the eye-tracking study suggest that at least part of the students’ success in both the screencast and simulation treatment may come from their engagement with the electronic resource itself. Students in both groups spend significantly more time focusing on the electronic resource than they do on the assignment questions, indicating that they are using the resource to answer questions rather than relying on prior knowledge. Thus, students are spending significant time focusing on the particulate level images and graphical representations of the simulation, which should aid in building conceptual understanding. Additionally, screencast students appear to spend more time engaged in the task overall, on both the resource and assignment questions, than do simulation students. This increased time on task suggests that the screencast may hold student interest longer than the simulation alone, or simply that the length of the screencast forces students to attend to the task for a longer period of time. Regardless of its basis, this increased time on task appears to be beneficial for students and may explain the positive impacts on student learning found in the classroom study for the screencast treatment. Interestingly, this increased time on task is not reflected in students’ self-reported task time, which may suggest that the screencast task felt easier to students due to its expert-led narration. By off-loading the control of the simulation to the expert, the screencast may free some working memory for students, lowering the overall cognitive load of the task. This could have the effect of both making the task feel easier, but also increasing learning gains from this treatment. The best practices for an introductory use of simulations may be to introduce the simulation to students through a screencast outside of class, allowing them to become familiar with its features in a guided, low-effort manner. When they are comfortable with the simulation, giving them a follow-up assignment in which they must control the resource on their own to make observations would still allow the opportunity for true exploration and active engagement.
A second finding also has important implications for teaching; the development of deep conceptual understanding requires time and multiple exposures to content. These assignments are designed as introductory activities to help students begin to construct conceptual understanding and bring students to a similar starting point for further instruction. However, one activity, even one that is rich and requires students to identify patterns and make connections between particle level and macroscopic representations, is not enough in itself to help students develop a complete conceptual understanding of core chemistry concepts. In their research on effective use of animations for instruction and supporting student development of scientifically accurate particle level mental models of chemical processes, Tasker and Dalton (2008) have stressed the importance of focusing students on key aspects of the animation and providing them with opportunities to connect these mental models to macroscopic events through drawing particle level models and engaging in instructor facilitated discussion and reflection on their drawings and how these can be used to explain macroscopic events. This supports the use of assignments like the ones described here as the initial foundation for a topic, providing students a common experience and means for visualizing particle motions and interactions that instructors can build upon to help students make additional connections and more fully develop their conceptual understanding of complex chemistry concepts.
Conflicts of interest
There are no conflicts to declare.Appendices
Appendix 1: simulation assignment
Name: _______Reaction Rates Guide
1. Go to the PhET simulation Reactions and Rates (http://phet.colorado.edu/en/simulation/reactions-and-rates) – and choose Run Now. Note: You will need Java installed on your computer for this. Java does not work with Chrome so you will need to use another browser. After you install Java you will need to add the above website to the java exception site list which can be found under the Security tab of the Java Control Panel. Instructions for how to find the Java control panel and add this site to the exception list for both Macs and PCs can be found in the Java Instructions document.
2. What is the clock time as you start the assignment? ______________________
Part A: Single Collision
3. Make sure you are on the Single Collision tab at the top.
4. Select the second reaction on the far right (with A being green and BC containing a red and blue atom).
5. Click on the “+” sign in the top right hand corner of the Separation View and Energy View boxes so that you can see the separation of the particles and the reaction energy diagram in the boxes.
6. Pull down the plunger about ½ way. What happens to the total energy line (green line) on the reaction energy diagram? _____________________________
a. Release the plunger. Does a reaction take place? Yes/No What causes or prevents a reaction from taking place? __________________________________
7. Hit the “Reload Launcher” button at the far right and then pull the plunger down all the way and release.
a. What happened to the total energy line when you pulled the plunger down all the way? _________________________________
b. When you released the plunger did a reaction take place? Y/N What causes or prevents a reaction from taking place? __________________________________
c. Watch the particles collide for a minute or so, do they react every time they collide? Y/N
d. What factors are different between when a reaction happens and when one doesn’t?
8. Lower the temperature.
a. What happens to the particles? __________________
b. What happens so the total energy of the system? ________________________
c. What happens to the particles and the total energy of the system when the temperature is raised?
Part B: Many Collisions
6. Click on the Many Collisions tab at the top
7. In the Initial Conditions box, select the second reaction (with A being green and BC containing a red and blue atom).
8. Under options on the far right, choose a chart type (bar, pie, or strip)
9. Pump some A and some BC into the reaction chamber (try about 3 pumps each) and watch the reaction for a minute or so.
a. What happens when the particles collide? __________________________________
b. Is there any reaction? Y/N What causes or prevents a reaction from taking place?
10. Try adding more A (another 3 pumps) and watch for a minute or so.
a. Is there any reaction now? Y/N
b. What causes or prevents a reaction from taking place? _____________________
11. Raise the temperature until the “Total average energy” (green line) is almost to the top of the activation energy on the reaction energy diagram.
a. What happens to the particles? _________________________________________
b. What happens to how fast reactants are converted to products and how fast products are converted back to reactants? ____________________________
c. Once a product is formed, does it always stay as a product? How do you know?
d. Why is the green line labeled “Total average energy” and not “Total energy” like in the single collision case?
12. What do you think will happen if you add some AB to the mixture? ________________
Try it and find out!
Were you right? Y/N If not, what happened? ______________________________
Summary
1. List the factors required in order for a collision to be successful (form products).
2. How does adding more of a reactant affect the number of successful collisions? Why?
3. How does raising the temperature affect the number of successful collisions? Why?
What is the clock time at this point in the assignment? _____________________________
Follow-up Questions
1. For the three interactions below:
a. Identify the scenario that leads to a successful reaction: __________
b. For those scenarios that were not successful, indicate why products were not formed
i. _______ was not successful because ________________________________
ii. _______ was not successful because ________________________________
iii. _______ was not successful because ________________________________
2. The yeast in bread dough causes a reaction that converts sugar into carbon dioxide. Why does the dough rise faster in a warmer area?
3. Why does a glowing splint of wood burn only slowly in air, but rapidly burst into flames when placed in pure oxygen?
4. Most chemical reactions do not have a constant rate. Most reactions tend to slow down as the reaction progresses from reactant to product. Suggest one reason that the reaction may get slower as the reactants get converted to product, and explain how this slows down the reaction rate (assume the reaction occurs only in the forward direction).
5. What is the current clock time? _______________________________
Appendix 2: screencast assignment
Name: _________________________Reaction Rates Guide
1. Go to the following link to watch the Reaction Rates Screencast (https://www.youtube.com/watch?v=t4Y4BkibWU0)
2. What is the clock time as you start the assignment? ______________________
Part A: Single Collision
3. When the plunger is pulled down about ½ way, what happens to the total energy line (green line) on the reaction energy diagram? _____________________________
a. Does a reaction take place? Yes/No What causes or prevents a reaction from taking place?
4. What happened to the total energy line when the plunger was pulled down all the way?
a. When the plunger was released did a reaction take place? Y/N What causes or prevents a reaction from taking place? _________________________________________________________________________
b. Watch the particles collide for a minute or so, do they react every time they collide? Y/N
c. What factors are different between when a reaction happens and when one doesn’t?
5. When the temperature is raised:
a. What happens to the particles? __________________
b. What happens so the total energy of the system? ________________________
c. What happens to the particles and the total energy of the system when the temperature is lowered?
Part B: Many Collisions
6. Reaction between A and BC
a. What happens when the particles collide? __________________________________
b. Is there any reaction? Y/N What causes or prevents a reaction from taking place?
7. Adding more A
a. Is there any reaction now? Y/N
b. What causes or prevents a reaction from taking place?
8. Raising the temperature
a. What happens to the particles? _________________________________________
b. What happens to how fast reactants are converted to products and how fast products are converted back to reactants? ____________________________
c. Once a product is formed, does it always stay as a product? How do you know?
d. Why is the green line labeled “Total average energy” and not “Total energy” like in the single collision case?
9. What do you think will happen if you add some AB to the mixture? _____________________
Open the simulation and check your answer. Were you right? Y/N If not, what happened?
Summary
10. List the factors required in order for a collision to be successful (form products)
11. How does adding more of a reactant affect the number of successful collisions? Why?
12. How does raising the temperature affect the number of successful collisions? Why?
What is the clock time at this point in the assignment? ________________________________
Follow-up Questions
1. For the three interactions below:
a. Identify the scenario that leads to a successful reaction: __________
b. For those scenarios that were not successful, indicate why products were not formed
i. _______ was not successful because ________________________________
ii. _______ was not successful because ________________________________
iii. _______ was not successful because ________________________________
2. The yeast in bread dough causes a reaction that converts sugar into carbon dioxide. Why does the dough rise faster in a warmer area?
3. Why does a glowing splint of wood burn only slowly in air, but rapidly burst into flames when placed in pure oxygen?
4. Most chemical reactions do not have a constant rate. Most reactions tend to slow down as the reaction progresses from reactant to product. Suggest one reason that the reaction may get slower as the reactants get converted to product, and explain how this slows down the reaction rate (assume the reaction occurs only in the forward direction).
What is the current clock time? _______________________________
Appendix 3: coding rubric for kinetics assessment
Note: If an incorrect idea is expressed, it preferentially should be categorized there (rather than giving credit for what is right)Pre-test (Assessment A)
Question 1 first part
code A or B (correct answer scored as 1 pt)
Question 1 second part
1 = just orientation
2 = just energy
3 = combination of orientation and energy (scored as 1 pt)
0 = wrong
Question 2
Code answer (correct answer scored as 1 pt)
Question 3
0 = not correct
1 = more atoms (scored as 1 pt)
2 = less volume (scored as 1 pt)
3 = increase temp (scored as 1 pt)
4 = catalyst (scored as 1 pt)
Question 4
1 = Fewer reactants (scored as 0.75 pt)
2 = Energy used up/decreases
3 = Reach equilibrium
4 = IMFs/Bonds
5 = Fewer collision (scored a 1 pt)
0 = Other wrong (mixed bag)
Follow-up Assignment
Question 1
Coding based on the letter (A–D). Each part (A-4) would earn 0.5 points for correct reasoning.
E.g., if for A they said no reaction because not enough energy the code would be e for follow-up 1A
c = correct
e = energy
no = no collision
o = orientation/collision not right
p = partially correct
w = wrong
d = didn't react
n = not used
Question 2
1 = more collisions (if they say particles move faster or more energy so you get more collisions code as more collisions) (scored as 0.5 pt)
2 = faster moving or increase energy
3 = as temperature increases, volume increases
4 = increase in energy of collision (must say something about collision) (scored as 0.5 pt)
5 = breaking bonds or IMFs (and nothing about increased number of collisions)
6 = more successful collisions (scored as 0.5 pt)
7 = greater probability of collision with enough energy because more collisions and/or particles have more energy/moving faster (scored as 1 pt)
8 = misc (other codes – enter a summary of the response as note in excel file)
Question 3
1 = Increase/more reactants (scored as 0.75 pt)
2 = More reactant increases probability/number of collisions (scored as 1 pt)
3 = Need O for reaction
4 = Misc (other codes – enter a summary of the response as note in excel file)
5 = More particles in given volume
Question 4
1 = Fewer reactants (scored as 0.75 pt)
2 = Energy used up/decreases
3 = Reach equilibrium
4 = IMFs/bonds
5 = Fewer collision (scored a 1 pt)
0 = Other wrong (mixed bag)
Acknowledgements
The authors would like to thank the instructors and the students who made the collection of data possible. We would also like to thank Marissa Biesbrock and Kristina Pacelli for collecting the eye-tracking data. This material is based upon work supported by the National Science Foundation under Grant No. 1705365 and 1702592.References
- Akaygun S. and Jones L. L., (2013), Dynamic Visualizations: Tools for Understanding the Particulate Nature of Matter, in Concepts of Matter in Science Education Innovations in Science Education and Technology, Springer, Dordrecht, pp. 281–300.
- Bain K. and Towns M. H., (2016), A review of research on the teaching and learning of chemical kinetics, Chem. Educ. Res. Pract., 17(2), 246–262.
- Brown P. C., Roediger H. L. and McDaniel M. A., (2014), Make it stick: the science of successful learning, Cambridge: Harvard University Press.
- Cachapuz A. F. C. and Maskill R., (1987), Detecting changes with learning in the organization of knowledge: use of word association tests to follow the learning of collision theory, Int. J. Sci. Educ., 9(4), 491–504.
- Cakmakci G., (2009), Emerging issues from textbook analysis in the area of chemical kinetics, Aust. J. Educ. Chem., 70, 31–38.
- Cakmakci G., (2010), Identifying Alternative Conceptions of Chemical Kinetics among Secondary School and Undergraduate Students in Turkey, J. Chem. Educ., 87(4), 449–455.
- Cakmakci G. and Aydogdu C., (2011), Designing and evaluating an evidence-informed instruction in chemical kinetics, Chem. Educ. Res. Pract., 12(1), 15–28.
- Callender A. A. and McDaniel M. A., (2009), The limited benefits of rereading educational texts, Contemp. Educ. Psychol., 34(1), 30–41.
- Chandler P. and Sweller J., (1991), Cognitive Load Theory and the Format of Instruction, Cognit. Instruct., 8(4), 293–332.
- ChemSims Project, (2016), Screencast for PhET reaction and rates, [online] YouTube, available at: https://www.youtube.com/watch?v=t4Y4BkibWU0 [accessed 9 Jan 2019].
- Chi M. T. H. and Wylie R., (2014), The ICAP Framework: Linking Cognitive Engagement to Active Learning Outcomes, Educ. Psychol., 49(4), 219–243.
- Chittleborough G. and Treagust D. F., (2007), The modelling ability of non-major chemistry students and their understanding of the sub-microscopic level, Chem. Educ. Res. Pract., 8(3), 274–292.
- Couch B. A., Hubbard J. K. and Brassil C. E., (2018), Multiple-True-False Questions Reveal the Limits of the Multiple-Choice Format for Detecting Students with Incomplete Understandings, BioScience, 68(6), 455–463.
- de Vos W. and Verdonk A. H., (1996), The particulate nature of matter in science education and in science, J. Res. Sci. Teach., 33(6), 657–664.
- Funk S. C. and Dickson K. L., (2011), Multiple-Choice and Short-Answer Exam Performance in a College Classroom, Teach. Psychol., 38(4), 273–277.
- Gabel D. L., Samuel K. V. and Hunn D., (1987), Understanding the particulate nature of matter, J. Chem. Educ., 64(8), 695–697.
- Goldberg J. H. and Kotval X. P., (1999), Computer interface evaluation using eye movements: methods and constructs, Int. J. Ind. Ergon., 24(6), 631–645.
- Havanki K. L. and VandenPlas J. R., (2014), Eye Tracking Methodology for Chemistry Education Research, in Tools of Chemistry Education Research ACS Symposium Series, American Chemical Society, pp. 191–218.
- Herrington D. G., Sweeder R. D. and VandenPlas J. R., (2017), Students’ Independent Use of Screencasts and Simulations to Construct Understanding of Solubility Concepts, J. Sci. Educ. Technol., 26(4), 359–371.
- Holmqvist K., Nyström M., Andersson R., Dewhurst R., Jarodzka H. and Van de Weijer J., (2011), Eye tracking: a comprehensive guide to methods and measures, Oxford: Oxford University Press.
- Hubbard J. K., Potts M. A. and Couch B. A., (2017), How Question Types Reveal Student Thinking: An Experimental Comparison of Multiple-True-False and Free-Response Formats, CBE-Life Sci. Educ., 16(2), ar26.
- IBM SPSS Statistics 25, (2017), Armonk, New York: IBM.
- Johnstone A. H., (1982), Macro- and micro-chemistry, Sch. Sci. Rev., 64, 377–379.
- Jones L. L., Jordan K. D. and Stillings N. A., (2005), Molecular visualization in chemistry education: the role of multidisciplinary collaboration, Chem. Educ. Res. Pract., 6, 136–149.
- Justi R., (2002), Teaching and learning chemical kinetics, in Chemical education: Towards research-based practice, Springer, pp. 293–315.
- Justi R. and Gilbert J. K., (1999), History and philosophy of science through models: the case of chemical kinetics, Sci. Educ., 8(3), 287–307.
- Lancaster K. L., Moore E. B., Parson R. P. and Perkins K. P., (2013), Insights from Using PhET's Design Principles for Interactive Chemistry Simulations, in Suits J. et al. (ed.), Pedagogic Roles of Animations and Simulations in Chemistry Courses, Washington, DC: American Chemical Society, pp. 97–126.
- Kelly R. M. and Jones L. L., (2007), Exploring how different features of animations of sodium chloride dissolution affect students’ explanations, J. Sci. Educ. Technol., 16(5), 413–429.
- Lee H.-S., Liu O. L. and Linn M. C., (2011), Validating Measurement of Knowledge Integration in Science Using Multiple-Choice and Explanation Items, Appl. Meas. Educ., 24(2), 115–136.
- Lowe R. K., (2003), Animation and learning: selective processing of information in dynamic graphics, Learn. Instr., 13(2), 157–176.
- Marx J. D. and Cummings K., (2007), Normalized change, Am. J. Phys., 75(1), 87–91.
- Moore E. B., Chamberlain J. M., Parson R. and Perkins K. K., (2014), PhET Interactive Simulations: Transformative Tools for Teaching Chemistry, J. Chem. Educ., 91(8), 1191–1197.
- Nurrenbern S. C. and Pickering M., (1987), Concept learning versus problem solving: is there a difference? J. Chem. Educ., 64(6), 508–510.
- Paas F., Renkl A. and Sweller J., (2003), Cognitive load theory and instructional design: recent developments, Educ. Psychol., 38(1), 1–4.
- Reactions & Rates, PhET Project, University of Colorado, accessed 9 Jan 2019, https://phet.colorado.edu/en/simulation/reactions-and-rates.
- Sanger M. J., (2005), Evaluating Students’ Conceptual Understanding of Balanced Equations and Stoichiometric Ratios Using a Particulate Drawing, J. Chem. Educ., 82(1), 131–134.
- Sanger M. J. and Badger S. M., (2001), Using computer-based visualization strategies to improve students’ understanding of molecular polarity and miscibility, J. Chem. Educ., 78(10), 1412–1416.
- Schwartz D. L., Chase C. C., Oppezzo M. A. and Chin D. B., (2011), Practicing versus inventing with contrasting cases: the effects of telling first on learning and transfer, J. Educ. Psychol., 103(4), 759–775.
- Stieff M., (2011), Improving representational competence using molecular simulations embedded in inquiry activities, J. Res. Sci. Teach., 48(10), 1137–1158.
- Strauss A. and Corbin J. M., (1990), Basics of qualitative research: grounded theory procedures and techniques, Thousand Oaks, CA, US: Sage Publications, Inc.
- Talanquer V., (2016), Central Ideas in Chemistry: An Alternative Perspective, J. Chem. Educ., 93(1), 3–8.
- Tang H. and Abraham M. R., (2016), Effect of Computer Simulations at the Particulate and Macroscopic Levels on Students’ Understanding of the Particulate Nature of Matter, J. Chem. Educ., 93(1), 31–38.
- Tasker R. and Dalton R., (2008), Visualizing the Molecular World – Design, Evaluation, and Use of Animations, in Gilbert J. K., Reiner M. and Nakhleh M. (ed.), Visualization: Theory and Practice in Science Education, Dordrecht: Springer Netherlands, pp. 103–131.
- Tobii A. B., (2016), Tobii Studio User's Manual.
- Tobin K. G. (ed.), (2009), The Practice of constructivism in science education, transf. to digit. pr. New York [u.a.]: Routledge.
- Tzetzis G., Avgerinos A., Vernadakis N. and Kioumourtzoglou E., (2001), Differences in self-reported perceived and objective measures of duration and intensity of physical activity for adults in skiing, Eur. J. Epidemiol., 17(3), 217–222.
- Van Driel J. H., (2002), Students’ corpuscular conceptions in the context of chemical equilibrium and chemical kinetics, Chem. Educ. Res. Pract., 3(2), 201–213.
- Wiggins G. P. and McTighe J., (2005), Understanding by design, 2nd edn, Alexandria, VA: Association for Supervision and Curriculum Development.
- Williamson V., (2014), Teaching Chemistry Conceptually, in Devetak I. and Glažar S. A. (ed.), Learning with Understanding in the Chemistry Classroom, Dordrecht: Springer Netherlands, pp. 103–208.
- Williamson V. M. and Abraham M. R., (1995), The effects of computer animation on the particulate mental models of college chemistry students, J. Res. Sci. Teach., 32(5), 521–534.
- Yezierski E. J. and Birk J. P., (2006), Misconceptions about the particulate nature of matter. Using animations to close the gender gap, J. Chem. Educ., 83(6), 954–960.
| This journal is © The Royal Society of Chemistry 2019 |