 Open Access Article
Creative Commons Attribution 3.0 Unported Licence
Light as a reaction parameter – systematic wavelength screening in photochemical synthesis†
Christian P.
Haas‡
 ,
Thomas
Roider‡
 ,
Reinhard W.
Hoffmann
 and
Ulrich
Tallarek
 *
*
Department of Chemistry, Philipps-Universität Marburg, Hans-Meerwein-Strasse 4, 35032 Marburg, Germany. E-mail: tallarek@staff.uni-marburg.de; Web: http://www.uni-marburg.de/fb15/ag-tallarek
First published on 9th September 2019
Abstract
We unfold light as a reaction parameter in a continuous-flow photoreactor using 16 LED arrays with different emission bands (350–700 nm) but identical irradiances. For the perfluoroalkylation of 2-methylindole, three reaction mechanisms are revealed wavelength-selectively and subsequently transferred into independent synthetic routes: i) photoredox catalyzed by eosin Y, ii) via amine-based electron donor–acceptor (EDA) complexes (catalyst-free), and iii) via indole-based EDA complexes (catalyst- and additive-free). The presented methodology enables routine and systematic screening of irradiation wavelengths and intensities in photochemical synthesis.
The suitable selection of light sources represents a valuable asset in synthetic photochemistry to control reaction outcomes. Specific reaction channels can be addressed precisely by using appropriate irradiation wavelengths if the underlying reaction mechanisms are adequately understood.1,2 Unfortunately, elucidating these reaction mechanisms remains an elaborate and multidisciplinary challenge, especially for complex photochemical reaction systems.2,3 Therefore, it seems reasonable to discover wavelength selectivities and dependencies of photochemical reactions in their actual synthetic environment by screening different irradiation wavelengths systematically, i.e., with the same number of incident photons per time and area (irradiance).4 The few reports on wavelength screenings with identical irradiances are limited to the use of tunable laser systems, which, even though providing essentially monochromatic emission, are expensive and difficult to combine with typical photoreactor setups.5
In contrast, high-power light-emitting diodes (LEDs) have been established as workhorses in modern synthetic photochemistry, since they provide relatively narrow emission bands for many emission maxima.2 Accordingly, recent reports have described the wavelength selectivities or dependencies of reactions by using different LED light sources.4 Notably, the group of Kappe could demonstrate wavelength-selective gating of two different reaction channels by screening six different wavelengths, albeit with significantly different irradiances.6 In another approach, Noël and co-workers7 applied luminescent solar concentrators which converted broad solar irradiation to a narrow wavelength range matched with the absorption maximum of the photocatalyst to demonstrate wavelength-selective effects. Here, we present the first systematic wavelength screening with a LED photoreactor using the perfluorobutylation of 2-methylindole as the test reaction.
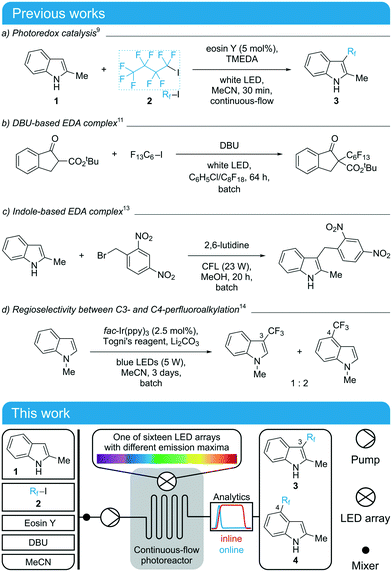
Due to the significance of perfluoroalkylation reactions in drug development, they are well-established in the literature encompassing a variety of photochemical strategies and light sources.8 Based on previous studies (Scheme 1 top), we chose the reaction of 2-methylindole (1) with nonafluoro-1-iodobutane (2) in acetonitrile as a test reaction and selected 1,8-diazabicyclo[5.4.0]undec-7-ene (DBU) as a base. This reaction has been previously realized under continuous-flow conditions with eosin Y as a metal-free photoredox catalyst and TMEDA (N,N,N′,N′-tetramethyl-1,2-ethanediamine) as an amine base (Scheme 1a).9 It was also reported that TMEDA and DBU act as “amine promoters” in the synthesis of perfluoroalkyl-substituted β-ketoesters involving electron donor–acceptor (EDA) complexes between amine bases and perfluoroalkyl iodides (Scheme 1b).10–12 Moreover, the substrate 2-methylindole itself was shown to form EDA complexes that drive photochemical alkylation reactions (Scheme 1c).13 Finally, the free radical alkylation of indoles may lead to regioisomeric products, as seen in the trifluoromethylation of indoles using Togni's reagent (Scheme 1d).14,15 Considering the various reaction channels of the chosen system and the so far investigated light sources (mostly white light or “blue LED” without further specification of the emission), a systematic study of the wavelength selectivities of the different reaction channels appeared promising.
 | ||
| Scheme 1 Top: Previous studies on (perfluoro)alkylation reactions through photoredox catalysis or EDA complexes.9–15 Bottom: Schematic experimental setup for the screening of wavelengths in the reaction of 2-methylindole (1) and nonafluoro-1-iodobutane (2) to yield a mixture of perfluoroalkylated indole regioisomers 3 and 4. | ||
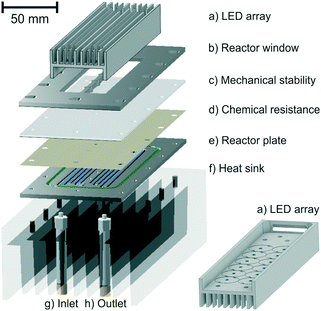
For the experimental setup (Scheme 1 bottom), we employed a two-dimensional continuous-flow platform.16 The pump device in the first dimension precisely controls the flow rate in the photoreactor and enables independent mixing of all substrates and additives with acetonitrile. The online coupled HPLC system allows for the separation, as well as the quantification, of all reaction partners after external calibration. A detailed description of the setup and the calibration procedure, as well as photographs, is available in the ESI.† The LED arrays and the photoreactor were designed in-house and were geometrically matched such that maximum irradiation intensity as well as high irradiation homogeneity was ensured, representing a hallmark of continuous-flow photochemistry in general.17 The continuous-flow photoreactor was developed modularly, which allowed a facile exchange of individual components (Fig. 1). The reaction channel (0.5 mm irradiation depth) was meandered into the reactor plate, resulting in an irradiated reactor volume of 0.85 mL. The heat generated by the LED arrays was efficiently removed using air fans and heat sinks on the rear sides of the LED arrays and the reactor as well as between the reactor and arrays (ESI†).
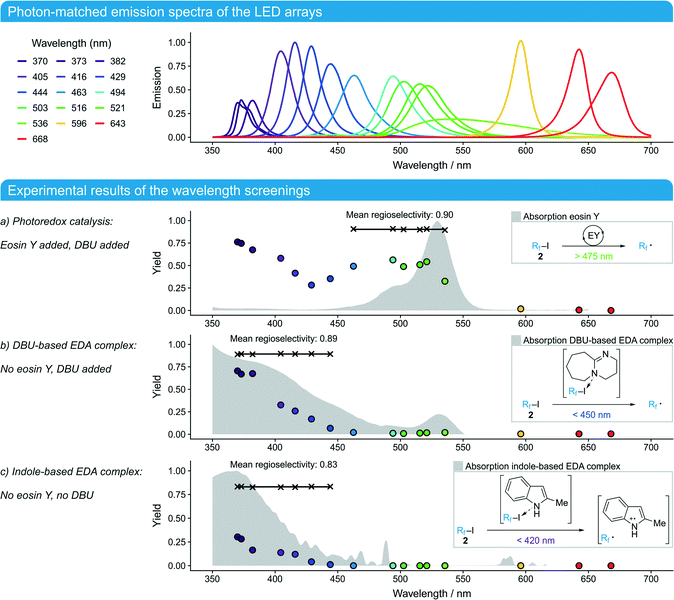
The LED arrays were each assembled with twelve high-power LEDs (minimum 1.6 W, ESI†) for sixteen different emission maxima to cover most of the visible light spectrum (350–700 nm). To match their irradiances, the reactor plate was removed and a calibrated spectroradiometer was used to record the emission spectra directly behind the FEP foil. These emission spectra were integrated and the resulting power spectral densities were calibrated as a function of the applied current on the LED array. This allowed the convenient matching of all calibrated LED arrays to any irradiance in the calibrated range. A detailed protocol for the matching process can be found in the ESI,† where the irradiation intensity profiles over the reactor plate area are also shown. To interpret the results (Fig. 2 bottom), it is crucial to consider the widths of the emission bands after matching the irradiances (Fig. 2 top) since a wider emission band comes with a lower intensity at the emission maximum.
 | ||
| Fig. 2 Top: Emission of the LED arrays. The light transmission of the pane decreased for wavelengths below 400 nm (ESI†). To compensate for the reduced irradiance on the photoreactor (30%), the reaction time was adjusted (see the ESI† for details). Bottom: Experimental results of the wavelength screenings under the following reaction conditions: flow rate 0.5 mL min−1 (reaction time treact = 1.7 min), [1]0 = 0.0175 mol L−1, 2.0 equiv. 2, 3.0 equiv. DBU, 2 mol% eosin Y, MeCN, ambient temperature, matched irradiances (except <400 nm, ESI†). The yield of the main regioisomer 3 was calculated as [3]/[1]0. The obtained conversions showed the same trend as the given yields. | ||
As a first experiment, the work of Noël and co-workers9 was reproduced using DBU instead of TMEDA as an amine base (Scheme 1a). The 521 nm-LED array was applied since it had the largest overlap with the absorption spectrum of the photoredox catalyst eosin Y. Initial screenings revealed that the catalyst loading as well as the reaction time could be reduced significantly to achieve complete conversion (2 mol%, 4.2 min) compared to the original study where white light was employed (ESI†). Our subsequent wavelength screenings were performed with even shorter reaction times (1.7 min, resulting in a conversion of 80% with the 521 nm-LED array) to compare the efficiency of the different LED arrays.
The screening of the photoredox catalyzed reaction at wavelengths above 450 nm showed that the product yield of the main regioisomer 3 correlates with the absorption spectrum of eosin Y (Fig. 2a). Moreover, the regioselectivity between the addition on the indole 3- and 4-position remained constant at 90% in favor of the main regioisomer 3. At shorter wavelengths (<450 nm), the yield started to increase again, although eosin Y did not show significant absorption in this region. To validate this observation, the same screening was performed without eosin Y (Fig. 2b). The yields for wavelengths <450 nm showed the same trend as those for the screening in Fig. 2a and became almost identical at <400 nm. Obviously, a second reaction channel was addressed wavelength-selectively which showed almost the same regioselectivity (89%) as that of the preceding screening. Informed by previous studies on EDA complexes (Scheme 1b and c),10–13 a third screening was performed to determine if the underlying EDA complex is DBU- or indole-based. Therefore, the reaction was run only with the substrates 2-methylindole (1) and perfluorobutyl iodide (2) – without any bases or other additives. Surprisingly, this reaction also showed a significant conversion and yield at wavelengths <420 nm, albeit to a lesser extent than in the screenings before. Moreover, the regioselectivity dropped slightly (yet significantly) to 83%.
These results reveal three different photo-initiated reaction channels of which the first two (Fig. 2a and b) deliver the same mixture of regioisomers 3 and 4 while the third one (Fig. 2c) leads to a slightly different distribution. These results fit very well to the mechanisms proposed in previous studies. The photo-initiated step of the eosin Y catalyzed reaction results in a free perfluoroalkyl radical via a single electron transfer (SET) to iodide 2 (Fig. 2a), which then binds to 2-methylindole (1) with a characteristic regioselectivity.9 The DBU-based EDA complex also delivers free perfluoroalkyl radicals upon irradiation as evidenced by the same regioselectivity (Fig. 2b).11,12 Irradiation of the indole-based EDA complex, in contrast, initiates a SET between substrate molecules 1 and 2 to a radical pair, where in a different product-determining step, a radical recombination reaction within the solvent cage takes place prior to a diffusive radical separation out of the solvent cage, leading to a (slightly) different regioselectivity (Fig. 2c).13 The results also show that when both electron donors for the EDA complexes are present (DBU and indole 1), the reaction proceeds primarily via the DBU-based EDA complex as indicated by 19F-NMR experiments (ESI†). Finally, the three different reaction channels could be addressed independently under the synthetically relevant conditions of full conversion (Table 1). In this way, the systematic screening of irradiation wavelengths using LED arrays could be directly translated to effect each of the three ready-to-use synthetic routes towards perfluoroalkylated indole 3.
| λ (nm) | t react (min) | DBU | Eosin Y | Reaction channel | Yieldc (%) | Regioselectivityd (%) |
|---|---|---|---|---|---|---|
| a Conditions: [1]0 = 0.0175 mol L−1, MeCN, ambient temperature, full conversion. b Due to the absorption of the polymer pane, the irradiance was only 30% of that at 521 nm. c Yield of the main regioisomer 3, calculated as [3]/[1]0. d Calculated as [3]/([3] + [4]). | ||||||
| 521 | 4.2 | ✓ | ✓ | a) Photoredox catalysis | 71 | 90 |
| 370b | 7.1 | ✓ | — | b) DBU-based EDA complex | 70 | 89 |
| 370b | 85 | — | — | c) Indole-based EDA complex | 70 | 83 |
Conclusions
This study underscores the necessity for wavelength-resolved reaction development in synthetic photochemistry, since light sources with discrete emission bands are essential to trigger discrete photochemical processes. By applying a systematic light source screening with matched irradiances, the reaction outcome can be directly attributed to the irradiated wavelength without interference from different irradiances. In particular, systems with multiple chromophores, such as by the formation of EDA complexes, should be subjected to this type of analysis, because the reactivity of a system under white light irradiation cannot necessarily be attributed exclusively to the reactivity of its photocatalyst. While the systematic screening of other reaction parameters like solvents, concentrations, reaction times, and substrates is well established in the literature, a routine screening of irradiation wavelengths and intensities is still lacking. The technological advances in LED technology, however, make this analysis affordable and applicable in most synthetic labs. We therefore believe that the presented methodology will play a significant role in photochemical synthesis in the future.Conflicts of interest
There are no conflicts to declare.References
- H. Frisch, D. E. Marschner, A. S. Goldmann and C. Barner-Kowollik, Angew. Chem., Int. Ed., 2018, 57, 2036–2045 ( Angew. Chem. , 2018 , 130 , 2054–2064 ) CrossRef CAS PubMed.
- L. Buzzetti, G. E. M. Crisenza and P. Melchiorre, Angew. Chem., Int. Ed., 2019, 58, 3730–3747 ( Angew. Chem. , 2019 , 131 , 3768–3786 ) CrossRef CAS PubMed.
- (a) I. Ghosh, R. S. Shaikh and B. König, Angew. Chem., Int. Ed., 2017, 56, 8544–8549 ( Angew. Chem. , 2017 , 129 , 8664–8669 ) CrossRef CAS PubMed; (b) M. Marchini, G. Bergamini, P. G. Cozzi, P. Ceroni and V. Balzani, Angew. Chem., Int. Ed., 2017, 56, 12820–12821 ( Angew. Chem. , 2017 , 129 , 12996–12997 ) CrossRef CAS PubMed; (c) I. Ghosh, J. I. Bardagi and B. König, Angew. Chem., Int. Ed., 2017, 56, 12822–12824 ( Angew. Chem. , 2017 , 129 , 12998–13000 ) CrossRef CAS PubMed.
- (a) I. Ghosh and B. König, Angew. Chem., Int. Ed., 2016, 55, 7676–7679 ( Angew. Chem. , 2016 , 128 , 7806–7810 ) CrossRef CAS PubMed; (b) S. Protti, D. Ravelli and M. Fagnoni, Photochem. Photobiol. Sci., 2019, 18, 2094–2101 RSC.
- (a) S. Tschierlei, M. Karnahl, M. Presselt, B. Dietzek, J. Guthmuller, L. González, M. Schmitt, S. Rau and J. Popp, Angew. Chem., Int. Ed., 2010, 49, 3981–3984 ( Angew. Chem. , 2010 , 122 , 4073–4076 ) CrossRef CAS PubMed; (b) D. E. Fast, A. Lauer, J. P. Menzel, A. M. Kelterer, G. Gescheidt and C. Barner-Kowollik, Macromolecules, 2017, 50, 1815–1823 CrossRef CAS; (c) B. T. Tuten, J. P. Menzel, K. Pahnke, J. P. Blinco and C. Barner-Kowollik, Chem. Commun., 2017, 53, 4501–4504 RSC; (d) K. C. Harper, E. G. Moschetta, S. V. Bordawekar and S. J. Wittenberger, ACS Cent. Sci., 2019, 5, 109–115 CrossRef CAS PubMed.
- (a) Y. Chen, O. de Frutos, C. Mateos, J. A. Rincon, D. Cantillo and C. O. Kappe, ChemPhotoChem, 2018, 2, 906–912 CrossRef CAS; (b) C. Rosso, J. D. Williams, G. Filippini, M. Prato and C. O. Kappe, Org. Lett., 2019, 21, 5341–5345 CrossRef CAS PubMed.
- (a) D. Cambié, F. Zhao, V. Hessel, M. G. Debije and T. Noël, Angew. Chem., Int. Ed., 2017, 56, 1050–1054 ( Angew. Chem. , 2017 , 129 , 1070–1074 ) CrossRef PubMed; (b) D. Cambié, J. Dobbelaar, P. Riente, J. Vanderspikken, C. Shen, P. H. Seeberger, K. Gilmore, M. G. Debije and T. Noël, Angew. Chem., Int. Ed., 2019 DOI:10.1002/anie.201908553.
- S. Barata-Vallejo, S. M. Bonesi and A. Postigo, Org. Biomol. Chem., 2015, 13, 11153–11183 RSC.
- N. Straathof, D. Osch, A. Schouten, X. Wang, J. Schouten, V. Hessel and T. Noël, J. Flow Chem., 2014, 4, 12–17 CrossRef CAS.
- E. Arceo, I. D. Jurberg, A. Álvarez-Fernández and P. Melchiorre, Nat. Chem., 2013, 5, 750–756 CrossRef CAS PubMed.
- Ł. Woźniak, J. J. Murphy and P. Melchiorre, J. Am. Chem. Soc., 2015, 137, 5678–5681 CrossRef PubMed.
- Y. Wang, J. Wang, G. X. Li, G. He and G. Chen, Org. Lett., 2017, 19, 1442–1445 CrossRef CAS PubMed.
- S. R. Kandukuri, A. Bahamonde, I. Chatterjee, I. D. Jurberg, E. C. Escudero-Adán and P. Melchiorre, Angew. Chem., Int. Ed., 2015, 54, 1485–1489 ( Angew. Chem. , 2015 , 127 , 1505–1509 ) CrossRef CAS PubMed.
- G. L. Gao, C. Yang and W. Xia, Chem. Commun., 2017, 53, 1041–1044 RSC.
- C. Bottecchia, R. Martín, I. Abdiaj, E. Crovini, J. Alcazar, J. Orduna, M. J. Blesa, J. R. Carrillo, P. Prieto and T. Noël, Adv. Synth. Catal., 2019, 361, 945–950 CrossRef CAS.
- C. P. Haas, T. Müllner, R. Kohns, D. Enke and U. Tallarek, React. Chem. Eng., 2017, 2, 498–511 RSC.
- (a) M. H. Shaw, J. Twilton and D. W. C. MacMillan, J. Org. Chem., 2016, 81, 6898–6926 CrossRef CAS PubMed; (b) D. Cambié, C. Bottecchia, N. J. W. Straathof, V. Hessel and T. Noël, Chem. Rev., 2016, 116, 10276–10341 CrossRef PubMed; (c) M. Sender and D. Ziegenbalg, Chem. Ing. Tech., 2017, 89, 1159–1173 CrossRef CAS; (d) A. Roibu, R. Bharadwaj Morthala, M. E. Leblebici, D. Koziej, T. Van Gerven and S. Kuhn, React. Chem. Eng., 2018, 3, 849–865 RSC.
Footnotes |
| † Electronic supplementary information (ESI) available. See DOI: 10.1039/c9re00339h |
| ‡ Both authors contributed equally to this work. |
| This journal is © The Royal Society of Chemistry 2019 |


