
 Open Access Article
 This Open Access Article is licensed under a Creative Commons Attribution-Non Commercial 3.0 Unported Licence
Characterization of co-metabolic biodegradation of methyl tert-butyl ether by a Acinetobacter sp. strain
Shanshan Li ,
Dan Wang,
Dan Du,
Keke Qian and
Wei Yan*
,
Dan Wang,
Dan Du,
Keke Qian and
Wei Yan*
Department of Environmental Science & Engineering, Xi'an Jiaotong University, Xi'an, Shaanxi 710049, China. E-mail: yanwei@xjtu.edu.cn
First published on 28th November 2019
Abstract
Co-metabolic bioremediation is a promising approach for the elimination of methyl tert-butyl ether (MTBE), which is a common pollutant found worldwide in ground water. In this paper, a bacterial strain able to co-metabolically degrade MTBE was isolated and named as Acinetobacter sp. SL3 based on 16S rRNA gene sequencing analysis. Strain SL3 could grow on n-alkanes (C5–C8) accompanied with the co-metabolic degradation of MTBE. The number of carbons present in the n-alkane substrate significantly influenced the degradation rate of MTBE and accumulation of tert-butyl alcohol (TBA), with n-octane resulting in a higher MTBE degradation rate (Vmax = 36.7 nmol min−1 mgprotein−1, Ks = 6.4 mmol L−1) and lower TBA accumulation rate. A degradation experiment in a fed-batch reactor revealed that the efficiency of MTBE degradation by Acinetobacter sp. strain SL3 did not show an obvious decrease after nine rounds of MTBE replenishment ranging from 0.1–0.5 mmol L−1. The results of this paper reveal the preferable properties of Acinetobacter sp. SL3 for the bioremediation of MTBE via co-metabolism and leads towards the development of new MTBE elimination technologies.
1. Introduction
Co-metabolism is defined as the ability of a microorganism to convert a non-growth substrate in the presence of either a growth substrate or another biodegradable substrate.1 It represents a potential alternative for the elimination of pollutants, as it separates the process of pollutant biodegradation from the growth of microorganisms, resulting in a shortened period of adaption and propagation. Co-metabolism has been confirmed to be effective in the elimination of alkanes, as well as aromatic and chlorinated compounds in natural environments, including methyl tert-butyl ether (MTBE).2–4MTBE is used as an effective gasoline oxygenate because of its favorable properties, such as low production cost, high octane rating capability, and miscibility with other gasoline components. With widespread use of MTBE and increasing reports of groundwater contamination, the development of technology to eliminate MTBE contamination has become a priority.5,6 Due to the presence of a stable ether bond and sterically hindered carbon in its molecular structure, MTBE is relatively difficult for microorganisms to assimilate.7 Currently, only a few microorganisms are known to be able to grow using MTBE as the sole carbon source, including Methylibium petroleiphilum PM1,8 Aquincola tertiaricarbonis L108,9 and Hydrogenophaga flava ENV735.10 Growth of these strains on MTBE is characterized, however, by low growth rate and biomass yield. In contrast, various microorganisms are able to oxidize MTBE in the presence of another growth substrate through co-metabolism. Various compounds present in gasoline could be used as co-metabolic growth substrates for MTBE degradation, such as normal and branched alkanes and aromatics.7,11–13 Smith et al.14 reported that Pseudomonas mendocina KR-1 is able to co-metabolically degrade MTBE with an average degradation rate of 61.1 nmol min−1 mgprotein−1 with n-alkanes (C5–C8) as carbon sources. Although MTBE was eliminated effectively, stoichiometric accumulation of tert-butyl alcohol (TBA) was observed. Two strains, Pseudomonas aeruginosa BM-B-450 and Pseudomonas citronellolis BM-B-447, with different kinetic parameters for MTBE degradation were isolated from an n-pentane-adapted consortium, suggesting the presence of cooperative degradation in the consortium.7
Though a variety of microorganisms able to degrade MTBE by co-metabolism have been discovered, our understanding of the process of co-metabolism in a pure culture remains limited.15,16 Some studies have indicated that microorganisms utilize the primary, growth-supporting substrate for cell growth, inducing an enzyme that also catalyzes the conversion of the non-growth substrate. Smith et al.17 characterized the initial reaction of the co-metabolic MTBE degradation pathway of Mycobacterium vaccae JOB5 grown on n-propone and found that the alkane hydroxylase that catalyzed the transformation of n-octane was also responsible for MTBE oxidation. Numerous studies have indicated that non-specific monooxygenase enzymes are responsible for the initial oxidation of MTBE to TBA, including cytochrome P450 monooxygenases18,19 and alkane hydroxylases.17,20 Furthermore, alkane hydroxylases and their homologs appear to be widely distributed, especially among Gram-negative organisms that use n-alkanes as growth substrates. This may help explain why alkanes are the preferred co-metabolic substrates for the degradation of MTBE.
The objective of this work was to examine the co-metabolic degradation of MTBE by a newly isolated Acinetobacter sp. strain grown on n-octane. We characterized the co-metabolism of MTBE by this strain, including the range of co-metabolic substrates, the kinetic parameters of the reaction, and the ability of the strain to provide continuous degradation of MTBE. To our knowledge, it is the first report on the co-metabolism of MTBE by a Acinetobacter sp. strain. These results provide a basis for further development of technologies to eliminate MTBE from the environment.
2. Materials and methods
2.1 Chemicals and media
All gaseous alkanes (methane, ethane, propane, n-butane) were purchased from Xi'an Standard Gas Station. MTBE (99%, ρ = 0.74 g cm−3), TBA (99%, ρ = 0.77 g cm−3), n-pentane (99%, ρ = 0.63 g cm−3), n-hexane (99%, ρ = 0.69 g cm−3), n-heptane (99%, ρ = 0.68 g cm−3) and n-octane (99%, ρ = 0.70 g cm−3) were obtained from Sinopharm Chemical Reagent Co., Ltd. (Shanghai, China).Mineral salt medium (MSM) was used for growth of microorganism and degradation of MTBE and contained the following (g L−1): 0.9 KH2PO4, 6.5 Na2HPO4·12H2O, 0.4 (NH4)2SO4, 0.2 MgSO4·7H2O, 0.01 CaCl2·2H2O, 0.001 FeSO4·7H2O. In addition, MSM contained 1 mL of trace element solution, which was composed of the following in 1 L of deionized water: 0.1 g H3BO3, 0.4 g CoCl·6H2O, 0.25 g ZnCl2, 1 g MnSO4·H2O, 0.25 g Na2MoO4·2H2O, 0.1 g NiSO4·6H2O, and 0.25 g CuCl2·2H2O. The pH value of the medium was adjusted to 7.0, and then the medium was autoclaved at 115 °C for 15 min. The carbon source n-alkanes and MTBE were then added at concentrations of 50 mg L−1 and 10 mg L−1, respectively.
2.2 Isolation of MTBE-degrading strain
A single strain that can co-metabolically degrade MTBE with n-octane as the growth substrate was isolated from mixed culture.21,22 The isolation experiment was conducted in 100 mL Erlenmeyer flasks sealed with silica gel stoppers. Microbial consortium was incubated in 20 mL MSM with n-octane as the carbon source at 30 °C and 150 rpm for 10 d. The mixed culture was then diluted and spread on solid MSM plates supplemented with n-octane and MTBE for screening single colonies. Afterwards, various single colonies were re-streaked onto MSM agar plates with n-octane until pure culture was obtained. Finally, a single strain (SL3) that grew rapidly on n-octane was selected and preserved for further analysis.2.3 Phylogenetic identification
Strain SL3 was classified by 16S rRNA sequence analysis together with rpoB (RNA polymerase subunit) sequence analysis. Genomic DNA was extracted with the Ezup Column Bacteria Genomic DNA Purification Kit (Sangon Biotech, Shanghai, China) according to the manufacturer's instructions. A partial 16S rRNA and rpoB sequence was amplified from the genomic extraction with universal primers 27F (5′-AGAGTTTGATCCTGGCTCAG-3′), 1492R (5′-GGTTACCTTGTTACGACTT-3′) and AcF (5′-GTGATAARATGGCBGGTCGT-3′), AcR (5′-CGBGCRTGCATYTTGTCRT-3′), respectively. The amplification reaction mixtures (50 μL) contained 1 μL of template, 1.5 U of Takara PrimeSTAR HS DNA Polymerase (Takara Biotech, Dalian, China), 10 μL of 5× PrimeSTAR buffer, 2 μL each of forward and reverse primers (10 μM), and 5 μL of dNTP mixture (2.5 mM). Amplifications were carried out on a T100 Thermal Cycler (Bio-Rad, Hercules, CA, USA) with the following conditions: 98 °C for 5 min; 30 cycles of 98 °C for 10 s, 55 °C for 5 s, and 72 °C for 90 s; and a final extension at 72 °C for 7 min. After purification, the PCR product was Sanger-sequenced by Sangon Biotech.The DNA sequence was used to identify homologous sequences in GenBank with BLAST. Phylogenetic analysis of the 16S rRNA and rpoB sequence was performed with MEGA 5.1 software.23 Multiple alignment with sequences from GenBank was performed using the Clustal method.24 The phylogenetic trees were constructed using the neighbor-joining method. The 16S rRNA sequence was deposited in the National Center for Biotechnology Information (NCBI) GenBank database under accession number KX639781.
2.4 Kinetic analysis
The kinetic parameters of MTBE oxidation by SL3 were determined following the MTBE degradation experiment. SL3 was incubated in LB broth first overnight at 30 °C and 150 rpm. After washing, 0.4 mL of SL3 culture was then inoculated into 20 mL of MSM in 125 mL serum bottles sealed with polytetrafluoroethylene (PTFE) stoppers. Initial cell suspension was standardized to an optical density at 600 nm (OD600) of 0.1. The carbon source (C5 or C8 substrates) at a concentration of 4.4 mM was added to the serum bottles through the PTFE stoppers with syringes in the presence or absence of MTBE (0.88 mM). After incubated at 30 °C with shaking at 150 rpm for 48 h, the cultures were harvested by centrifugation at 5000 rpm for 10 min in a Sorvall ST 40 Centrifuge (ThermoFisher Scientific, Waltham MA, USA). Following washing and sonication, one part of the supernatant was used to determine the concentration of total protein using the Folin phenol method. Bovine serum albumin (BSA) was used as a standard. The remainder of the supernatant was incubated with various initial concentrations of MTBE for 25 min before the final TBA concentration was determined by GC-MS (see below). The rate of MTBE oxidation was calculated from the final TBA concentration, assuming that the rate of oxidation of MTBE remained constant for the first 30 min and that no further oxidation of TBA occurred during this period. Kinetic constants were derived by computer-fitting the data to a single substrate-binding model, y = Vmax [x/(Ks + x)], using Origin version 6.1 (Northampton, MA, USA). All experiments were performed in triplicate.2.5 Fed-batch reactor
Fed-batch reactor was operated for MTBE degradation. Briefly, the reactors were closed with tight Teflon-coated caps. Diffusers and magnetic stirrers coated with Teflon were used to aerate and mix the content of the reactors. Air was passed via columns containing activated carbon to supply oxygen to the reactors. SL3 was first incubated in MSM supplemented with n-octane (4.4 mM) for 24 h at 30 °C and 150 rpm, and then inoculated into 2.0 L of MSM in reactor vessel with the initial OD600 value of 0.1. Subsequently MTBE and n-octane were added to the reactor with a ratio of 1![[thin space (1/6-em)]](https://www.rsc.org/images/entities/char_2009.gif) :2 (mol:mol). At timed intervals, samples were collected to determine the residual MTBE. When MTBE concentration had decreased by 90% of the initial concentration, MTBE was replenished from the stock solution. The MTBE concentrations for each dosing ranged from 0.1 to 0.5 mM. The reactors were operated under the following conditions: dissolved oxygen was controlled at 3 ± 1 mg L−1, pH was 7.0 ± 0.2, and the operating temperature was 30 ± 2 °C. The reactor without SL3 inoculation was operated as the control group. Both experimental and control groups were conducted in triplicate.
:2 (mol:mol). At timed intervals, samples were collected to determine the residual MTBE. When MTBE concentration had decreased by 90% of the initial concentration, MTBE was replenished from the stock solution. The MTBE concentrations for each dosing ranged from 0.1 to 0.5 mM. The reactors were operated under the following conditions: dissolved oxygen was controlled at 3 ± 1 mg L−1, pH was 7.0 ± 0.2, and the operating temperature was 30 ± 2 °C. The reactor without SL3 inoculation was operated as the control group. Both experimental and control groups were conducted in triplicate.
2.6 Analytical methods
MTBE and TBA concentrations were analyzed by headspace solid-phase dynamic extraction-gas chromatography-mass spectrometry (HS-SPDE-GC/MS). Liquid culture was collected and centrifuged at 6000 rpm for 10 min. Next, 2 mL of supernatant was added to a 10 mL glass vial sealed with a screw cap and silicone-polyperfluoroethylene gaskets and immediately underwent HS-SPDE analysis on a CTC CombiPAL-xt autosampler (Chromtech, Idstein, Germany) equipped with a polar, polyethylene glycol-coated WAX syringe, as described by Li et al.21 The sample absorbed on the SPDE syringe was automatically injected into a TraceGC ULTRA (ThermoFinnigan, Milano, Italy) gas chromatograph equipped with a HP-5MS capillary column (30 m length, 0.25 mm ID, 0.25 μm film) and a TraceISQ (ThermoFinnigan) mass spectrometric detector. The injection port was set in splitless mode and held at 260 °C. The oven temperature was held at 40 °C for 2 min and was then ramped to 120 °C at 5 °C min−1. The flow rate of carrier gas (helium 5.0) was 1.0 mL min−1. The interface and ion source temperatures were maintained at 280 °C and 230 °C, respectively. The mass spectrometer was operated in electron impact mode at 70 eV in selected ion monitoring (SIM) mode at 73 and 59 m/z for MTBE and TBA, respectively. MTBE and TBA were quantified using standards of known concentrations.Gas-phase samples were removed from the sealed reaction bottles through the PTFE valves with syringes and immediately injected into an Agilent 6890 gas chromatograph equipped with a thermal conductivity detector (TCD) and a TDX-01 column (2 mm × 2 m). The column was operated at 60 °C, and the injector and detector were maintained at 110 °C and 160 °C, respectively.
All computer-based statistical analyses were performed with SPSS 16.0 software for Windows (SPSS Inc., Chicago, IL, USA). One-way ANOVA was used to assess differences between treatments at a significance level of 0.01 or 0.05.
3. Results and discussion
3.1 Isolation and identification of co-metabolic MTBE-degrading strain
One of the key factors constraining the application of MTBE bioremediation is the extremely low biomass of microorganisms grown on MTBE. Co-metabolism, which offers the benefits of higher biomass yield and simultaneous elimination of at least two pollutants, represents a potential alternative for MTBE elimination. In this study, a single strain SL3 of Gram-negative and short, rod-shaped cells has been screened from mixed culture grown on n-octane in the presence of MTBE. Strain SL3 grew rapidly on solid MSM plates in the presence of n-octane and formed circular yellow colonies. Molecular identification of the isolates was performed by sequencing the 16S rRNA gene and comparing the sequences with known 16S rRNA sequences in the GenBank database (Fig. 1a). Though SL3 strain showed higher sequence identity to Acinetobacter pittii ATCC 19004 (GenBank accession number NR_117621), it could not be classified into Acinetobacter pittii species simply without any other evidence. Besides 16S rRNA sequence analysis, housekeeping genes are developed in identification of environmental isolates. Among them, the rpoB gene, encoding the β-subunit of RNA polymerase, has emerged as a core gene candidate for phylogenetic analyses allowing discrimination of closely related isolates.25,26 Therefore, we carried out further identification of SL3 strain by the rpoB gene analysis. As shown in Fig. 1b, SL3 strain displayed an exceptionally lower similarity with A. pittii. Notably, SL3 strain did not fall into the cluster of pathogenic Acinetobacter calcoaceticus-baumannii (ACB) complex, including Acinetobacter pittii, Acinetobacter baumannii, Acinetobacter seifertii and Acinetobacter nosocomialis. Furthermore, SL3 strain showed similarity with non-ACB complex species Acinetobacter calcoaceticus in rpoB gene, which indicated that SL3 may belong to non-pathogenic Acinetobacter species. It was therefore designated as Acinetobacter sp. SL3. | ||
| Fig. 1 Phylogenetic tree of Acinetobacter sp. SL3 based on 16S rRNA gene (A) and rpoB gene (B) sequences. The trees were constructed using the neighbor-joining method with 1000 bootstrap replicates. The trees were drawn to scale, with branch lengths in the same units as the evolutionary distances used to infer the phylogenetic tree. All positions containing gaps and missing data were eliminated from the dataset (complete deletion option). | ||
According to previous reports, species in the genus Acinetobacter occupy an important niche in nature, as they are ubiquitously distributed in numerous environments, including soil, sediments, aquatic environments, and contaminated sites.27,28 Moreover, Acinetobacter populations have the ability to mineralize versatile pollutants, such as various long-chain dicarboxylic acids, as well as aromatic and hydroxylated aromatic compounds.29,30 The various desirable proprieties of Acinetobacter strains make them promising alternatives to Escherichia coli (a traditional model organism) for metabolism research. One of these desirable properties is the simplicity of genetic manipulation by homology-directed recombination with linear DNA fragments.31 The broad scope of available substrates and easy accessibility of genetic transformations facilitate the use of Acinetobacter in biotechnology and bioremediation.
3.2 MTBE co-metabolism with n-alkanes as growth substrate
As the important components of refined gasoline, the detection of MTBE often accompanies with the presence of n-alkanes and polycyclic aromatic hydrocarbons (PAH) in the pollution sites. Furthermore, the co-metabolism has been established microbial degradation of MTBE in the presence of alkanes.32 Though strain SL3 was isolated from a mixed culture with n-octane as the sole carbon source, other n-alkanes and aromatics were also employed to test their ability to support its growth (Table 1). In addition to n-octane, strain SL3 grew well on C5 to C7 straight-chain liquid alkanes. In contrast, none of the tested gaseous alkanes (C1 to C4) supported growth of strain SL3. Furthermore, little or no growth was observed with tested aromatic compounds, including benzene, toluene, and xylene. Neither MTBE nor TBA could be utilized as growth substrates for Acinetobacter sp. SL3. At current, only a few single strains have been demonstrated to mineralize MTBE as the sole carbon source. Moreover, most microorganisms grow poorly on MTBE producing extremely low biomass even after long incubation times.33 Therefore, co-metabolism has been considered an potential alternative because it uncouples contaminant biodegradation from growth allowing shorter adaptation/propagation periods for biotreatment systems.32,34| Substratea | Culture turbidityb (OD600) |
|---|---|
| a Triplicate cultures of SL3 were grown for 5 days in the presence of each substrate respectively at an initial substrate concentration of 0.44 mM (the initial value of OD600 was ≤0.02).b Optical densities are reported as means (SE). | |
| n-Alkanes | |
| Methane | <0.02 |
| Ethane | <0.02 |
| Propane | <0.02 |
| n-Butane | <0.02 |
| n-Pentane | 0.215 (0.018) |
| n-Hexane | 0.266 (0.010) |
| n-Heptane | 0.243 (0.012) |
| n-Octane | 0.489 (0.022) |
|
|
| Aromatics | |
| Benzene | 0.035 (0.008) |
| Toluene | 0.043 (0.007) |
| o-Xylene | 0.054 (0.006) |
| p-Xylene | 0.038 (0.012) |
| m-Xylene | 0.042 (0.013) |
|
|
| MTBE and metabolites | |
| MTBE | <0.02 |
| TBA | <0.02 |
The potential substrates for the co-metabolism of MTBE by strain SL3 were determined (Table 2). Though SL3 grew slightly with benzene, toluene, and xylene as sole carbon sources and degraded these at low rates (7.43–9.37 nmolsubstrate min−1 mgprotein−1), no MTBE oxidation or TBA production was observed in cultures with the used BTEX. All short chain n-alkanes tested (C5–C8) were able to support the growth of Acinetobacter sp. SL3 with relatively high biomass yield (11.2–16.9 mgprotein d−1) and n-alkane degradation rates (88.32–125.71 nmolsubstrate min−1 mgprotein−1). As expected, the oxidation rate of MTBE increased from 11.06 to 17.29 nmol min−1 mgprotein−1 with increasing degradation of n-alkanes. It is interesting to observe that TBA, a stable metabolite of MTBE oxidation, was consumed and did not accumulate in the culture of strain SL3 when n-alkanes (C5–C8) are used as growth substrates. These results highlight the potential capacity of Acinetobacter sp. SL3 to degrade both MTBE and its metabolite, TBA. The n-alkane growth substrates for these organisms include n-octane and some of the other shorter-chain (C ≤ 10) n-alkanes that are abundant in gasoline, the principal source of most MTBE found in the environment. As the majority of MTBE enters the environment as part of gasoline, this range of cosubstrates raises the possibility that organisms involved in gasoline biodegradation could contribute to MTBE degradation in gasoline-impacted environments. This may help interpret in terms of why shorter-chain n-alkanes were cosubstrates for most MTBE-degrading microorganisms by co-metabolism.
| Parametersa | Aromatics | n-Alkanes | Others | ||||||
|---|---|---|---|---|---|---|---|---|---|
| Benzene | Xylene | Toluene | n-Pentane | n-Hexane | n-Heptane | n-Octane | MTBE | TBA | |
| a Triplicate cultures of each single strains were cultivated in 20 mL of MSM in 125 mL serum bottles sealed with polytetrafluoroethylene (PTFE) stoppers for 5 days in the presence of carbon substrate (4.4 mM) and MTBE (0.88 mM) (the initial value of OD600 was ≤0.02); all data are reported as means (SE).b The co-metabolic coefficient (CC) is the ratio of degraded oxygenated compound (MTBE) to the consumed n-alkane.c ND means not detect. | |||||||||
| Biomass (mgprotein d−1) | 2.3 (0.1) | 4.3 (0.4) | 3.5 (0.5) | 11.2 (1.4) | 13.6 (1.1) | 12.2 (0.7) | 16.9 (0.3) | — | — |
| Degradation rate of substrates (nmolsubstrate min−1 mgprotein−1) | 8.25 (0.17) | 7.43 (0.46) | 9.37 (1.19) | 88.98 (3.49) | 88.32 (7.04) | 103.47 (3.94) | 125.71 (3.62) | — | — |
| Degradation rate (nmolMTBE min−1 mgprotein−1) | NDc | NDc | NDc | 11.06 (1.59) | 11.40 (1.74) | 13.69 (0.97) | 17.29 (1.50) | — | — |
| CCb (mgMTBE mgsubstrate−1) | — | — | — | 0.62 (0.08) | 0.56 (0.1) | 0.74 (0.10) | 0.86 (0.07) | — | — |
| Residual TBA (μmol) | — | — | — | 0.14 (0.03) | 0.16 (0.02) | 0.17 (0.02) | 0.11 (0.01) | — | 19.8 (0.1) |
To further characterize the co-metabolism of MTBE and the its intermediate TBA, time courses of TBA production and consumption in relation to MTBE and n-octane degradation by Acinetobacter sp. SL3 were determined (Fig. 2). The addition of MTBE did not elicit any obvious negative effects on the rate of consumption of n-octane. Time courses of the consumption of n-octane and MTBE were similar in pattern. In SL3 cultures containing both n-octane and MTBE, n-octane was consumed within 60 h. Consumption of MTBE and production of TBA were detected after n-octane was added. Oxidation of MTBE did not continue past 60 h. At this time point, the accumulation of TBA as an intermediate also reached its maximum, but TBA was subsequently degraded, with complete degradation occurring at 120 h. Associated to the hydrocarbon degradation, maximum CO2 production was after 80 h. Consistent with the results descripted above, the degradation curve (Fig. 2) by strain SL3 confirmed the mineralization of TBA previously suggested. A major concern in MTBE co-metabolism is that TBA accumulation may result in an incomplete site cleanup. The accumulated TBA could inhibit the enzyme activity responsible for MTBE oxidation resulting in the decreasing degradation rate of MTBE. Furthermore, TBA presence in groundwater is also of concern and some states in the U.S. have established maximum concentration levels in water.32 Diverse n-alkane-oxidizing microbes are reported to degrade MTBE through co-metabolism, but there are few reports of strains able to degrade both MTBE and TBA. In most reported microorganisms, MTBE was converted to TBA, which could not be degraded further and would accumulate in the system.14,32 P. mendocina KR-1 grows well on toluene, n-alkanes (C5–C8), and alcohols and oxidizes MTBE to TBA in the presence of n-alkanes (C5–C8) at an average rate of 61.1 nmol min−1 mgprotein−1. However, in this system, TBA accumulates and cannot be degraded further.14 Nevertheless, an significant highlight of our study which should be noted is that complete mineralization of MTBE was attained and TBA did not accumulated after metabolism completed. In our work, high TBA degradation efficiencies by strain SL3 on the growth of C5–C8 n-alkanes were observed, which help overcome the problem of TBA accumulation during MTBE elimination. In this sense, the application of co-metabolism of MTBE by SL3 strain is apparently attractive and economical, because compounds used as growth source (n-octane) are non-expensive and available, TBA did not accumulated after metabolism completed.
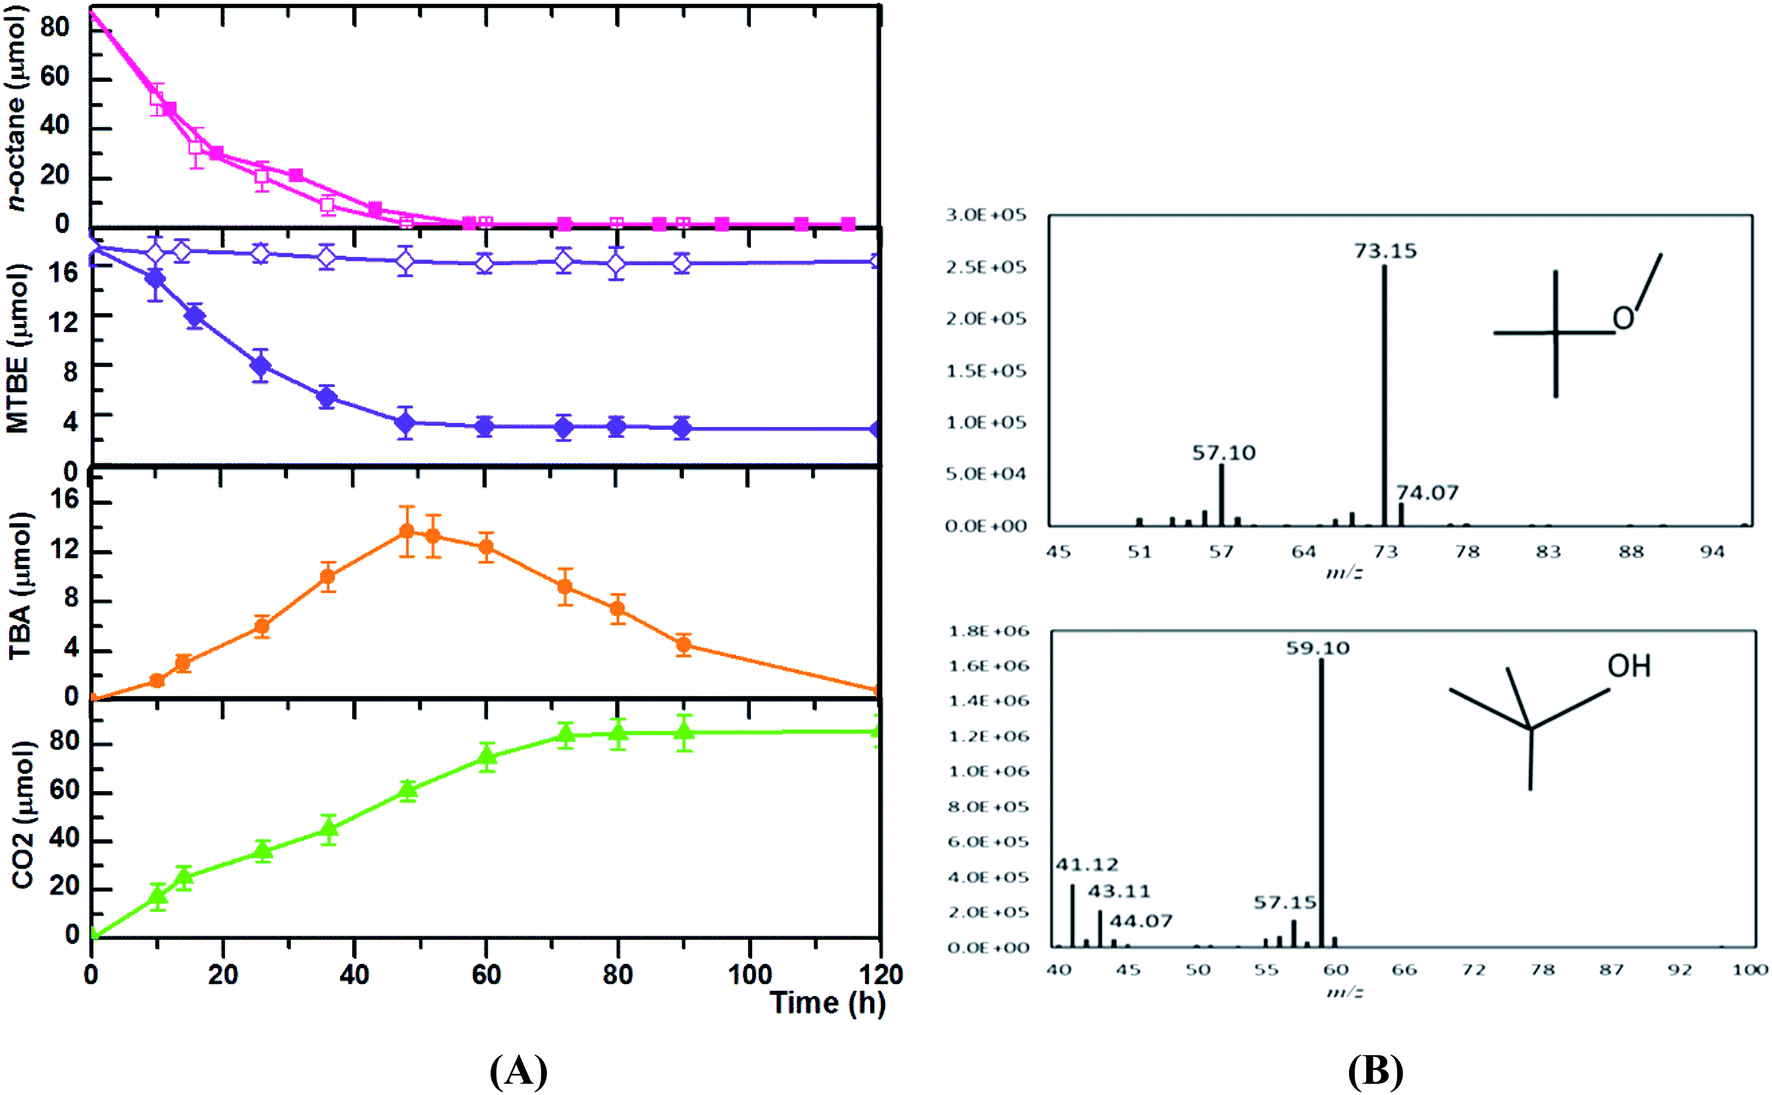 | ||
| Fig. 2 Time courses of n-octane and MTBE consumption during growth of Acinetobacter sp. SL3. Acinetobacter sp. SL3 was grown in the presence or absence of n-octane and MTBE. Time courses (A) presented include n-octane consumption and MTBE consumption for cultures grown with MTBE only (open violet diamonds), n-octane only (open pink squares), or MTBE plus n-octane (filled violet diamonds and filled pink squares, respectively). In addition, the accumulated amount of TBA (filled orange circles) generated from MTBE and CO2 production (filled green triangles) are shown for cultures grown with n-octane plus MTBE. Symbols represent averages of three replicates, with error bars indicating ranges of individual data points. The mass spectrum of MTBE and TBA detected during the process were shown (B). | ||
Like many other n-alkane-utilizing microorganisms, Acinetobacter sp. SL3 appears to initiate the oxidation of MTBE with a monooxygenase catalyst, resulting in TBA as the metabolite. Previous studies have demonstrated that aerobic co-metabolism of MTBE by microorganisms using n-alkanes as growth substrates is initiated by n-alkane monooxygenase-catalyzed reactions.35,36 The n-alkane monooxygenase inserts one oxygen atom from an oxygen molecule into the substrate and reduces the other to water.37 This is in agreement with several previous studies on the co-metabolism of MTBE with n-alkanes as growth substrates.35
3.3 Kinetic characteristics of MTBE co-metabolism by Acinetobacter sp. SL3 on n-alkanes
The co-metabolic MTBE degradation pathway of most previously studied microorganisms is initiated with the oxidation of MTBE to TBA, which is believed to be the limiting step in the mineralization of MTBE. Apparent TBA accumulation during the initial period of MTBE oxidation by cells growing on n-alkanes indicates that the kinetics of MTBE oxidation may be directly assessed by measuring the rate of accumulation of TBA (Fig. 2). Values of Ks and Vmax for MTBE oxidation were determined for pure SL3 culture grown on n-pentane and n-octane in the presence of MTBE (Fig. 3). Kinetic parameters varied when Acinetobacter sp. SL3 was grown with equivalent concentrations of MTBE and n-alkanes with different carbon numbers (C5 and C8). Ks values of 6.4 and 15.7 mmol L−1 and Vmax values of 36.7 and 17.9 nmol min−1 mgprotein−1 were determined for Acinetobacter sp. SL3 grown on n-octane and n-pentane, respectively. The differences on kinetic parameters indicated that higher MTBE affinity and degradation rate were achieved with the growth on n-octane than those on n-pentane. Indeed, the degradation efficiency of n-octane by SL3 was considerably higher than that of n-pentane (Table 2), suggesting a larger quantity or greater activity of the alkane monooxygenase induced by n-octane and resulting in a higher MTBE degradation rate. Morales et al. examined the kinetics of MTBE co-metabolism on n-alkanes (C3 and C7), and obtained the contrary results. Apparent higher MTBE degradation rate was observed with longer n-alkanes.7 | ||
| Fig. 3 Kinetics of MTBE oxidation by Acinetobacter sp. SL3 with n-pentane or n-octane as the co-metabolic substrate. Average rates of MTBE oxidation on n-octane (filled circles) or n-pentane (filled squares) are shown. All experiments were performed in triplicate. Error bars show ranges of values around the mean. | ||
Table 3 summarized the main kinetic results of co-metabolic degradation of MTBE by different pure culture on n-alkanes. Notably, higher Vmax were reported with Xanthobacter sp. (69.96 nmol min−1 mgprotein−1) and P. mendocina KR-1 (61.1 nmol min−1 mgprotein−1) respectively on the growth of propane and short chain n-alkanes (C5–C8), but the intermediate TBA accumulation was observed in both strains. Comparing with those of previously discovered microorganisms able to co-metabolically degrade MTBE on n-alkanes, the Ks value for the degradation of MTBE by strain SL3 in this study was much higher. For instance, the Ks value for MTBE degradation by Arthrobacter sp. ATCC 27778 (ref. 38) on butane is 0.024 mmol L−1 and that of P. mendocina KR-1 is 0.013 mmol L−1.14 One possible explanation for this result is that different n-alkane monooxygenases are responsible for the degradation of MTBE in different strains. To characterize the specific affinity for MTBE, as an index a°MTBE (a°MTBE = Vmax/Ks) is generally used to reflect substrate specificity. The a°MTBE value for Acinetobacter sp. SL3 on n-octane was 0.34 L gprotein −1 h−1, which is almost four times higher than the a°MTBE value on n-pentane (0.07 L gprotein −1 h−1); this difference is mainly due to the large difference between Ks values for MTBE on the different substrates. A similar a°MTBE value was obtained for P. mendocina KR-1 (0.28 L gprotein −1 h−1), which also has a relatively high Ks values.14 Though higher a°MTBE values were calculated for Rhodococcus rubber ENV425 (20.76 L gprotein −1 h−1)39 and Arthrobacter sp. ATCC 27778 (16.95 L gprotein −1 h−1),38,40 TBA accumulation accompanied the MTBE degradation process of lower rate in these systems. Pseudomonas citronellolis BM-B-447 could degrade MTBE in the presence of n-Pentane with the Vmax and Ks of 34.47 nmol min−1 mgprotein−1 and 6.21 mmol L−1 respectively,7 which was much similar with those of SL3 strain. However, the a°MTBE value for Acinetobacter sp. SL3 on n-octane was 0.34 L gprotein −1 h−1, which is more than two times of that for P. citronellolis BM-B-447 which indicated the higher specific affinity to MTBE of SL3. In summary, strain SL3 showed the obvious advantages in MTBE elimination of comparable TBA degradation capability, preferable MTBE affinity and degradation rate, which highlight its potential application in MTBE elimination process.
| Microorganism | Growth substrate | Vmax (nmol min−1 mgprotein−1) | Ks (mmol L−1) | a°MTBE (L gprotein −1 h−1) | TBA degradation | Reference |
|---|---|---|---|---|---|---|
| P. mendocina KR-1 | n-Alkanes (C5–C8) | 61.1 (average) | 0.013 | 0.28 | − | 14 |
| Pseudomonas sp. DZ13 | n-Pentane | 38.1 | 6.8 | 0.34 | + | 16 |
| Pseudomonas aeruginosa BM-B-450 | n-Pentane | 19.13 | 0.26 | 4.39 | + | 7 |
| Pseudomonas citronellolis BM-B-447 | n-Pentane | 34.47 | 6.21 | 0.15 | + | 7 |
| Arthrobacter sp. ATCC 27778 | Butane | 6.78 | 0.024 | 16.95 | − | 38 |
| Rhodococcus rubber ENV425 | n-Propane | 4.6 | 0.013 | 20.76 | − | 39 |
| Mycobacterium vaccae JOB5 | n-Propane | 13 | 1.36 | 1.08 | − | 13 |
| Xanthobacter sp. | n-Propane | 69.96 | 2.4 | 1.75 | − | 32 |
| Acinetobacter sp. SL3 | n-Octane | 36.7 | 6.4 | 0.34 | + | This study |
3.4 MTBE degradation by Acinetobacter sp. SL3 grown on n-octane in fed-batch reactor
An additional experiment was conducted to determine the MTBE degradation capability of strain SL3. Acinetobacter sp. SL3 on the growth of n-octane was cultivated in the presence of MTBE, with both MTBE being replenished at timed intervals (Fig. 4). The MTBE degradation results indicate that the SL3 culture could degrade MTBE continuously. Moreover, the degradation rate of MTBE did not decrease apparently after the ninth round of substrate replenishment. Then the apparent decrease in the MTBE degradation rate in the final round may be attributed to the production of potential toxic oxidation products from MTBE degradation. As reported by Fortin et al.,41 a mixed F-consortium was able to degrade MTBE following two rounds of replenishment in the presence of or after incubation with diethyl-ether (DiEE). MTBE was only transformed, however, after the complete degradation of the co-metabolic carbon source, indicating that MTBE biodegradation is subject to some type of inhibition in this system. Volpe et al.42 assessed a microbial consortium in a batch reactor by repeatedly feeding it with MTBE and oxygen. After several rounds of feeding and depletion, a significant decrease in the time to complete degradation of MTBE was observed which may be due to the accumulation of TBA. | ||
| Fig. 4 Co-metabolism of MTBE by Acinetobacter sp. SL3 in a fed-batch reactor. Acinetobacter sp. SL3 was grown in the presence of MTBE and n-octane. When MTBE concentration had decreased by 90% of the initial concentration, MTBE was replenished ranging from 0.1 to 0.5 mM. Data are presented as means of three replicate experiments, with error bars showing the standard error. Data points represent the residual concentrations of MTBE. | ||
In most cases, MTBE degradation rates in a fixed system would decrease with time which could be attributed to the accumulation of TBA. In order to minimize the inhibition effect of TBA, Liu et al. centrifuged and resuspended Arthrobacter sp. ATCC 27778 (ref. 38) in fresh medium before each additional dosing of MTBE. Finally, the MTBE remediation rate of ATCC 27778 did not decrease obviously after six time of dosing. This process prevented excessive accumulation of TBA in the culture medium effectively, but increase the labor and cost absolutely. In the fed-batch reactor of this study, MTBE degradation rate of SL3 did not show apparent decline after nine time of replenishment. This maybe contribute to the degradation capability of both MTBE and TBA by SL3. This result has implications for the decontamination of MTBE-contaminated sites, as it suggests that metabolism of both MTBE and its intermediate TBA will occur in the presence of n-octane.
3.5 Potential MTBE degradation pathway by Acinetobacter sp. SL3 grown on n-octane
In the co-metabolism of MTBE, the initial attack of the MTBE molecule is performed by a monooxygenase, especially n-alkane monooxygenase. Alkane monooxygenase and their close homologs appear to be widely distributed, especially among Gram-negative organisms that utilize shorter chain (C5 to C10) n-alkanes as growth substrates.43,44 In our study, several observations suggest that the enzyme responsible for the first reaction in the proposed sequence, the oxidation of MTBE, is the n-alkane monooxygenase that initiates n-octane oxidation by n-octane-grown cells of Acinetobacter sp. SL3. First, the differences in MTBE-oxidizing activity in propane-grown cells and cells grown on other substrates. If, as we suggest, the co-metabolism of MTBE is catalyzed by n-alkane monooxygenase, MTBE should not be converted in the absence of n-alkane monooxygenase. It means that MTBE degradation could not occur on the growth of the substrate which cannot induce the expression of n-alkane monooxygenase. This is the behavior that we observed in this study for aromatics-grown cells (Table 2). Second, the immediate MTBE-oxidizing activity observed with n-octane-grown cells. In a co-metabolic process the transformation of a non-growth substrate is often catalyzed by the enzyme that catalyzed the growth substrate degradation. It therefore follows that transformation of a non-growth substrate should commence immediately at the time that the cells are challenged with that substrate. In our study, the degradation of MTBE began immediately in the presence of n-alkane (Fig. 2). Our aforementioned results are fully compatible with the expected suggestion that the transformation of MTBE is catalyzed by n-alkane monooxygenase.Notably, our results suggest that the first stable MTBE-degrading intermediate TBA is also further oxidized by the same n-alkane monooxygenase responsible for both MTBE and n-octane oxidation. Our evidence for the role of this enzyme in this reaction is that oxidation of MTBE TBA subsequently commence after MTBE has been eliminated completely (Fig. 2). One potential explanation of the observation should be that the affinity of MTBE with n-alkane monooxygenase is higher than TBA. Several previous studies have also recognized this possibility.35,45 M. vaccae JOB5 could oxidize MTBE and TBA with the same n-alkane monooxygenase on the growth of propane.35 For comparing MTBE and TBA as substrates for n-alkane monooxygenase in JOB5, MTBE (Vmax/Ks = 1.79 × 10⁻⁵) can be seen to be a better overall substrate than TBA (Vmax/Ks = 8.8 × 10⁻⁶). This difference may help rationalize why MTBE appears to be preferentially oxidized over TBA. After MTBE is degraded via the degradation intermediates TBF, TBA, HIBA catalyzed by the same n-alkane monooxygenase, HIBA could be further degraded to pyruvic acid through a series of metabolic pathways as various publication reported, which will be completed degraded to CO2 via tricarboxylic acid cycle. The proposed MTBE co-metabolic pathway by SL3 strain is shown in Fig. 5.
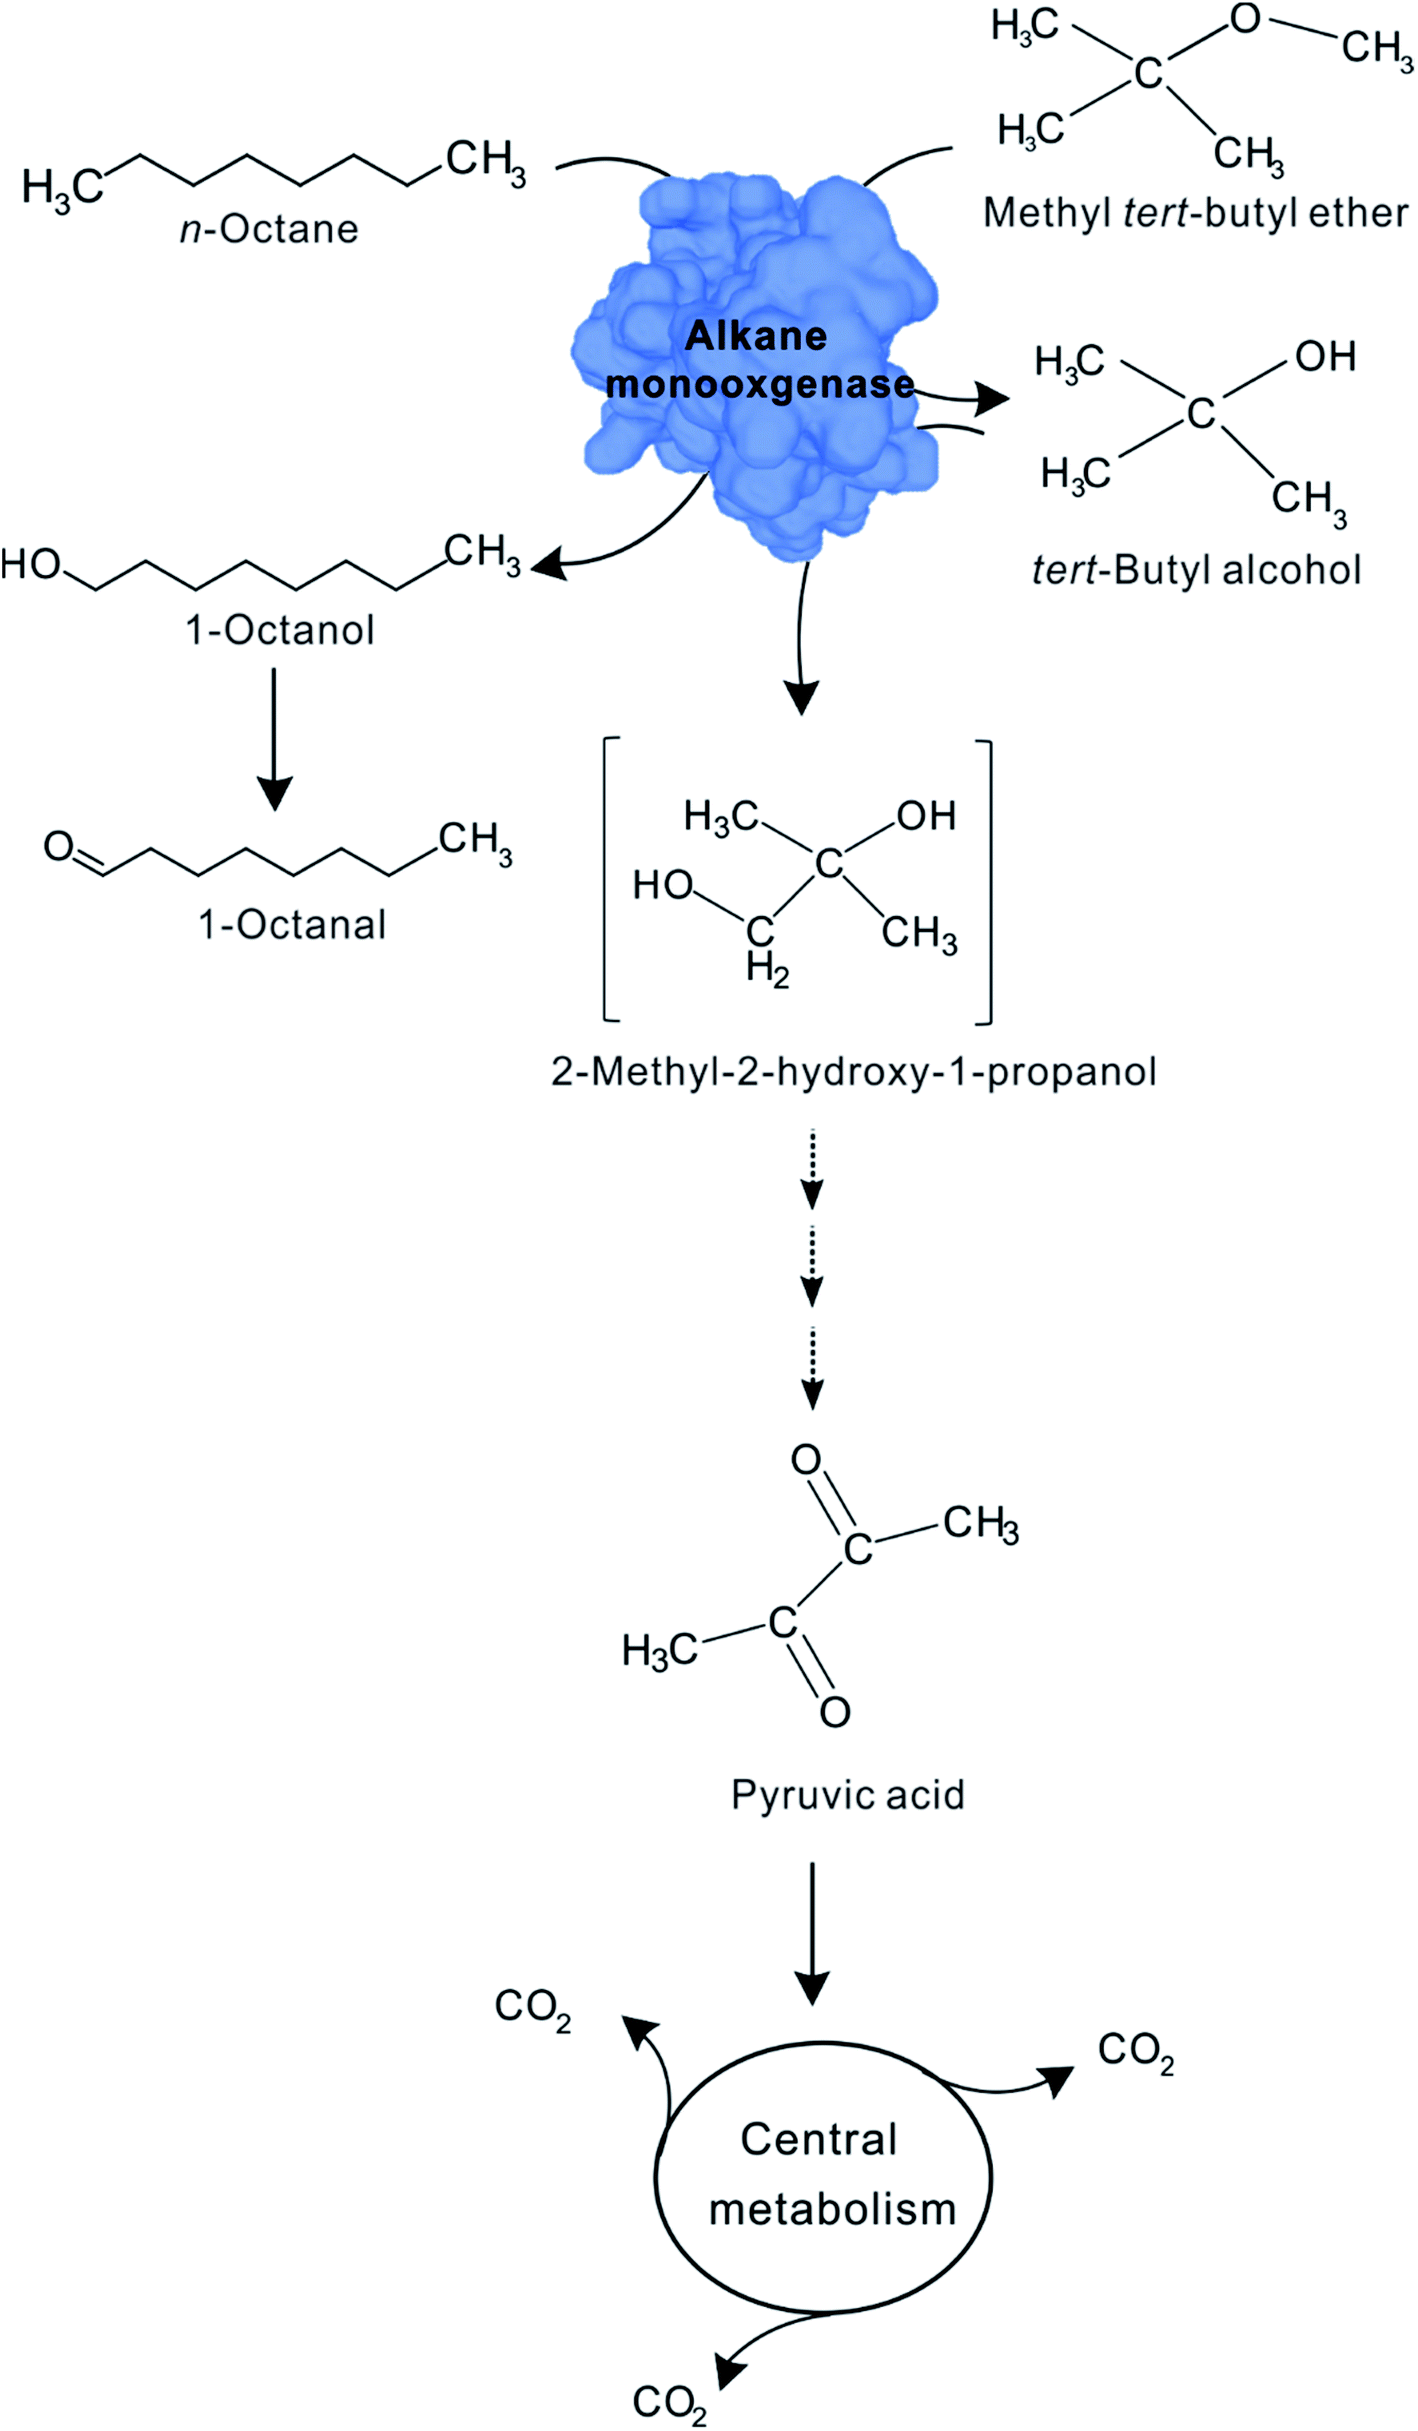 | ||
| Fig. 5 Proposed pathway for the co-metabolism of MTBE by n-octane-grown cells of Acinetobacter sp. SL3. | ||
Acinetobacter as common indigenous microorganisms have been reported the occurrence in heavy metal contaminated wastewater and its role in the reduction of hexavalent chromium,46 and in degradation of crude oil and alkanes, permethrin,47 benzene homologues48 and pharmaceutical compounds.49 The extraordinary competence of Acinetobacter baylyi strain ADP1 for natural transformation and its genetic and physiological properties made this strain as a model organism for metabolic.50 Acinetobacter pittii, formerly known as Acinetobacter genomospecies 3, is an aerobic Gram-negative bacillus that can be found in various settings, including soil, foods, sewage, and animals, as well as on human skin and flora.51,52 As a nosocomial opportunistic pathogen which mainly invades patients with immunosuppression and serious diseases, A. pittii is commonly considered less virulent than Acinetobacter baumannii within the Acinetobacter calcoaceticus-baumannii complex.53
Based on the results above, bioaugmentation of MTBE-contaminated environment with strain SL3 significantly improved the removal rate of MTBE from the contaminated water. However, this bioremediation application may increase their occurrence in the environment which resulting in the potential environmental risk concerns. The SL3 strain used in this study belong to Acinetobacter genus, which constitutes a heterogeneous group of bacteria widespread in various settings, including soil, foods, sewage, and animals, and known for its broad metabolic potential. Acinetobacter has been in the focus of many studies addressing fundamental biological questions as well as its virulence potential. The strains from Acinetobacter genus could degrade various kinds of pollutants, including furthermore, SL3 was indigenous microorganisms isolated from the MTBE-contaminated environment without recombinant modification. Based of all, though the bioaugmentation by strain SL3 will potentially increase its presence in natural environment, this increasing of indigenous wild SL3 strain may cause little effect on the microbial community.
4. Conclusions
MTBE is one of the most common contaminants in gasoline-polluted soil or groundwater and is often accompanied by other gasoline components, such as alkanes. Alkanes have been shown to act as growth substrates for microorganisms capable of co-metabolically degrading MTBE. It is necessary therefore to investigate the development of methods to efficiently eliminate MTBE contamination from the environment.The results of this study indicate that a single strain of Acinetobacter sp. SL3, possesses the ability to degrade MTBE co-metabolically when grown on n-alkane (C5–C8) substrates. The MTBE degradation rate of SL3 varied according to the carbon number of the n-alkane growth substrate. Acinetobacter sp. SL3 is able to co-metabolically degrade MTBE and its intermediate TBA continuously, with no obvious reduction in degradation rate after nine rounds of n-octane replenishment. The results of this paper reveal the useful properties of Acinetobacter sp. SL3 for the bioremediation of MTBE via co-metabolism and provide a reference for the development of new MTBE elimination technologies.
Funding
This work was supported by National Natural Science Foundation of China (Grant number 31670512), and Natural Science Basic Research Plan in Shaanxi Province of China (Grant number 2018JM3039).Conflicts of interest
The authors declare that they have no conflict of interest.References
- N. H. Tran, T. Urase, H. H. Ngo, J. Y. Hu and S. L. Ong, Bioresour. Technol., 2013, 146, 721 CrossRef CAS PubMed.
- E. Fernando, T. Keshavarz and G. Kyazze, Int. Biodeterior. Biodegrad., 2012, 72, 1 CrossRef CAS.
- Z. Khan, K. Jain, A. Soni and D. Madamwar, Int. Biodeterior. Biodegrad., 2014, 94, 167 CrossRef CAS.
- G. Baggi, S. Bernasconi, M. Zangrossi, L. Cavalca and V. Andreoni, Int. Biodeterior. Biodegrad., 2008, 62, 57 CrossRef CAS.
- R. Johnson, J. Pankow, D. Bender, C. Price and J. Zogorski, Environ. Sci. Technol., 2000, 34, 210A CrossRef CAS PubMed.
- I. M. Guisado, J. Purswani, J. Gonzalez-Lopez and C. Pozo, Int. Biodeterior. Biodegrad., 2014, 97, 67 CrossRef.
- M. Morales, V. Nava, E. Velasquez, E. Razo-Flores and S. Revah, Biodegradation, 2009, 20, 271 CrossRef CAS PubMed.
- S. R. Kane, A. Y. Chakicherla, P. S. Chain, R. Schmidt, M. W. Shin, T. C. Legler, K. M. Scow, F. W. Larimer, S. M. Lucas, P. M. Richardson and K. R. Hristova, J. Bacteriol., 2007, 189, 1931 CrossRef CAS PubMed.
- M. Rosell, D. Barcelo, T. Rohwerder, U. Breuer, M. Gehre and H. H. Richnow, Environ. Sci. Technol., 2007, 41, 2036 CrossRef CAS PubMed.
- S. H. Streger, S. Vainberg, H. Dong and P. B. Hatzinger, Appl. Environ. Microbiol., 2002, 68, 5571 CrossRef CAS PubMed.
- M. Salazar, M. Morales and S. Revah, J. Environ. Sci. Health, Part A: Toxic/Hazard. Subst. Environ. Eng., 2012, 47, 1017 CrossRef CAS PubMed.
- R. J. Steffan, S. Vainberg, C. W. Condee, K. McClay and P. B. Hatzinger, Biotreatment of MTBE with a new bacterial isolate, Battelle press, Columbus, Ohio, USA, 2000 Search PubMed.
- A. J. House and M. R. Hyman, Biodegradation, 2010, 21, 525 CrossRef CAS PubMed.
- C. A. Smith, K. T. O'Reilly and M. R. Hyman, Appl. Environ. Microbiol., 2003, 69, 7385 CrossRef CAS PubMed.
- C. W. Lin and C. Y. Lin, Int. Biodeterior. Biodegrad., 2007, 59, 97 CrossRef CAS.
- S. S. Li, S. Wang and W. Yan, Int. J. Environ. Res. Public Health, 2016, 13 CAS.
- C. A. Smith and M. R. Hyman, Appl. Environ. Microbiol., 2004, 70, 4544 CrossRef CAS PubMed.
- C. Malandain, F. Fayolle-Guichard and T. M. Vogel, FEMS Microbiol. Ecol., 2010, 72, 289 CrossRef CAS PubMed.
- S. Chauvaux, F. Chevalier, C. Le Dantec, F. Fayolle, I. Miras, F. Kunst and P. Beguin, J. Bacteriol., 2001, 183, 6551 CrossRef CAS PubMed.
- E. L. Johnson and M. R. Hyman, Appl. Environ. Microbiol., 2006, 72, 950 CrossRef CAS PubMed.
- S. Li, D. Li and W. Yan, Environ. Sci. Pollut. Res. Int., 2015, 22, 10196 CrossRef CAS PubMed.
- S. Li, K. Qian, S. Wang, K. Liang and W. Yan, Int. J. Environ. Res. Public Health, 2017, 14 CAS.
- S. Kumar, M. Nei, J. Dudley and K. Tamura, Briefings Bioinf., 2008, 9, 299 CrossRef CAS PubMed.
- M. A. Larkin, G. Blackshields, N. P. Brown, R. Chenna, P. A. McGettigan, H. McWilliam, F. Valentin, I. M. Wallace, A. Wilm, R. Lopez, J. D. Thompson, T. J. Gibson and D. G. Higgins, Bioinformatics, 2007, 23, 2947 CrossRef CAS PubMed.
- T. Adekambi, M. Drancourt and D. Raoult, Trends Microbiol., 2009, 17, 37 CrossRef CAS PubMed.
- X. Wang, J. Li, X. Cao, W. Wang and Y. Luo, Antonie van Leeuwenhoek, 2019 DOI:10.1007/s10482-019-01312-5.
- J. E. Kostka, O. Prakash, W. A. Overholt, S. J. Green, G. Freyer, A. Canion, J. Delgardio, N. Norton, T. C. Hazen and M. Huettel, Appl. Environ. Microbiol., 2011, 77, 7962 CrossRef CAS PubMed.
- M. Mahjoubi, A. Jaouani, A. Guesmi, S. Ben Amor, A. Jouini, H. Cherif, A. Najjari, A. Boudabous, N. Koubaa and A. Cherif, New Biotechnol., 2013, 30, 723 CrossRef CAS PubMed.
- V. de Berardinis, M. Durot, J. Weissenbach and M. Salanoubat, Curr. Opin. Microbiol., 2009, 12, 568 CrossRef PubMed.
- J. Jung and W. Park, Appl. Microbiol. Biotechnol., 2015, 99, 2533 CrossRef CAS PubMed.
- J. de Vries and W. Wackernagel, Proc. Natl. Acad. Sci. U. S. A., 2002, 99, 2094 CrossRef CAS PubMed.
- V. Nava, M. Morales and S. Revah, Rev. Environ. Sci. Bio/Technol., 2007, 6, 339 CrossRef CAS.
- A. Francois, L. Garnier, H. Mathis, F. Fayolle and F. Monot, Appl. Microbiol. Biotechnol., 2003, 62, 256 CrossRef CAS PubMed.
- W. T. Stringfellow and K. C. Oh, J. Environ. Eng., 2002, 128, 852 CrossRef CAS.
- C. A. Smith, K. T. O'Reilly and M. R. Hyman, Appl. Environ. Microbiol., 2003, 69, 796 CrossRef CAS PubMed.
- N. Lopes Ferreira, C. Malandain and F. Fayolle-Guichard, Appl. Microbiol. Biotechnol., 2006, 72, 252 CrossRef CAS PubMed.
- M. Morales, E. Velazquez, J. Jan, S. Revah, U. Gonzalez and E. Razo-Flores, Biotechnol. Lett., 2004, 26, 269 CrossRef CAS PubMed.
- C. Y. Liu, G. E. Speitel and G. Georgiou, Appl. Environ. Microbiol., 2001, 67, 2197 CrossRef CAS PubMed.
- P. R. Tupa and H. Masuda, J. Mol. Microbiol. Biotechnol., 2018, 28, 107 CrossRef CAS PubMed.
- V. Nava, M. Morales and S. Revah, Rev. Environ. Sci. Biotechnol., 2007, 6, 339 CrossRef CAS.
- N. Y. Fortin, M. Morales, Y. Nakagawa, D. D. Focht and M. A. Deshusses, Environ. Microbiol., 2001, 3, 407 CrossRef CAS PubMed.
- A. Volpe, G. Del Moro, S. Rossetti, V. Tandoi and A. Lopez, Chemosphere, 2009, 75, 149 CrossRef CAS PubMed.
- M. M. Mitani, A. A. Keller, C. A. Bunton, R. G. Rinker and O. C. Sandall, J. Hazard. Mater., 2002, 89, 197 CrossRef CAS PubMed.
- J. L. Acero, S. B. Haderlein, T. C. Schmidt, M. J. Suter and U. von Gunten, Environ. Sci. Technol., 2001, 35, 4252 CrossRef CAS PubMed.
- C. Y. Liu, G. E. Speitel Jr and G. Georgiou, Appl. Environ. Microbiol., 2001, 67, 2197 CrossRef CAS PubMed.
- Z. A. Zakaria, Z. Zakaria, S. Surif and W. A. Ahmad, J. Hazard. Mater., 2007, 146, 30 CrossRef CAS PubMed.
- H. Zhan, H. Wang, L. Liao, Y. Feng, X. Fan, L. Zhang and S. Chen, Front. Microbiol., 2018, 9, 98 CrossRef PubMed.
- P. Singh, V. K. Singh, R. Singh, A. Borthakur, A. Kumar, D. Tiwary and P. K. Mishra, Energy Ecology & Environment, 2018, vol. 1 Search PubMed.
- S. Wang, Y. Hu and J. Wang, J. Environ. Manage., 2018, 217, 240 CrossRef CAS PubMed.
- D. M. Young, D. Parke and L. N. Ornston, Annu. Rev. Microbiol., 2005, 59, 519 CrossRef CAS PubMed.
- E. T. Houang, Y. W. Chu, C. M. Leung, K. Y. Chu, J. Berlau, K. C. Ng and A. F. Cheng, J. Clin. Microbiol., 2001, 39, 228 CrossRef CAS PubMed.
- R. Larcher, A. Pantel, E. Arnaud, A. Sotto and J. P. Lavigne, BMC Infect. Dis., 2017, 17, 477 CrossRef PubMed.
- Y. Lee and S. Jang, Microbiol Resour Ann, 2016, 4, e01028-16 Search PubMed.
| This journal is © The Royal Society of Chemistry 2019 |