 Open Access Article
Formation of sulfur trioxide during the SCR of NO with NH3 over a V2O5/TiO2 catalyst
Jin Xiong ab,
Yuran Li*a,
Yuting Lina and
Tingyu Zhu*ac
aBeijing Engineering Research Center of Process Pollution Control, National Engineering Laboratory for Hydrometallurgical Cleaner Production Technology, Institute of Process Engineering, Chinese Academy of Sciences, Beijing 100190, China. E-mail: yrli@ipe.ac.cn; tyzhu@ipe.ac.cn
bUniversity of Chinese Academy of Sciences, Beijing 100049, China
cCenter for Excellence in Regional Atmospheric Environment, Institute of Urban Environment, Chinese Academy of Sciences, Xiamen 361021, China
First published on 27th November 2019
Abstract
The oxidation of sulfur dioxide (SO2) to sulfur trioxide (SO3) is an undesirable reaction that occurs during the selective catalytic reduction (SCR) of nitrogen oxides (NOx) with ammonia (NH3), which is a process applied to purify flue gas from coal-fired power plants. The objectives of this work were to establish the fundamental kinetics of SO3 formation over a V2O5/TiO2 catalyst and to illustrate the formation mechanism of SO3 in the presence of NOx, H2O and NH3. A fixed-bed reactor was combined with a Fourier transform infrared (FTIR) spectrometer and a Pentol SO3 analyser to test the outlet concentrations of the multiple components. The results showed that the rate of SO2 oxidation was zero-order in O2, 0.77-order in SO2 and -0.19-order in SO3 and that the apparent activation energy for SO2 oxidation was 74.3 kJ mol−1 over the range of studied conditions. Based on in situ diffuse reflectance infrared Fourier transform (in situ DRIFT) spectroscopy, X-ray photoelectron spectroscopy (XPS) and temperature programmed desorption (TPD) tests, the SO3 formation process is described here in detail. The adsorbed SO2 was oxidized by V2O5 to produce adsorbed SO3 in the form of bridge tridentate sulfate, and the adsorbed SO3 was desorbed to the gas phase. NOx promoted the oxidation of the adsorbed SO2 due to the promotion of the conversion of low-valent vanadium to high-valent vanadium. In addition, the desorption of the adsorbed SO3 was inhibited by H2O or NH3 due to the conversion of tridentate sulfate to the more stable bidentate sulfate or ammonium bisulfate. Finally, the mechanism of the influence of NOx, H2O and NH3 on the formation of gaseous SO3 was proposed.
1. Introduction
As the use of equipment for the selective catalytic reduction (SCR) of NOx has increased in recent years, the emission of SO3 in coal-fired power plants has attracted more attention.1–3 SO3 increases the acid dew point of flue gas, and sulfuric acid forms when the flue gas is cooled, which corrodes the downstream equipment and pipelines.4,5 When the SO3 concentration in flue gas is more than 5 ppm (18 mg m−3), an opaque plume is generated, and a “blue acid plume” appears in the downwind direction of the chimney.6–9 To solve the problem of SO3 pollution, strict emission standards have been established.6 In the United States, 22 states have proposed SO3 emission limits for coal-fired flue gas, of which 14 states have a limit of 6 mg m−3. The SO3 emission limits in Singapore are 10 mg m−3 for flue gas from stationary sources. The daily SO2 and SO3 emission limits in Germany are 50 mg m−3. In China, regulations have been issued for “eliminating the white smoke” from industrial flue gas, aiming to expose the “blue” and “yellow” smoke from SO3 and NO2, respectively, to achieve deep purification of the smoke.10,11 Therefore, research on the SO3 formation process is very important and urgent.There has been much discussion about the process of SO2 oxidation to SO3 on a V2O5/TiO2 catalyst. Dunn J. P.12–15 studied the oxidation ability of several binary catalysts for SO2 and found that the oxidation ability of V2O5 is greater than that of other transition metal oxides. In addition, the oxidation mechanism of SO2 on a V2O5/TiO2 catalyst has been proposed. SO2 may adsorb and coordinate onto the vanadium–oxygen–support (V–O–M) bond, resulting in the (V5+)·SO2-ads state. This process is followed by the cleavage of the V5+–O–SO2 and formation of gaseous SO3, which represents the rate determining step. The preferential adsorption of SO3 results in stronger bonding of SO3 to the surface vanadium species and competitive adsorption of SO2 on the active sites. In contrast, Guo X. et al. studied the sulfate species on a V2O5/TiO2 catalyst and concluded that sulfate species are formed on titanium instead of vanadium.16
H2O and NH3 in the atmosphere can inhibit the oxidation of SO2 to SO3, while NOx has a promotive influence.7,17–22 However, the mechanisms of these effects have not been described in detail. Kinetics research is of great significance for revealing the reaction mechanism, evaluating the influence of various factors and guiding appropriate process design. However, kinetic research on the oxidation process of SO2 is limited. Therefore, it is necessary to simulate the process and influencing factors of SO2 oxidation over the V2O5/TiO2 catalyst. In this work, the effects of O2 and SO2 on SO3 formation were studied, and the reaction order with respect to the reactants and the apparent activation energy during SO2 oxidation were calculated to establish the basic kinetics of SO2 oxidation on a V2O5/TiO2 catalyst. Then, a proposed formation mechanism of SO3 in a complex atmosphere was obtained by studying the effects of H2O, NOx and NH3 on the SO3 formation process.
2. Experimental
2.1. Catalyst preparation and characterization
The 5 wt% V2O5/TiO2 catalysts were prepared by the wet impregnation method. Commercial P25 TiO2 was calcined at 450 °C for 4 h. NH4VO3, the precursor for V2O5, was dissolved in distilled water at 80 °C; P25 TiO2 was added into the NH4VO3 solution, and then the solution was stirred for 1 h and subsequently dried by a rotary evaporator. The obtained powder was calcined in air at 450 °C for 4 h and pulverized to a size of 180–250 μm.The pore properties of the P25-TiO2 and V2O5/TiO2 catalysts were determined at 77 K through N2 adsorption (NOVA3200e, Quantachrome, USA). The Brunauer–Emmett–Teller (BET) surface area (SBET) and the average pore diameter (d) were calculated by the BET method and Horvath–Kawazoe equation method, respectively. The total pore volume (Vt) was calculated directly. The results are shown in Table 1. The carrier and catalyst both displayed a mesoporous structure.
| Sample | SBET (m2 g−1) | Vt (ml g−1) | d (nm) |
|---|---|---|---|
| P25-TiO2 | 55 | 0.262 | 19.14 |
| V2O5/TiO2 | 50 | 0.258 | 20.96 |
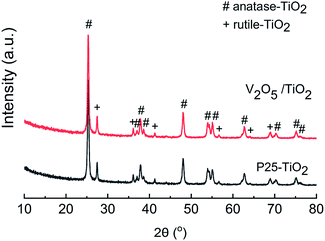
Powder X-ray diffraction (XRD, Empyrean, PANalytical B.V., Netherlands) patterns were recorded on a diffractometer (Rigaku D/Max-RA) at 40 kV and 150 mA employing Cu Kα radiation, and the results are shown in Fig. 1. The XRD patterns of the catalyst exhibited a mixed phase of anatase (PDF #21-1272) and rutile (PDF #21-1276) TiO2. The diffraction peaks of V2O5 (PDF #41-1426) at 15.4°, 20.4°, 21.7°, 26.2° and 31.0° were not observed, indicating that the V2O5 was well distributed on the carrier, with no agglomerated microcrystals for the V2O5/TiO2 catalyst.
X-ray photoelectron spectroscopy (XPS) was used to characterize the vanadium on the catalyst surface using a hemispherical energy analyser (ESCALAB 250Xi, Thermo Fisher, USA). The main C 1s peak at 284.6 eV was used as an internal standard to calibrate the binding energies. The areas of the main peaks for V 2p3/2 were detected, and the Gaussian–Lorentzian deconvolution method was utilized to calculate the vanadium contents of the various valences.
In situ diffuse reflectance infrared Fourier transform (in situ DRIFT) spectra were collected on a Fourier transform infrared (FTIR) spectrometer (Tensor 27, Bruker, Germany) to investigate the oxidation of SO2. The spectra were obtained by averaging 16 scans with a resolution of 2 cm−1.
2.2. Activity measurement
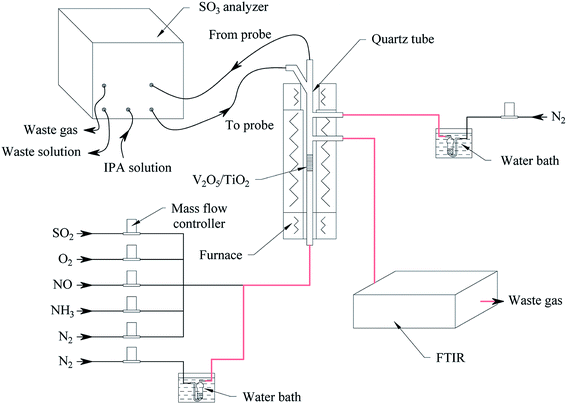
The oxidation reactions of SO2 to generate SO3 were investigated in a quartz reactor with both an on-line FTIR spectrometer (Tensor 27, Bruker, Germany) capable of quantifying SO2 with an error of 1% and an on-line SO3 analyser (Pentol GmbH, Germany) capable of quantifying SO3 with an error of 10%,23 as shown in Fig. 2. The gas flow rate for the standard state was 300 ml min−1 with an error of 1%. The gaseous hourly space velocity (GHSV) was approximately 19![[thin space (1/6-em)]](https://www.rsc.org/images/entities/char_2009.gif) 000 h−1.
000 h−1.
The default reaction conditions for the SO2 oxidation included 320 °C, 1000 ppm SO2, 6 vol% O2, and N2 balance. When appropriate, 500 ppm NOx (NO accounted for approximately 90%, and the remainder was NO2), 500 ppm NH3, or 5 vol% H2O was introduced to the mixture gas. The reaction temperature ranged from 180 °C to 400 °C with an error of 0.1 °C. The SO2 concentration varied between 500 and 1500 ppm, and the O2 concentration ranged from 0.1 vol% to 10 vol%. In various sections of this work, the different components of the mixture gas were evaluated and are shown in Table 2.
| Section | Components of the mixture gas |
|---|---|
| 3.1, 3.2 | SO2, O2 and N2 |
| 3.3, 3.4 | SO2, O2 and N2; NOx, NH3 or H2O (if used) |
| 3.5 | SO2 and N2; O2, NOx, NH3 or H2O (if used) |
Water vapor was prepared according to the saturation method (ISO 6145-9: 2009, IDT). As shown in orange in Fig. 2, the pipelines through which the water vapor flowed were insulated and maintained at 80–90 °C. Note that the NH3 had a significant impact on the measurement of SO3, so the NH3 was turned off after a relatively short time, before it penetrated the catalyst, to reduce its influence on SO3 detection. Assuming standard operating conditions, the SO2 and O2 gas diffusivities were calculated, and then the effectiveness factors were calculated to be 0.99–1.00 for the catalyst particle sizes tested from 150 to 550 μm, indicating that internal diffusion could be neglected. When the gas speed in a vacant tube is above 9.6 cm s−1, the impact of external diffusion on the SO2 conversion can be ignored. In this work, a catalyst particle size of 180–250 μm was selected, and the gas speed in the vacant tube was maintained at 10.6 cm s−1; thus, the effects of internal diffusion and external diffusion were eliminated.
For the temperature-programmed desorption (TPD) experiments, the V2O5/TiO2 catalyst was first processed in a 1000 ppm SO2 and 6 vol% O2 atmosphere at 320 °C for 180 min and then processed in a N2, 5 vol% H2O or 500 ppm NH3 atmosphere, respectively, for 20 min. Finally, the TPD tests were carried out in N2 with a heating rate of 5 °C min−1 until the temperature reached 800 °C.
3. Results and discussion
3.1. Reaction order and apparent activation energy
To determine the reaction order of SO2 oxidation to SO3 at various temperatures, the effect of the O2 and SO2 concentrations on SO3 generation was evaluated, as shown in Fig. 3. In Fig. 3(a), even when the O2 concentration was zero, some SO3 was produced at various temperatures, indicating that the oxygen atom in V2O5 participated in the oxidation of SO2. This result was consistent with the Mars-van-Krevelen (M–K) mechanism, in which the first step involves reduction of the oxygen vacancy produced by the reactants and catalysts and the second step involves replacement of the oxygen vacancies with oxygen adsorbed by dissociation.24 With increasing O2 concentration, the SO3 concentration continued to increase, but the growth rate slowed until the O2 concentration reached 1%. Thus, the reaction order was approximately zero when the O2 concentration was more than 1%. Although the oxidation of SO2 is an exothermic reaction, the increase in temperature was conducive to the formation of SO3 because the reaction was far from the equilibrium. As shown in Fig. 3(b), as the SO2 concentration increased from 500 ppm to 1500 ppm, the SO3 concentration increased from 7.9 ppm to 9.0 ppm at 280 °C and from 68.0 ppm to 127.4 ppm at 400 °C. The SO2 conversion quantity increased linearly with the SO2 concentration, and the higher the temperature was, the greater the slope of the curve was.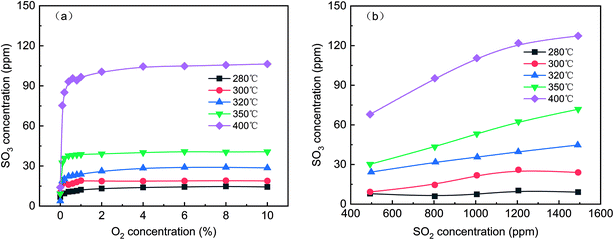 | ||
| Fig. 3 Effect of the O2 (a) and SO2 (b) concentrations on SO3 generation (default conditions: 1000 ppm SO2, 6 vol% O2, and N2). | ||
The chemical equation for SO2 oxidation is shown in eqn (1). The generalized reaction rate equation is shown in eqn (2), and the linearized form is shown in eqn (3). The oxidation rate of SO2 was low in this experiment, so the following assumptions were made: (1) rSO2 = [SO3]/τ, and the residence time (τ) is a constant; and (2) [SO2] and [SO3] are the averages of their import and export concentrations. The reaction order in O2 was approximately zero. Thus, eqn (3) can be further simplified to eqn (4).
| 2SO2 + O2 ↔ 2SO3 | (1) |
| rSO2 = k[SO2]a[SO3]b[O2]c | (2) |
ln![[thin space (1/6-em)]](https://www.rsc.org/images/entities/char_2009.gif) rSO2 = ln rSO2 = ln![[thin space (1/6-em)]](https://www.rsc.org/images/entities/char_2009.gif) k + a k + a![[thin space (1/6-em)]](https://www.rsc.org/images/entities/char_2009.gif) ln[SO2] + b ln[SO2] + b![[thin space (1/6-em)]](https://www.rsc.org/images/entities/char_2009.gif) ln[SO3] + c ln[SO3] + c![[thin space (1/6-em)]](https://www.rsc.org/images/entities/char_2009.gif) ln[O2] ln[O2]
| (3) |
 | (4) |
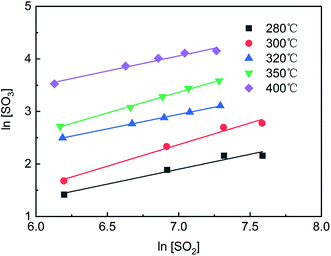
As shown in Fig. 4, the curves of ln[SO2] versus ln[SO3] were fitted using eqn (4), and a series of a and b values were obtained at various temperatures and are listed in Table 3. The average values of a and b were 0.77 ± 0.05 and −0.19 ± 0.08, respectively. The reaction rate equation of SO2 over the V2O5/TiO2 catalyst is given by eqn (5).
| rSO2 = k′[SO2]0.77[SO3]−0.19 | (5) |
| T (°C) | 280 | 300 | 320 | 350 | 400 |
| a | 0.71 | 0.86 | 0.71 | 0.86 | 0.73 |
| b | −0.25 | −0.05 | −0.29 | −0.08 | −0.26 |
| R2 | 0.8895 | 0.9522 | 0.9993 | 0.9955 | 0.949 |
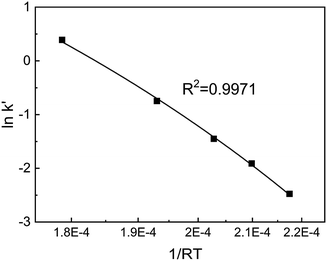
Substituting the values of a and b into eqn (4) yields eqn (6). After a series of ln![[thin space (1/6-em)]](https://www.rsc.org/images/entities/char_2009.gif) k′ values at various temperatures was calculated by eqn (6), the resulting curve of 1/RT versus ln
k′ values at various temperatures was calculated by eqn (6), the resulting curve of 1/RT versus ln![[thin space (1/6-em)]](https://www.rsc.org/images/entities/char_2009.gif) k′ was obtained, as shown in Fig. 5. The slope of the curve was equal to the apparent activation energy, approximately 74.3 kJ mol−1 with an error of 2.4%. The reaction rate of SO2 over the V2O5/TiO2 catalyst is given by eqn (7).
k′ was obtained, as shown in Fig. 5. The slope of the curve was equal to the apparent activation energy, approximately 74.3 kJ mol−1 with an error of 2.4%. The reaction rate of SO2 over the V2O5/TiO2 catalyst is given by eqn (7).
ln![[thin space (1/6-em)]](https://www.rsc.org/images/entities/char_2009.gif) k′ = 0.19 k′ = 0.19![[thin space (1/6-em)]](https://www.rsc.org/images/entities/char_2009.gif) ln[SO3] − 0.77 ln[SO3] − 0.77![[thin space (1/6-em)]](https://www.rsc.org/images/entities/char_2009.gif) ln[SO2] ln[SO2]
| (6) |
 | (7) |
The apparent activation energy of SO2 oxidation was approximately 84–209 kJ mol−1, so the chemical reaction was a rate-limiting step,25 leading to both the shallow layer and deep layer of the catalyst being involved in the oxidation of SO2. In contrast, the activation energy of the NOx reduction reaction was small at approximately 21 kJ mol−1,26 and the chemical reaction rate was fast, resulting in only the shallow layer of the catalyst participating in the reduction of NOx. According to the above differences, reducing the wall thickness of the catalyst was an effective method to reduce the oxidation rate of SO2 while ensuring denitrification efficiency. In practice, the minimum thickness of the honeycomb walls is determined by their mechanical resistance.
3.2. Formation mechanism of SO3
SO3 formation was first characterized in a simple atmosphere of SO2 and O2, and then the effects of NOx, H2O and NH3 on SO3 formation were explored to further reveal the mechanism of SO3 formation in complex atmospheres. In situ DRIFT spectra for the reaction in a simple atmosphere at various times are shown in Fig. 6. As the reaction proceeded, the stretching vibration of O–H at 3550–3750 cm−1 decreased. The high frequency peak at 3678 cm−1 was attributed to an alkaline hydroxyl group, and the low frequency peak at 3627 cm−1 was attributed to a neutral hydroxyl group.27 Based on the variation of the peak strength with reaction time, it was inferred that the alkaline hydroxyl groups were preferentially consumed. The peak at 1620 cm−1 belonged to the H–O–H bending motion of adsorbed H2O,28 indicating that H2O was formed during the adsorption of SO2. The reduction of the surface hydroxyl group and the formation of adsorbed H2O were a result of the SO2 combining with the surface hydroxyl group on the TiO2 and releasing sulfite species and H2O. The half peaks at 1030–1150 cm−1 indicated the existence of sulfite species on the catalyst surface.28–30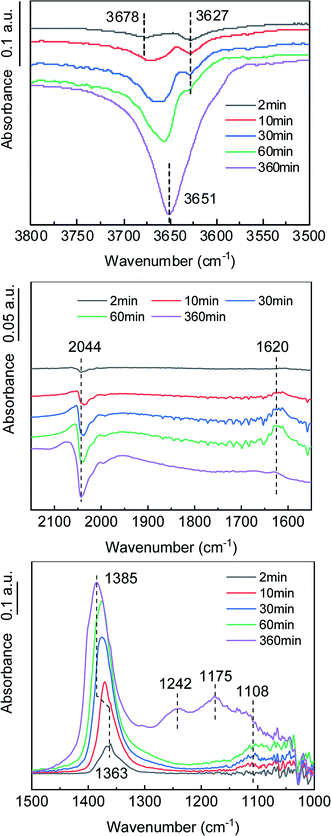 | ||
| Fig. 6 In situ DRIFT spectra of the catalyst in the formation process of SO3. (Conditions: 1000 ppm SO2, 6 vol% O2, and N2). | ||
The vibration peak at 1363–1385 cm−1 belonged to the bridge tridentate sulfate species bound to the carrier.16,31–33 As the reaction proceeded, the peak intensity increased, indicating that the surface sulfate increased. As the peak gradually shifted from 1363 cm−1 to 1385 cm−1, the hydroxyl peak gradually shifted from 3678 cm−1 to 3651 cm−1, which indicated that the bridge tridentate sulfate species was preferentially bound first to the basic hydroxyl group and then to the neutral hydroxyl group on the carrier. A comparison of the spectra at 60 min and 360 min revealed that the bending motion peak of H2O disappeared, but the wide peak at 1100–1300 cm−1 increased significantly. These peaks belonged to the chelated bidentate sulfate, bridge bidentate sulfate and unidentate sulfate.34 This observation indicated that the bridge tridentate sulfate changed to bidentate sulfate or unidentate sulfate under the action of H2O.
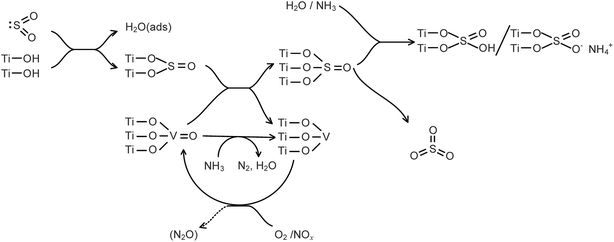
The negative peak at 2044 cm−1 belonged to the overtones of V![[double bond, length as m-dash]](https://www.rsc.org/images/entities/char_e001.gif) O.35 The gradual deepening of the negative peak indicated that the ratio of the high-valent vanadium (V5+) was decreasing, which was consistent with the mechanism of the K–M reaction. As an active component, the V2O5 was reduced to low-valent vanadium (V3+) when the SO2 was oxidized, and then the V3+ was oxidized to V5+ by O2, thus completing a catalytic cycle. The formation process of gaseous SO3, accompanied by the transformation between high-valent vanadium and low-valent vanadium, can be roughly divided into three steps. (1) Gaseous SO2 is chemically adsorbed on the surface of the carrier through hydroxyl groups. (2) The chemically adsorbed SO2 is oxidized by high-valent vanadium to form adsorbed SO3. (3) The adsorbed SO3 is desorbed to generate gaseous SO3.
O.35 The gradual deepening of the negative peak indicated that the ratio of the high-valent vanadium (V5+) was decreasing, which was consistent with the mechanism of the K–M reaction. As an active component, the V2O5 was reduced to low-valent vanadium (V3+) when the SO2 was oxidized, and then the V3+ was oxidized to V5+ by O2, thus completing a catalytic cycle. The formation process of gaseous SO3, accompanied by the transformation between high-valent vanadium and low-valent vanadium, can be roughly divided into three steps. (1) Gaseous SO2 is chemically adsorbed on the surface of the carrier through hydroxyl groups. (2) The chemically adsorbed SO2 is oxidized by high-valent vanadium to form adsorbed SO3. (3) The adsorbed SO3 is desorbed to generate gaseous SO3.
3.3. Effects of NOx, H2O and NH3 on gaseous SO3 formation
The effects of NOx on SO3 formation are shown in Fig. 7. With the addition of NOx, the SO3 concentration gradually increased from 11 ppm to 17.5 ppm and then remained constant, showing that NOx promoted the generation of gaseous SO3 by approximately 60%. When the flow of NOx was stopped, the SO3 concentration gradually decreased to the initial concentration. The enhancement may have been due to the oxidation of SO2 by NOx, which was in the gas phase or adsorbed on the catalyst surface.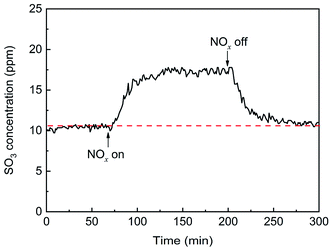 | ||
| Fig. 7 Transient effects of NOx on SO3 formation (conditions: 1000 ppm SO2, 500 ppm NOx, 6 vol% O2, and N2). | ||
The effects of H2O on SO3 formation are shown in Fig. 8. With the addition of H2O, the SO3 concentration sharply increased from 11 ppm to 23 ppm and then gradually decreased to 8.5 ppm. Compared with the initial concentration, the SO3 concentration first doubled and then decreased by 23%. It can be inferred that the SO3 desorption from the active site into the gas phase was due to a competitive adsorption between H2O and SO3. When the flow of H2O was stopped, the SO3 concentration sharply decreased to nearly zero and then returned to a constant of 12 ppm. The sharp decrease in the SO3 concentration occurred because more active sites were released by the H2O desorption and more SO3 was adsorbed.
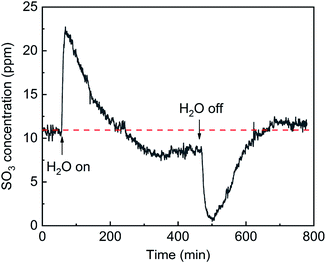 | ||
| Fig. 8 Transient effects of H2O on SO3 formation (conditions: 1000 ppm SO2, 5 vol% H2O, 6 vol% O2, and N2). | ||
The effects of NH3 on SO3 formation are shown in Fig. 9. With the addition of NH3, the SO3 concentration slightly increased from 11 ppm to 13 ppm. When the flow of NH3 was stopped, the SO3 concentration sharply decreased to 3 ppm and then recovered and remained constant. The desorption of SO3 was promoted by the competitive adsorption between NH3 and SO3 and was inhibited by the combination of SO3 and adsorbed NH3. When NH3 was initially introduced, competitive adsorption dominated the process, and the release of SO3 increased slightly. When the NH3 was withdrawn, the competitive adsorption basically stopped, but the combination of SO3 and adsorbed NH3 remained, which greatly inhibited the desorption of SO3 and led to a sharp drop in the SO3 concentration.
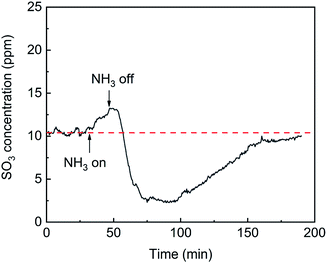 | ||
| Fig. 9 Transient effects of NH3 on SO3 formation (conditions: 1000 ppm SO2, 500 ppm NH3, 6 vol% O2, and N2). | ||
In short, the process of gaseous SO3 formation includes SO2 adsorption, SO2 oxidation and SO3 desorption. To clarify in which step NOx, H2O and NH3 affect SO3 formation, the three steps were tested separately. The SO2 oxidation was investigated first, followed by the SO2 adsorption and SO3 desorption.
3.4. Effects of NOx, H2O and NH3 on SO2 oxidation
To further investigate the effects of NOx, H2O and NH3 on SO2 oxidation, in situ DRIFT spectroscopy was used to determine the intermediate products, and the results are shown in Fig. 10–12. As shown in Fig. 10, in the presence of NOx, the adsorption band of N2O at 1303 cm−1 appeared,36,37 the adsorption band of V![[double bond, length as m-dash]](https://www.rsc.org/images/entities/char_e001.gif) O at 2041 cm−1 decreased, and the peak of tridentate sulfate at 1380–1386 cm−1 decreased. Thus, NOx was reduced to N2O while V3+ was oxidized to V5+, and the increase in V5+ promoted the oxidation of the adsorbed SO2. After the removal of the NOx, the adsorbed N2O peak disappeared, and the tridentate sulfate peak returned to its initial state. Therefore, NOx promoted SO2 oxidation by promoting the conversion of V3+ to V5+. No SO3 formation was detected in the absence of the catalyst in the SO2, O2 and NOx atmospheres, indicating that the promotion effect of NOx on SO2 oxidation acted on the catalyst surface instead of in the gas phase.
O at 2041 cm−1 decreased, and the peak of tridentate sulfate at 1380–1386 cm−1 decreased. Thus, NOx was reduced to N2O while V3+ was oxidized to V5+, and the increase in V5+ promoted the oxidation of the adsorbed SO2. After the removal of the NOx, the adsorbed N2O peak disappeared, and the tridentate sulfate peak returned to its initial state. Therefore, NOx promoted SO2 oxidation by promoting the conversion of V3+ to V5+. No SO3 formation was detected in the absence of the catalyst in the SO2, O2 and NOx atmospheres, indicating that the promotion effect of NOx on SO2 oxidation acted on the catalyst surface instead of in the gas phase.
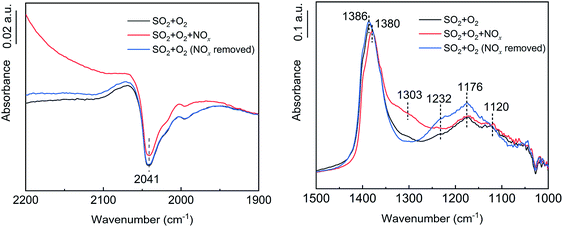 | ||
| Fig. 10 In situ DRIFT spectra of the catalyst with NOx flow (conditions: 1000 ppm SO2, 500 ppm NOx, 6 vol% O2, and N2). | ||
As shown in Fig. 11, after the addition of H2O, the V![[double bond, length as m-dash]](https://www.rsc.org/images/entities/char_e001.gif) O peak at 2041 cm−1 did not change significantly, the tridentate sulfate peak at 1379–1386 cm−1 decreased slightly, and the bidentate sulfate peak at 1176–1240 cm−1 increased. A bending vibration peak attributable to S–O–H was observed at 1295 cm−1,38 indicating that H2O promoted the transformation of tridentate sulfate to bidentate sulfate, which partly existed in the form of bisulfate. After the removal of the H2O, the tridentate sulfate peak increased to its initial state, the bidentate sulfate peak increased further, and the bending vibration peak of S–O–H decreased, indicating that the proportion of hydrogen sulfate decreased.
O peak at 2041 cm−1 did not change significantly, the tridentate sulfate peak at 1379–1386 cm−1 decreased slightly, and the bidentate sulfate peak at 1176–1240 cm−1 increased. A bending vibration peak attributable to S–O–H was observed at 1295 cm−1,38 indicating that H2O promoted the transformation of tridentate sulfate to bidentate sulfate, which partly existed in the form of bisulfate. After the removal of the H2O, the tridentate sulfate peak increased to its initial state, the bidentate sulfate peak increased further, and the bending vibration peak of S–O–H decreased, indicating that the proportion of hydrogen sulfate decreased.
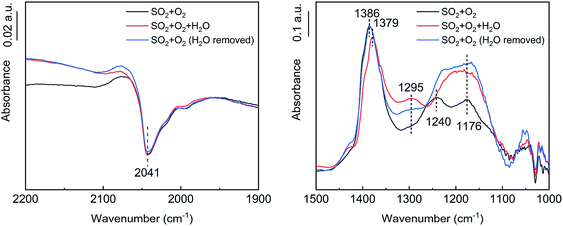 | ||
| Fig. 11 In situ DRIFT spectra of the catalyst with H2O flow (conditions: 1000 ppm SO2, 5 vol% H2O, 6 vol% O2, and N2). | ||
As shown in Fig. 12, in the presence of NH3, the peak position of tridentate sulfate shifted from 1387 cm−1 to 1588 cm−1, and the peak intensity decreased significantly. Further, new adsorption bands of NH4+ at 1424 cm−1 and S–O–H at 1301 cm−1 appeared.39 NH3 was partially oxidized on the catalyst surface to produce H2O. In addition, there were hydroxyl groups on the catalyst surface. Thus, tridentate sulfate combined with NH3 and hydroxyl or H2O to produce ammonium bisulfate. The adsorption band of V![[double bond, length as m-dash]](https://www.rsc.org/images/entities/char_e001.gif) O increased in the presence of NH3, showing that V5+ was reduced to V3+ by NH3. The decrease of V5+ inhibited the oxidation of the adsorbed SO2.
O increased in the presence of NH3, showing that V5+ was reduced to V3+ by NH3. The decrease of V5+ inhibited the oxidation of the adsorbed SO2.
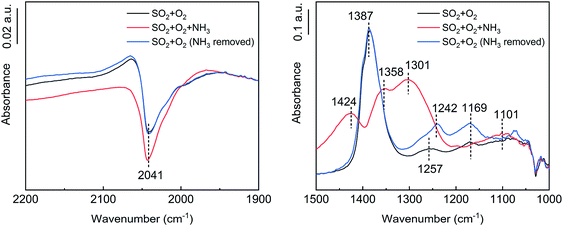 | ||
| Fig. 12 In situ DRIFT spectra of the catalyst with NH3 flow (conditions: 1000 ppm SO2, 500 ppm NH3, 6 vol% O2, and N2). | ||
To confirm the effects of NOx, H2O and NH3 on the valence state of vanadium, XPS characterization was performed on the V2O5/TiO2 catalysts exposed to various atmospheres, and the spectra are shown in Fig. 13. The V 2p3/2 spectra were separated into two peaks by the Gaussian–Lorentzian deconvolution method, including the V3+ peak (515.0 eV) and V5+ peak (516.4 eV),40,41 and the vanadium contents of various valences are shown in Table 4. Compared with the blank catalyst, the proportion of V5+ obviously increased from 46% to 72% in the presence of NOx, which may have been caused by the oxidation of V3+ by NOx. Similarly, the addition of H2O led to a slight increase in the proportion of V5+. In contrast, the proportion of V5+ slightly decreased in the presence of NH3 because of the reduction of V5+ by NH3. The effect of NOx on the vanadium valence was generally more significant than that of H2O and NH3.
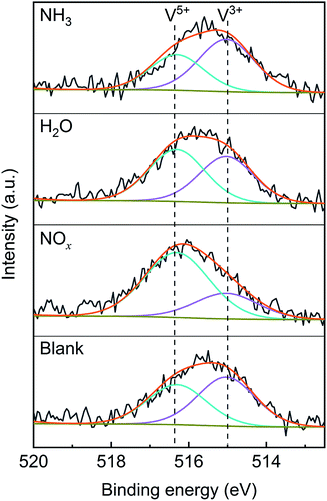 | ||
| Fig. 13 XPS characterization of the V2O5/TiO2 catalysts after exposure to various gases (blank conditions: 1000 ppm SO2 and N2; other conditions: addition of 500 ppm NOx, 500 ppm NH3 or 5% H2O). | ||
| Sample | Blank | NOx | H2O | NH3 |
|---|---|---|---|---|
| V5+/(V5+ + V3+) | 46% | 72% | 53% | 40% |
Based on the analysis of the results shown in Fig. 10–13, NOx promoted the conversion of V3+ to V5+, thereby accelerating the oxidation of the adsorbed SO2. The tridentate sulfate peak changed with the atmosphere, while the bidentate sulfate peak always increased, indicating that the bidentate sulfate was more stable than the tridentate sulfate, and the tridentate sulfate may have been the key intermediate product of the SO2 oxidation. It can be inferred that, in the presence of H2O or NH3, the tridentate sulfate transformed to the more stable bidentate sulfate and thereby inhibited the desorption of SO3, which was verified by the TPD tests discussed below.
3.5. Effects of NOx, H2O and NH3 on SO2 adsorption and SO3 desorption
First, the effects of NOx, H2O and NH3 on SO2 adsorption were investigated, and the breakthrough curves of SO2 are shown in Fig. 14. For the blank, the SO2 concentration increased rapidly, corresponding to the adsorption stage of SO2, and tended to stabilize at 970 ppm, corresponding to the catalytic oxidation stage of SO2, with a SO2 conversion ratio of approximately 3%. After the addition of NOx, the SO2 concentration decreased from 970 ppm to 960 ppm and tended to be stable, which was attributed to the promotion effect of NOx on the SO2 oxidation instead of the SO2 adsorption. After the addition H2O or NH3, the SO2 concentration rapidly decreased and then gradually increased and finally stabilized at more than 970 ppm. These characteristics are typical of adsorption breakthrough curves, indicating that the presence of H2O or NH3 promoted the SO2 adsorption. Finally, the SO2 concentration exceeded 970 ppm, which was due to the adsorption saturation of the alkaline sites from the adsorption of NH3 and H2O on the catalyst surface.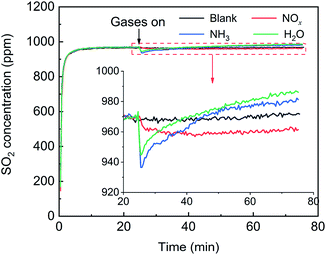 | ||
| Fig. 14 Effects of NOx, H2O and NH3 on SO2 adsorption over the V2O5/TiO2 catalyst (blank conditions: 1000 ppm SO2 and N2; other conditions: 500 ppm NOx, 500 ppm NH3 or 5% H2O). | ||
The effects of NOx, H2O and NH3 on SO3 desorption are shown in Fig. 15. For the blank, as the SO2 and O2 sources were removed, the SO3 concentration gradually decreased, showing that the adsorbed SO3 was desorbed in the flow of N2. After the addition of NOx, the desorption curves of SO3 coincided with that of the blank, indicating that NOx did not influence the SO3 desorption. After the addition of H2O, the SO3 concentration sharply doubled to a maximum and then gradually decreased. These results indicated that there was a strong competitive adsorption between H2O and SO3. After the addition of NH3, the SO3 concentration gradually increased by approximately 2 ppm due to a mild competitive adsorption between NH3 and SO3. H2O or NH3 and SO3 competitively adsorbed to promote SO3 desorption, but the promotion of SO3 desorption was not sustainable. Further, H2O or NH3 combined with the adsorbed SO3 to form a more stable bidentate sulfate or ammonium bisulfate, which ultimately inhibited the SO3 desorption. This phenomenon was most obvious in the presence of NH3. Although the NH3 was removed, the SO3 concentration decreased to less than that of the blank.
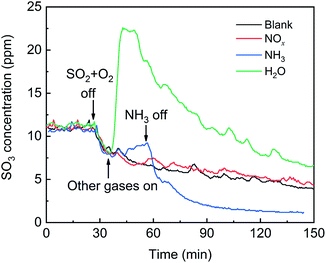 | ||
| Fig. 15 Effects of NO, H2O and NH3 on SO3 desorption (blank conditions: 1000 ppm SO2, 6 vol% O2 and N2; other conditions: 500 ppm NO, 500 ppm NH3 or 5% H2O). | ||
The addition of NH3 and H2O had an obvious inhibitory effect on the desorption of SO3. To compare the effects of the two gases, TPD tests were carried out on the catalysts pretreated in various atmospheres, and the results are shown in Fig. 16. Compared with the blank, the initial temperature and peak temperature of SO3 desorption both increased by 60–70 °C in the presence of H2O and increased significantly by 120–130 °C in the presence of NH3. These results showed that the presence of H2O and NH3 made SO3 much more difficult to desorb and that NH3 inhibited SO3 desorption more effectively than did H2O. The peak areas of SO3 desorption were 19![[thin space (1/6-em)]](https://www.rsc.org/images/entities/char_2009.gif) 615, 20
615, 20![[thin space (1/6-em)]](https://www.rsc.org/images/entities/char_2009.gif) 185 and 21
185 and 21![[thin space (1/6-em)]](https://www.rsc.org/images/entities/char_2009.gif) 011 ppm min in three kinds of atmospheres. In view of the measurement error of approximately 10%, the desorption amount of SO3 was approximately equal. Thus, H2O and NH3 affected the adsorption state of SO3 but not the adsorption amount.
011 ppm min in three kinds of atmospheres. In view of the measurement error of approximately 10%, the desorption amount of SO3 was approximately equal. Thus, H2O and NH3 affected the adsorption state of SO3 but not the adsorption amount.
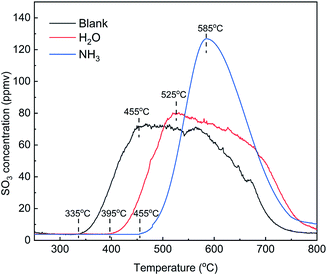 | ||
| Fig. 16 TPD curves of the catalysts adsorbed in various atmospheres (blank pretreatment conditions: N2; other conditions: 500 ppm NH3 or 5% H2O). | ||
The formation of SO3 during the SCR of NOx with NH3 in the presence of H2O is summarized in Fig. 17. The formation of SO3 was obviously promoted by NOx, significantly inhibited by NH3, and slightly inhibited by H2O. NOx promoted the SO2 oxidation in that the NOx promoted the transformation of low-valent vanadium to high-valent vanadium. H2O and NH3 combined with the adsorbed SO3 to form bidentate sulfate and bisulfate, respectively, and the SO3 desorption was depressed. The inhibition of the SO3 desorption by NH3 was stronger than that by H2O.
4. Conclusions
Over the range of conditions studied, the rate of SO2 oxidation was zero-order in O2, 0.77-order in SO2 and -0.19-order in SO3, and the apparent activation energy for SO2 oxidation was 74.3 kJ mol−1. The chemical reaction process can be roughly divided into three steps, including (1) SO2 adsorption on the active site to generate adsorbed SO2, (2) the oxidation of adsorbed SO2 to produce adsorbed SO3 in the form of tridentate sulfate and (3) the desorption of SO3 from the catalyst surface to the gas phase. NOx promoted the transformation of low-valent vanadium to high-valent vanadium, which promoted SO2 oxidation and resulted in a significant increase in SO3. However, the presence of NOx had no obvious effect on the SO2 adsorption and SO3 desorption. The presence of H2O or NH3 promoted SO2 adsorption and had no significant effect on SO2 oxidation. However, H2O and NH3 combined with tridentate sulfate to form a more stable bidentate sulfate and ammonium bisulfate, respectively, and SO3 desorption was depressed. The difference was that the inhibition of SO3 desorption by NH3 was more obvious than that by H2O. Thus, the formation of gaseous SO3 was significantly inhibited by NH3 and slightly inhibited by H2O.Conflicts of interest
There are no conflicts to declare.Acknowledgements
The authors acknowledge the financial support from the National Key R&D Program of China (No. 2017YFC0210600) and the National Natural Science Foundation of China (No. 21477131).References
- R. K. Srivastava, C. A. Miller, C. Erickson and R. Jambhekar, J. Air Waste Manage. Assoc., 2004, 54, 750–762 CrossRef CAS PubMed.
- Y. Cao, H. C. Zhou, W. Jiang, C. W. Chen and W. P. Pan, Environ. Sci. Technol., 2010, 44, 3429–3434 CrossRef CAS PubMed.
- Y. Sarbassov, L. Duan, V. Manovic and E. J. Anthony, Greenhouse Gases: Sci. Technol., 2018, 8, 402–428 CrossRef CAS.
- B. Xiang, M. Zhang, Y. Wu, H. Yang, H. Zhang and J. Lu, Energy Fuels, 2017, 31, 6284–6297 CrossRef CAS.
- C. H. Weng, D. Yang, Y. Luo, X. Ye, W. Chen, J. Guo, Z. Zou, F. Lu and R. Weerasinghe, E3S Web Conf., 2018, 53, 04005 CrossRef.
- R. Kikuchi, Environ. Manage., 2001, 27, 837–844 CrossRef CAS PubMed.
- P. Forzatti, I. Nova and A. Beretta, Catal. Today, 2000, 56, 431–441 CrossRef CAS.
- K. He, Q. Song, Z. Yan, N. Zheng and Q. Yao, Fuel, 2019, 242, 355–361 CrossRef CAS.
- D. Xie, H. Wang, J. Tao, D. Chang and C. You, J. Chem. Technol. Biotechnol., 2019, 94, 2382–2388 CrossRef CAS.
- J. Liu, F. Zhu and X. Ma, Engineering, 2018, 4, 416–420 CrossRef CAS.
- S. Meng, X. Qi, W. Yao and Y. Yao, IOP Conf. Ser. Earth Environ. Sci., 2019, 300, 052018 CrossRef.
- J. P. Dunn, H. G. Stenger and I. E. Wachs, J. Catal., 1999, 181, 233–243 CrossRef CAS.
- J. P. Dunn, H. G. Stenger and I. E. Wachs, Catal. Today, 1999, 53, 543–556 CrossRef CAS.
- J. P. Dunn, H. G. Stenger and I. E. Wachs, Catal. Today, 1999, 51, 301–318 CrossRef CAS.
- J. P. Dunn, P. R. Koppula, H. G. Stenger and I. E. Wachs, Appl. Catal., B, 1998, 19, 103–117 CrossRef CAS.
- X. Guo, C. Bartholomew, W. Hecker and L. L. Baxter, Appl. Catal., B, 2009, 92, 30–40 CrossRef CAS.
- L. Lietti, I. Nova, E. Tronconi and P. Forzatti, in Reaction Engineering for Polution Prevention, ed. M. A. Abraham and R. P. Hesketh, Elsevier Science, 2000, pp. 85–112 Search PubMed.
- E. Tronconi, A. Cavanna, C. Orsenigo and P. Forzatti, Ind. Eng. Chem. Res., 1999, 38, 2593–2598 CrossRef CAS.
- L. Lietti, I. Nova, E. Tronconi and P. Forzatti, Catal. Today, 1998, 45, 85–92 CrossRef CAS.
- C. Orsenigo, A. Beretta, P. Forzatti, J. Svachula, E. Tronconi, F. Bregani and A. Baldacci, Catal. Today, 1996, 27, 15–21 CrossRef CAS.
- J. Svachula, L. Alemany, N. Ferlazzo, P. Forzatti, E. Tronconi and F. Bregani, Ind. Eng. Chem. Res., 1994, 33, 1644 CrossRef.
- J. Svachula, L. J. Alemany, N. Ferlazzo, P. Forzatti, E. Tronconi and F. Bregani, Ind. Eng. Chem. Res., 1993, 32, 826–834 CrossRef CAS.
- J. Xiong, Y. Li, J. Wang, Y. Yang and T. Zhu, J. Environ. Sci., 2018, 72, 25–32 CrossRef PubMed.
- D. Yun, Y. Wang and J. E. Herrera, ACS Catal., 2018, 8, 4681–4693 CrossRef CAS.
- S. Najafishirtari, C. Guglieri, S. Marras, A. Scarpellini, R. Brescia, M. Prato, G. Righi, A. Franchini, R. Magri, L. Manna and M. Colombo, Appl. Catal., B, 2018, 237, 753–762 CrossRef CAS.
- J. Mu, X. Li, W. Sun, S. Fan, X. Wang, L. Wang, M. Qin, G. Gan, Z. Yin and D. Zhang, Ind. Eng. Chem. Res., 2018, 57, 10159–10169 CrossRef CAS.
- S. T. Choo, Y. G. Lee, I.-S. Nam, S.-W. Ham and J.-B. Lee, Appl. Catal., A, 2000, 200, 177–188 CrossRef CAS.
- C. E. Nanayakkara, J. Pettibone and V. H. Grassian, Phys. Chem. Chem. Phys., 2012, 14, 6957–6966 RSC.
- C. E. Nanayakkara, W. A. Larish and V. H. Grassian, J. Phys. Chem. C, 2014, 118, 23011–23021 CrossRef CAS.
- U. Diebold, Surf. Sci. Rep., 2003, 48, 53–229 CrossRef CAS.
- J. Ryczkowski, Catal. Today, 2001, 68, 263–381 CrossRef CAS.
- S. M. Jung, O. Dupont and P. Grange, Appl. Catal., A, 2001, 208, 393–401 CrossRef CAS.
- C. Li, M. Shen, T. Yu, J. Wang, J. Wang and Y. Zhai, Phys. Chem. Chem. Phys., 2017, 19, 15194–15206 RSC.
- K. Nakamoto, Infrared and Raman Spectra of Inorganic and Coordination Compounds (Part B: Applications in Coordination, Organometallic, and Bioinorganic Chemistry), John Wiley & Sons, Inc., Hoboken, New Jersey, 2009, vol. 1B Search PubMed.
- A. Marberger, D. Ferri, M. Elsener and O. Krocher, Angew. Chem., Int. Ed., 2016, 55, 11989–11994 CrossRef CAS PubMed.
- K. I. Hadjiivanov, Catal. Rev., 2000, 42, 71–144 CrossRef CAS.
- T. M. Miller and V. H. Grassian, J. Am. Chem. Soc., 1995, 117, 10969–10975 CrossRef CAS.
- A. Periasamy, S. Muruganand and M. Palaniswamy, Rasayan J. Chem., 2009, 2(4), 981–989 CAS.
- F. Liu, K. Asakura, H. He, W. Shan, X. Shi and C. Zhang, Appl. Catal., B, 2011, 103, 369–377 CrossRef CAS.
- Q. Wang and R. J. Madix, Surf. Sci., 2001, 474, L213–L216 CrossRef CAS.
- M. A. Eberhardt, A. Proctor, M. Houalla and D. M. Hercules, J. Catal., 1996, 160, 27–34 CrossRef CAS.
| This journal is © The Royal Society of Chemistry 2019 |

