
 Open Access Article
 This Open Access Article is licensed under a Creative Commons Attribution-Non Commercial 3.0 Unported Licence
NO reduction over an Al-embedded MoS2 monolayer: a first-principles study†
Mehdi D. Esrafili * and
Safa Heydari
* and
Safa Heydari
Department of Chemistry, Faculty of Basic Sciences, University of Maragheh, P. O. Box 55136-553, Maragheh, Iran. E-mail: esrafili@maragheh.ac.ir; Fax: +98 4212276060; Tel: +98 4212237955
First published on 27th November 2019
Abstract
Converting toxic air pollutants such as nitric oxide (NO) and carbon monoxide (CO) into less harmful gases remains a critical challenge for many industrial technologies. Here, by performing first-principles calculations, we introduce a cheap, stable and novel catalyst for the conversion of NO and CO molecules into N2O and CO2 using Al-doped MoS2 (Al–MoS2). According to our results, dissociation of NO molecules on Al–MoS2 has a large energy barrier (3.62 eV), suggesting that it is impossible at ambient temperature. In contrast, the coadsorption of NO molecules to form (NO)2 moieties is characterized as the first step of the NO reduction process. The formed (NO)2 is unstable on Al–MoS2, and hence it is easily decomposed into N2O molecules, and an oxygen atom is adsorbed onto the Al atom (Oads). This reaction step is exothermic and needs an activation energy of 0.37 eV to be overcome. Next, the Oads moiety is removed from the Al atom by a CO molecule, and thereby the Al–MoS2 catalyst is recovered for the next round of reaction. The side reaction producing NO2 via the reaction of NO with the Oads moiety cannot proceed on Al–MoS2 due to its large activation energy.
1. Introduction
Air pollution originating from the burning of fossil fuels in different mobile and stationary power plants is a serious threat to human health and the environment.1 Nitric oxide (NO), which accounts for more than 90% of nitrogen oxides (NOx), is a highly toxic gas emitted into the atmosphere with many negative impacts on the environment such as acid rain and photochemical smog formation, and ozone layer depletion.2 Moreover, any exposure to this toxic gas can cause many devastating effects on human health. Therefore, it is desirable to develop and search for efficient approaches to reduce the atmospheric concentration of NO. The catalytic reduction of NO has gained much attention in recent years,3–7 due to its high efficiency, selectivity and simplicity. Previous studies8–14 have indicated that NO could be converted into N2O, N2 or NO2 species in the presence of CO as the reducing agent. This is promising, since it also provides a route for removing toxic CO from the atmosphere. For instance, Gopinath and co-workers15 have investigated the reduction of NO by CO over the Pd(111) surface by means of molecular beam technique. First-principles calculations have also indicated that NO molecules could be easily transformed into N2O over Au(111) via a dimer mechanism.16 Clearly, for large-scale applications, low cost noble-metal free catalysts with high catalytic performance are desirable.Recently, layered materials have attracted much scientific attention due to their diverse applications in many fields of chemistry, physics and material science.17–24 Molybdenum disulfide (MoS2) is a layered material with unique properties such as chemical inertness, high chemically stability, photo-corrosion resistance and specific optical properties.25,26 In addition, owning to its high specific area, MoS2 can act as an ideal substrate to anchor atomically dispersed metal atoms. However, pure MoS2 is chemically inert to effectively stabilize deposited metal atoms, due to the absence of any dangling bonds. Hence, further optimization of active sites is desirable to increase the overall catalytic performance of MoS2.27–29 For instance, the basal plane of MoS2 has been successfully activated for hydrogen evaluation reaction (HER) by generating sulfur vacancies.30,31 González et al.32 have indicated that the introduction of defects in MoS2 leads to a notably increase of the adsorption energy of small inorganic molecules (CO2, CO, H2O, NO, NO2, H2 and N2) accompanied by a larger charge transfer. On the other hand, intensive theoretical and experimental studies33–38 have proven that doping of MoS2 with foreign atoms can considerably modify its surface reactivity and electronic structure. Earlier quantum chemical calculations have indicated that Fe-,39 Co- or Ni-40 doped MoS2 exhibits distinctive catalytic activity for reduction of O2 molecule. Using density functional theory (DFT) calculations and experiments, Park and coworkers41 have indicated that adding cobalt (Co) clusters on MoS2 can greatly catalyze the HER process. Interestingly, the highest HER activity was obtained when the metal clusters are decorated over the S-vacancies with the interface of Co–Mo as the preferred active site. Recently, Li and coworkers42 have found that a single Al atom supported by defective MoS2 can serve as a robust and promising catalyst for oxidation of CO molecule. Apart from such outstanding catalytic activity, these metal-doped substrates show also high structural stability owning to strong binding of the metal atom to MoS2, which render them as ideal catalysts used in automotive exhausts, industrial gas streams or fuel cells.
Experimental studies and theoretical calculations have shown that a variety of structural defects could be unavoidably introduced in the MoS2 monolayer.43–45 S-vacancy is one of the most popular intrinsic structural defects in MoS2, which can be produced in a controllable way by low-energy argon sputtering46 as well as electron irradiation47,48 process. First-principle calculations have shown that the formation of S-vacancy defects in MoS2 is energetically more favorable than Mo-vacancy ones.39,45 A recent study49 has also shown the potential of S-vacancy defective MoS2 monolayers to serve as an active substrate in dissociation of H2O molecules.
While much research attention has been paid to study the adsorption behavior of chemically doped MoS2 monolayer toward small gas molecules, however, as far as we know, there is still a lack of detailed information about the mechanism of NO reduction over these systems. The present study aims to investigate the reaction pathways and energy barriers for reduction of NO molecules over Al-doped MoS2 (Al–MoS2) using the DFT calculations. We chose Al, since it is cheap, environmentally friendly and abundant in the Earth's crust, which meets our requirement to seek low-cost catalysts for reduction of NO. In addition, the large adsorption energy of Al atom suggests that it is tightly anchored on the vacancy site, prohibiting its diffusion over the MoS2 surface. As a result, Al–MoS2 is introduced as a stable catalyst for reduction of NO. According to our results, the low-temperature reduction of NO is most likely to occur over Al–MoS2 due to its low energy barriers.
2. Computational details
The first-principles DFT calculations were carried out with the DMol3 code,50,51 by employing the Perdew–Burke–Ernzerhof (PBE)52 density functional and a double numerical plus polarization (DNP) basis set. The relativistic effects in the Mo atoms were treated by the DFT semicore pseudopotentials (DSPPs) core method.53 The weak van der Waals interactions were considered via the Grimme's DFT-D2 scheme.54,55 The convergence threshold for self-consistent iteration in the geometry optimization was set at 10−5 Ha, while the convergence criteria for the force and displacement was set to 0.001 Ha Å−1 and 0.005 Å, respectively. The Monkhorst–Pack k-point mesh was set 3 × 3 × 1 in the geometry relaxations, while 10 × 10 × 1 in the density of states (DOS) analysis. To locate transition state structures, the complete linear synchronous transit and quadratic synchronous transit (LST/QST) method was adopted and their nature (with only one imaginary frequency) was identified by the frequency calculations. Zero point energies (ZPE) obtained from the frequency calculations were then used to correct energy barriers. In addition, thermal correction to the energy barriers and reaction energies was also considered.The pristine MoS2 is a hexagonal layered material with the S–Mo–S sandwich layers. To model it, we employed a 5 × 5 × 1 monolayer, which involves 25 Mo and 50 S atoms. The Al–MoS2 was then obtained by replacing one S atom of the pristine MoS2 with a single Al atom. The interaction between the layers was avoided by setting 20 Å empty space along the z-direction. After the full geometry relaxation, the lattice parameters of 3.18 Å were obtained for the pristine MoS2, which are in excellent accordance with those of earlier experimental and theoretical studies.56,57
To evaluate the relative stability of Al–MoS2 with respect to the pure MoS2, the formation energy (Eform) was calculated as
| Eform = EAl–MoS2 − EMoS2 + ES − EAl | (1) |
The adsorption/coadsorption energy (Eads) was obtained using the following equation:
| Eads = Etotal − EX − Esubstrate | (2) |
3. Results and discussion
Surface properties and stability of Al–MoS2
We first examine the possibility to introduce an Al atom in the single S-vacancy of MoS2. Fig. 1 shows the optimized geometry, charge density difference map and total density of states (TDOS) plot of Al–MoS2. It is evident from Fig. 1a that Al atom is stably anchored in the vacancy site of MoS2 due to the formation of three covalent bonds with the neighboring Mo atoms. The relaxed Al–Mo bond distances in Al–MoS2 are 2.64 Å, which are larger than the S–Mo bond lengths in the pure MoS2 (ca. 2.44 Å). The adsorption energy of Al atom over the vacancy site of MoS2 is −3.55 eV, which is larger than the cohesive energy of the bulk Al (−3.35 eV).58 This finding ensures that Al atom prefers to be adsorbed on the defective MoS2 in the form of single atoms and thus the clustering of the Al atoms might be avoided. On the other hand, the formation energy (Eform) of Al–MoS2 is obtained as 2.57 eV, which is in excellent accordance with the value reported in the ref. 21. Considering the charge density difference map in Fig. 1b, it is seen that a quite large electron density loss area appears above Al, which indicates the potential of this atom to interact with nucleophilic species. Similarly, the Hirshfeld analysis reveals that about 0.20 |e| shifts from Al to the defective MoS2, and each of the three nearest Mo atoms has a positive charge of 0.18 |e|. Furthermore, the doping of Al atom is proven to decrease band gap of MoS2 from 1.73 eV in the pure state to 0.30 eV in Al–MoS2. The latter is mainly related to the localization of impurity Al-3p states between the valence and conduction bands (Fig. 1c). Considering that a small band gap corresponds to low kinetic stability, thus it is suggested that the Al-doping significantly tunes the surface reactivity and electronic structure of MoS2. This is very important for capture and activation of NO and CO molecules, as which will be discussed in the following sections.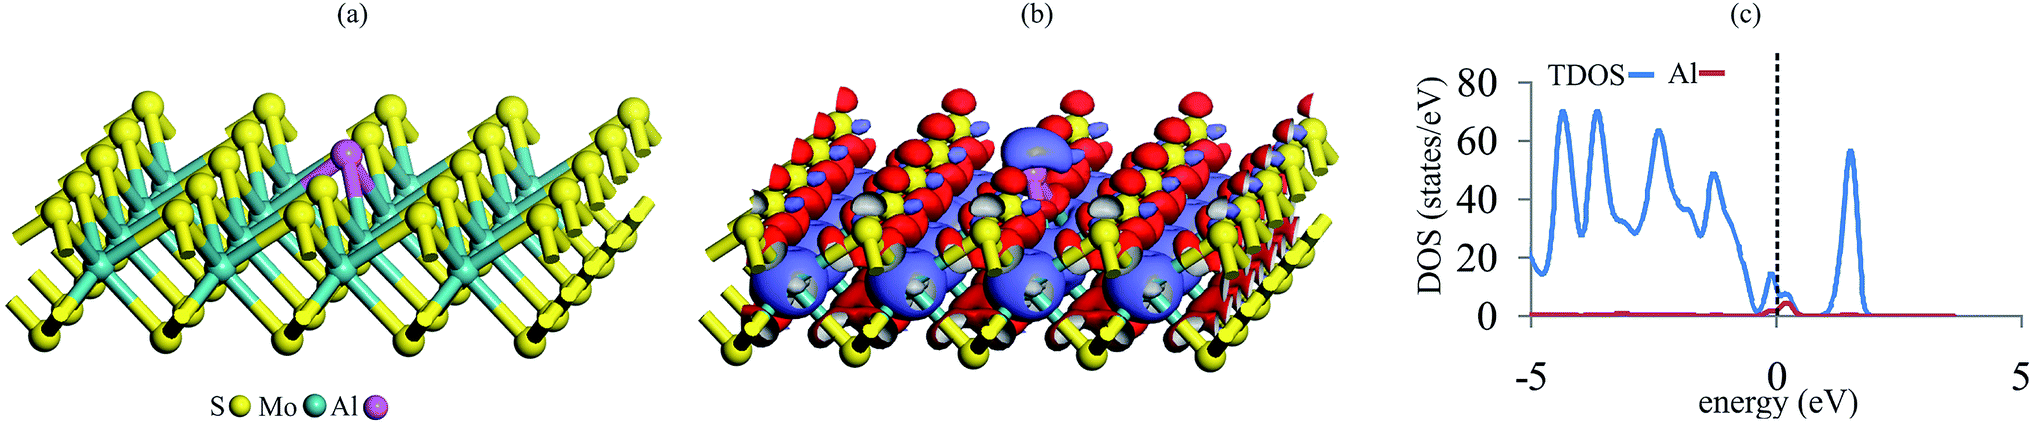 | ||
| Fig. 1 (a) The relaxed geometry, (b) charge density difference and (c) TDOS/PDOS plot of Al–MoS2. The red and violet regions in charge density difference map indicate the charge loss and accumulation regions, respectively. The dashed line in the TDOS/PDOS plot indicates the Fermi level (set to be zero). | ||
To further clarify the stability of the Al–MoS2 substrate, we also investigate the reaction path and energy profile for the migration of the Al atom into neighboring hallow sites. Fig. S1 of ESI† represents the optimized geometry of involved stationary points in this process. Looking at Fig. S1,† one can see that the activation energy required for the migration of Al atom on MoS2 is quite high (0.98 eV). This confirms our above finding that the Al atom binds tightly at the defect site of MoS2, and hence the clustering problem would be avoided. Besides, the relatively large positive reaction energy reveals that the final structure is thermodynamically less stable than the initial one. These results demonstrate that Al–MoS2 would remain as a stable catalyst at normal temperatures.
Adsorption of NO and CO molecules
After studying the surface reactivity and stability of Al–MoS2, we now focus on the catalytic activity of this substrate for NO reduction. Considering that the initial adsorption configuration of reactants on the catalyst surface plays a critical role in the subsequent reaction pathway, we first consider the most stable adsorption configurations of NO and CO molecules on the Al–MoS2 substrate. Fig. 2 indicates the optimized geometries, along with the corresponding partial density of states (PDOS) and electron density difference (EDD) maps. To compare the adsorption behavior of NO and CO, adsorption energy (Eads) and net charge-transfer (qCT) values are obtained and summarized in Table 1.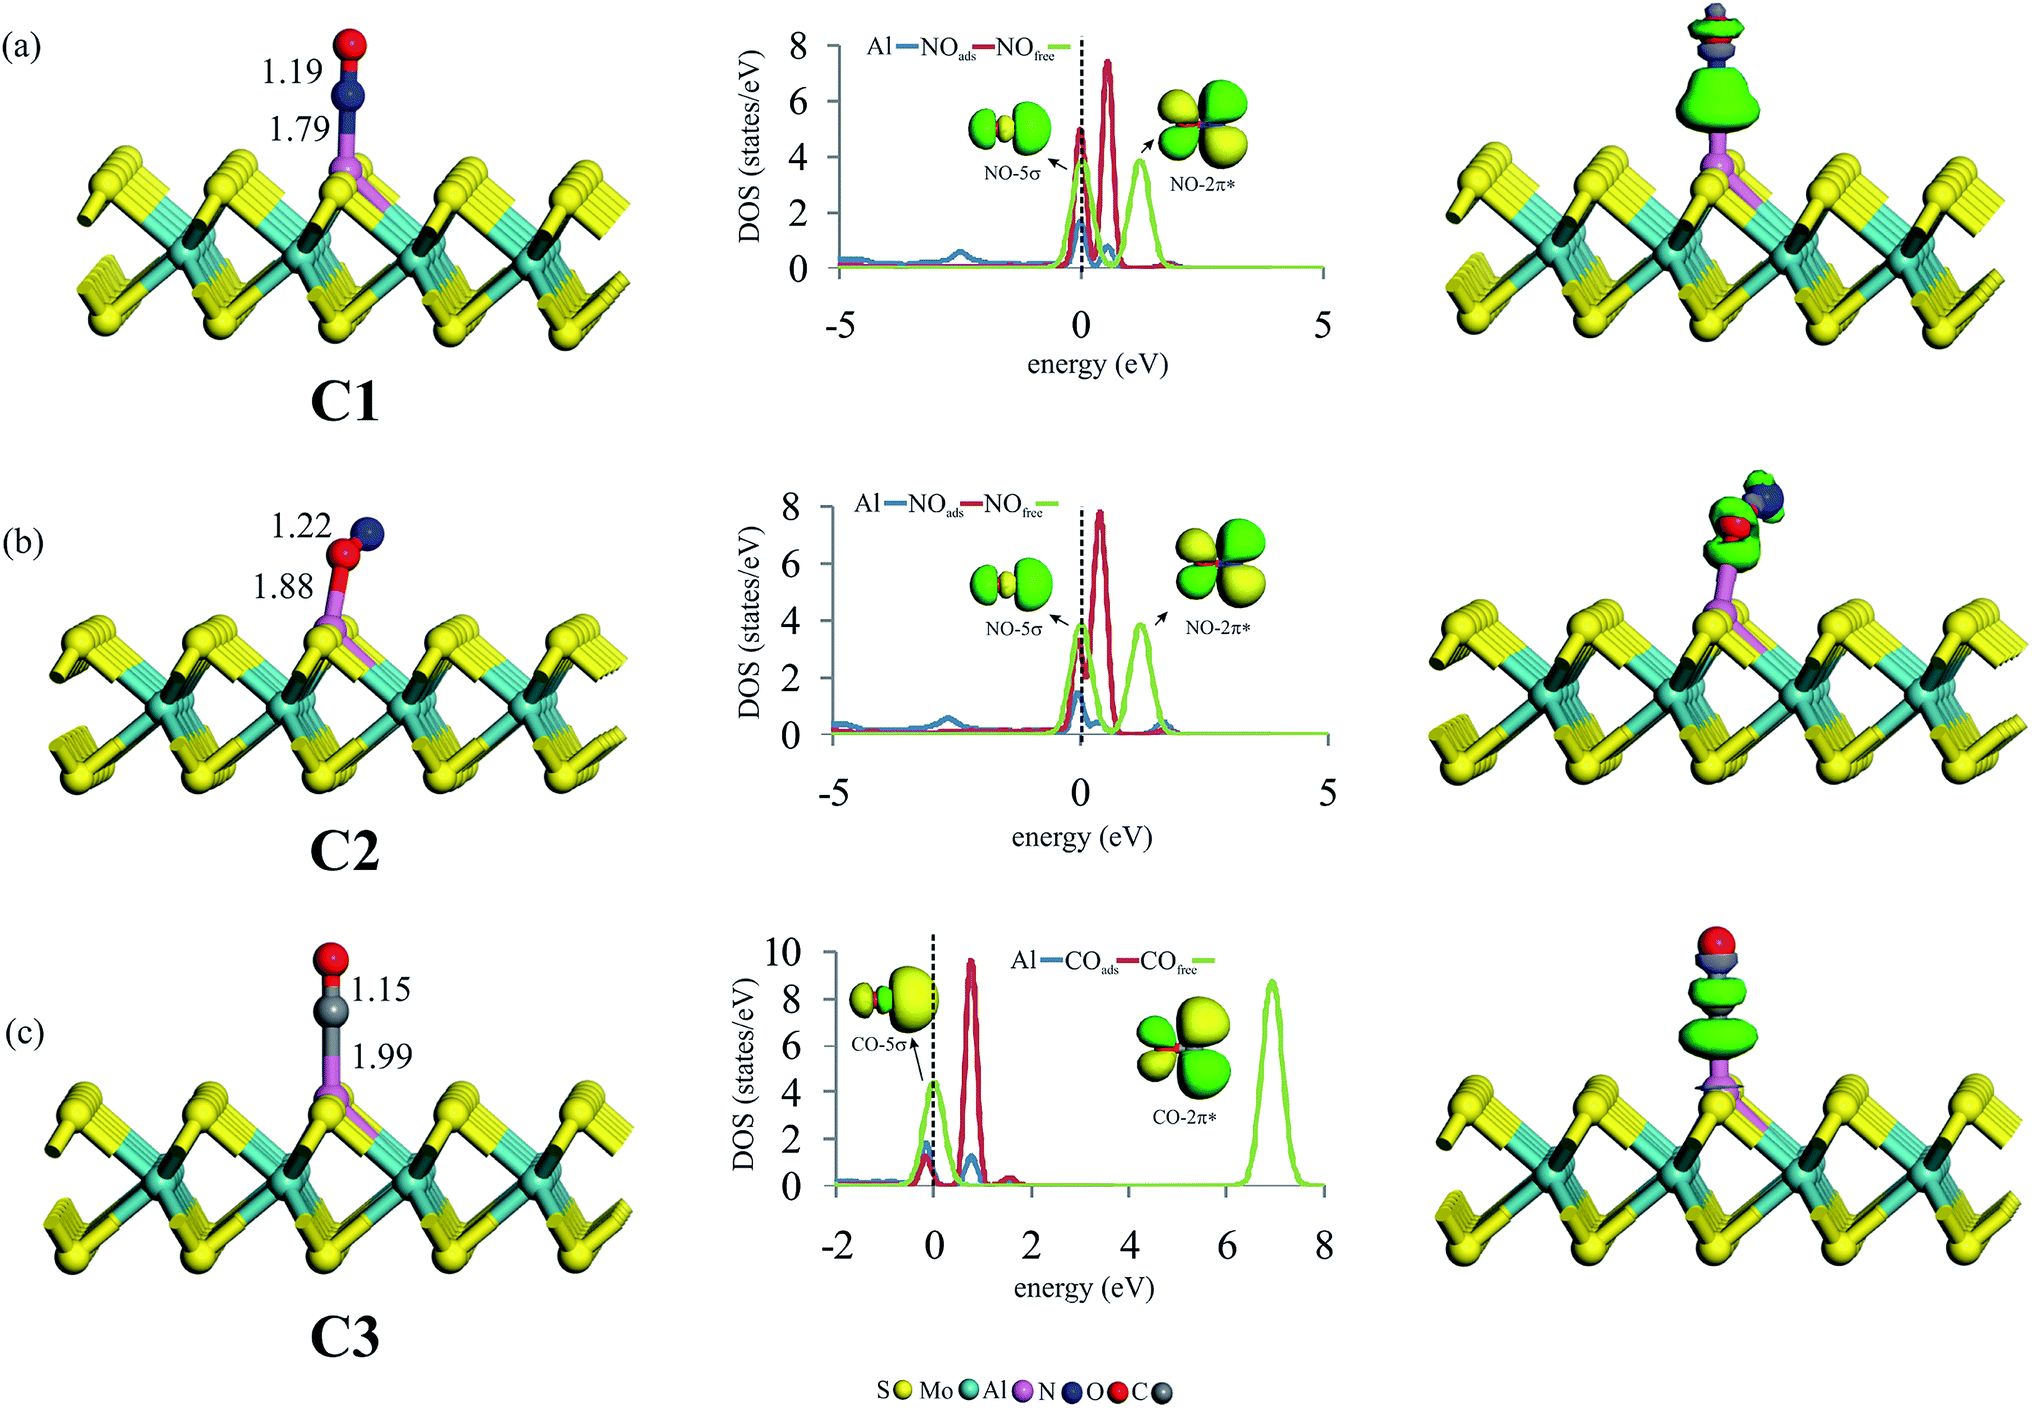 | ||
| Fig. 2 The geometry configuration, PDOS and EDD plots of (a) NO, (b) ON and (c) CO adsorbed over Al–MoS2. The dashed line in the PDOS plots shows the Fermi level (set to be zero). The green and violet colors in the EDD plots indicate electron density accumulation and loss regions, respectively. | ||
| Species (configuration) | Eads | qCTa |
|---|---|---|
| a A positive qCT value indicates the charge-transfer from the adsorbate to the surface, while a negative qCT value indicates the charge-transfer from the surface to the adsorbate. | ||
| NO (C1) | −1.92 | −0.06 |
| NO (C2) | −1.01 | −0.05 |
| CO (C3) | −1.34 | +0.13 |
| 2NO (D1) | −4.71 | −0.52 |
| 2NO (D2) | −3.55 | −0.44 |
Looking at Fig. 2a and b, one can see that NO molecule adsorbs onto Al–MoS2 through either its N- (configuration C1) or O-site (configuration C2). For both configurations, it is found that NO adopts a linear configuration above Al atom, like as those reported on other nanostructures.7,59,60 The minimum distance between NO and Al atom in C1 is 1.79 Å, which is shorter than that of C2 (1.88 Å). Moreover, comparing the Eads values in Table 1 reveals that the formation of C1 configuration is about 0.90 eV more favorable than C2. This result is in accordance with those of other reported theoretical works,61 and might be ascribed to the greater contribution of the N atom in the single-occupied molecular orbital (SOMO) of NO molecule (Fig. S2†). From Table 1, it is found that the adsorption of NO is accompanied with a shift of 0.05 |e| from Al–MoS2 to NO, which occupy the half-filed 2π* orbital of NO and hence leads to an increase in the N–O bond distance. Such a favorable orbital interaction can be also understood from the PDOS plots in Fig. 2a and b, in which the 3p states of Al atom are considerably mixed with the 2π* states of NO around the Fermi level. Note that because of the stronger interaction, this orbital hybridization is more dominant for the configuration C1 than C2. As indicated in Fig. 2a and b, the adsorption of NO on the title surface leads to a considerable shift in the energy of NO-2π* states. Meanwhile, the energy of the NO-5σ state remains almost unchanged. Besides, the corresponding EDD maps reveals that the adsorption of NO molecule induces a considerable electron density redistribution above NO molecule. In particular, a large electron density accumulation between the Al and NO in C1 implies the formation of a strong covalent Al–N bond, and hence the chemisorption of NO.
From Fig. 2c, it is found that CO is chemisorbed over the Al atom and forms an Al–C bond with a length of 1.99 Å (configuration C3). The C–O bond distance of the adsorbed CO is stretched to 1.15 Å, which is 0.01 Å larger than that of isolated CO (1.14 Å). This indicates that CO is also activated over Al–MoS2 substrate. The calculated Eads and qCT values of CO are −1.34 eV and 0.13 |e|, respectively, demonstrating that it is strongly chemisorbed on the Al atom. Note that the obtained Eads value is in good agreement with that of reported in the earlier study (−1.30 eV).42 Considering the PDOS plots, the CO adsorption onto the Al atom is mostly ascribed to the hybridization of empty Al-3p and filled CO-5σ states around the Fermi level. Consequently, the density of states arising from the 5σ state of adsorbed CO is smaller than that of free CO molecule. On the other hand, there also exists an orbital mixing between the Al-3p and empty CO-2π* orbitals, which accounts for the elongation and activation of C–O bond. This results in also a notable shift in the energy of CO-2π* states towards the Fermi level (Fig. 2c). These findings are supported by the EDD map in Fig. 2c, in which the chemisorption of CO onto the Al atom is characterized by a large electron density redistribution on the interacting moieties. Interestingly, the depletion of electron density between the C and O atoms of CO verifies the charge-transfer from the substrate to the CO-2π* orbital. Noteworthy is that the Eads value for the adsorption of CO (configuration C3) is less than that of NO (configuration C1), suggesting that the tendency of Al–MoS2 to capture CO molecule is lower than NO. That is, in the presence of a CO/NO mixture as a reaction gas, the active site of the catalyst (i.e., Al atom) would be covered by NO molecules. Hence, the CO poisoning of Al–MoS2 would be avoided.
Reaction mechanisms of NO reduction
To study the potential of Al–MoS2 as a catalyst for reduction of NO to N2O, both the well-known “direct dissociation” and “dimer” mechanisms are investigated.61 The former mechanism involves dissociation of NO molecule into Nads and Oads species, both adsorbed onto the catalyst surface. After that, the second NO attacks the Nads to yield N2O molecule. On the other hand, NO molecule in the dimer mechanism is attached to the pre-adsorbed NO to produce (NO)2 species, which its subsequent dissociation results in N2O and Oads moieties. Fig. 3–6 show the optimized stationary points on the potential energy surfaces of these reaction mechanisms. Table 2 also summarizes the thermally corrected energy barrier (at 298 K and 1 atm), the corresponding imaginary frequency, change of enthalpy and Gibbs free energy for the different reaction steps of NO reduction these reaction steps on Al–MoS2.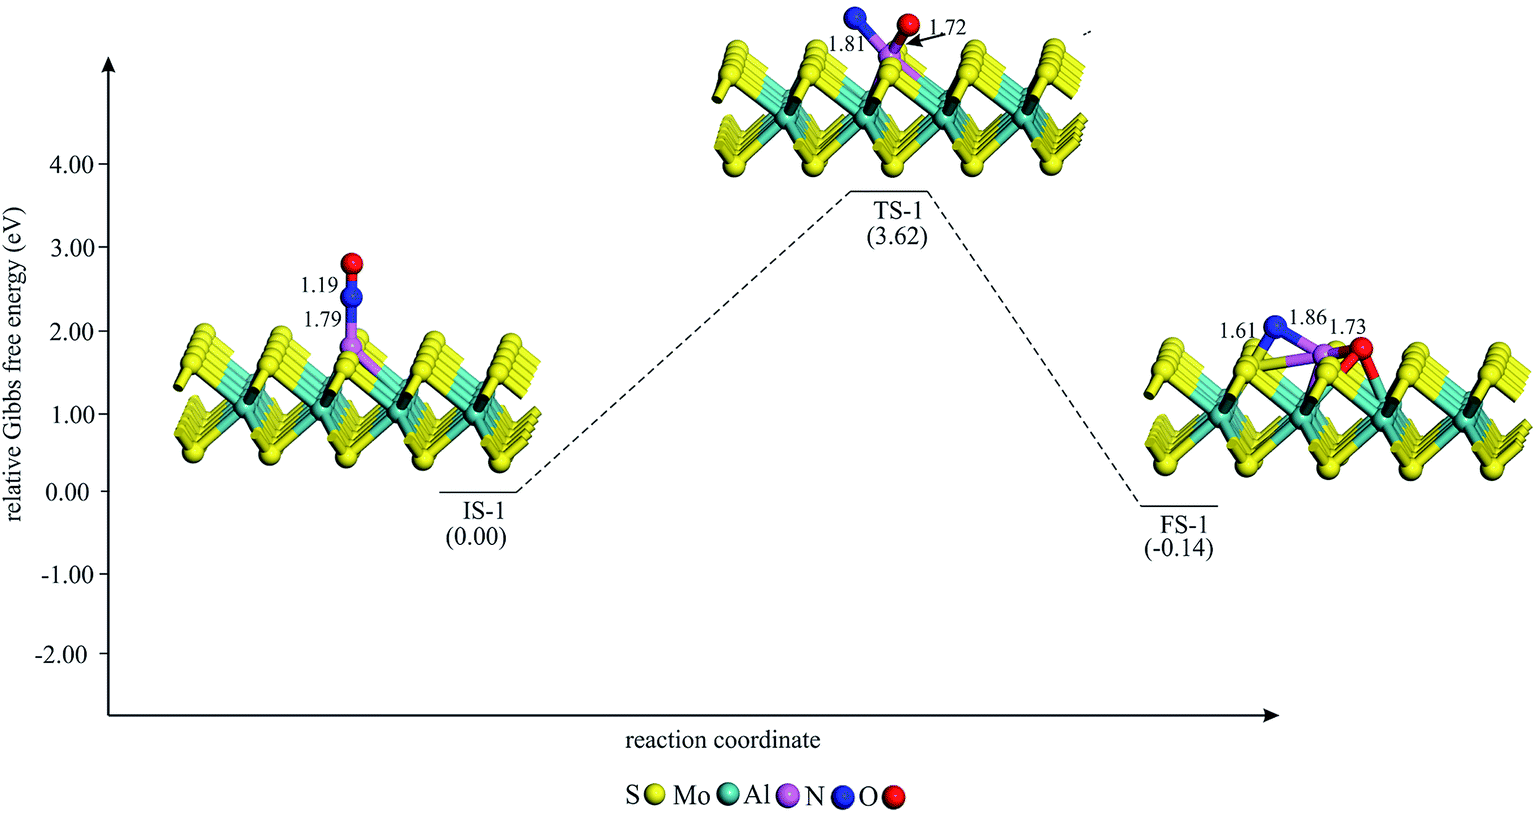 | ||
| Fig. 3 The Gibbs free energy profile for the dissociation of (NO)2 moiety on Al–MoS2. All bonds distances are in Å. | ||
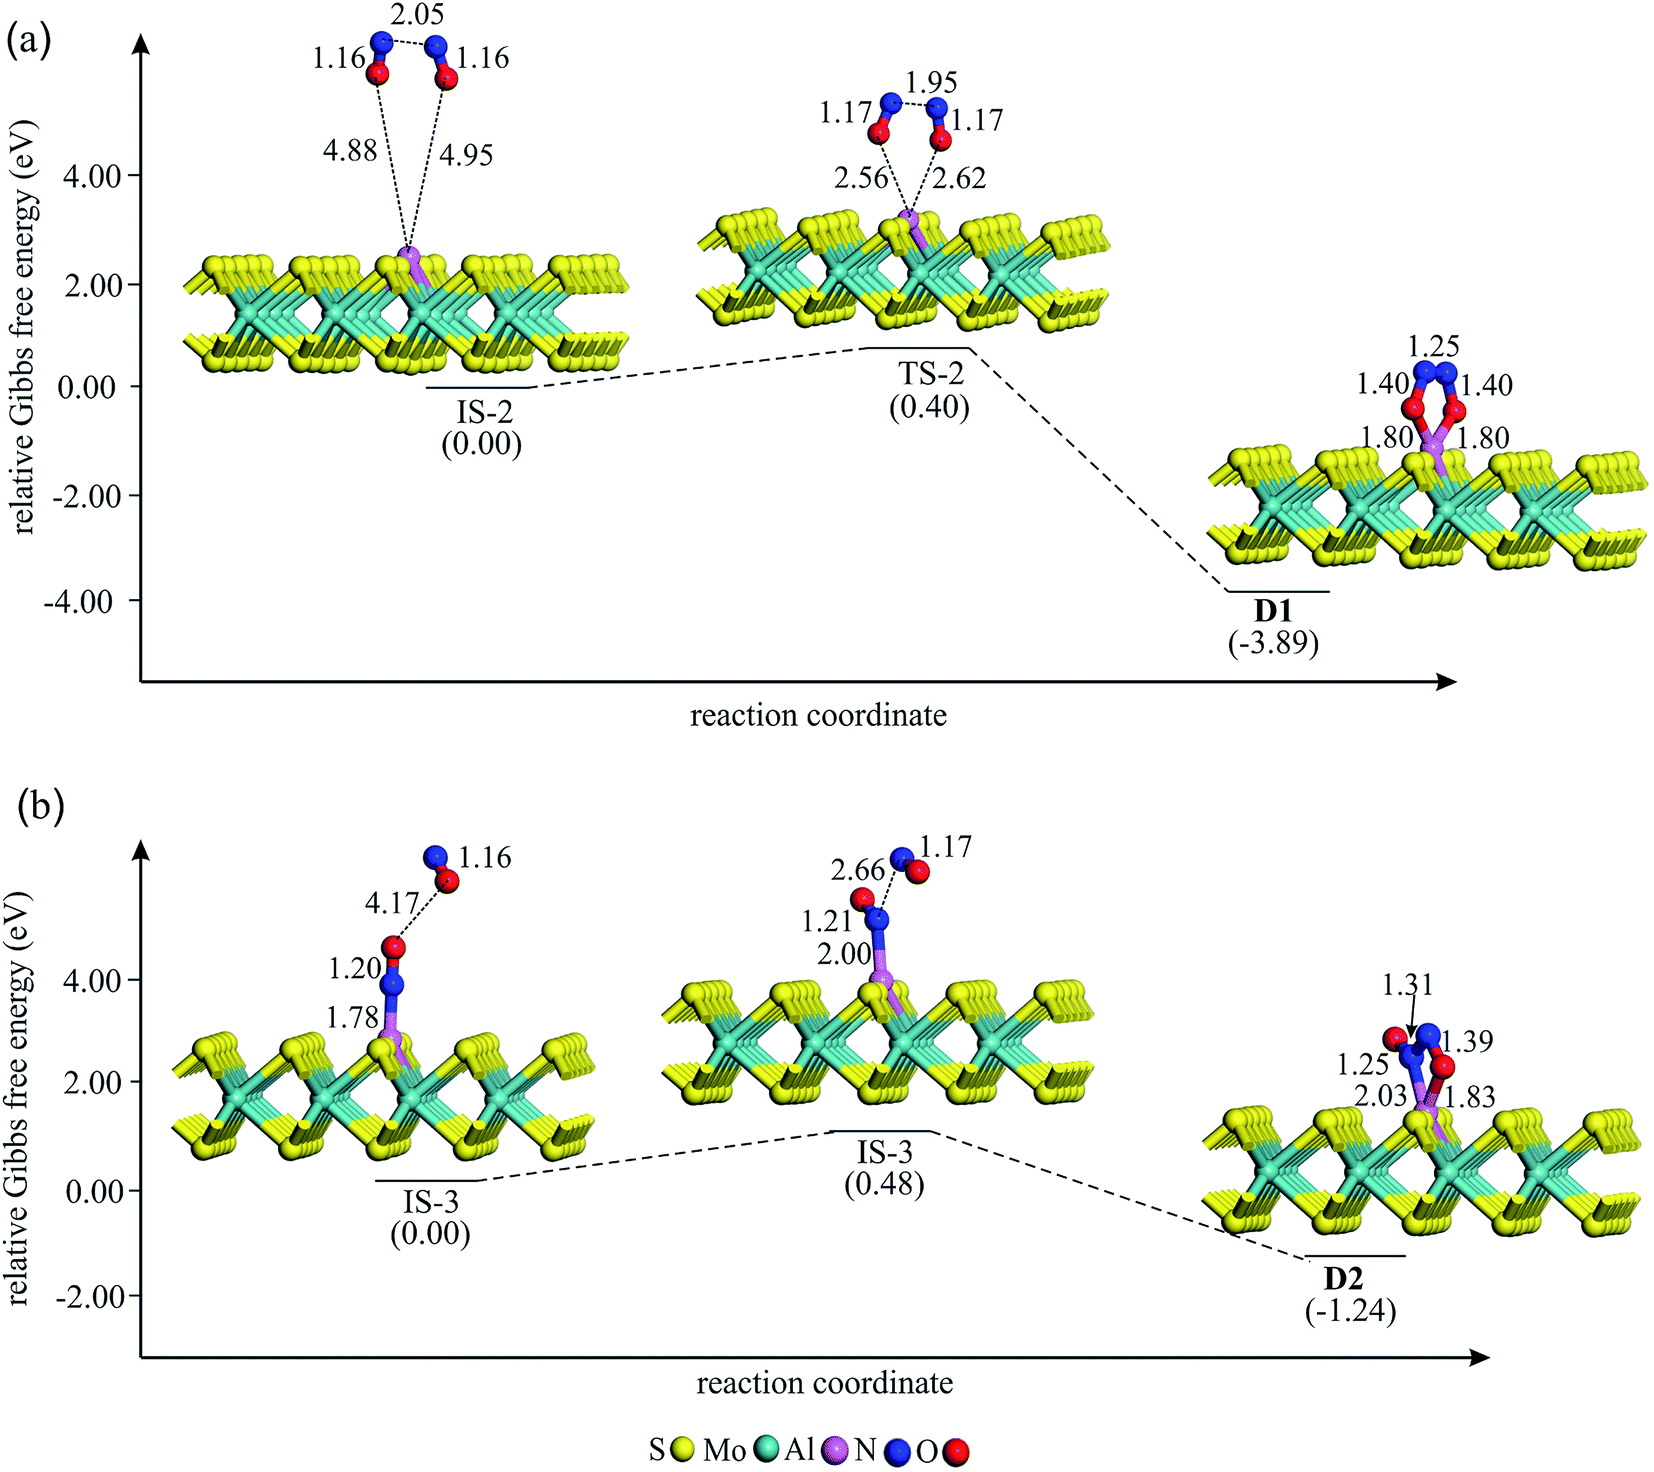 | ||
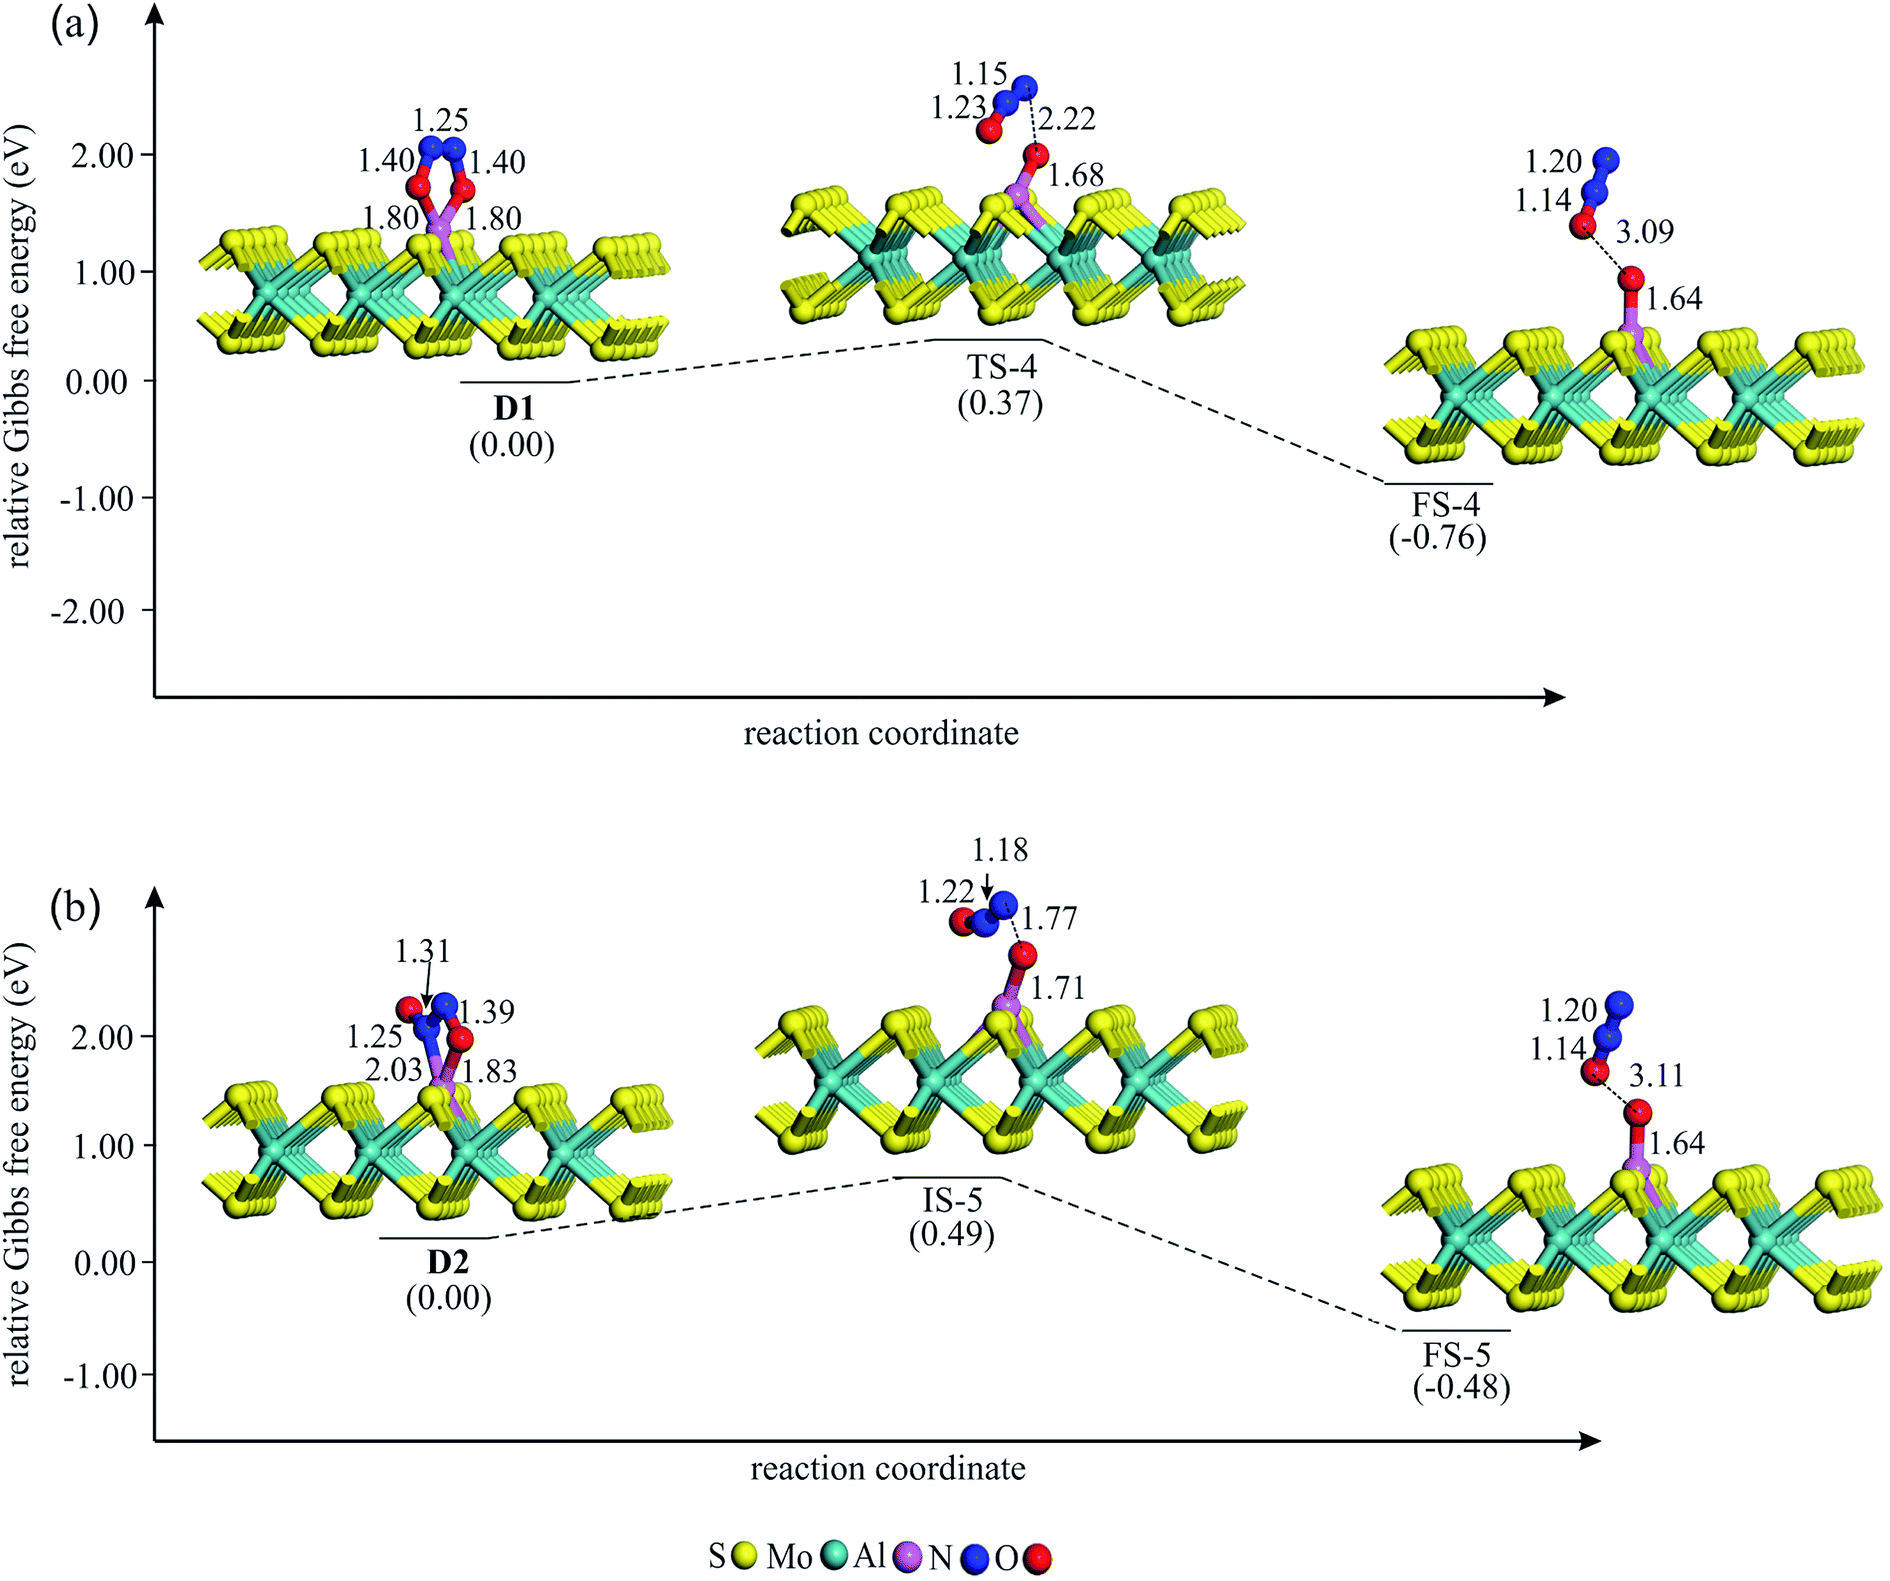
| Fig. 4 The Gibbs free energy profile and relaxed stationary points for the coadsorption of (NO)2 moiety to form (a) D1 and (b) D2 complexes on Al–MoS2. All bonds distances are in Å. | ||
 | ||
| Fig. 5 The Gibbs free energy profile and relaxed stationary points for the dissociation of (NO)2 on Al–MoS2. All bonds distances are in Å. | ||
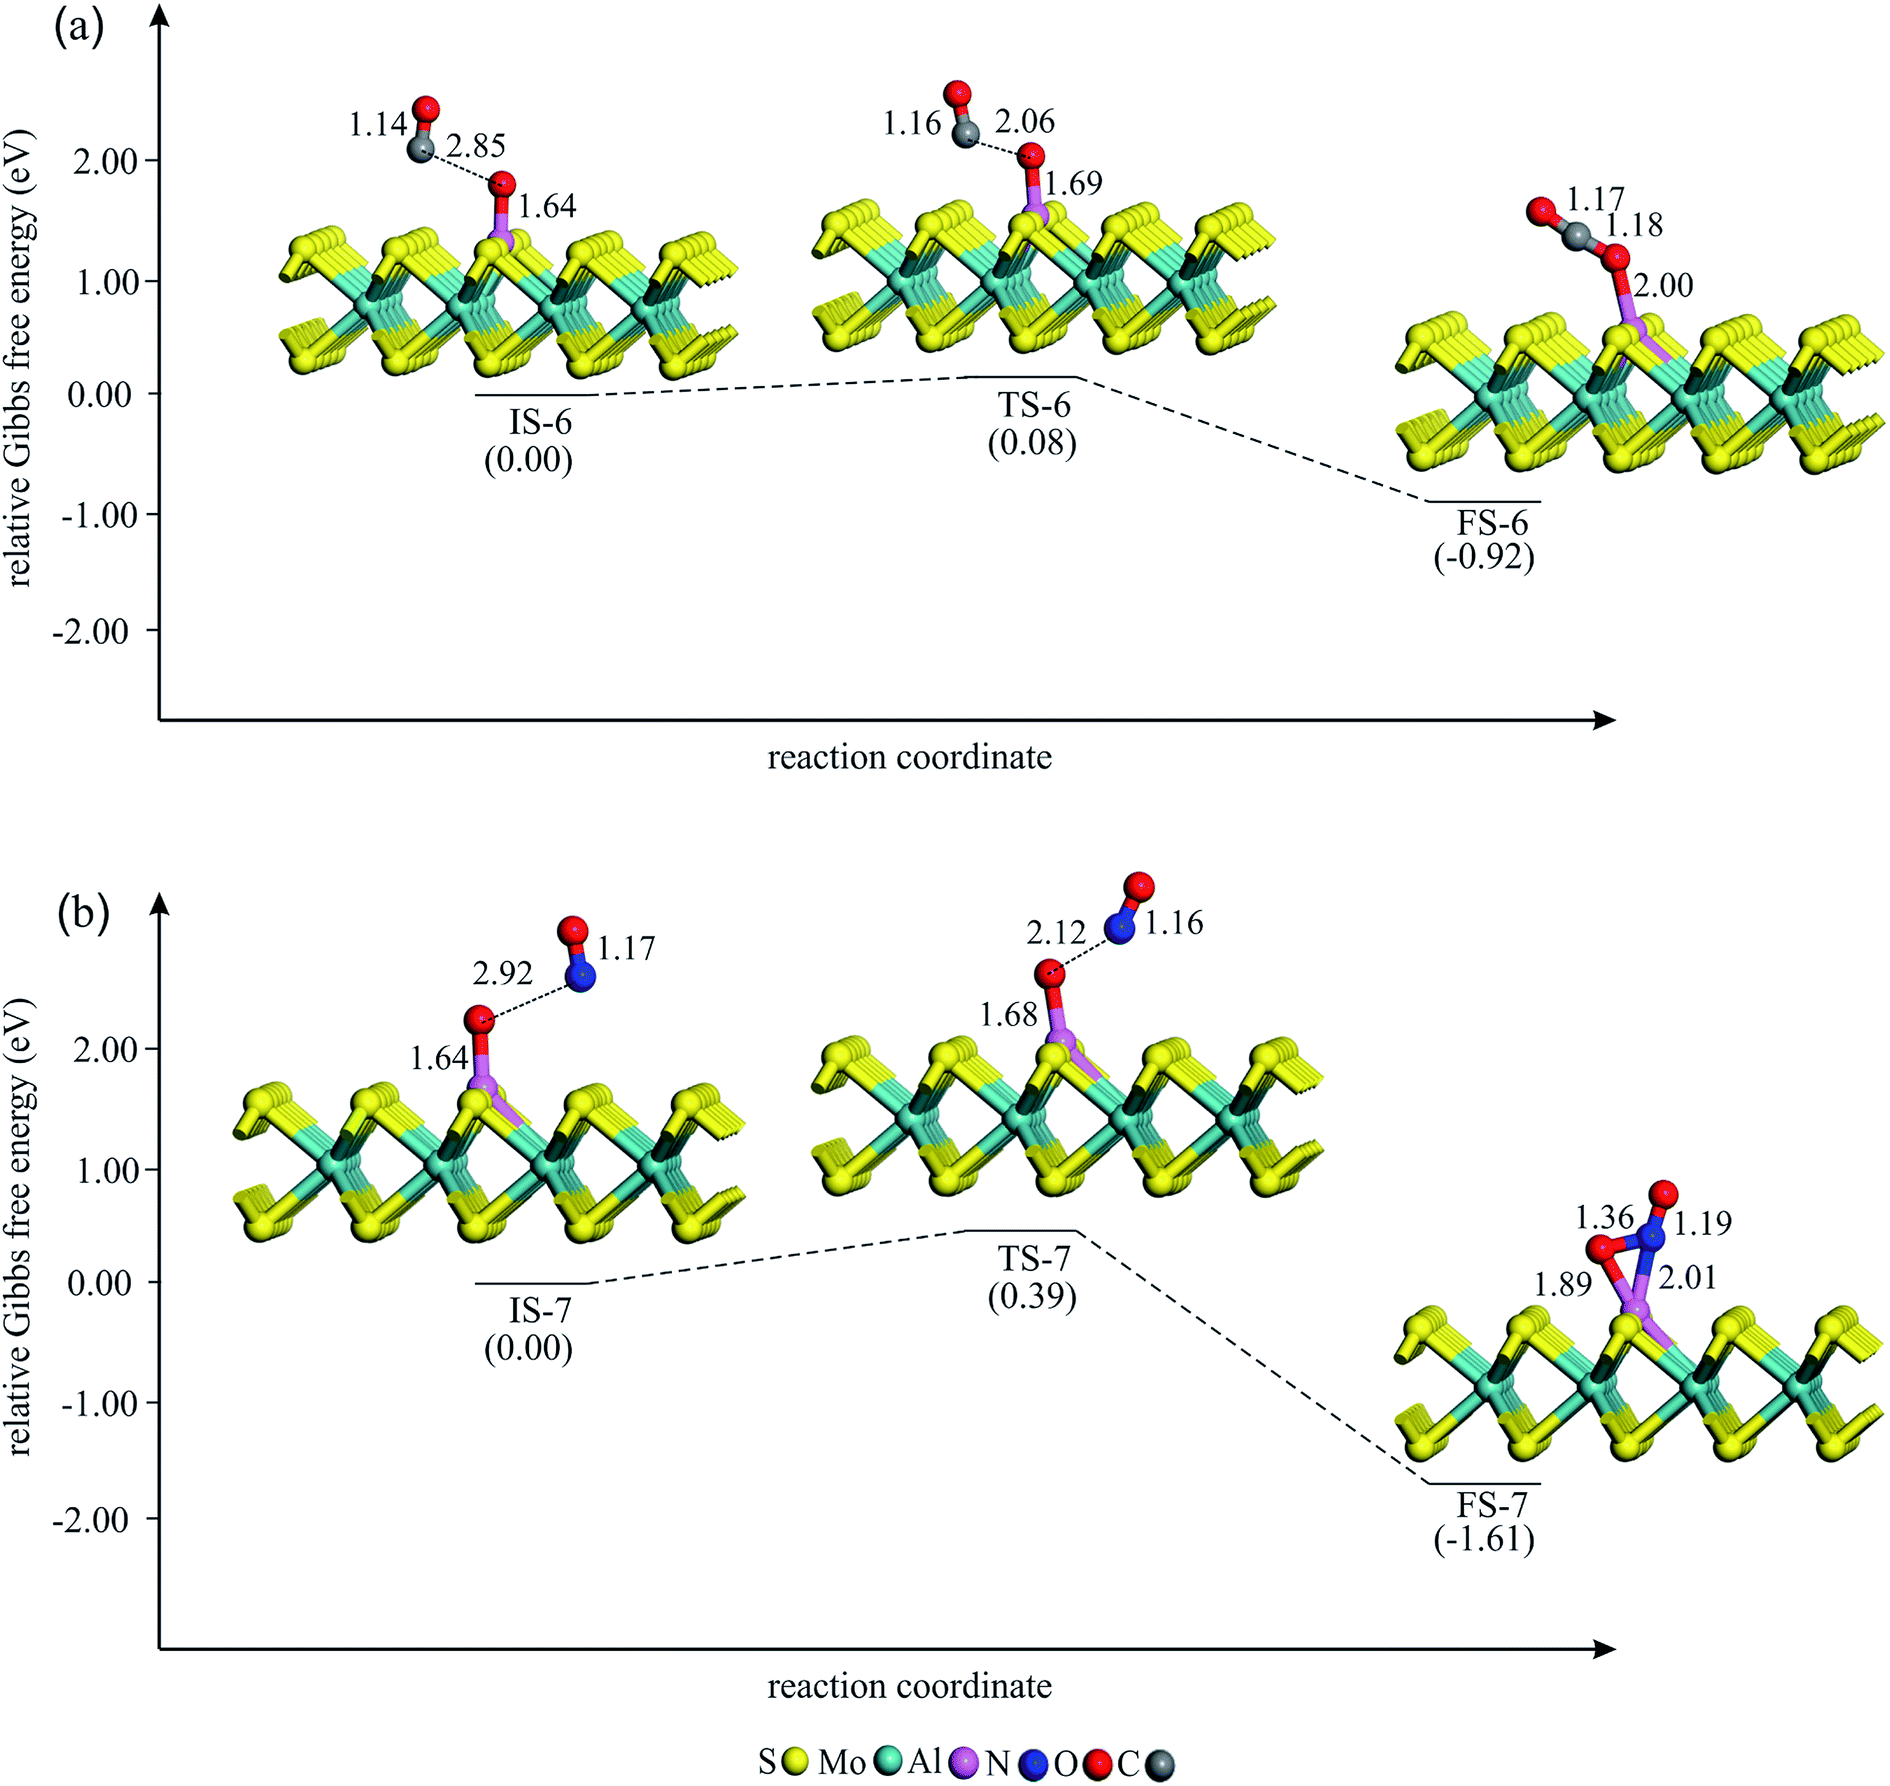 | ||
| Fig. 6 The Gibbs free energy profile and relaxed stationary points for the removal of Oads by (a) CO and (b) NO molecule. All bonds distances are in Å. | ||
| Reaction | Ebar | ν | ΔH298 | ΔG298 |
|---|---|---|---|---|
| IS-1 → FS-1 | 3.62 | 786i | −0.32 | −0.14 |
| IS-2 → D1 | 0.40 | 808i | −4.48 | −3.89 |
| IS-3 → D2 | 0.48 | 748i | −1.60 | −1.24 |
| D1 → FS-4 | 0.37 | 692i | −0.62 | −0.76 |
| D2 → FS-5 | 0.49 | 927i | −0.40 | −0.48 |
| IS-6 → FS-6 | 0.08 | 826i | −1.26 | −0.92 |
| IS-7 → FS-7 | 0.39 | 664i | −1.95 | −1.61 |
Providing that NO reduction follows the direct mechanism, the adsorbed NO should be first dissociated into Nads and Oads species. The Gibbs free energy profile for the dissociation of NO is given in Fig. 3. As evident, the most stable adsorption configuration of NO (i.e., C1) is adopted as the initial state for this process (IS-1 in Fig. 3). Next, the bond distance between the N and O atoms increases until the final state FS-1 is achieved. At FS-1, the Nads and Oads moieties are strongly chemisorbed between the Mo and S atom of the surface. Owning to the formation of new chemical bonds in FS-1, this process is exothermic by 0.32 eV. In addition, the Gibbs free energy change (ΔG298) for this reaction is negative by 0.14 eV, indicating that it is a thermodynamically favorable process at normal condition (Table 2). However, the large energy barrier (3.62 eV) to reach FS-1 shows that the dissociation of NO cannot be completed at ambient temperature. Therefore, the direct dissociation mechanism is unlikely to happen over the Al–MoS2 substrate.
If NO reduction proceeds via the dimer mechanism, two NO molecules should be first coadsorbed over the catalyst. Fig. 4 shows the potential energy diagram and corresponding stationary points involved in the formation of coadsorbed NO configurations. After careful structural optimizations, two most stable coadsorbed configurations are found for the NO molecules (configurations D1 and D2 in Fig. 4). In both configurations, NO molecules are attached together via their N atoms. The optimized N–N bond lengths in D1 and D2 are calculated to be 1.25 and 1.31 Å, which are longer than the experimental N–N bond distance (1.970 Å) in gas phase (NO)2.62 As Fig. 4a indicates, (NO)2 dimer in D1 adopts a trapezoid OadsNNOads configuration in which NO molecules are attached to the Al atom through their O-site. From Fig. 4, it is evident that the calculated energy barrier required for the formation of D1 is only 0.40 eV, which suggests that it can be easily completed at ambient condition. Meanwhile, the change of enthalpy (ΔH298) and Gibbs free energy (ΔG298) is negative by −4.48 and −3.89 eV, respectively, demonstrating that this reaction is exothermic and a thermodynamically favorable process at room temperature (Table 2). From Table 1, it is also seen that about 0.50 |e| shift from the substrate to NO molecules in D1, which is largely accumulated over the Oads atoms. Unlike D1, NO molecules in D2 adopt a trans ONadsNOads configuration in which the Al–Nads and Al–Oads bond distances are 2.03 and 1.83 Å, respectively. The coadsorption energy of NO molecules in D2 is −3.55 eV, which is 1.16 eV smaller (less negative) than that of D1. As shown in Fig. 4b, an energy barrier of 0.48 eV should be overcome to reach D2, which is larger than the obtained value for D1. From Table 2, one can see that the formation of D2 is also accompanied with a large negative ΔH298 and ΔG298 values. These results, together with the large coadsorption energies and low energy barriers, indicate that the dimer mechanism should be the most favored pathway to reduce the NO molecules.
In the next step, (NO)2 moiety is dissociated over Al–MoS2 to form N2O and Oads species. Fig. 5 gives the optimized geometry of different stationary points involved in this reaction step. Starting from the coadsorbed NO configurations, one of the N–Oads bond of (NO)2 is elongated until the N2O and Oads species are formed on the Al–MoS2 substrate. This leads to 0.12 |e| increase in the positive charge of the Al atom. From Table 2, it is seen that this process is exothermic for both D1 and D2 configurations. The corresponding transition state structures TS-4 and TS-5 are characterized by an imaginary frequency of 692 and 927 cm−1, respectively, which is related to the cleavage of Al–N, Al–O or N–O bonds. The corresponding energy barrier is calculated to be 0.37 and 0.49 eV, which implies that this reaction step is most likely to complete at normal conditions. We note that these energy barriers are smaller than those reported values over traditional noble metals, like Ag.4 Finally, the produced N2O molecule detaches from the surface owning to its small Eads value (−0.12 eV).
In the final step of the reaction, the Oads is removed from the Al atom by interacting with the CO molecule. To this aim, a CO molecule is allowed to approach the Oads. The Gibbs free energy profile for the CO + Oads → CO2 process is shown in Fig. 6a. The Hirshfeld charge density analysis reveals that about 0.45 electrons transfer from the Al–MoS2 substrate to the Oads. At IS-6, the C atom of CO is about 2.80 Å away from the Oads and the Eads value of CO is obtained to be about −0.20 eV. As CO approaches the Oads, the Al–Oads bond distance continually increases and finally CO2 molecule is reached on the Al atom. Meanwhile, the atomic charge on the Oads decreases from IS-6 to FS-6. From Table 2, this reaction step is thermodynamically favored (ΔG298 = −0.92 eV) and needs a very small activation energy (0.08 eV). Note that this activation energy is much smaller than the reported value for the removing of the Oads species from Pd (0.91 eV), Ru (1.68 eV) and Pt (0.79 eV) surfaces63 or transition metal-doped C2N (≈0.50 eV).64 Also, the energy barrier for the CO + Oads → CO2 reaction on Al–MoS2 is smaller than those of reported over Si- (0.29 eV) and Se-doped graphene (0.68 eV),65 indicating the high catalytic performance of the former system toward the oxidation of CO. Besides, this energy barrier is almost identical with that of reported value by Li and co-workers in the ref. 42. On the other hand, the Eads value of CO2 is only −0.14 eV, which is less than the proposed value by Deng et al. (−0.52 eV)66 to hinder the poisoning of catalyst at ambient temperature. Thus, the formed CO2 molecule detaches from the Al atom and this refreshes the catalyst surface to initiate a new round of the reaction.
One can expect that the Oads may also interact with a NO molecule to produce NO2. The energy profile for this side reaction is given in Fig. 6b. As evident, this reaction step begins with the physisorption of the NO molecule. This leads to the formation of the initial state structure IS-6, in which NO is about 3 Å far from the Oads. Passing the transition state TS-6 with an energy barrier of 0.39 eV, the Al–Oads bond breaks and finally NO2 molecule is formed on the Al atom. The Hirshfeld analysis indicates that the atomic charge on the Oads decreases from −0.45 to −0.18 |e| during this reaction step. The produced NO2 in FS-6 attaches the Al atom via its N atom, with the N–O bonds oriented upwards, like as those other reported studies.67–70 This process is highly exothermic (ΔH298 = −1.95 eV) and thermodynamically feasible at normal temperature. However, unlike CO2, NO2 is found to interact strongly with the Al atom, and thus blocks the active site of catalyst. However, the larger activation energy of the NO + Oads → NO2 compared to CO + Oads → CO2 guaranties that the former reaction should be almost impossible over the Al–MoS2 substrate.
4. Conclusions
Using the first-principles calculations, the reactions pathways and activation energies of NO reduction catalyzed over Al–MoS2 were investigated. Our computations indicated that the doping of Al atom could greatly tune the surface properties and electronic structure of MoS2. The reduction of NO molecules over Al–MoS2 follows the dimer mechanism, initiated by the coadsorption of two NO molecules and formation of (NO)2 moiety on the Al atom. The latter process was found to be exothermic. The subsequent dissociation of (NO)2 moiety into N2O and Oads was found to need 0.37 eV activation energies. The Oads is then eliminated by addition of a CO molecule by overcoming a very small activation energy (0.08 eV). These results suggest that Al–MoS2 may be used as a novel catalyst with high efficiency and stability for reduction of NO molecules.Conflicts of interest
The authors declare they have no conflict of interest.Acknowledgements
The authors would like to thank the “Computational Center of University of Maragheh” for its technical support of this work.References
- A. C. Stern, Fundamentals of air pollution, Elsevier, 2014 Search PubMed.
- M. Kampa and E. Castanas, Environ. Pollut., 2008, 151, 362–367 CrossRef CAS PubMed.
- Z.-P. Liu and P. Hu, Top. Catal., 2004, 28, 71–78 CrossRef CAS.
- Z.-P. Liu, S. J. Jenkins and D. A. King, J. Am. Chem. Soc., 2004, 126, 7336–7340 CrossRef CAS PubMed.
- L. Ilieva, G. Pantaleo, I. Ivanov, R. Nedyalkova, A. M. Venezia and D. Andreeva, Catal. Today, 2008, 139, 168–173 CrossRef CAS.
- A. Patel, P. Shukla, T. E. Rufford, V. Rudolph and Z. Zhu, Chem. Eng. J., 2014, 255, 437–444 CrossRef CAS.
- X. Zhang, Z. Lu, Y. Tang, Z. Fu, D. Ma and Z. Yang, Phys. Chem. Chem. Phys., 2014, 16, 20561–20569 RSC.
- A. Eichler and J. Hafner, J. Catal., 2001, 204, 118–128 CrossRef CAS.
- Z.-P. Liu and P. Hu, Top. Catal., 2004, 28, 71–78 CrossRef CAS.
- Z.-P. Liu, S. J. Jenkins and D. A. King, J. Am. Chem. Soc., 2004, 126, 7336–7340 CrossRef CAS PubMed.
- F. Rondinelli, N. Russo and M. Toscano, J. Chem. Theory Comput., 2008, 4, 1886–1890 CrossRef CAS PubMed.
- S. Roy and A. Baiker, Chem. Rev., 2009, 109, 4054–4091 CrossRef CAS PubMed.
- U. Elizundia, D. Duraiswami, B. Pereda-Ayo, R. López-Fonseca and J. R. González-Velasco, Catal. Today, 2011, 176, 324–327 CrossRef CAS.
- W.-C. Ding, X.-K. Gu, H.-Y. Su and W.-X. Li, J. Phys. Chem. C, 2014, 118, 12216–12223 CrossRef CAS.
- K. Thirunavukkarasu, K. Thirumoorthy, J. Libuda and C. S. Gopinath, J. Phys. Chem. B, 2005, 109, 13272–13282 CrossRef CAS PubMed.
- Y. Wang, D. Zhang, Z. Yu and C. Liu, J. Phys. Chem. C, 2010, 114, 2711–2716 CrossRef CAS.
- T. Wehling, K. Novoselov, S. Morozov, E. Vdovin, M. Katsnelson, A. Geim and A. Lichtenstein, Nano Lett., 2008, 8, 173–177 CrossRef CAS PubMed.
- Z. Ao, S. Li and Q. Jiang, Solid State Commun., 2010, 150, 680–683 CrossRef CAS.
- L. Qu, Y. Liu, J.-B. Baek and L. Dai, ACS Nano, 2010, 4, 1321–1326 CrossRef CAS PubMed.
- N. Song, Y. Wang, H. Gao, W. Jiang, J. Zhang, B. Xu, Q. Sun and Y. Jia, Phys. Lett. A, 2015, 379, 815–819 CrossRef CAS.
- H. Luo, Y. Cao, J. Zhou, J. Feng, J. Cao and H. Guo, Chem. Phys. Lett., 2016, 643, 27–33 CrossRef CAS.
- Z. Lu, P. Lv, Y. Liang, D. Ma, Y. Zhang, W. Zhang, X. Yang and Z. Yang, Phys. Chem. Chem. Phys., 2016, 18, 21865–21870 RSC.
- M. D. Esrafili, P. Mousavian and F. A. Rad, J. Mol. Graphics Modell., 2018, 82, 101–107 CrossRef CAS PubMed.
- K. Kakaei, M. D. Esrafili and A. Ehsani, in Interface Science and Technology, ed. K. Kakaei, M. D. Esrafili and A. Ehsani, Elsevier, 2019, vol. 27, pp. 387–437 Search PubMed.
- A. Splendiani, L. Sun, Y. Zhang, T. Li, J. Kim, C.-Y. Chim, G. Galli and F. Wang, Nano Lett., 2010, 10, 1271–1275 CrossRef CAS PubMed.
- G. Eda, H. Yamaguchi, D. Voiry, T. Fujita, M. Chen and M. Chhowalla, Nano Lett., 2011, 11, 5111–5116 CrossRef CAS PubMed.
- D. Merki and X. Hu, Energy Environ. Sci., 2011, 4, 3878–3888 RSC.
- J. D. Benck, T. R. Hellstern, J. Kibsgaard, P. Chakthranont and T. F. Jaramillo, ACS Catal., 2014, 4, 3957–3971 CrossRef CAS.
- B. Hinnemann, P. G. Moses, J. Bonde, K. P. Jørgensen, J. H. Nielsen, S. Horch, I. Chorkendorff and J. K. Nørskov, J. Am. Chem. Soc., 2005, 127, 5308–5309 CrossRef CAS PubMed.
- Y. Yin, J. Han, Y. Zhang, X. Zhang, P. Xu, Q. Yuan, L. Samad, X. Wang, Y. Wang and Z. Zhang, J. Am. Chem. Soc., 2016, 138, 7965–7972 CrossRef CAS PubMed.
- H. Li, M. Du, M. J. Mleczko, A. L. Koh, Y. Nishi, E. Pop, A. J. Bard and X. Zheng, J. Am. Chem. Soc., 2016, 138, 5123–5129 CrossRef CAS PubMed.
- C. González, B. Biel and Y. J. Dappe, Phys. Chem. Chem. Phys., 2017, 19, 9485–9499 RSC.
- K. Zhang, S. Feng, J. Wang, A. Azcatl, N. Lu, R. Addou, N. Wang, C. Zhou, J. Lerach and V. Bojan, Nano Lett., 2015, 15, 6586–6591 CrossRef CAS PubMed.
- D. Ma, W. Ju, T. Li, X. Zhang, C. He, B. Ma, Z. Lu and Z. Yang, Appl. Surf. Sci., 2016, 383, 98–105 CrossRef CAS.
- D. Ma, W. Ju, T. Li, G. Yang, C. He, B. Ma, Y. Tang, Z. Lu and Z. Yang, Appl. Surf. Sci., 2016, 371, 180–188 CrossRef CAS.
- D. Mombrú, R. Faccio and Á. W. Mombrú, Appl. Surf. Sci., 2018, 462, 409–416 CrossRef.
- X. Dai, K. Du, Z. Li, M. Liu, Y. Ma, H. Sun, X. Zhang and Y. Yang, ACS Appl. Mater. Interfaces, 2015, 7, 27242–27253 CrossRef CAS PubMed.
- Y. C. Lin, D. O. Dumcenco, H. P. Komsa, Y. Niimi, A. V. Krasheninnikov, Y. S. Huang and K. Suenaga, Adv. Mater., 2014, 26, 2857–2861 CrossRef CAS PubMed.
- D. Ma, Y. Tang, G. Yang, J. Zeng, C. He and Z. Lu, Appl. Surf. Sci., 2015, 328, 71–77 CrossRef CAS.
- B. Xiao, P. Zhang, L. Han and Z. Wen, Appl. Surf. Sci., 2015, 354, 221–228 CrossRef CAS.
- S. Park, J. Park, H. Abroshan, L. Zhang, J. K. Kim, J. Zhang, J. Guo, S. Siahrostami and X. Zheng, ACS Energy Lett., 2018, 3, 2685–2693 CrossRef CAS.
- D. Li, W. Li and J. Zhang, Appl. Surf. Sci., 2019, 484, 1297–1303 CrossRef CAS.
- R. Addou, L. Colombo and R. M. Wallace, ACS Appl. Mater. Interfaces, 2015, 7, 11921–11929 CrossRef CAS PubMed.
- M. Houssa, K. Iordanidou, G. Pourtois, V. Afanas'ev and A. Stesmans, Appl. Surf. Sci., 2017, 416, 853–857 CrossRef CAS.
- L.-p. Feng, J. Su, S. Chen and Z.-t. Liu, Mater. Chem. Phys., 2014, 148, 5–9 CrossRef CAS.
- H. Li, C. Tsai, A. L. Koh, L. Cai, A. W. Contryman, A. H. Fragapane, J. Zhao, H. S. Han, H. C. Manoharan and F. Abild-Pedersen, Nat. Mater., 2016, 15, 48 CrossRef CAS PubMed.
- H.-P. Komsa, S. Kurasch, O. Lehtinen, U. Kaiser and A. V. Krasheninnikov, Phys. Rev. B: Condens. Matter Mater. Phys., 2013, 88, 035301 CrossRef.
- S. Kretschmer, H.-P. Komsa, P. Bøggild and A. V. Krasheninnikov, J. Phys. Chem. Lett., 2017, 8, 3061–3067 CrossRef CAS PubMed.
- C. Ataca and S. Ciraci, Phys. Rev. B: Condens. Matter Mater. Phys., 2012, 85, 195410 CrossRef.
- B. Delley, J. Chem. Phys., 1990, 92, 508–517 CrossRef CAS.
- B. Delley, J. Chem. Phys., 2000, 113, 7756–7764 CrossRef CAS.
- J. P. Perdew, K. Burke and M. Ernzerhof, Phys. Rev. Lett., 1996, 77, 3865–3868 CrossRef CAS PubMed.
- B. Delley, Phys. Rev. B: Condens. Matter Mater. Phys., 2002, 66, 155125 CrossRef.
- S. Grimme, J. Comput. Chem., 2004, 25, 1463–1473 CrossRef CAS PubMed.
- S. Grimme, J. Comput. Chem., 2006, 27, 1787–1799 CrossRef CAS PubMed.
- Y. Jing, X. Tan, Z. Zhou and P. Shen, J. Mater. Chem. A, 2014, 2, 16892–16897 RSC.
- A. Basak, D. Das, D. Sen and K. Chattopadhyay, Comput. Mater. Sci., 2014, 95, 399–407 CrossRef CAS.
- C. Kittel, P. McEuen and P. McEuen, Introduction to Solid State Physics, Wiley New York, 1996 Search PubMed.
- Y. Xie, Y.-P. Huo and J.-M. Zhang, Appl. Surf. Sci., 2012, 258, 6391–6397 CrossRef CAS.
- M. D. Esrafili, Chem. Phys. Lett., 2018, 695, 131–137 CrossRef CAS.
- Y. Chen, Y.-j. Liu, H.-x. Wang, J.-x. Zhao, Q.-h. Cai, X.-z. Wang and Y.-h. Ding, ACS Appl. Mater. Interfaces, 2013, 5, 5994–6000 CrossRef CAS PubMed.
- C. E. Dinerman and G. E. Ewing, J. Chem. Phys., 1970, 53, 626–631 CrossRef CAS.
- X.-Q. Gong, Z.-P. Liu, R. Raval and P. Hu, J. Am. Chem. Soc., 2004, 126, 8–9 CrossRef CAS PubMed.
- D. W. Ma, Q. Wang, X. Yan, X. Zhang, C. He, D. Zhou, Y. Tang, Z. Lu and Z. Yang, Carbon, 2016, 105, 463–473 CrossRef CAS.
- R. Gholizadeh and Y.-X. Yu, Appl. Surf. Sci., 2015, 357, 1187–1195 CrossRef CAS.
- Q. Deng, L. Zhao, X. Gao, M. Zhang, Y. Luo and Y. Zhao, Small, 2013, 9, 3506–3513 CrossRef CAS PubMed.
- Y.-H. Zhang, Y.-B. Chen, K.-G. Zhou, C.-H. Liu, J. Zeng, H.-L. Zhang and Y. Peng, Nanotechnology, 2009, 20, 185504 CrossRef PubMed.
- J. Dai, J. Yuan and P. Giannozzi, Appl. Phys. Lett., 2009, 95, 232105 CrossRef.
- R. Lv, G. Chen, Q. Li, A. McCreary, A. Botello-Méndez, S. Morozov, L. Liang, X. Declerck, N. Perea-López and D. A. Cullen, Proc. Natl. Acad. Sci. U. S. A., 2015, 112, 14527–14532 CrossRef CAS PubMed.
- Z. Xie, X. Zuo, G.-P. Zhang, Z.-L. Li and C.-K. Wang, Chem. Phys. Lett., 2016, 657, 18–25 CrossRef CAS.
Footnote |
| † Electronic supplementary information (ESI) available. See DOI: 10.1039/c9ra05759e |
| This journal is © The Royal Society of Chemistry 2019 |