 Open Access Article
A high-efficiency salamo-based copper(II) complex double-channel fluorescent probe†
Zhi-Li Wei,
Lan Wang,
Shuang-Zhu Guo,
Yang Zhang and
Wen-Kui Dong *
*
College of Chemical and Biological Engineering, Lanzhou Jiaotong University, Lanzhou, Gansu 730070, China. E-mail: dongwk@126.com
First published on 13th December 2019
Abstract
In this paper, a salamo-based copper(II) complex probe L-Cu2+ was synthesized, which combined with copper(II) ions to form L-Cu2+ for the detection of S2− and had a good fluorescence chemical response. Through spectral analysis, we found that S2− could be identified with high sensitivity and selectivity in the presence of various anions and could be used for the detection of S2− by the naked eye. With the addition of S2−, the solution color changed from colorless to bright yellow. UV absorption, fluorescence and other characterization methods were carried out, and the mechanism of action was determined. In addition, we performed a visual inspection of H2S gas, and the probe L-Cu2+ could detect S2− in the gas molecules, revealing its potential application value in biology and medicine.
Introduction
As is well known, Cu2+ and S2− play vital roles in the entire life system, and sulfides exist widely in nature and have certain toxicity.1 The discharge of sulfur-containing pollutants has seriously threatened the environment and human health.2 This not only pollutes soil and water resources, but also releases hydrogen sulfide gas in acidic environments, resulting in air pollution. Due to the nature of the sulfur ion itself, its detection of environmental and physiology has become a very meaningful task.3 Among the many detection methods, fluorescence detection4 has the advantages of simple operation, high sensitivity, and good selectivity, and it is widely used in the field of ion detection optical imaging.5 The sensitive detection of the hydrogen sulfide content in living cells will help understand the pathogenesis of hydrogen sulfide.6 Based on the chemical and biological properties of salen7 and salamo-based complexes,8–10 we synthesized a highly efficient selective and sensitive complex to detect sulfur ions.11 Fluorescence properties change significantly when responding to a specific analyte; the fluorescence signal is used as a detection means to convert the identification information into an optical signal,12 and the analyte is quantitatively and qualitatively detected.13 The probe molecule L-Cu2+ had an obvious color effect on S2−, which could bind S2− well in the presence of various anions, and the UV absorbance showed obvious changes;14 this indicated that S2− can be recognized by L-Cu2+ double channels. In addition, after entering H2S, it was found that L-Cu2+ could detect S2− in H2S with naked eye recognition.Experiment
Materials and measurements
The drugs and instruments used in this paper are shown in the ESI.†The synthetic method of the ligands H2L
H2L was synthesized by the same method published by our lab and therefore, it is not repeated here15 (Scheme 1).The synthetic method of the probe L-Cu2+
H2L and copper(II) nitrate were weighed in an equimolar ratio, dissolved in an ethanol solution, stirred for 4 hours and then made up to 100 mL and formulated into 1.0 × 10⁻⁴ mol L−1 ethanol solution. The ligand H2L was used as a 1.0 × 10⁻⁴ mol L−1 ethanol solution and anions as a 1.0 × 10⁻³ mol L−1 EtOH/H2O (10![[thin space (1/6-em)]](https://www.rsc.org/images/entities/char_2009.gif) :
:![[thin space (1/6-em)]](https://www.rsc.org/images/entities/char_2009.gif) 1) solution.
1) solution.
Results and discussion
UV-vis absorption spectroscopy
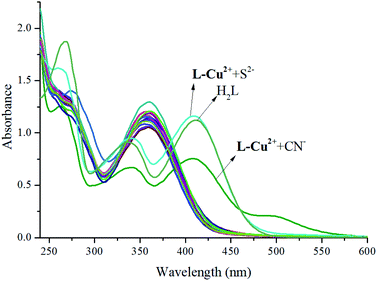
UV absorption spectrum anion full-scanning experiment: 1 mL of L-Cu2+ stock solution was added to the sample cell and then, 0.9 mL of ethanol and 0.1 mL of deionized water were added to test its UV absorption spectrum as a control experiment. The absorption band of L-Cu2+ at around 357 nm was attributed to H2L and the d–d electron transition of the ligand to Cu2+ after Cu2+ coordination. Various anion storage solutions of 1 mL were added to the solution of L-Cu2+ (1 mL), and the changes in the UV absorption spectra were measured. It was found that only when S2− or CN− was added, there was a significant change in the UV-vis absorption spectrum, and there were two new peaks at 343 and 413 nm. In addition, the UV absorption peaks of the H2L EtOH/H2O (10![[thin space (1/6-em)]](https://www.rsc.org/images/entities/char_2009.gif) :
:![[thin space (1/6-em)]](https://www.rsc.org/images/entities/char_2009.gif) 1) solution were used as the control experiment. It was found that the peak shape and height of H2L in the EtOH/H2O solution were consistent with those for the L-Cu2+ solution after adding S2− ions. The experimental results showed that the probe molecules could detect S2− or CN− efficiently in an EtOH/H2O (10
1) solution were used as the control experiment. It was found that the peak shape and height of H2L in the EtOH/H2O solution were consistent with those for the L-Cu2+ solution after adding S2− ions. The experimental results showed that the probe molecules could detect S2− or CN− efficiently in an EtOH/H2O (10![[thin space (1/6-em)]](https://www.rsc.org/images/entities/char_2009.gif) :
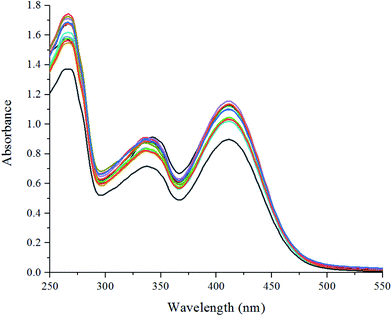
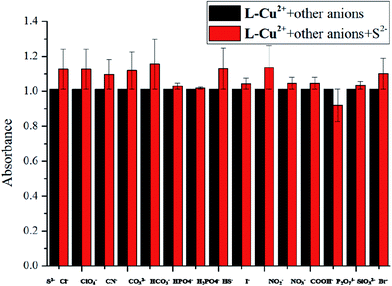
:![[thin space (1/6-em)]](https://www.rsc.org/images/entities/char_2009.gif) 1) solution. As shown in Fig. 1, the solution color varied significantly from colorless to bright yellow. The color of the solution and the UV absorption intensity after the addition of other anions did not change significantly but they changed only upon increasing the single addition of S2−; this indicated that the probe molecules have good sensitivity and selectivity for the recognition of S2− and other common anions do not affect the recognition results (Fig. 2). The intensity of the absorption peak at 413 nm was taken from S2− and the other anions were added to make a column chart (Fig. 3). It can be clearly seen from this diagram that the increase in other anions causes little interference with the recognition of S2−. The probe molecule can conveniently and effectively detect S2− in the EtOH/H2O (10
1) solution. As shown in Fig. 1, the solution color varied significantly from colorless to bright yellow. The color of the solution and the UV absorption intensity after the addition of other anions did not change significantly but they changed only upon increasing the single addition of S2−; this indicated that the probe molecules have good sensitivity and selectivity for the recognition of S2− and other common anions do not affect the recognition results (Fig. 2). The intensity of the absorption peak at 413 nm was taken from S2− and the other anions were added to make a column chart (Fig. 3). It can be clearly seen from this diagram that the increase in other anions causes little interference with the recognition of S2−. The probe molecule can conveniently and effectively detect S2− in the EtOH/H2O (10![[thin space (1/6-em)]](https://www.rsc.org/images/entities/char_2009.gif) :
:![[thin space (1/6-em)]](https://www.rsc.org/images/entities/char_2009.gif) 1) solution, which has a good application prospect.
1) solution, which has a good application prospect.
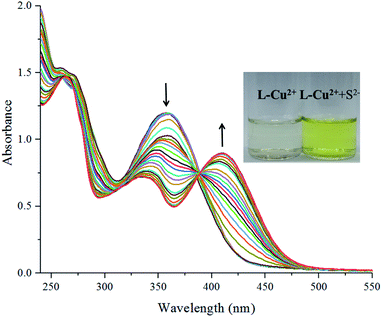
In the ultraviolet spectrum titration experiment, the sample was accumulated to 2 mL of the sensor EtOH solution by the same method. As shown in Fig. 4, it could be seen that as the S2− concentration increased, new absorption peaks appeared at 343 and 413 nm; the intensity gradually changed, and the titration reached the end point until the ion concentration reached 1 equivalent.
Fluorescence spectroscopy
When 1 equivalent of a 10-fold concentration of sixteen anions of the EtOH/H2O (10![[thin space (1/6-em)]](https://www.rsc.org/images/entities/char_2009.gif) :
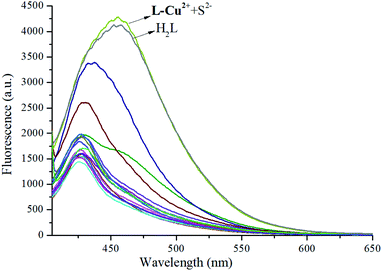
:![[thin space (1/6-em)]](https://www.rsc.org/images/entities/char_2009.gif) 1) solution was added to the ethanol solution of the probe molecules, a bright yellow color change could be observed by the naked eye due to the action of the probe molecule and S2− (Fig. 5). Furthermore, when the excitation wavelength was 375 nm, the fluorescence emission intensity was weak, but the addition of S2− caused a strong fluorescence emission peak at 455 nm and a redshift of 25 nm (Fig. 6). It was proven that the sensor molecule can detect S2− through two channels. In addition, the fluorescence emission peak of H2L in the EtOH/H2O (10
1) solution was added to the ethanol solution of the probe molecules, a bright yellow color change could be observed by the naked eye due to the action of the probe molecule and S2− (Fig. 5). Furthermore, when the excitation wavelength was 375 nm, the fluorescence emission intensity was weak, but the addition of S2− caused a strong fluorescence emission peak at 455 nm and a redshift of 25 nm (Fig. 6). It was proven that the sensor molecule can detect S2− through two channels. In addition, the fluorescence emission peak of H2L in the EtOH/H2O (10![[thin space (1/6-em)]](https://www.rsc.org/images/entities/char_2009.gif) :
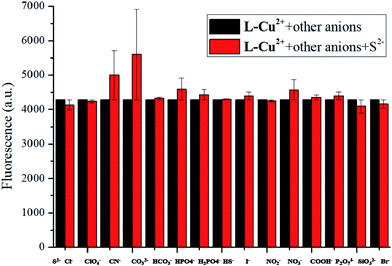
:![[thin space (1/6-em)]](https://www.rsc.org/images/entities/char_2009.gif) 1) solution was tested as a control experiment, and it was found that the addition of S2− in the L-Cu2+ ethanol solution could restore the fluorescence emission peak of H2L. It can be seen from Fig. 7 that the addition of other anions to the solution has no significant effect on the ability of the probe molecule to recognize S2−. It was concluded that the probe molecule has a good anti-interference performance against other anions in the fluorescence emission spectrum of S2−. In order to verify the binding ratio between the probe molecule and S2−, a fluorescence titration experiment was performed.
1) solution was tested as a control experiment, and it was found that the addition of S2− in the L-Cu2+ ethanol solution could restore the fluorescence emission peak of H2L. It can be seen from Fig. 7 that the addition of other anions to the solution has no significant effect on the ability of the probe molecule to recognize S2−. It was concluded that the probe molecule has a good anti-interference performance against other anions in the fluorescence emission spectrum of S2−. In order to verify the binding ratio between the probe molecule and S2−, a fluorescence titration experiment was performed.
In the titration experiment, the excitation wavelength was 375 nm. As shown in Fig. 8, as different amounts of S2− were added dropwise to the ethanol solution of the probe molecule, the fluorescence intensity of the main peak gradually increased with a gradual redshift. When 1.0 equivalent of S2− was added, the fluorescence intensity did not increase, indicating the end of the fluorescence titration. As depicted in Fig. S1,† the binding constant of the receptor molecule L-Cu2+ and S2− was K = 0.5 × 10⁴, and the lowest detection limit was LOD = 3.27 × 10−8.15 In addition, pH control experiments showed that the sensor L-Cu2+ can effectively identify S2− in the range of pH = 3–8 (Fig. 9).
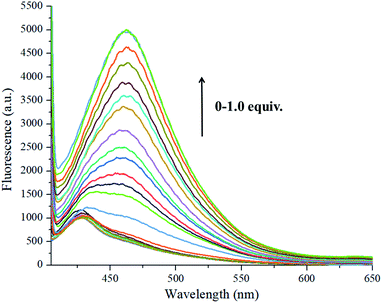 | ||
| Fig. 8 Fluorescence spectra of probe L-Cu2+ solution (5 × 10⁻⁵) upon the increase in S2− (0–1.0 equivalent). | ||
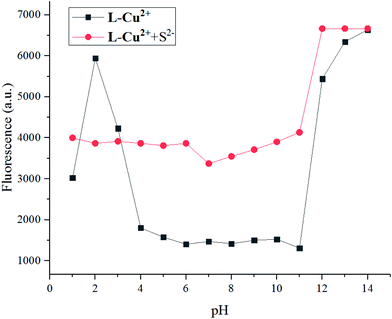 | ||
| Fig. 9 The black dotted line diagram shows the L-Cu2+ fluorescence spectrum at different pH conditions; the red dotted line shows the fluorescence spectrum test results with the addition of S2−. | ||
Mechanism research
The probe molecule has an absorption peak at 357 nm. With the addition of S2−, Cu2+ was bound by S2−, and absorption peaks appeared at 343 and 413 nm. On increasing the S2− concentration, the peak at 343 nm decreased, the absorption peak at 413 nm was enhanced, and a ratio-type response to S2− was achieved. In the linear range, the ratio signal changed by a factor of 20. This probe has no response to various anions outside S2− and CN− and has good selectivity. The solution changed from colorless to bright yellow before and after the reaction; thus, S2− can be determined by colorimetry. In the fluorescence experiment, the ligand acted as a donor, and Cu2+ acted as a receptor to form the L-Cu2+ complex. The fluorescence disappeared due to the quenching effect of Cu2+. Excess S2− was added, and the fluorescence was recovered, exhibiting the stronger binding ability of S2− and Cu2+, which caused the ligand fluorescence to be restored.By mass spectrometry, it can be seen that a significant peak at m/z 398.2 was in agreement with the molecular ion peak of the ligand (Fig. S2(a)†), and a peak appeared at m/z 437.1 (Fig. S2(b)†), which should be attributed to L-Cu2+, indicating the line of the complex L-Cu2+. Then, NaS was added and further mass spectrometry was performed. As can be seen from Fig. S2(c),† a molecular ion peak appeared at m/z 398.2 that corresponded to the ligand. It is fully demonstrated that S2− combines with Cu2+ in the complex to form CuS. At the same time, L-Cu2+ released Cu2+ therein and returned to the ligand state (Fig. 10).
 | ||
| Fig. 10 Schematic diagram of the structure of the probe molecule and its two-channel visualization detection of S2−. | ||
H2S gas detection
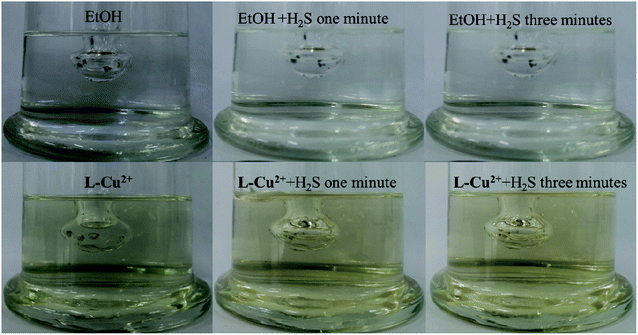
H2SO4 (60 mL, 3 mol L−1) was added to Na2S to prepare H2S gas, which was then introduced into pure ethanol and the L-Cu2+ ethanol solution sequentially. In the presence of H2S, the probe solution deepened gradually from pale yellow, and it was easily recognized by the naked eye. However, the pure ethanol solution did not change significantly. Fig. 11 shows the color change trends one minute and three minutes after H2S gas was introduced into the ethanol solution and L-Cu2+ solution. The color remained almost unchanged for 3 h, which indicated that the probe had good stability in identifying H2S and could meet the needs for analysis and detection. The formation of an acidic environment by the introduction of H2S gas and the lack of water in the solution that hindered the formation of intramolecular hydrogen bonds broke the rigid environment of the molecules and turned the solution brown. As shown in Fig. 12, when water was added to the probe L-Cu2+ solution containing H2S gas, the color of the solution changed from brown to yellow. | ||
| Fig. 12 120 μL to 3 mL of water was added into L-Cu2+ solution containing H2S gas, and the color of the solution gradually returned to bright yellow. | ||
Conclusions
In summary, we synthesized a salamo-based Cu2+ complex probe L-Cu2+ according to the literature, which could be identified with S2− in the UV absorption spectrum and fluorescence spectrum. Mass spectrometry showed that S2− and S2−-bound Cu2+ when added to L-Cu2+ formed stable CuS. As shown in Fig. 1, after the addition of S2−, the absorption peak at 357 nm disappeared, and new absorption peaks appeared at 343 and 413 nm, thereby establishing a ratio type probe for measuring S2−. Similarly, in the fluorescence experiment, as S2− was added to L-Cu2+, the reaction system produced a new fluorescence peak at 455 nm, and the intensity was continuously enhanced. The fluorescence intensity at 455 nm was plotted as a bar graph, as shown in Fig. 7. After adding various anions to L-Cu2+, S2− was added, and the fluorescence intensity did not significantly interfere. This indicated that L-Cu2+ has good selectivity for S2− in fluorescence experiments. Our experimental results showed that the probe molecule has the property of detecting S2− in the gas. Also, when H2S was introduced into the ethanol solution of the probe molecule, the color of the solution changed with time to form a brown solution. Our experiments showed that it can achieve fast, accurate and real-time monitoring of H2S gas and it has potential application values. In addition, we compared other S2− recognizing probes with our work, as shown in Table 1.Conflicts of interest
There are no conflicts to declare.Acknowledgements
This work was supported by Science and Technology Program of Gansu Province (18YF1GA054), the National Natural Science Foundation of China (21761018) and the Program for Excellent Team of Scientific Research in Lanzhou Jiaotong University (201706), three of which are gratefully acknowledged.References
- (a) J. Hennemann, C. D. Kohl and B. M. Smarsly, Sens. Actuators, B, 2015, 217, 41–50 CrossRef CAS; (b) C. Baker, W. Laminack and J. L. Gole, Sens. Actuators, B, 2015, 212, 28–34 CrossRef CAS; (c) K. J. Radford and G. A. Cutter, Anal. Chem., 1993, 65, 976–982 CrossRef; (d) P. R. Berube, P. D. Parkinson and E. R. Hall, J. Chromatogr. A, 1999, 830, 485–489 CrossRef CAS; (e) J. F. Li, C. X. Yin and F. J. Huo, RSC Adv., 2015, 5, 2191–2206 RSC.
- (a) L. E. Figueroa, C. Torre and S. Sayed, Eur. J. Inorg. Chem., 2014, 2014, 41–45 CrossRef; (b) E. Galardon, A. Tomas and P. Roussel, Dalton Trans., 2009, 42, 9126–9130 RSC; (c) M. Strianese, S. Milione and V. Bertolasi, Inorg. Chem., 2011, 50, 900–910 CrossRef CAS PubMed; (d) S. C. Ray, A. Saha, N. R. Jana and R. Sarkar, J. Phys. Chem. C, 2009, 113, 18546–18551 CrossRef CAS; (e) F. Gouanve, T. Schuster and E. Allard, Adv. Funct. Mater., 2007, 17, 2746–2756 CrossRef CAS; (f) T. Gunnlaugsson, T. C. Lee and R. Parkesh, Org. Lett., 2003, 5, 4065–4068 CrossRef CAS PubMed; (g) J. Y. Kwon, N. J. Singh and H. Na. Kim, J. Am. Chem. Soc., 2004, 126, 8892–8893 CrossRef CAS PubMed; (h) R. Singhal, A. Chaubey, K. Kaneto, W. Takashima and B. D. Malhotra, Biotechnol. Bioeng., 2004, 85, 277–282 CrossRef CAS PubMed.
- (a) M. Koneswaran and R. A. Narayanasw, Sens. Actuators, B, 2009, 139, 104–109 CrossRef CAS; (b) M. Colon, J. L. Todoli, M. Hidalgo and M. Iglesias, Anal. Chim. Acta, 2008, 609, 160–168 CrossRef CAS PubMed; (c) J. Li, H. J. Zhang, J. Chang, H. R. Jia and Y. X. Sun, Crystals, 2018, 8, 176 CrossRef.
- (a) B. J. Wang, W. K. Dong, Y. Zhang and S. F. Akogun, Sens. Actuators, B, 2017, 247, 254–264 CrossRef CAS; (b) J. H. Hu, Y. Sun, J. Qi, P. X. Pei, Q. Lin and Y. M. Zhang, RSC Adv., 2016, 6, 100401–100406 RSC; (c) J. H. Hu, Y. Sun, J. Qi, Q. Li and T. B. Wei, Spectrochim. Acta, Part A, 2017, 175, 125–133 CrossRef CAS PubMed.
- (a) T. Fujii, Y. Shindo and K. Hotta, J. Am. Chem. Soc., 2014, 136, 2374–2381 CrossRef CAS PubMed; (b) H. I. Lee, W. Wu and J. K. Oh, Angew. Chem., Int. Ed. Engl., 2007, 46, 2453–2457 CrossRef CAS PubMed; (c) E. S. Childress, C. A. Roberts and D. Y. Sherwood, Anal. Chem., 2012, 84, 1235–1239 CrossRef CAS PubMed; (d) J. Han and K. Burgess, Chem. Rev., 2009, 110, 2709–2728 CrossRef PubMed; (e) L. Z. Liu, L. Wang, M. Yu, Q. Zhao, Y. Zhang, Y. X. Sun and W. K. Dong, Spectrochim. Acta, Part A, 2019, 222, 117209 CrossRef CAS PubMed; (f) R. W. Sinkeldam, N. J. Greco and Y. Tor, Chem. Rev., 2010, 110, 2579–2619 CrossRef CAS PubMed.
- (a) L. Q. Chai, L. J. Tang, K. Y. Zhang, J. Y. Zhang and H. S. Zhang, Appl. Organomet. Chem., 2017, 31, e3786 CrossRef; (b) A. J. Bauer and B. R. Stockwell, Chem. Rev., 2008, 108, 1774–1786 CrossRef CAS PubMed; (c) L. W. Zhang, X. Y. Li, Q. P. Kang, L. Z. Liu, J. C. Ma and W. K. Dong, Crystals, 2018, 8, 173 CrossRef; (d) A. Gomes, E. Fernandes and L. F. C. Lima José, J. Biochem. Biophys. Methods, 2005, 65, 45–80 CrossRef CAS PubMed; (e) N. Soh, Anal. Bioanal. Chem., 2006, 386, 532–543 CrossRef CAS PubMed.
- (a) X. Q. Song, P. P. Liu, Y. A. Liu, J. J. Zhou and X. L. Wang, Dalton Trans., 2016, 45, 8154–8163 RSC; (b) X. Y. Dong, B. J. Wang, Q. P. Kang and W. K. Dong, Appl. Organomet. Chem., 2018, 32, e4373 CrossRef; (c) X. Q. Song, P. P. Liu, Z. R. Xiao, X. Li and Y. A. Liu, Inorg. Chim. Acta, 2015, 438, 232–244 CrossRef CAS; (d) J. Q. Guo, Y. X. Sun, B. Yu, J. Li and H. R. Jia, Chin. J. Inorg. Chem., 2017, 33, 1481–1488 CAS; (e) L. Q. Chai, K. H. Mao, J. Y. Zhang, K. Y. Zhang and H. S. Zhang, Inorg. Chim. Acta, 2017, 457, 34–40 CrossRef CAS; (f) H. J. Zhang, J. Chang, H. R. Jia and Y. X. Sun, Chin. J. Inorg. Chem., 2018, 34, 2261–2270 CAS; (g) J. H. Hu, J. B. Li, J. Qi and Y. Sun, Phosphorus, Sulfur, Silicon Relat. Elem., 2016, 191, 984–987 CrossRef CAS; (h) L. Zhou, Q. Hu, L. Q. Chai, K. H. Mao and H. S. Zhang, Polyhedron, 2019, 158, 102–116 CrossRef CAS; (i) L. Q. Chai, Q. Hu, K. Y. Zhang, L. Zhou and J. J. Huang, J. Lumin., 2018, 203, 234–246 CrossRef CAS; (j) L. Q. Chai, Q. Hu, K. Y. Zhang, L. C. Chen, Y. X. Li and H. S. Zhang, Appl. Organomet. Chem., 2018, 32, 4426 CrossRef.
- (a) X. X. An, Q. Zhao, H. R. Mu and W. K. Dong, Crystals, 2019, 9, 101 CrossRef CAS; (b) X. Y. Li, Q. P. Kang, C. Liu, Y. Zhang and W. K. Dong, New J. Chem., 2019, 43, 4605–4619 RSC; (c) Q. P. Kang, X. Y. Li, L. Wang, Y. Zhang and W. K. Dong, Appl. Organomet. Chem., 2019, 32, e5013 CrossRef; (d) Q. P. Kang, X. Y. Li, Z. L. Wei, Y. Zhang and W. K. Dong, Polyhedron, 2019, 165, 38–50 CrossRef CAS.
- (a) Q. Zhao, X. X. An, L. Z. Liu and W. K. Dong, Inorg. Chim. Acta, 2019, 490, 6–15 CrossRef CAS; (b) L. Z. Liu, M. Yu, X. Y. Li, Q. P. Kang and W. K. Dong, Chin. J. Inorg. Chem., 2019, 35(7), 1283–1294 CAS; (c) X. Y. Li, Q. P. Kang, L. Z. Liu, J. C. Ma and W. K. Dong, Crystals, 2018, 8, 43 CrossRef; (d) L. Gao, C. Liu, F. Wang and W. K. Dong, Crystals, 2018, 8, 77 CrossRef; (e) Y. D. Peng, X. Y. Li, Q. P. Kang, G. X. An, Y. Zhang and W. K. Dong, Crystals, 2018, 8, 107 CrossRef; (f) J. Hao, X. Y. Li, Y. Zhang and W. K. Dong, Materials, 2018, 11, 523 CrossRef PubMed.
- (a) L. W. Zhang, L. Z. Liu, F. Wang and W. K. Dong, Molecules, 2018, 23, 1141 CrossRef PubMed; (b) F. Wang, L. Z. Liu, L. Gao and W. K. Dong, Spectrochim. Acta, Part A, 2018, 203, 56–64 CrossRef CAS PubMed; (c) X. Y. Dong, Q. P. Kang, X. Y. Li, J. C. Ma and W. K. Dong, Crystals, 2018, 8, 139 CrossRef; (d) Y. D. Peng, F. Wang, L. Gao and W. K. Dong, J. Chin. Chem. Soc., 2018, 65, 893–899 CrossRef CAS; (e) Q. P. Kang, X. Y. Li, Q. Zhao, J. C. Ma and W. K. Dong, Appl. Organomet. Chem., 2018, 32, e4379 CrossRef; (f) L. W. Zhang, X. Y. Li, Q. P. Kang, L. Z. Liu, J. C. Ma and W. K. Dong, Crystals, 2018, 8, 173 CrossRef.
- (a) J. H. Hu, J. B. Li, J. Qi and Y. Sun, New J. Chem., 2015, 39, 4041–4046 RSC; (b) J. B. Li, J. H. Hu, J. J. Chen and J. Qi, Spectrochim. Acta, Part A, 2014, 133, 773–777 CrossRef CAS PubMed; (c) J. H. Hu, J. B. Li, J. Qi and J. J. Chen, New J. Chem., 2015, 39, 843–848 RSC; (d) Y. Sun, J. H. Hu, J. Qi and J. B. Li, Spectrochim. Acta, Part A, 2016, 167, 101–105 CrossRef CAS PubMed; (e) A. P. De Silva, T. P. Vance and M. E. S. West, Org. Biomol. Chem., 2008, 6, 2468–2480 RSC; (f) d. S. Prasanna, T. S. Moody and S. Thomas, Analyst, 2009, 134, 2385–2393 RSC; (g) S. C. Dodani, Q. He and C. J. Chang, J. Am. Chem. Soc., 2009, 131, 18020–18021 CrossRef CAS PubMed.
- (a) M. E. Jun, B. Roy and K. H. Ahn, Chem. Commun., 2011, 47, 7583–7601 RSC; (b) P. Wang and L. Zhao, Spectrochim. Acta, Part A, 2015, 135, 342–350 CrossRef CAS PubMed; (c) P. Wang and L. Zhao, Synth. React. Inorg., Met.-Org., Nano-Met. Chem., 2016, 46, 1095–1101 CrossRef CAS.
- (a) J. H. Hu, J. B. Li, J. Qi and Y. Sun, New J. Chem., 2015, 39, 4041–4046 RSC; (b) J. H. Hu, J. B. Li, J. Qi and J. J. Chen, New J. Chem., 2015, 39, 843–848 RSC; (c) J. B. Li, J. H. Hu, J. J. Chen and J. Qi, Spectrochim. Acta, Part A, 2014, 133, 773–777 CrossRef CAS PubMed.
- (a) J. H. Hu, J. B. Li, J. Qi and Y. Sun, Sens. Actuators, B, 2015, 208, 581–587 CrossRef CAS; (b) Y. Sun, J. H. Hu, J. Qi and J. B. Li, Spectrochim. Acta, Part A, 2016, 167, 101–105 CrossRef CAS PubMed; (c) M. N. Hughes, M. N. Centelles and K. P. Moore, Free Radical Biol. Med., 2009, 47, 1346–1353 CrossRef CAS PubMed.
- W. K. Dong, Y. X. Sun, S. J. Xing, Y. Wang and X. H. Gao, Z. Naturforsch., B: J. Chem. Sci., 2012, 67, 197–203 CAS.
- (a) S. G. Wang, S. Y. Xu, G. F. Hu, X. L. Bai, T. D. James and L. Y. Wang, Anal. Chem., 2016, 88, 1434–1439 CrossRef CAS PubMed; (b) S. Kang, J. Oh and M. S. Han, Dyes Pigm., 2017, 139, 187–192 CrossRef CAS; (c) Z. Shojaeifard, B. Hemmateenejad, M. Shamsipur and R. Ahmadi, J. Photochem. Photobiol., A, 2019, 384, 112030 CrossRef CAS.
Footnote |
| † Electronic supplementary information (ESI) available. See DOI: 10.1039/c9ra09017g |
| This journal is © The Royal Society of Chemistry 2019 |


