
 Open Access Article
 This Open Access Article is licensed under a Creative Commons Attribution-Non Commercial 3.0 Unported Licence
Symmetric exponential amplification reaction-based DNA nanomachine for the fluorescent detection of nucleic acids†
Qi Yana,
Qiuyue Duana,
Yuqi Huanga,
Jing Guob,
Liang Zhonga,
Hong Wanga and
Gang Yi *a
*a
aKey Laboratory of Clinical Laboratory Diagnostics (Ministry of Education of China), Department of Laboratory Medicine, Chongqing Medical University, Chongqing, 400016, P. R. China. E-mail: yigang666@cqmu.edu.cn; Fax: +86 23 68485239; Tel: +86 23 68485240
bDepartment of Clinical Laboratory, Qingdao Municipal Hospital, 1 Jiaozhou Road, Qingdao, 266071, P. R. China
First published on 13th December 2019
Abstract
By introducing palindromic sequences into the classical exponential amplification reaction (EXPAR), we constructed a new palindromic fragment-incorporated multifunctional hairpin probe (P-HP)-mediated symmetric exponential amplification reaction (S-EXPAR), to significantly reduce the background signal caused by inherent nonspecific amplification. A G-triplex/ThT complex was used as the signal reporter for the proposed label-free DNA nanomachine. The P-HP consists of five functional regions: a C-rich region (C), a target DNA recognition region (T′), two nicking sites (X′) and a palindromic fragment (P). When target DNA (T) hybridizes with P-HP, the palindromic fragment at the 3′ end of P-HP is fully exposed. Then, the P-HP/T duplexes hybridize with each other through the exposed P, and EXPAR occurs automatically and continuously on both sides of P under the synergistic effect of polymerase and nicking endonuclease. This is called the S-EXPAR assay. In this system, one T converts to a large number of G-triplex fragments, which can combine with ThT within a short time. The G-triplex/ThT complexes formed act as the signal reporter in a label-free and environmentally friendly format. In this way, the limit of detection of this method is as low as 10 pM with a dynamic response range of 10 pM to 300 nM. In addition, this method can detect other nucleic acids by simply changing the T′ region of the P-HP. Thus, the proposed DNA nanomachine is a potential alternative method for nucleic acid detection.
1. Introduction
Nucleic acid is an important genetic material, which plays a key role in the storage, transfer and regulation of genetic information.1 Moreover, detection of nucleic acids is of great significance in a wide range of fields, such as clinical diagnosis, forensic identification, environmental monitoring and various areas of biomedical research.2–4 Hence, it is of great interest to develop an efficient nucleic acid detection method, which mainly includes two aspects: an amplification method and a sensing module. In recent decades, many amplification methods have been proposed, and of these DNA nanomachines have received more and more attention.5–7 DNA nanomachines comprise natural or artificially designed nucleic acid components that self-assemble through the specific interaction of base sequences, with highly amplified efficiency.8,9 The exponential amplification reaction (EXPAR) is an outstanding example of DNA nanomachines driven by polymerase and endonuclease, which can perform autonomous polymerization/nicking/displacement cycles and produce a large number of sensing modules.10–15 However, Tan et al. found that further application of EXPAR was limited by a nonspecific reaction between the single-stranded template and the DNA polymerase.16 In later studies, researchers replaced the single-stranded template with a normal or even a double-hairpin molecular beacon, to avoid this nonspecific reaction. In addition, in order to realize target DNA recycling in these systems, another primer was introduced.17–20 However, more than one oligonucleotide in the reaction solution usually induces nonspecific amplification and high background signals due to accidental collision or design negligence.21,22Palindromic sequences can form hairpin structures through intramolecular self-hybridization, or duplexes through intermolecular hybridization.23,24 Currently, the emergence of palindromic fragment-mediated DNA nanomachines has brought a new perspective to DNA detection research because it not only avoids the introduction of other primers, but also realizes effective recycling of target DNA. For example, Li et al. developed a novel single palindromic molecular beacon-based strand displacement amplification DNA nanomachine.25 Subsequently, a combination of palindromic sequences and rolling circle amplification was also published.26,27 In this study, we combined palindromic sequences with EXPAR to avoid the nonspecific amplification between DNA polymerase and the single-stranded template without introducing any primers.
As for the sensing module, various measuring techniques, including surface plasmon resonance,28 electrochemical sensors,29 colorimetric assay30 and fluorescence methods,31,32 have been reported for nucleic acid detection. Among these, fluorescence methods have gained particular attention because of their high sensitivity and good stability. However, conventional fluorescence detection methods ordinarily require modification of the molecular beacon by chemical groups.33 The G-quadruplex can combine with thioflavin T (ThT), a water-soluble fluorescent dye, and emit a strong fluorescence signal.34,35 However, a 22-base G-rich sequence-mediated label-free molecular beacon is difficult to design and operate.36 Fortunately, Zhou et al. reported a new G-rich sequence-based DNA nanostructure, G-triplex, which has similar functions to G-quadruplex but only consists of 13 bases.37
Herein, we propose a label-free, ultra-low background signal and ultra-high signal-to-noise ratio DNA nanomachine, which is based on the palindromic fragment-incorporated multifunctional hairpin probe (P-HP)-assisted symmetric exponential amplification reaction (S-EXPAR), with G-triplex/ThT complex as the signal reporter. In this experiment, the p53 gene was selected as the model analyte because it is mutated in more than 50% of malignant tumors.38 The S-EXPAR assay only involves a multifunctional hairpin probe, containing a C-rich region, a target DNA recognition region, two nicking sites and a palindromic sequence. When the target DNA hybridizes with P-HP the palindromic fragment at the 3′ end of P-HP is fully exposed, and EXPAR occurs automatically and continuously on both sides of the palindromic region, under the synergistic effect of the polymerase and nicking endonuclease. This is called the S-EXPAR assay. In this system, one target DNA converts to a large number of G-triplex fragments that can combine with ThT within a short time. The G-triplex/ThT complexes formed act as the signal reporter in a label-free and environmentally friendly format.37 Considering all of the above, a novel, simple and label-free DNA nanomachine with ultra-low background signal, was developed for nucleic acid detection.
2. Experimental
2.1. Reagents and materials
The Nb.BbvCI nicking endonuclease and Klenow fragment (3′–5′ exo-) polymerase (KF polymerase) were acquired from New England Biolabs (Beijing, China). TE buffer (10 mM Tris–HCl, 1 mM EDTA, pH 8.0), deoxynucleotides (dNTPs), 6× loading buffer, acryl/bis 30% solution (29![[thin space (1/6-em)]](https://www.rsc.org/images/entities/char_2009.gif) :1), ammonium persulfate and N,N,N′,N′-tetramethylethylenediamine (TEMED) were purchased from Sangon Biotechnology Co. Ltd (Shanghai, China). Thioflavin T (ThT) was acquired from Sigma-Aldrich (St. Louis, USA). GoldView I was purchased from SBS Genetech (Beijing, China). The 20-bp DNA Ladder (Dye Plus) was purchased from TaKaRa Biotech (Dalian, China). Human serum was from the First Affiliated Hospital of Chongqing Medical University. All oligonucleotides used in this study were synthesized by Sangon Biotech Inc. (Shanghai, China), and the detailed oligonucleotide sequences are listed in Table S1.† During the design of P-HP, the website https://sg.idtdna.com/calc/analyzer was employed to predict the secondary structure. Ultrapure water obtained from a Millipore water purification system (18.2 MΩ, Milli-Q, Millipore) was used to prepare all the solutions in this experiment.
:1), ammonium persulfate and N,N,N′,N′-tetramethylethylenediamine (TEMED) were purchased from Sangon Biotechnology Co. Ltd (Shanghai, China). Thioflavin T (ThT) was acquired from Sigma-Aldrich (St. Louis, USA). GoldView I was purchased from SBS Genetech (Beijing, China). The 20-bp DNA Ladder (Dye Plus) was purchased from TaKaRa Biotech (Dalian, China). Human serum was from the First Affiliated Hospital of Chongqing Medical University. All oligonucleotides used in this study were synthesized by Sangon Biotech Inc. (Shanghai, China), and the detailed oligonucleotide sequences are listed in Table S1.† During the design of P-HP, the website https://sg.idtdna.com/calc/analyzer was employed to predict the secondary structure. Ultrapure water obtained from a Millipore water purification system (18.2 MΩ, Milli-Q, Millipore) was used to prepare all the solutions in this experiment.
2.2. Apparatus and instruments
All fluorescence spectra were recorded on a Cary Eclipse fluorescence spectrophotometer (Agilent Technologies, Palo Alto, USA). The parameters were set as follows: excitation wavelength 442 nm, excitation and emission bandwidths 5 nm and 10 nm, respectively.Circular dichroism (CD) measurements were performed on a Chirascan CD spectrometer (Applied Photophysics Ltd., UK) using a 1 mm path length quartz cuvette at room temperature under the following parameters: range 200–500 nm, scanning speed 200 nm min−1, bandwidth 1 nm, response time 0.5 s.37
The 12% native polyacrylamide gel electrophoresis (nPAGE) was operated at the Bio-Rad electrophoresis analyzer (Bio-Rad, USA) using 80 V constant voltage at room temperature for 1 hour in 1× TBE buffer (90 mM Tris–boric acid, 2 mM EDTA, pH 8.0). Then, the gel was stained with GoldView I for another 30 minutes with continuous rotation and finally photographed with a Bio-Rad ChemDoc XRS (Bio-Rad, USA).
2.3. Fluorescent detection of target DNA
P-HP was annealed at 90 °C for 10 min and then gradually cooled down to 25 °C to form a perfect stem and loop structure. For target DNA detection, 2 μL of target DNA at a given concentration was added into the mixture of 1× NEBuffer 2 (1 mM Tris–HCl, 5 mM NaCl, 1 mM MgCl2, 0.1 mM DTT, pH 7.9), 100 nM P-HP, 500 μM dNTPs, 0.08 U KF polymerase, and 3 U Nb.BbvCI nicking endonuclease. The final solution, with a volume of 20 μL, was kept at 37 °C for 120 min. Prior to fluorescence measurement, 5 μM ThT supplemented with 50 mM KCl was added to the above cascade amplification product to yield a final volume of 100 μL and incubated in the dark for another 15 min. The fluorescence intensity at 494 nm was used to quantify the concentration of target DNA. The standard deviation of the measured data was obtained by three independent experiments and is recorded in the figures with error bars.3. Results and discussion
3.1. Principle of P-HP mediated S-EXPAR assay
Herein, we propose a novel DNA nanomachine to detect nucleic acids by combining the G-triplex/ThT fluorescence reporter with a P-HP-mediated S-EXPAR assay. In this system, only one type of oligonucleotide, palindromic fragment-incorporated multifunctional hairpin probe (P-HP) was involved. The five regions of the P-HP and the principles of the P-HP-mediated S-EXPAR assay are shown in Scheme 1. Region C represents the C-rich sequences, which are complementary to the G-triplex fragment; X′ represents the recognition site of Nb.BbvCI nicking endonuclease; T′ is the region complementary to target DNA; P is the palindromic fragment. In the initial state, part of region P was locked in the stem of the P-HP. Once T hybridized with P-HP, it would be fully exposed. Then the P-HP/T duplexes hybridized with each other through exposed P and the two P-HP served as templates and primers for each other to form a complete long double-stranded DNA structure, which was centered on P and with symmetric XTXG on both sides. Under the synergistic effect of KF polymerase and Nb.BbvCI nicking endonuclease, EXPAR occurs automatically and continuously on both sides of P, which is called the S-EXPAR assay. Simultaneously, recycling of the original T and the produced T analogues generated a great deal of G-triplex fragments within a short time. Finally, with the help of K+, the G-triplex/ThT complexes formed acted as the signal reporter, inducing a strong fluorescence signal.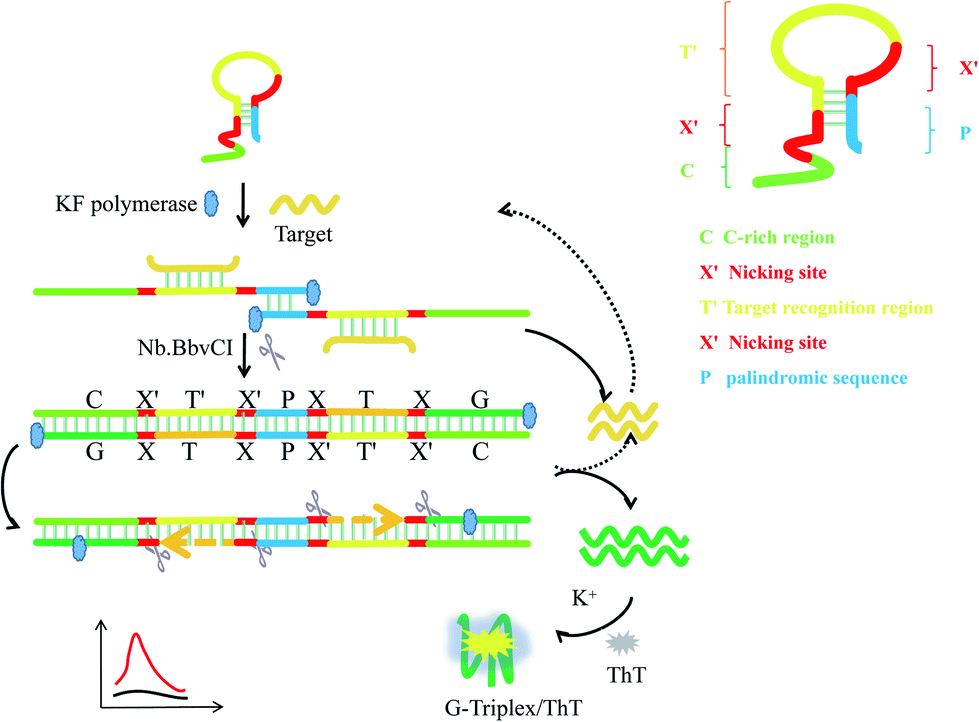 | ||
| Scheme 1 Schematic representation of the nanomachine for target DNA detection based on the P-HP mediated S-EXPAR using the G-triplex/ThT as signal reporter. | ||
3.2. Characterization of G-triplex
The structure and biological function of G-triplex were characterized by CD and fluorescence measurements. As shown in Fig. 1A, the CD spectrum of G-triplex has a negative peak at 240 nm and a positive peak at 265 nm, which completely match the typical parallel stand arrangement, indicating that a parallel G-triplex structure has been formed.37 Moreover, these two peaks can be well distinguished from the characteristic positive peaks of single-stranded (ss) DNA and double-stranded (ds) DNA at about 280 nm.39,40 After the addition of ThT, the two peaks in the CD spectrum at 240 and 265 nm were almost unchanged, and a new negative peak appeared at 425 nm, which indicated that ThT could be intercalated into the G-triplex without changing its parallel structure. As shown in Fig. 1B, when ThT or G-triplex fragments present alone, the measured fluorescence intensity was very low. But the G-triplex/ThT complexes formed exhibited strong fluorescence intensity (blue curve). These results provided good evidence for the formation of the G-triplex structure and its ability to significantly enhance the fluorescence signal of the ThT molecule.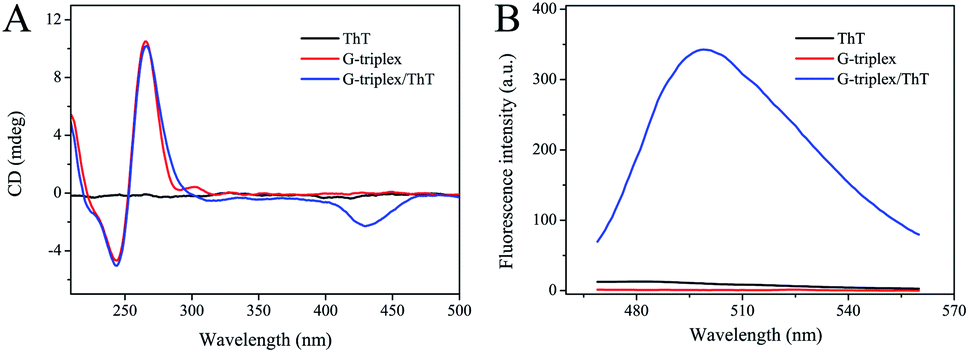 | ||
| Fig. 1 (A) CD spectra of 100 μM ThT, 10 μM G-triplex and the mixture of ThT and G-triplex. (B) Fluorescence emission spectra of 10 μM ThT, 1 μM G-triplex and the mixture of ThT and G-triplex. Samples were all prepared in 25 mM Tris–HCl buffer (pH 7.4) containing 50 mM KCl. | ||
3.3. Feasibility
The feasibility of this S-EXPAR-based DNA nanomachine was evaluated by fluorescence measurement and 12% nPAGE analysis. As illustrated in Fig. 2A, without target DNA, a weak fluorescence intensity was observed (curve a), indicating that even in the presence of P-HP, KF polymerase, and Nb.BbvCI nicking endonuclease, but without target DNA, almost no G-triplex fragment was produced. In contrast, with target DNA the fluorescence intensity increased dramatically (curve b). The measured data demonstrated that the proposed S-EXPAR nanomachine was feasible. What is more, the background signal of this method was ultra-low, and the signal-to-noise ratio reached 100.64-fold.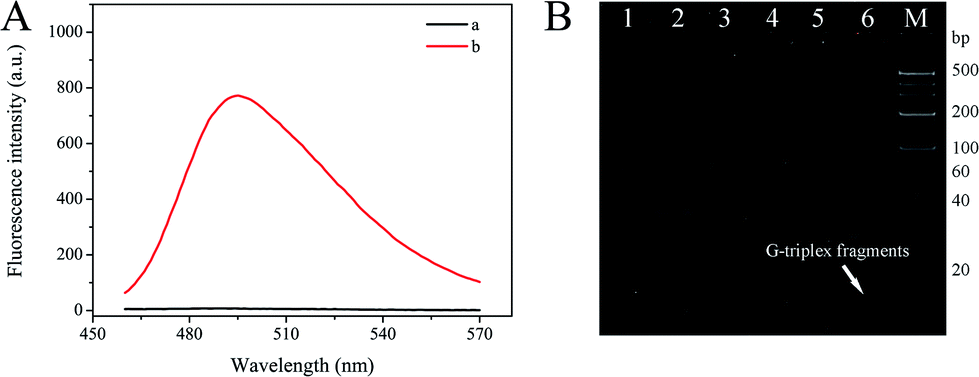 | ||
| Fig. 2 Feasibility of P-HP mediated S-EXPAR assay. (A) Fluorescence spectra without (curve a) and with (curve b) target DNA under the same experimental conditions. (B) The nPAGE (12%) analysis. Lane M, 20 bp DNA marker; lane 1, T; lane 2, P-HP; lane 3, P-HP + T; lane 4, P-HP + T + KF polymerase; lane 5, P-HP + KF polymerase + Nb.BbvCI; lane 6: P-HP + T + KF polymerase + Nb.BbvCI. Concentrations of P-HP and T were 1 μM in lanes 1–3, and the concentrations of T, P-HP, and dNTPs in lanes 4–6 were 0.5 μM, 0.5 μM and 500 μM, respectively. The amount of KF polymerase and Nb.BbvCI was 0.08 U and 3 U, respectively. | ||
The feasibility was also confirmed by nPAGE analysis, and the results are displayed in Fig. 2B. Lane 1 was T, lane 2 was P-HP, and lane 3 was P-HP/T duplexes. With the help of the polymerase, the complete long dsDNA structure was formed, located in the top band of lane 4.21 Moreover, an extra band with extremely low molecular weight, namely G-triplex fragments, appeared when Nb.BbvCI nicking endonuclease was present, in lane 6. However, as seen from lane 5, only one band was acquired for the natural characteristics of P-HP. This further proved that the P-HP-based S-EXPAR could only be triggered by target DNA, as well as the feasibility and ultra-low background of this scheme.
3.4. Optimization of experimental conditions
By changing one experimental condition and keeping the consistency of the other parameters, several optimization experiments were conducted. Signal-to-noise ratio (F/F0) was adopted to evaluate the results, where F and F0 are the fluorescence intensity with or without target, respectively. For optimal analysis performance, we first optimized the base number of the palindromic fragment and the concentration of P-HP. In this proposed scheme, the operation of the S-EXPAR-based DNA nanomachine was largely dependent on the appropriate base number of palindromic fragments, to ensure stable binding but no intermolecular or intramolecular hybridization without target DNA. Thus, we designed three P-HPs with different lengths of palindromic fragments (6, 8, 10 nucleotides). As shown in Fig. 3A, the F was very low when the base number was 6; when the base number was 10, F reached a higher level, but the increase of F0 led to a lower F/F0. The best analytical performance was achieved at 8. Since P-HP was the only nucleic acid in this cascade amplification system, its concentration optimization was also very important. As shown in Fig. 3B, F/F0 reached the maximum value when the concentration of P-HP was 100 nM.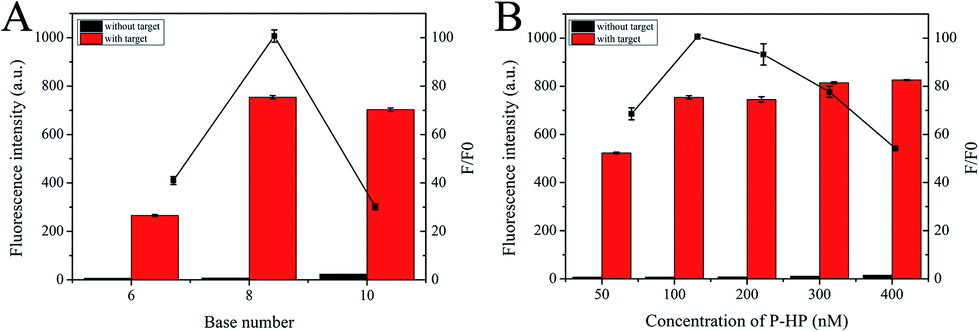 | ||
| Fig. 3 Optimization of (A) the base number of the palindromic and (B) the concentration of P-HP. | ||
In theory, the amplification efficiency of S-EXPAR mainly relies on the synergy of the polymerase and endonuclease. Therefore, we optimized the amounts of KF polymerase and Nb.BbvCI nicking endonuclease. As shown in Fig. 4A and B, the maximum value of F/F0 was achieved at 0.08 U and 3 U, respectively. It is important to note that this approach uses much less enzyme than the published methods.17–20 Subsequently, the optimal reaction time was also explored, as illustrated in Fig. 4C. The longer the reaction time, the higher the background signal and the worse the signal transduction capability. To obtain the highest F/F0 value, 120 min was selected. ThT plays an important role in the signal output of this DNA nanomachine. As depicted in Fig. 4D, F/F0 reached its highest value at a ThT concentration of 5 μM.
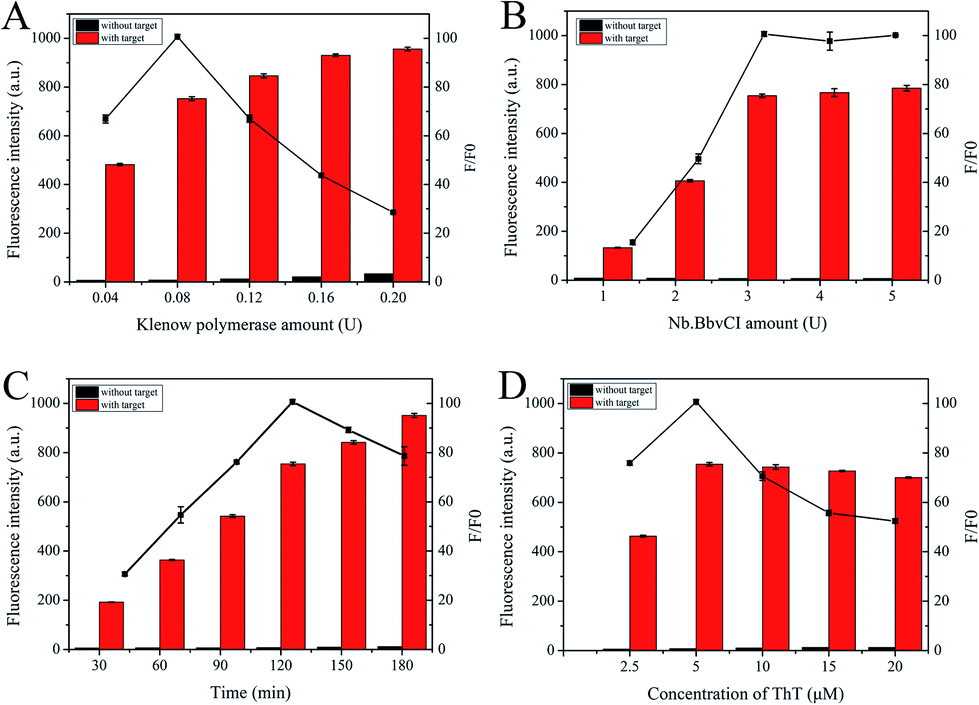 | ||
| Fig. 4 The optimization of (A) amount of Klenow polymerase, (B) amount of Nb.BbvCI, (C) the reaction time and (D) the concentration of ThT. | ||
3.5. Sensitivity
To assess the nucleic acid detection performance of the developed DNA nanomachine, a series of target DNAs with different concentrations (10 pM to 300 nM) were tested. As shown in Fig. 5A, the peak of the fluorescence emission spectra increased gradually with increase in the target DNA concentration. The dose–response curves of fluorescence intensity (F) and various concentrations of target DNA (C) are shown in Fig. 5B. The calibration curve was expressed as F = 3.033 × 10⁻⁵C3 − 0.1168C2 + 15.85C + 12.99 with a correlation coefficient (R2) of 0.9943. What is more, a 10 pM target induced clear fluorescence enhancement compared with the blank sample (shown in Fig. 5A, inset). Hence, 10 pM was defined as the limit of detection (LOD) of this scheme. If the final volume (100 μL) was adopted, the LOD would be as low as 2 pM.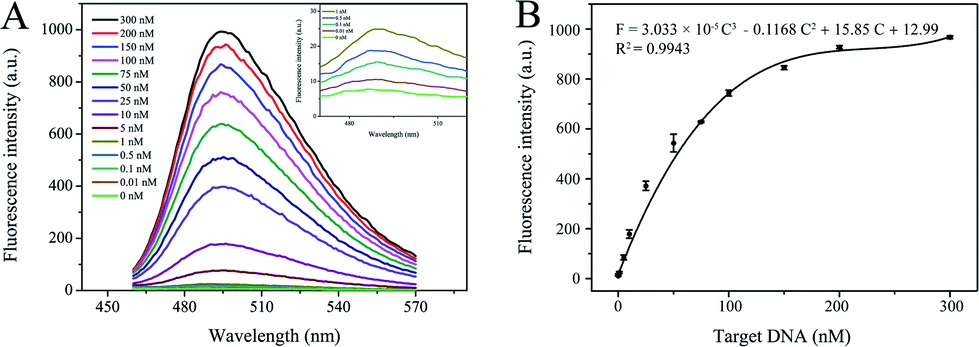 | ||
| Fig. 5 Capability of S-EXPAR-based DNA nanomachine to quantify target DNA. (A) Fluorescence spectra of various concentrations of target DNA (0 to 300 nM) (inset: fluorescence spectra of target DNA at low concentrations). (B) The dose–response curves of fluorescence intensity and various concentrations of target DNA. | ||
This scheme only involved a well-designed hairpin probe, with the advantages of ease of operation and no need for immobilization, separation or washing, and achieved comparable analytical performance to previously published methods.11,14,18,20 More information about the comparison between the P-HP-mediated S-EXPAR assay and published methods, in terms of assay capability, is given in Table S2.†
In addition, we also designed a single-stranded template sequence (SP) without the palindromic fragment and performed a classical EXPAR for comparison. The detailed schematic diagram and experimental results are shown in Fig. S1 and S2.† In the classical EXPAR assay, there was a good linear correlation between F and logC (pM) in the range from 1 pM to 100 nM, but the background signal was much higher than in this work. In order to reduce the background signal, we proposed P-HP-mediated S-EXPAR with some differences. First, the template was changed from single-stranded SP to hairpin-structured P-HP, which makes it harder to hybridize the T with the template. Second, the hybridization of T and P-HP could not trigger the amplification reaction directly, and two P-HP/T duplexes need to be hybridized with each other through the exposed P with only 8 bases. Nevertheless, the low concentration of P-HP/T duplexes in the reaction solution would make it difficult to achieve intermolecular hybridization through molecular collision. The results show that these delicate designs, different from classical EXPAR, do significantly reduce the background signal, but also affect the sensitivity and linear correlation to some extent.
3.6. Specificity, reproducibility and stability
Specificity is another key parameter to evaluate the assay performance and potential for application in nucleic acid detection. Four control molecules: one-base mismatched target (MT1), two-base mismatched target (MT2), three-base mismatched target (MT3), and the non-complementary target (NC) were selected for the specificity experiments. As illustrated in Fig. 6, the signal induced by 100 nM T was regarded as 100%, the corresponding relative fluorescence intensity of MT1–3 and NC, with the same concentration of T, was 70.6%, 56.4%, 18.6% and 1.8%, respectively. These results clearly demonstrated that the S-EXPAR-based DNA nanomachine was able to identify a single base mismatch.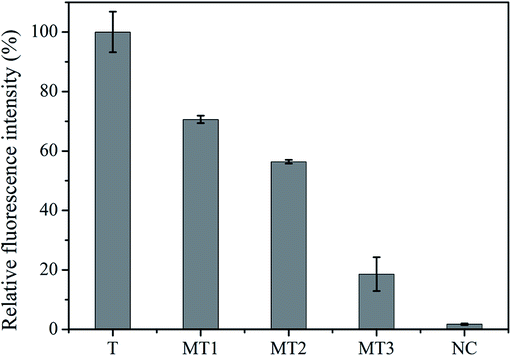 | ||
| Fig. 6 Specificity of S-EXPAR-based DNA nanomachine. | ||
Good reproducibility and acceptable stability are also important for application of this method. The reproducibility was assessed by measuring T at 0.5 nM, 5 nM and 50 nM with three repeated experiments. As shown in Fig. S3A,† the relative standard deviation (RSD) of these three groups of data was 4.34%, 2.45% and 1.32%, respectively, suggesting good reproducibility for our proposed method. Furthermore, the stability was verified by using the established method to detect 10 nM T during storage at 4 °C for ten consecutive days. As shown in Fig. S3B,† the RSD was 1.18%. There was no significant loss of fluorescence intensity, which indicated the acceptable stability of our method.
3.7. Interference study
To evaluate potential application of this S-EXPAR-based fluorescence sensing system for the detection of nucleic acids in complex matrices, a recovery experiment was performed. Three different concentrations of T (0.5, 5 and 50 nM) were spiked into 10% human serum and the fluorescence intensity was measured under identical conditions to evaluate the response capability. The results are shown in Table 1, and the recoveries of all samples were calculated ranging from 92.94% to 100.09% with an RSD of 1.12% to 5.66%. The above data revealed that possible interference from the human serum to the system was negligible, which further indicated that this scheme held the potential for application in clinical diagnosis.| Sample | Spiked concentration (nM) | Detected concentration (nM) | Recovery (%) | RSD (%) |
|---|---|---|---|---|
| 1 | 0.5 | 0.4647 | 92.94 | 5.66 |
| 2 | 5 | 5.004 | 100.09 | 1.12 |
| 3 | 50 | 48.23 | 96.46 | 1.85 |
4. Conclusions
By introducing palindromic sequences into the classical exponential amplification reaction, a simple and label-free DNA nanomachine with ultra-low background signal and ultra-high signal-to-noise ratio is proposed. Compared with nucleic acid detection methods that are already available, this intelligent DNA nanomachine possesses several remarkable advantages. First, the template was changed from a single strand to a hairpin structure, avoiding the inherent nonspecific reaction between the single-stranded template and DNA polymerase. Second, once two P-HP/T duplexes hybridized with each other through the exposed P, EXPAR occurred automatically and continuously on both sides of P under the synergistic effect of the polymerase and nicking endonuclease, without the need for the introduction of additional primers. Third, the use of G-triplex/ThT complexes as the signal reporter in a label-free and environmentally friendly format significantly reduced the cost, since no chemical modifications were required. In addition, this method can detect other nucleic acids by simply changing the target recognition region of the P-HP. Therefore, the proposed DNA nanomachine is a potential alternative method for many fields requiring nucleic acid detection.Conflicts of interest
There are no conflicts to declare.Acknowledgements
This work was supported by the Science and Technology Research Program of Chongqing Yuzhong District Science and Technology Commission (Grant No. 20180127) and the Special Fund Project Key Laboratory of Clinical Laboratory Diagnostics (Ministry of Education).References
- J. Compton, Nature, 1991, 350, 91–92 CrossRef CAS PubMed.
- T. T. Fong and E. K. Lipp, Microbiol. Mol. Biol. Rev., 2005, 69, 357–371 CrossRef CAS PubMed.
- R. Dumache, V. Ciocan, C. Muresan and A. Enache, Clin. Lab., 2016, 62, 245–248 CAS.
- S. O. Kelley, C. A. Mirkin, D. R. Walt, R. F. Ismagilov, M. Toner and E. H. Sargent, Nat. Nanotechnol., 2014, 9, 969–980 CrossRef CAS.
- H. Ma, B. Guo, X. Yan, T. Wang, H. Que, X. Gan, P. Liu and Y. Yan, RSC Adv., 2019, 9, 19347–19353 RSC.
- J. Zheng, X. Ji, M. Du, S. Tian and Z. He, Nanoscale, 2018, 10, 17206–17211 RSC.
- D. D. Nedorezova, A. F. Fakhardo, D. V. Nemirich, E. A. Bryushkova and D. M. Kolpashchikov, Angew. Chem., Int. Ed., 2019, 58, 4654–4658 CrossRef CAS PubMed.
- C. Teller and I. Willner, Curr. Opin. Biotechnol., 2010, 21, 376–391 CrossRef CAS PubMed.
- M. K. Beissenhirtz and I. Willner, Org. Biomol. Chem., 2006, 4, 3392–3401 RSC.
- M. S. Reid, X. C. Le and H. Zhang, Angew. Chem., Int. Ed., 2018, 57, 11856–11866 CrossRef CAS PubMed.
- H. Zhao, J. Dong, F. Zhou and B. Li, Microchim. Acta, 2015, 182, 2495–2502 CrossRef CAS.
- D. Wang, Y. Chai, Y. Yuan and R. Yuan, Anal. Chem., 2017, 89, 8951–8956 CrossRef CAS PubMed.
- Y. Yan, B. Shen, H. Wang, X. Sun, W. Cheng and H. Zhao, Analyst, 2015, 140, 5469–5474 RSC.
- L. Wang, Y. Han, S. Xiao, S. Lv, C. Wang and N. Zhang, Talanta, 2018, 187, 365–369 CrossRef CAS.
- H. Wu, X. Zhou, W. Cheng, T. Yuan, M. Zhao and X. Duan, Analyst, 2018, 143, 4974–4980 RSC.
- E. Tan, B. Erwin, S. Dames, T. Ferguson, M. Buechel and B. Irvine, Biochemistry, 2008, 47, 9987–9999 CrossRef CAS.
- H. Xu, D. Wu, C. Q. Li, Z. Lu, X. Y. Liao and J. Huang, Biosens. Bioelectron., 2017, 90, 314–320 CrossRef CAS.
- D. Wu, H. Xu, H. Shi, W. Li, M. Sun and Z. S. Wu, Anal. Chim. Acta, 2017, 957, 55–62 CrossRef CAS PubMed.
- Y. Qin, S. Liao, Y. Huang, J. Zhao and S. Zhao, Anal. Chim. Acta, 2018, 1039, 91–97 CrossRef CAS PubMed.
- J. Xu, J. Qian, H. Li, Z. S. Wu, W. Shen and L. Jia, Biosens. Bioelectron., 2016, 75, 41–47 CrossRef CAS PubMed.
- H. Dong, Z. S. Wu, J. Xu, J. Ma, H. Zhang and J. Wang, Biosens. Bioelectron., 2015, 72, 182–190 CrossRef CAS PubMed.
- L. R. Zhang, G. Zhu and C. Y. Zhang, Anal. Chem., 2014, 86, 6703–6709 CrossRef CAS PubMed.
- L. Lu, H. Jia, P. Droge and J. Li, Funct. Integr. Genomics, 2007, 7, 221–227 CrossRef CAS PubMed.
- G. R. Smith, Genes Dev., 2018, 22, 2612–2620 CrossRef PubMed.
- F. Li, H. Zhao, Z. Y. Wang, Z. S. Wu, Z. Yang and C. C. Li, Biosens. Bioelectron., 2017, 91, 692–698 CrossRef CAS PubMed.
- H. Xu, S. Zhang, C. Ouyang, Z. Wang, D. Wu and Y. Liu, Talanta, 2019, 192, 175–181 CrossRef CAS PubMed.
- H. Xu, Y. Zhang, S. Zhang, M. Sun, W. Li and Y. Jiang, Anal. Chim. Acta, 2019, 1047, 172–178 CrossRef CAS.
- W. Nie, Q. Wang, L. Zou, Y. Zheng, X. Liu and X. Yang, Anal. Chem., 2018, 90, 12584–12591 CrossRef CAS PubMed.
- J. Guo, C. Yuan, Q. Yan, Q. Duan, X. Li and G. Yi, Biosens. Bioelectron., 2018, 105, 103–108 CrossRef CAS PubMed.
- W. Cheng, Y. Zhang, H. Yu, W. Diao, F. Mo and B. Wen, Sens. Actuators, B, 2018, 255, 3298–3304 CrossRef CAS.
- J. Wang, X. Wang, S. Wu, R. Che, P. Luo and C. Meng, Biosens. Bioelectron., 2017, 87, 984–990 CrossRef CAS PubMed.
- X. Peng, W. B. Liang, Z. B. Wen, C. Y. Xiong, Y. N. Zheng and Y. Q. Chai, Anal. Chem., 2018, 90, 7474–7479 CrossRef CAS PubMed.
- W. Zhang, F. Hu, Q. Zhang, J. Zhang, Y. Mao and P. Wang, Talanta, 2018, 179, 685–692 CrossRef CAS PubMed.
- J. Mohanty, N. Barooah, V. Dhamodharan, S. Harikrishna, P. I. Pradeepkumar and A. C. Bhasikuttan, J. Am. Chem. Soc., 2013, 135, 367–376 CrossRef CAS PubMed.
- X. Jiang, H. Liu, F. Y. Khusbu, C. Ma, A. Ping and Q. Zhang, Anal. Biochem., 2018, 555, 55–58 CrossRef CAS PubMed.
- Y. Xiao, V. Pavlov, T. Niazov, A. Dishon, M. Kotler and I. Willner, J. Am. Chem. Soc., 2015, 126, 7430–7431 CrossRef.
- H. Zhou, Z. F. Wu, Q. J. Han, H. M. Zhong, J. B. Peng and X. Li, Anal. Chem., 2018, 90, 3220–3226 CrossRef CAS.
- D. L. Gibbons, L. A. Byers and J. M. Kurie, Mol. Cancer Res., 2014, 12, 3–13 CrossRef CAS PubMed.
- N. K. Schwalb and F. Temps, Science, 2008, 322, 243–245 CrossRef CAS PubMed.
- L. Ma, X. Han, L. Xia, R. M. Kong and F. Qu, Analyst, 2018, 143, 5474–5480 RSC.
Footnote |
| † Electronic supplementary information (ESI) available. See DOI: 10.1039/c9ra08854g |
| This journal is © The Royal Society of Chemistry 2019 |