 Open Access Article
Chemical looping hydrogen production with modified iron ore as oxygen carriers using biomass pyrolysis gas as fuel
Tingting Xua,
Bo Xiaoa,
Gensheng Fua,
Sicheng Yangb and
Xun Wang *a
*a
aSchool of Environmental Science & Engineering, Huazhong University of Science & Technology, Wuhan 430074, China. E-mail: xunw@hust.edu.cn; Tel: +86 15271949823
bChina Urban Construction Design & Research Institute Co., Ltd. (CUCD), China
First published on 28th November 2019
Abstract
The chemical looping hydrogen (CLH) production was conducted in a fluidized bed reactor with the modified iron ore oxygen carriers (OCs) using simulated biomass pyrolysis gas (BPG) as fuel. Both carbon capture efficiency and hydrogen yield increased with the elevated reaction temperature in the fuel reactor (FR). As the reduction time in the FR increased, the carbon capture efficiency decreased but the hydrogen yield increased. An FR temperature of 900 °C and reduction time of 40 min in the FR were optimal conditions for CLH production. At this condition, the carbon capture efficiency for the NiO–iron ore, CuO–iron ore CeO–iron ore and iron ore were 83.29%, 82.75%, 70.05% and 40.46%, respectively. The corresponding hydrogen yield and hydrogen purity were 8.89 mmol g−1 and 99.02%, 7.78 mmol g−1 and 99.68%, 6.25 mmol g−1 and 99.52%, and 2.45 mmol g−1 and 97.46%, respectively. The presence of NiFe2O4, CuFe2O4 and CeFeO3 in the modified iron ore samples enhanced the reactivity of the iron ore and promoted its reduction. Both NiO–iron ore and CeO2–iron ore exhibited good cycle performance, while the sintering of the CuO–iron ore resulted in a decrease in the reactivity. Compared with the CuO–iron ore and CeO–iron ore, the NiO–iron ore was more appropriate for hydrogen production due to its high hydrogen yield and good cycle performance.
1 Introduction
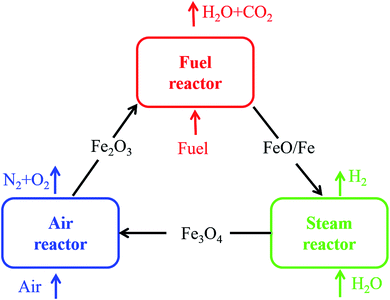
Hydrogen, an excellent energy carrier with high energy density and environmentally friendly properties, is considered a promising alternative energy source toward resolving the depletion of fossil fuels and environmental issues, such as the pollutant and greenhouse gas emissions.1 More than 80% hydrogen around the world is produced by the steam reforming technology using fossil fuel as feedstock.2 However, this technology has disadvantages, such as high energy consumption, a low energy integration efficiency, and serious CO2 emissions.2 Chemical looping hydrogen (CLH) production has received a great deal of attention in recent years because it can produce high purity hydrogen, and also capture carbon dioxide.3,4 Furthermore, the negative CO2 emissions can be achieved in CLH production using the carbon neutral biomass derived fuels, such as bio-oil, syngas and biochar.5It is very crucial to select a suitable oxygen carrier (OC) in the CLH production process. Metal oxides, such as the oxides of Ce, Fe, Cu, Ni, Co and Mn, have been proposed as possible OCs for the hydrogen production.6–10 Among various metal oxides, Fe2O3 was considered an ideal candidate for CLH production due to its favorable thermodynamics, low cost, nontoxicity and environmentally friendly properties in Nature.11 However, Fe2O3 cannot be regenerated completely just using steam as the oxidizing medium due to the limitation of the thermodynamic property. An air reactor is needed to oxide the reduced oxygen carrier. Therefore, as shown in Fig. 1, a three-reactor CLH production system was developed.4,12 The three-reactor CLH production system consists of a fuel reactor (FR), a steam reactor (SR) and an air reactor (AR). Fe2O3 is reduced to Fe and FeO by fuel in the FR first, and then Fe and FeO are oxidized to Fe3O4 by steam to obtain hydrogen in the SR where the water splitting occurs. High purity hydrogen is produced. Afterwards, Fe3O4 is transferred back to the AR where it is oxidized to Fe2O3 by air.
In fact, a rapid decrease in the reactivity of pure iron oxide was observed during the redox cycles, due to agglomeration and sintering of Fe and Fe3O4 during the chemical looping processes. A large number of studies have been done to enhance the reactivity, stability and cycle performance of the Fe-based OCs by adding some metal oxides. Ordinarily, these OCs involve the formation of new compounds, which may have a higher reactivity and enhanced reduction rate.13 Huang et al.14 illustrated that iron ore modified by NiO was appropriate in the CLR with biomass char owing to the fact that the formation of the spinel-type nickel iron oxide NiFe2O4 improved the reaction rate of char gasification. Chen et al.15 reported that the NiO addition improved the maximum reaction rate of the iron-based OCs in the oxidation stage and promoted the further reduction of Fe-oxides to Fe. Ismail et al.16 demonstrated that the CaO-modified Fe2O3 OCs exhibited higher reactivity and higher stability compared to the unmodified Fe2O3. Siriwardane et al.17 found that the presence of Cu promoted the deeper reduction of Fe2O3, and improved the oxidation and reduction rates. Sun et al.18 confirmed that CeO2 could effectively inhibit carbon deposition or Fe3C formation in CLH production with iron-based oxygen carriers.
Natural iron ore, as one of the iron-based OCs, have been intensively studied in chemical looping processes due to their lower application cost.19–22 In recent years, natural iron ores have been gradually applied to the CLH production process. Zeng et al.23 investigated the bio-oil CLH production process using an Austrian MAC iron ore as the OC. The hydrogen purity and hydrogen yield at 96% and 635 mL per mL oil, respectively, were achieved with a steam-to-oil ratio of 1.5. Xiao et al.24 found that the carbon and Fe3C formation led to a decrease in the reducibility of the four iron-based natural minerals. In general, the low redox reactivity is the main issue with using natural iron ore as OCs.25–28
Similarly, few studies have been reported in which the metals, Na, K, Cu and Ca etc., were implemented to enhance the reactivity of natural iron ores. Wang et al.29 reported that adding K and Cu had significant effects on enhancing the reduction reactivity of hematite, as well as elevating the hydrogen production in the CLH production process. Liu et al.30 reported that the presence of K decreased the carbon deposition, and increased the reduction rate of iron ore and hydrogen yield in CLH production. Gu et al.31 confirmed the feasibility of CLH production using the mixture of iron ore and biomass ash as OCs. Although some encouraging results were presented in the abovementioned studies, the issues of modified iron ores (such as sintering, agglomeration and volatilization of modified components) still exist.26,30,32,33 It is necessary to explore the modified iron ore OC with high reactivity and long-term stability for high purity hydrogen production.
In this study, the feasibility of CLH production with biomass pyrolysis gas using modified iron ore as OCs was evaluated. Modified iron ores (MxOy–iron ore, M = Ni, Cu and Ce) were prepared by the sample impregnation method. The CLH production experiments were conducted in a laboratory-scale fluidized bed reactor. The carbon capture efficiency, hydrogen yield, hydrogen purity and the reactivity of the OCs in CLH production process were investigated. The fresh and used OCs were characterized to evaluate their performance.
2 Experimental
2.1 Raw materials
The powder sample of the raw iron ore was obtained from the Wuhan Iron and Steel (Group) Company, which was supplied by the Chengchao iron ore miner, Ezhou, Hubei, China. The raw iron ore powder was first calcined at 900 °C for 6 h under atmospheric air. Then, the iron ore was grinded and sieved to 60–250 μm for use. The chemical components of the calcined iron ore were determined by X-ray fluorescence (XRF) spectroscopy. The results are given in Table 1.| Oxide | Al | Si | Ca | Mg | Fe |
| wt% | 2.68 | 3.19 | 2.17 | 2.81 | 88.15 |
In this study, a simulated biomass pyrolysis gas (BPG) was used to reduce the OCs in the fluidized-bed reactor. The BPG (10% H2 + 10% CO + 5% CH4 + 75% N2 balance) was purchased from the XiangYun Industry Co., Ltd. (Wuhan, China). All chemicals used in this research study were of analytical grade, and purchased from the Sinopharm Chemical Reagent Co., Ltd. (Shanghai, China).
2.2 Preparation of OCs
The modified iron ore OCs, MxOy–iron ore (MxOy = NiO, CuO and CeO2) were prepared via the incipient wetness impregnation method. The mass fraction of NiO, CuO and CeO2 were fixed at 10 wt% for all OCs. First, Ni(NO3)2·6H2O, Cu(NO3)2·3H2O and Ce(NO3)4·6H2O were accurately weighed and dissolved in deionized water to obtain nitrate aqueous solutions. Then, the aqueous solutions of Ni(NO3)2·6H2O, Cu(NO3)2·3H2O and Ce(NO3)4·6H2O were each transferred to the beaker containing iron ore powder. The resulting mixtures were stirred slowly at 80 °C for 12 h, dried at 105 °C for 48 h in a drying oven, and calcined at 1000 °C for 6 h in a muffle furnace. Finally, the resulting sample was cooled to room temperature, crushed, and sieved into particles with a size range of 50 μm to 430 μm for use.2.3 Chemical looping hydrogen tests
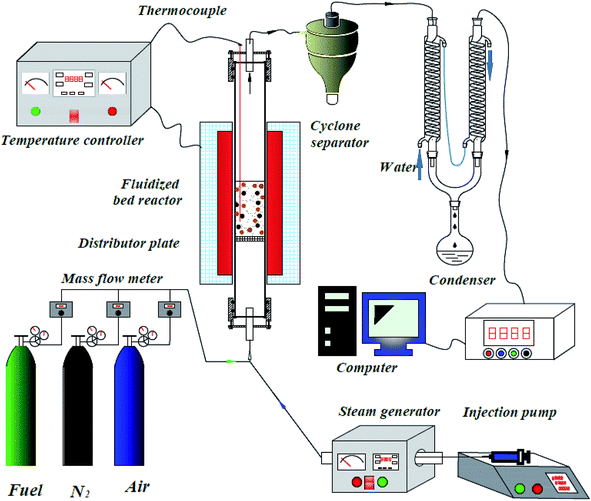
The CLH production experiments were carried out in a fluidized-bed reaction system under atmospheric pressure, as shown in Fig. 2. This system consisted of a carrier gas unit, fluidized bed reactor, cyclone separator, condenser, and on-line gas analyzer, steam generator and an injection pump.A quartz tube (i.d. = 30 mm, length = 1000 mm) was used as the fluidized bed reactor, with a porous distributor plate placed in the reactor at a distance of 400 mm from the bottom. The temperature of the fluidized bed reactor was measured by a K-type thermocouple. The water was injected into the steam generator by an injection pump to obtain steam. The steam was introduced into the fluidized-bed reactor via a tube, which was wrapped by a heated bend. The temperatures of the steam generator and the heated bend were fixed at 300 °C and 180 °C, respectively.
The CLH production tests can be divided into three stages, namely the reduced stage, steam-oxidized stage and regenerated stage. Prior to each test, 20.0 g OCs were loaded onto the porous distributor plate in the fluidized-bed reactor. Next, the fluidized-bed reactor was heated to the desired temperature in air (500 mL min−1). When the temperature was stable, air was then switched to nitrogen (500 mL min−1) to sweep the fluidized-bed reactor for 10 min. In the reduced stage, BPG (500 mL min−1) was introduced in the fluidized-bed reactor to reduce the OC particles. The reduction time was an important control variable, which changed from 20 min to 60 min with an interval of 10 min. Once the reaction ran out of time, BPG was switched to nitrogen (500 mL min−1) to purge the reactor for 10 min. In the steam-oxidized stage, nitrogen (500 mL min−1) was used as a carrier gas, and the steam was introduced to the reactor to obtain high purity hydrogen for 60 min. The steam flow was 1.0 mL min−1 in all tests, which was controlled by an injection pump. In the regenerated stage, air (500 mL min−1) was used to regenerate the OCs for 60 min.
The flue gases passed through a cyclone separator, condenser, and on-line gas analyzer (Gasboard-3100, Wuhan Cubic Optoelectronics Co., Ltd.) in order. The gas concentrations (including CO, CO2, CH4, H2 and O2) were analyzed and recorded continuously, with the fine particles being collected and the condensable components of the flue gases being removed.
2.4 Data analysis
In the reduced stage, 500 mL min−1 of BPG was used in the FR. The molar flow of N2 (FN2-FR, mol s−1) is a constant in the outlet.The outlet gas molar flow (Fout-FR, mol s−1) is calculated as
 | (1) |
The carbon capture efficiency (δc, %) is used to evaluate the conversion degree of carbonaceous gases into CO2 in the fuel reactor. It was calculated as
 | (2) |
Similarly, the outlet N2 flow (FN2-SR, 500 mL min−1) is used as a carrier gas in the steam-oxidized stage. The outlet gas flow (Fout-SR, mol s−1) is calculated as
 | (3) |
The total volume of hydrogen VH (L) in the gas products is calculated as:
 | (4) |
The hydrogen yield, Hy (mmol g−1), is calculated as
 | (5) |
The hydrogen purity (Hp) is calculated as
 | (6) |
2.5 Characterization technologies of the OCs
An X'Pert PRO diffractometer (X'Pert PRO, PANalytical B.V.) equipped with a Cu Kα radiation source (40 kV and 40 mA) was used to obtain X-ray diffraction (XRD) patterns of the OCs. The OCs were scanned at a rate of 2° min−1 from 2θ = 10° to 80° with a scanning step of 0.02°. N2 adsorption–desorption isotherms and pore-diameter distribution at −196 °C were measured using a Micrometrics ASAP 2010 system. The specific surface areas were calculated by the Brunauer–Emmett–Teller (BET) method. The surface morphology of the OCs was obtained using environmental scanning electron microscopy (ESEM; FEI Quanta 200) in conjunction with energy-dispersive X-ray spectroscopy (EDS). H2-TPR was conducted in an AutoChem II 2920. First, the sample (about 0.20 g) was heated to 300 °C at a rate of 10 °C min−1 in helium (50 mL min−1) and kept for 3 h. After being cooled to 50 °C, helium was replaced by a gas mixture consisting of 10/90H2/Ar v/v% (50 mL min−1), and the sample was reheated to 900 °C at a rate of 10 °C min−1.3 Results and discussion
In the FR, the OCs were reduced by BPG. The reduction time has a great effect on the carbon capture efficiency in the FR and the hydrogen yield in the SR. In this study, the reduction time in the FR increased from 20 min to 60 min. Both the hydrogen production time in the SR and the regeneration time in the AR were fixed at 60 min. The reaction temperatures of the FR, SR, and AR were set at 900 °C.3.1 Gas concentration profiles
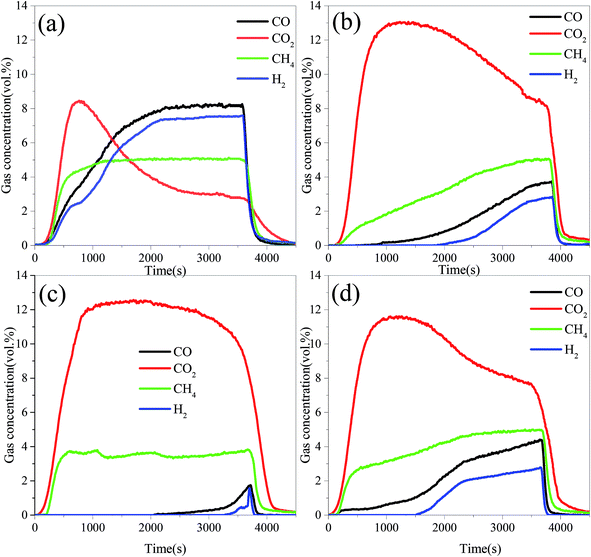
Fig. 3 displays the variation trend of the gas concentration with reaction time in the FR at 900 °C. As can be seen, the main gas components were CO2, CO, CH4 and H2 in the FR. At the beginning of the reaction, the reductive gases (CH4, CO and H2) were oxidized by lattice oxygen. Therefore, the CO2 concentration for all OCs increased quickly. Subsequently, the unreacted reductive gases were measured, and their concentrations increased with the increase in the reduction time. It was implied that the lattice oxygen derived from OCs was consumed gradually with the increasing reaction time. At the same moment, the concentrations of CO2 for all three modified OCs were higher than that for the iron ore, while the concentrations of CH4, CO and H2 showed the opposite tendency. These results indicated that the presence of the metal oxides significantly enhanced the reactivity of the iron ore. For the same modified OC, the concentration of CH4 in the FR was the highest, followed by CO, and H2 was the lowest. In fact, the concentrations of CO and H2 in BPG were higher than that of CH4. These results indicated that the selectivity of the modified iron ore OCs toward the three reductive gases (namely CO, H2 and CH4) follow the order of H2 > CO > CH4. This result was consistent with the reduction rate of Fe2O3 in the different reductive gases.19,34,35 It was noted that the NiO–iron ore had the lowest concentration of CO and H2, and the CuO–iron ore exhibited the lowest CH4 concentration, indicating that the NiO–iron ore exhibited the highest selectivity toward CO and H2. The CuO–iron ore had the highest selectivity toward CH4.The OCs were reduced by BPG for 60 min at 900 °C in the FR. After that, the steam was introduced into the reactor to produce hydrogen in the SR. Fig. 4 presents the gas concentration profiles in the SR. The H2 concentration for the three OCs increased quickly, and then decreased. The instantaneous maximum H2 concentration for the three modified iron ores was higher than 60%, while the peak value of the H2 concentration for iron ore was just 38.75% under the same conditions. It was noted that a small amount of CO and CO2 products was detected in the SR. It was attributed to the oxidation of carbon deposited onto the OCs during the reduction stage in the FR. Both CO and CH4 can form carbon deposits through reactions (R1) and (R2) at relatively high temperatures. The carbon deposits formed on the surface of the OCs in the FR, and then reacted with steam in the SR to produce carbonaceous gases (R3 and R4), resulting in a decrease in the hydrogen purity.
| 2CO ⇔ CO2 + C | (R1) |
| CH4 ⇔ 2H2 + C | (R2) |
| C + H2O ⇔ H2 + CO | (R3) |
| C + 2H2O ⇔ 2H2 + CO2 | (R4) |
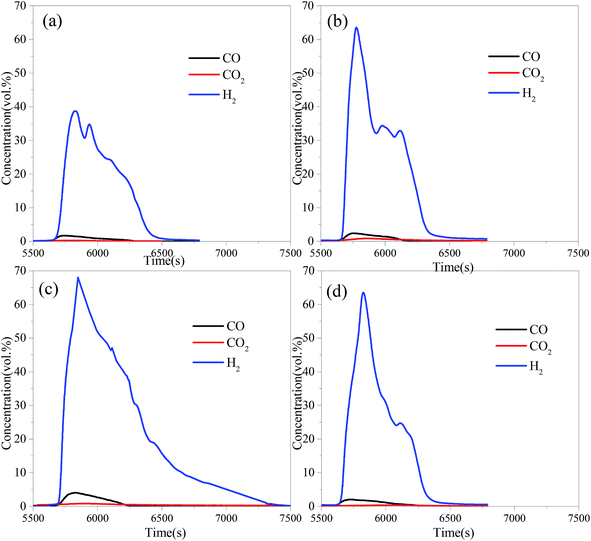 | ||
| Fig. 4 The gas concentration profiles in the SR with different OCs reduced by BPG for 60 min at 900 °C: (a) iron ore, (b) CuO–iron ore, (c) NiO–iron ore and (d) CeO2–iron ore. | ||
3.2 Effects of the reduction time in FR
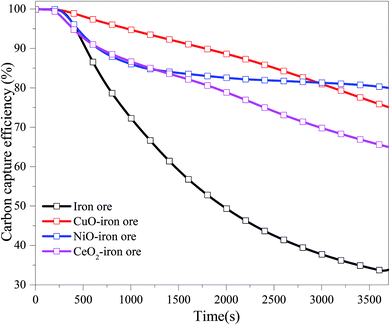
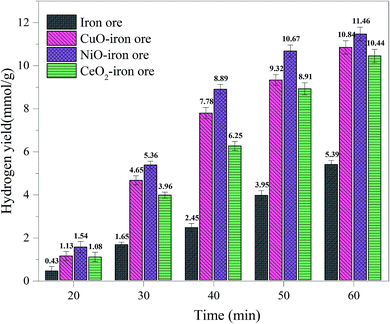
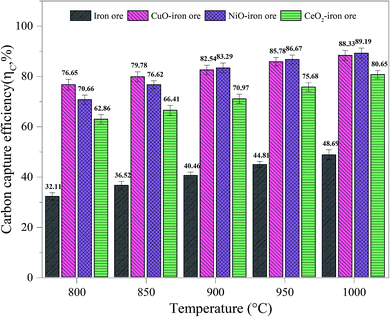
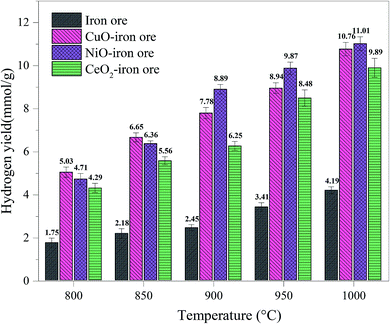
In general, more hydrogen can be obtained by increasing the reduction time in the FR. However, the longer the reduction time, the lower was the carbon capture efficiency. According to the comprehensive analysis of the hydrogen yield and carbon capture efficiency, it was concluded that the reduction time at ∼40 min in the FR at 900 °C was an optimal value. Under this condition, the hydrogen yields of the four OCs in the SR were 8.89 mmol g−1, 7.78 mmol g−1, 6.25 mmol g−1 and 2.45 mmol g−1 for the NiO–iron ore, CuO–iron ore, CeO2–iron ore and iron ore, respectively. In addition, the corresponding carbon capture efficiencies in the FR were 83.29%, 82.54%, 70.97% and 40.46%.
3.3 Effects of the reaction temperatures in FR
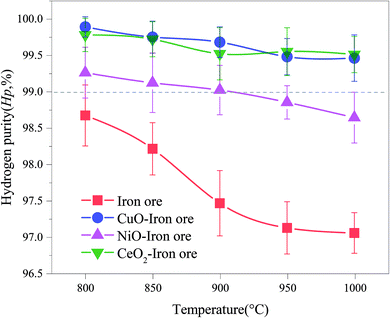
Temperature plays a key role in all chemical looping processes. In the CLH production process, temperature directly affected the carbon capture efficiency in the FR, hydrogen yield and purity in the SR and the regeneration rate of the OCs in the AR. In this section, the temperature effects were investigated. In each run, the reaction temperatures of the FR, SR and AR were identical. The reaction temperatures varied in the range of 800–1000 °C with an interval of 50 °C. The reduction time of the OCs in the FR by BPG was 40 min, the oxidation time of the OCs in the SR by steam was 60 min and the regeneration time of the OCs in the AR by air was 60 min.Generally, a high concentration of hydrogen can be obtained in the steam-iron process. In fact, small amounts of carbonaceous gas were observed in the SR, which were derived from the reactions between the deposited carbon and H2O. The carbon deposition not only decreased the reactivity of the OCs, but also contaminated the hydrogen produced in the steam oxidation stage, leading to the reduction in the hydrogen purity. Fig. 9 shows the varying trend of the hydrogen purity at different reaction temperatures. With the increase of temperatures of the FR, the hydrogen purity decreased. It was attributed to the fact that the high temperature enhanced the reactivity of OCs and promoted the subsequent BPG oxidation process. Therefore, the carbon deposition on the surface of the OC increased. At the same temperature, the hydrogen purity of the iron ore was lowest. This result confirmed that the addition of CuO, NiO and CeO2 played a role in inhibiting the carbon deposition. A hydrogen purity of >99.0% was achieved in the temperature range of 800–1000 °C using both CuO–iron ore and CeO2–iron ore as the OC. The hydrogen purity for the NiO–iron ore decreased from 99.26% at 800 °C to 98.64% at 1000 °C. Zeng et al.39 reported that the hydrogen yield and hydrogen purity varied from 1.66 mmol and 99% from to 2.81 mmol and 84%, respectively, when using a bio-oil heavy fraction as fuel and Fe2O3/Al2O3 (60 wt%/40 wt%) as the OC at 950 °C. Both the CuO–iron ore and CeO2–iron ore showed higher anti-coking ability compared with the NiO–iron ore. It was attributed to the fact that the metallic Fe and Ni in the deeply reduced OC have good catalytic performances for the CH4 decomposition reaction (R2).
3.4 Cyclic tests
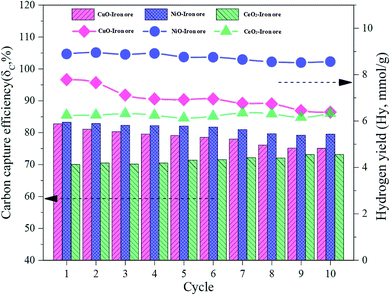
In order to investigate the cyclic performance of the modified iron ore OCs, a total of 10 cycles were conducted in the fluidized bed reactor. The temperatures of the FR, SR and AR were 900 °C. The reduction time in the FR, steam oxidation time in the SR and regeneration time in the AR were 40 min, 60 min and 60 min, respectively. As shown in Fig. 10, the carbon capture efficiency and hydrogen yield for the CuO–iron ore OC decreased from 82.54% and 7.78 mmol g−1 to 75.09% and 6.38 mmol g−1 with increasing cycles, respectively. The carbon capture efficiency increased slightly to 78.14% in a cyclic test of the CeO2–iron ore, and there was no significant trend change for the hydrogen yield. After 10 cycles, a hydrogen yield of 6.33 mmol g−1 was observed for the CeO2–iron ore. The carbon capture efficiency and hydrogen yield for the NiO–iron ore both decreased slightly, and achieved 79.51% and 8.89 mmol g−1 at the 10th cycle, respectively. These results indicated that the CeO2–iron ore and NiO–iron ore had good cyclic performances, while the reactivity of the CuO–iron ore decreased with an increase in the number cycle.3.5 Characterization of the OCs
| Samples | Fresh | Reduced | Oxidized by H2O | Oxidized by air | After 10 redox cycles |
|---|---|---|---|---|---|
| Iron ore | Fe2O3 | FeO, Fe3O4 | Fe3O4 | Fe2O3 | Fe2O3 |
| CuO–iron ore | Fe2O3, CuO, CuFe2O4 | FeO, Fe, Cu | Cu, Fe3O4 | Fe2O3, CuFe2O4 | Fe2O3, CuFe2O4 |
| NiO–iron ore | Fe2O3, NiO, NiFe2O4 | Ni,FeO, (Ni, Fe), Fe | Ni, Fe3O4 | Fe2O3, NiFe2O4 | Fe2O3, NiFe2O4 |
| CeO–iron ore | Fe2O3, CeO2 | FeO, CeFeO3, Fe | Fe3O4, CeFeO3 | Fe2O3, CeO2 | Fe2O3, CeO2 |
In the reduced samples, the unmodified iron ore was mainly reduced into FeO and Fe3O4; the CuO–iron ore was reduced into Cu, FeO and Fe; the NiO–iron ore was reduced into Ni, FeO, (Ni, Fe) and Fe; while the CeO2–iron ore was reduced into FeO, CeFeO3 and Fe. The reduction of Fe2O3 to Fe3O4 did not contribute to the production of hydrogen in the oxidation step. Therefore, the unmodified iron ore displayed the lowest hydrogen yield. The Fe3O4 phase was not observed in the modified OCs after the reduction reaction. These results suggested that the metal oxides promote the reduction of Fe3O4. It was noted that CeFeO3 with a perovskite structure (ABO3) was detected in the reduced sample of the CeO2–iron ore OC. Many researchers also reported that Fe2O3, together with CeO2, forms a perovskite-type CeFeO3, which improved the reversibility of the Fe2O3 redox reaction.40,45–47 Gu et al.40 reported that the abundant Ce3+ ions in CeFeO3 might act as a catalyst to enhance the reducibility of the Ce and Fe oxides. Zhu et al.47 found that the formation of CeFeO3 enhanced the oxygen mobility of the CeO2–Fe2O3 OC.
After the steam oxidation process, the Fe species contained in the OCs were mainly oxidized into Fe3O4 to produce hydrogen. When the CeO2–iron ore was used as an OC, CeFeO3 remained after the steam oxidation process. Thus, the Fe element contained in CeFeO3 was not oxidized by steam to produce hydrogen. This can be used to explain how the CeO2–iron ore OC had a lower hydrogen yield in comparison with that of the CuO–iron ore and NiO–iron ore OCs.
In the regenerated samples, Fe3O4 was further oxidized to Fe2O3 by air in the AR. Both NiO and CuO disappeared and instead, CuFe2O4 and NiFe2O4 with a spinel structure were observed in the CuO–iron ore and NiO–iron ore OCs, respectively. It was due to the reaction of NiO and CuO with the iron ore during the redox cycles. CeFeO3 was oxidized to CeO2 and Fe2O3 by air. It was reported that CeFeO3 was unstable in an oxidation atmosphere.40 Compared with the components of the OCs at the first and tenth cycle, it can be found that the crystal phase of the OCs did not change significantly.
| Samples | Fresh OCs | OCs after 10 cycles | ||||
|---|---|---|---|---|---|---|
| Specific areas (m2 g−1) | Average pore diameter (nm) | Total pore volumes (cm3 g−1) | Specific areas (m2 g−1) | Average pore diameter (nm) | Total pore volumes (cm3 g−1) | |
| Iron ore | 0.303 | 7.87 | 0.0015 | 0.201 | 7.33 | 0.0019 |
| CuO–iron ore | 0.746 | 8.46 | 0.0017 | 0.422 | 10.76 | 0.0022 |
| NiO–iron ore | 0.603 | 10.91 | 0.0022 | 0.582 | 11.62 | 0.0016 |
| CeO2–iron ore | 0.549 | 7.24 | 0.0019 | 0.513 | 8.64 | 0.0017 |
4 Conclusions
The CLH production process with the modified iron ore as OCs was conducted in a fluidized-bed reactor, where the OCs were first reduced by simulated BPG and then reacted with steam to produce H2, and finally fully oxidized by air. The carbon capture efficiency increased with the decrease in the reduction time, but it presented an opposite trend as the temperature increased in the FR. Increasing the reduction temperature and time can improve the hydrogen yield. It was concluded that a condition of 900 °C with the reduction time of 40 min was suitable for hydrogen production and carbon capture. At this condition, the carbon capture efficiency for the NiO–iron ore, CuO–iron ore and CeO–iron ore were 83.29%, 82.75% and 70.05%, respectively. The corresponding hydrogen yield and purity were 8.89 mmol g−1 and 99.02%, 7.78 mmol g−1 and 99.68%, and 6.25 mmol g−1 and 99.52%, respectively. NiFe2O4, CuFe2O4 and CeFeO3, which were observed in the CuO–iron ore and NiO–iron ore samples, enhanced the reactivity of the iron ore and promoted its reduction. Both NiO–iron ore and CeO2–iron ore exhibited good cycle performances, while the sintering of the CuO–iron ore led to a decrease in the reactivity. Although the NiO–iron ore exhibited the highest carbon deposition and the lowest hydrogen purity compared with the CuO–iron ore and CeO–iron ore, the NiO–iron ore was the best OC for hydrogen production due to its high hydrogen yield and high cycle performance.Conflicts of interest
There are no conflicts to declare.Acknowledgements
The research received financial support from the National Key Research and Development Program of China (2018YFB1502901). Meanwhile, the authors would also like to acknowledge the Analytical and Testing Center of Huazhong University of Science & Technology (HUST) for the analysis of the OC samples.References
- I. Dincer and C. Acar, Int. J. Hydrogen Energy, 2017, 42, 14843–14864 CrossRef CAS.
- R. Kothari, D. Buddhi and R. L. Sawhney, Renewable Sustainable Energy Rev., 2008, 12, 553–563 CrossRef CAS.
- M. Luo, Y. Yi, S. Wang, Z. Wang, M. Du, J. Pan and Q. Wang, Renewable Sustainable Energy Rev., 2018, 81, 3186–3214 CrossRef CAS.
- S. Ma, S. Chen, A. Soomro and W. Xiang, Int. J. Hydrogen Energy, 2017, 42, 11006–11016 CrossRef CAS.
- T. Mendiara, F. García-Labiano, A. Abad, P. Gayán, L. F. de Diego, M. T. Izquierdo and J. Adánez, Appl. Energy, 2018, 232, 657–684 CrossRef CAS.
- D. Zeng, S. Peng, C. Chen, J. Zeng, S. Zhang, H. Zhang and R. Xiao, Int. J. Hydrogen Energy, 2016, 41, 22711–22721 CrossRef CAS.
- D. Zeng, R. Xiao, S. Zhang and H. Zhang, Fuel Process. Technol., 2015, 139, 1–7 CrossRef CAS.
- K. Kang, C. Kim, K. Bae, W. Cho, S. Kim and C. Park, Int. J. Hydrogen Energy, 2010, 35, 12246–12254 CrossRef CAS.
- K. Svoboda, A. Siewiorek, D. Baxter, J. Rogut and M. Punčochář, Chem. Pap., 2007, 61, 110–120 CAS.
- S. Takenaka, N. Hanaizumi, V. T. D. Son and K. Otsuka, J. Catal., 2004, 228, 405–416 CrossRef CAS.
- P. Chiu and Y. Ku, Aerosol Air Qual. Res., 2012, 12, 1421–1432 CrossRef CAS.
- P. Chiesa, G. Lozza, A. Malandrino, M. Romano and V. Piccolo, Int. J. Hydrogen Energy, 2008, 33, 2233–2245 CrossRef CAS.
- D. Zeng, Y. Qiu, S. Peng, C. Chen, J. Zeng, S. Zhang and R. Xiao, J. Mater. Chem. A, 2018, 6, 11306–11316 RSC.
- Z. Huang, F. He, Y. Feng, K. Zhao, A. Zheng, S. Chang, G. Wei, Z. Zhao and H. Li, Energy Fuels, 2013, 28, 183–191 CrossRef.
- Q. Chen, S. Hu, J. Xiang, S. Su, L. Sun, Y. Wang, L. Zhang and H. Chi, Fuel Process. Technol., 2016, 146, 56–61 CrossRef CAS.
- M. Ismail, W. Liu and S. A. Scott, Energy Procedia, 2014, 63, 87–97 CrossRef CAS.
- R. V. Siriwardane, E. Ksepko, H. Tian, J. Poston, T. Simonyi and M. Sciazko, Appl. Energy, 2013, 107, 111–123 CrossRef CAS.
- S. Sun, M. Zhao, L. Cai, S. Zhang, D. Zeng and R. Xiao, Energy Fuels, 2015, 29, 7612–7621 CrossRef CAS.
- Z. Yu, Y. Yang, S. Yang, Q. Zhang, J. Zhao, Y. Fang, X. Hao and G. Guan, Carbon Resour., 2019, 2, 23–34 Search PubMed.
- H. Leion, E. Jerndal, B. Steenari, S. Hermansson, M. Israelsson, E. Jansson, M. Johnsson, R. Thunberg, A. Vadenbo, T. Mattisson and A. Lyngfelt, Fuel, 2009, 88, 1945–1954 CrossRef CAS.
- T. Song, T. Shen, L. Shen, J. Xiao, H. Gu and S. Zhang, Fuel, 2013, 104, 244–252 CrossRef CAS.
- H. Leion, A. Lyngfelt and T. Mattisson, Chem. Eng. Res. Des., 2009, 87, 1543–1550 CrossRef CAS.
- D. Zeng, R. Xiao, Z. Huang, J. Zeng and H. Zhang, Int. J. Hydrogen Energy, 2016, 41, 6676–6684 CrossRef CAS.
- R. Xiao, S. Zhang, S. Peng, D. Shen and K. Liu, Int. J. Hydrogen Energy, 2014, 39, 19955–19969 CrossRef CAS.
- Z. Huang, F. He, Y. Feng, R. Liu and K. Zhao, Int. J. Hydrogen Energy, 2013, 38, 14568–14575 CrossRef CAS.
- Z. Yu, C. Li, Y. Fang, J. Huang and Z. Wang, Energy Fuels, 2012, 26, 2505–2511 CrossRef CAS.
- Z. Huang, F. He, K. Zhao, A. Zheng, H. Li and Z. Zhao, Prog. Chem., 2012, 24, 1599–1609 CAS.
- J. Lachén, J. Plou, P. Durán, J. Herguido and J. A. Peña, Int. J. Hydrogen Energy, 2017, 42, 13607–13616 CrossRef.
- L. Wang, L. Shen, W. Liu and S. Jiang, Energy Fuels, 2017, 31, 8423–8433 CrossRef CAS.
- W. Liu, L. Shen, H. Gu and L. Wu, Energy Fuels, 2015, 30, 1756–1763 CrossRef.
- H. Gu, S. Lang, G. Song, S. Zhang, M. Niu, W. Liu and L. Shen, Chem. Eng. J., 2019, 360, 260–270 CrossRef CAS.
- J. Bao, Z. Li and N. Cai, Ind. Eng. Chem. Res., 2013, 52, 6119–6128 CrossRef CAS.
- H. Gu, L. Shen, J. Xiao, S. Zhang, T. Song and D. Chen, Combust. Flame, 2012, 159, 2480–2490 CrossRef CAS.
- M. M. Hossain and H. I. de Lasa, Chem. Eng. Sci., 2008, 63, 4433–4451 CrossRef CAS.
- T. Mendiara, A. Abad, L. F. de Diego, F. García-Labiano, P. Gayán and J. Adánez, Chem. Eng. J., 2019, 359, 37–46 CrossRef CAS.
- M. A. Pans, P. Gayán, L. F. de Diego, F. García-Labiano, A. Abad and J. Adánez, Chem. Eng. Res. Des., 2015, 93, 736–746 CrossRef CAS.
- X. Wang, Z. Chen, M. Hu, Y. Tian, X. Jin, S. Ma, T. Xu, Z. Hu, S. Liu, D. Guo and B. Xiao, Chem. Eng. J., 2017, 312, 252–262 CrossRef CAS.
- H. Shin, S. Choi, K. Jung and S. Han, Chem. Mater., 2001, 13, 1238–1242 CrossRef CAS.
- D. Zeng, R. Xiao, S. Zhang and H. Zhang, Fuel Process. Technol., 2015, 139, 1–7 CrossRef CAS.
- Z. Gu, K. Li, S. Qing, X. Zhu, Y. Wei, Y. Li and H. Wang, RSC Adv., 2014, 4, 47191–47199 RSC.
- B. Wang, R. Yan, H. Zhao, Y. Zheng, Z. Liu and C. Zheng, Energy Fuels, 2011, 25, 3344–3354 CrossRef CAS.
- X. Niu, L. Shen, S. Jiang, H. Gu and J. Xiao, Chem. Eng. J., 2016, 294, 185–192 CrossRef CAS.
- S. Jiang, L. Shen, J. Wu, J. Yan and T. Song, Chem. Eng. J., 2017, 317, 132–142 CrossRef CAS.
- A. M. Banerjee, M. R. Pai, S. S. Meena, A. K. Tripathi and S. R. Bharadwaj, Int. J. Hydrogen Energy, 2011, 36, 4768–4780 CrossRef CAS.
- K. Li, M. Haneda, Z. Gu, H. Wang and M. Ozawa, RSC Adv., 2013, 93, 129–132 CAS.
- K. Li, H. Wang, Y. Wei and D. Yan, Chem. Eng. J., 2010, 156, 512–518 CrossRef CAS.
- X. Zhu, K. Li, Y. Wei, H. Wang and L. Sun, Energy Fuels, 2014, 28, 754–760 CrossRef CAS.
| This journal is © The Royal Society of Chemistry 2019 |

