
 Open Access Article
 This Open Access Article is licensed under a Creative Commons Attribution-Non Commercial 3.0 Unported Licence
Near-infrared (NIR) surface-enhanced Raman spectroscopy (SERS) study of novel functional phenothiazines for potential use in dye sensitized solar cells (DSSC)†
Bastian Moll‡
a,
Thomas Tichelkamp‡b,
Susann Wegnera,
Biju Francis a,
Thomas J. J. Müller*b and
Christoph Janiak*a
a,
Thomas J. J. Müller*b and
Christoph Janiak*a
aInstitut für Anorganische Chemie und Strukturchemie, Heinrich-Heine-Universität, D-40204 Düsseldorf, Germany. E-mail: janiak@uni-duesseldorf.de
bInstitut für Organische Chemie und Makromolekulare Chemie, Heinrich-Heine-Universität, D-40204 Düsseldorf, Germany. E-mail: ThomasJJ.Mueller@hhu.de
First published on 15th November 2019
Abstract
Phenothiazines are of potential use as dye sensitizers in Grätzel-type dye sensitized solar cells (DSSC). Plasmonic nanoparticles like gold nanoparticles can enhance the power conversion efficiency of these solar cells. In this work near-infrared surface-enhanced Raman spectroscopy (NIR-SERS) is used to investigate the interaction between six novel phenothiazine-merocyanine dyes containing the three different functional groups rhodanine, 1,3-indanedione and cyanoacylic acid with plasmonic nanomaterials, to decide if the incorporation of plasmonic nanoparticles could enhance the efficiency of a Grätzel-type solar cell. The studies were carried out in the solution state using spherical and rod-shaped gold nanostructures. With KCl induced agglomerated spherical gold nanoparticles, forming SERS hot spots, the results showed low detection limits between 0.1 μmol L−1 for rhodanine containing phenothiazine dyes, because of the formation of Au–S bonds and 3 μmol L−1 for cyanoacrylic acid containing dyes, which formed H-aggregates in the watery dispersion. Results with gold nanorods showed similar trends in the SERS measurements with lower limits of detection, because of a shielding effect from the strongly-bound surfactant. Additional fluorescence studies were carried out to determine if the incorporation of nanostructures leads to fluorescence quenching. Overall we conclude that the addition of gold nanoparticles to rhodanine and 1,3-indanedione containing phenothiazine merocyanine dyes could enhance their performance in Grätzel-type solar cells, because of their strong interactions with plasmonic nanoparticles.
Introduction
Phenothiazines, dibenzo anellated 1,4-thiazines,1 are a particularly interesting class of functional organic molecules with a broad spectrum of applications ranging from pharmaceuticals to redox probes to functional chromophores. Their use as pharmaceuticals (Fig. 1) encompasses antihistaminics,2 sedatives, anxiolytic agents, psychotropic drugs,3,4 as well as antioxidants for the treatment of neurodegenerative diseases.5 In addition, methylene blue, a phenothiazine derivative, has been revealed as an active agent against Alzheimer's disease.6 While toxicity for humans is low, high toxicity for insects, bacteria and fungi has favored the use of phenothiazines as insecticides, antibacterial, and antifungal agents.7,8 Also, the peculiar occurrence of both luminescence and redox activity has made phenothiazines and their oligomers particularly interesting as redox switchable luminophores,9 dye sensitizers in Grätzel-type solar cells,10 and as donors in photoinduced intramolecular electron transfer systems.11 Arylated and alkynylated phenothiazines12 have been employed as redox-active monolayers on gold13 or zinc and iron surfaces14 and the electronic and chemical properties of the phenothiazine backbone offer their potential use as functional materials in Li-ion technology15 as well.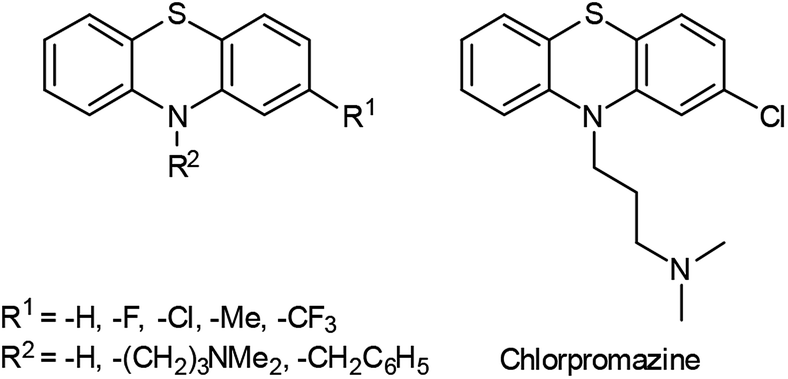 | ||
| Fig. 1 Lead structure of many phenothiazine based pharmaceuticals and chlorpromazine as typical neuroleptic in the phenothiazine series. | ||
In the growing interest of renewable energies, organic photovoltaics are an attractive interest of research, because they are believed to possess the potential to be low cost manufactured with high power conversion efficiencies (PCE).16 In 1991 O'Reagan and Grätzel presented the first concept of a dye-sensitized solar cell (DSSC).17 In a typical DSSC a sintered mesoporous oxide layer, mostly TiO2, ensures electronic conductivity. Attached to this nanocrystalline layer, a monolayer of a charge transfer dye acts as an absorber. Most conveniently iodide/triiodide as a redox-active electrolyte warrants the regeneration of the oxidized dye,18 and a platinum coated glass surface is used as the cathode to complete the photocurrent circuit.19 First dye sensitizers mostly contained ruthenium complexes as dyes, such as dye N3, a cis-RuL2(NCS)2 complex introduced by Grätzel et al. in 1993.20
Since then a wide variety of metal-based and metal-free dyes were investigated,21 including phenothiazines22 and phenothiazine merocyanines.10b Since 1991 much effort was put in enhancing the efficiency of dye sensitized solar cells by optimizing dyes, electrolytes and all other components of the solar cells.23 Furthermore, light absorption in the solar cell can be increased. An option is the use of plasmonic nanoparticles, such as gold or silver nanoparticles.24 Other plasmonic nanostructures like nanorods were also tested for enhancing the light absorption.25
Plasmonic nanoparticles increase photocurrents of DSSCs taking advantage of the localized surface plasmon resonance (LSPR) as nano antennae. A similar effect is surface-enhanced Raman scattering (SERS).26,27 The LSPR enhances photocurrents through excitation of electrons in dyes (HOMO–LUMO transition).26 Since its first observation in 1973 by Fleischmann et al.28 and the discovery of single-molecule detection by Nie et al.29 and Kneipp et al.,30 SERS turned out to be a highly sensitive spectroscopic method,31,32 used for the detection of explosives33 and even bacteria,34 as documented in numerous publications. Likewise a highly sensitive spectroscopic tool offers great potential for drug detection.35,36 Key to this spectroscopic method is the presence of coinage metal nanoparticles, preferentially gold and silver,37 but copper is also an applicable SERS substrate.38,39 Their LSPR,40 i.e. the induced oscillation of conduction electrons of the metal due to resonant laser excitation (Fig. 2a), induces a dipole with the angular frequency ωinc which emits radiation as a resonant elastic scattering off the metal sphere.40 A molecule can interact with the local electric field near to the surface of a metal sphere and the outgoing field ωinc − ωvib is able to excite a LSPR of metal nanoparticles, in which the intensity of the SERS effect depends on the incoming field ωinc and the outgoing field (Fig. 2b).40
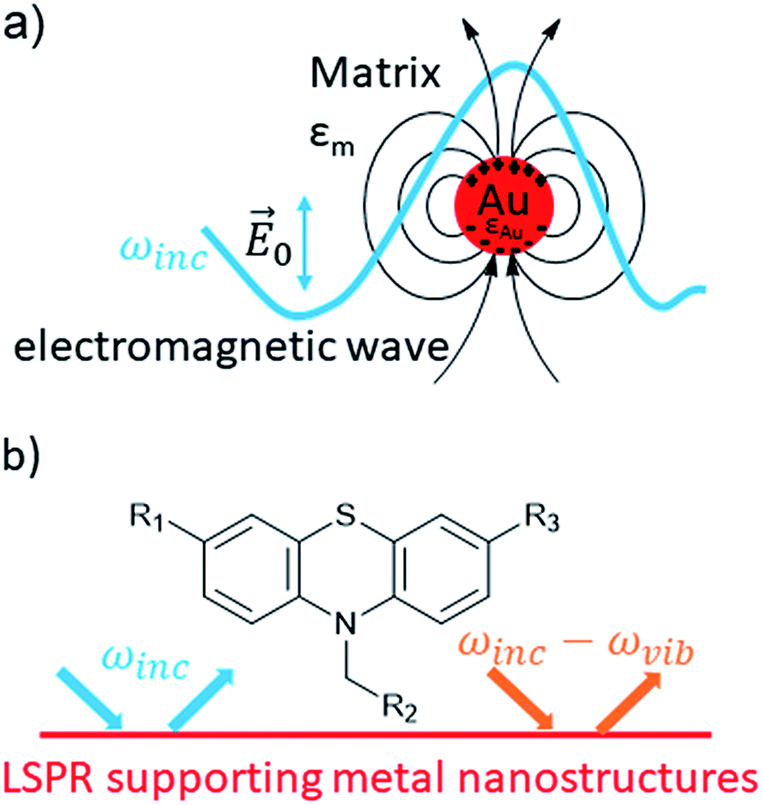 | ||
| Fig. 2 Electromagnetic effects involved in Surface-Enhanced-Raman-Scattering (SERS). | ||
Very high enhancement factors can be obtained in localized regions between two or more particles. These spots are called “hot spots”. In the absence of hot spots, the enhancement factor is limited to the order of 103, whereas in sections between 1 and 5.5 nm the enhancement factor ranges around 107–1011.40
In 2013 Tatsuma et al. reported an optimized enhancement of photocurrents in DSSCs in hot spots between nanoparticles, comparable to hot spots in surface-enhanced Raman spectroscopy.26 Incorporation of plasmonic nanoparticles in DSSC could enable elucidating SERS studies on solar cell dye characteristics and photocurrent enhancements. Also, forced agglomeration of the nanoparticles leading to hot spots, will lead to potential use in DSSC through the enhancement in SERS intensity.
Here we report SERS studies with a series of six novel intensively fluorescent phenothiazine push–pull chromophores (Fig. 3) directed to investigate the potential utility of these dyes in enhanced DSSC plasmonic nanomaterials. The phenothiazine luminophores are divided into three subgroups: Phenothiazine dyes (PD) 1 and 2 bear a rhodanine group, PD 3 and 4 a 1,3-indanedione group, while dyes 5 and 6 possess a cyanoacrylic acid functionality (for their preparation, see ESI†). Solutions of all six phenothiazines were examined by Raman spectroscopy in the presence of spherical gold nanoparticles (Au-NP) and gold nanorods (Au-NR) for assessing the SERS effect.
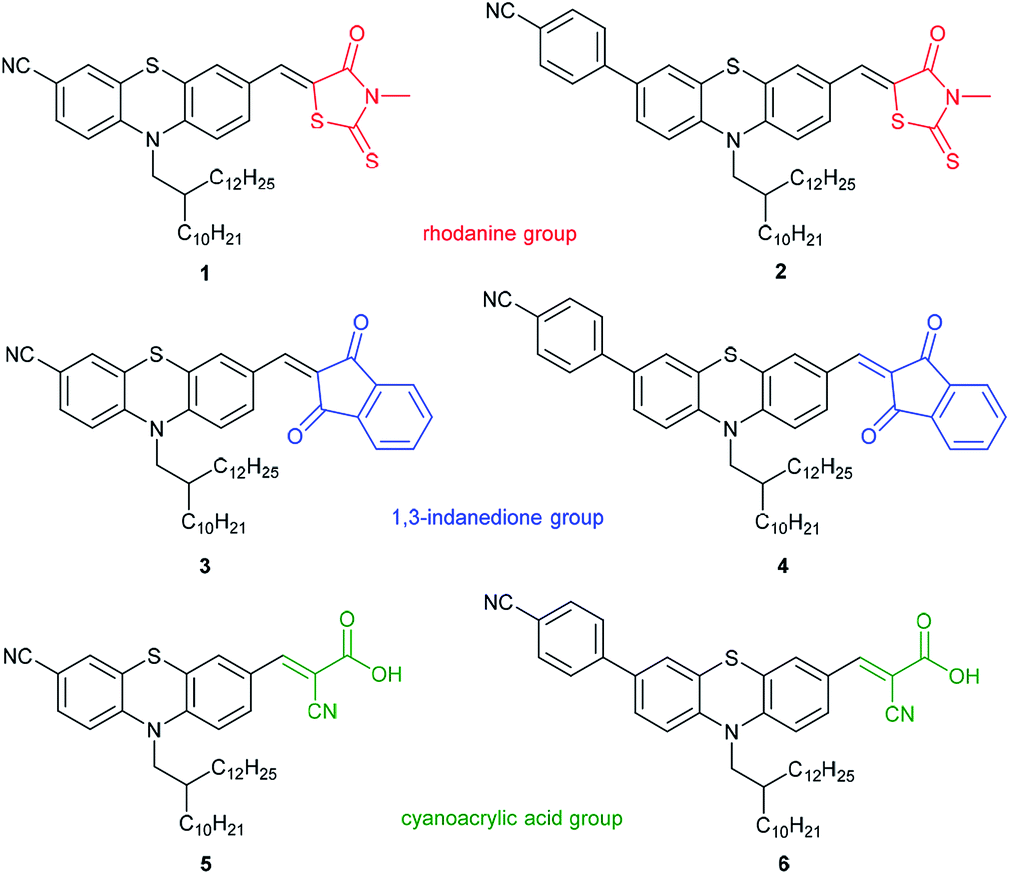 | ||
| Fig. 3 Phenothiazine dyes (PD) 1–6 used in this work for quantification through the SERS effect. | ||
Experimental
Chemicals
All chemicals, whose syntheses are not described in this work, were obtained commercially: potassium tetrachloroaurate from chemPUR, dopamine hydrochloride, cetyltrimethylammonium bromide and trisodium citrate from Alfa Aesar, sodium borohydride from J. T. Baker. All chemicals were analysis or HPLC-grade and used without further purification. Ultrapure water was generated by a Merck Millipore Synergy® instrument. The phenothiazines 1–6 were synthesized in analogy to related phenothiazinyl merocyanines (see ESI†).9a,10bInstrumentation
UV/Vis spectra were measured with a Shimadzu UV-2450 (190–900 nm) and an Analytik Jena Specord S 600 (190–1100 nm). Near-infrared absorption measurements were carried out using a PerkinElmer UV/Vis/NIR Spectrometer Lambda 19. Fluorescence spectra were obtained using a Hitachi F-7000 spectrophotometer. Excitation wavelengths were determined through UV/Vis spectroscopy. Fluorescence cuvettes, made of quartz glass, were used. Raman spectra were collected using a Bruker MultiRAM with a Nd:YAG-laser (wavelength 1064 nm). All samples were measured with comparable settings. The Raman spectra of pure phenothiazines were measured in the solid state. SERS spectra were obtained in solution/dispersion with 200–700 mW laser power, 250 scans and an aperture width of 4 mm. After addition of phenothiazine solution to the nanomaterial dispersion about 0.2 mL of the mixture was placed into an NMR tube and the Raman spectrum was recorded immediately. Only laser intensities were varied, depending on the signal intensities. The Raman instrument used in this work, intentionally made use of an NIR laser with an excitation wavelength of 1064 nm coupled with an FT-Raman spectrometer. This instrument setting is generally used to minimize fluorescence background in Raman spectroscopy. The excitation wavelength in the near-infrared is used because in general it does not provide enough energy to excite molecules to higher electronic states which is required for fluorescence relaxation. Measurements within the near-infrared wavelength of 780–1064 nm are of great importance. With this excitation wavelength, the excitation of fluorescence is minimized or excluded, which otherwise can interfere with the Raman signals. So for NIR- and IR-lasers higher intensities in the laser power are possible, without inducing “photobleaching” processes, which are photochemical reactions of a fluorophore that lead to a loss of fluorescence.41,42 The disadvantages of NIR-lasers are the dependence of the Raman intensity on the excitation wavelength which decreases with the factor λ−4 (ref. 43) and the lower sensitivity towards near-infrared radiation of modern CCD-detectors.44 Thus, to obtain high SERS enhancements, it is important to excite the LSPR efficiently by matching it as best as possible with the excitation wavelength of the laser.Transmission electron microscopy (TEM) images were obtained with a TECNAI G2 F20 from FEI at the “Ernst Ruska Zentrum für Mikroskopie und Spektroskopie mit Elektronen” in Jülich. The images were taken at room temperature with an acceleration voltage of 200 kV. For the measurements, the sample was deposited onto a carbon-coated copper grid (CF200-Cu Mesh) and dried under air. For TEM-EDX (transmission electron microscopy-energy dispersive X-ray spectroscopy) the exposure time for individual EDX spectra was 3 min. (The EDX analyses always showed traces of oxygen as a result of the preparation of the grids in air.)
Synthesis of spherical gold nanoparticles
Spherical gold nanoparticles (Au-NPs) were synthesized via the modified Turkevich route45 by microwave heating of 8 mg (21.2 μmol) KAuCl4 and 10 mg (38.8 μmol) trisodium citrate in Millipore water (40 mL) for 2 min (see ESI† for details). The TEM images showed an average particle diameter of 36 ± 7 nm (see images and histogram in Fig. S1 ESI†). In the UV/Vis spectrum a peak for the LSPR was observed at 525 nm (Fig. S3 ESI†).Synthesis of gold nanorods
Gold nanorods (Au-NRs) were prepared using a seedless synthesis with dopamine as a reducing agent, potassium tetrachloroaurate as a gold precursor and cetyltrimethylammonium bromide (CTAB) as a stabilising agent in aqueous solution (see ESI† for details).46 TEM analysis (Fig. S5 ESI†) gave 89 ± 13 nm for the nanorod length and 21 ± 6 nm for the nanorod width (histogram in Fig. S5 in ESI†).The LSPR signal is visible at 542 nm (transversal axis) and 937 nm (longitudinal axis) in the UV/Vis spectrum (Fig. S6† in ESI†).
Phenothiazine stock solutions
Stock solutions of the phenothiazines 1–6 with a concentration of c = 0.33 mM were prepared by dissolving 3.3 × 10⁻³ mmol of the phenothiazines in 10 mL of acetone.Nanoparticle dispersions
For spherical gold nanoparticles and gold nanorods the gold concentrations of the aqueous dispersions were c = 0.53 mM (0.1 g L−1).Spherical gold nanoparticle-phenothiazine dispersions with KCl
10 mg (0.13 mmol) of solid KCl were dissolved in 1.5 mL of acetone (to give c = 0.04 mM) and then an aliquot of the phenothiazine stock solution was added: 30 μL (to give c (phenothiazine) = 3.24 μM), 10 μL (to give c (phenothiazine) = 1.11 μM) or 1 μL (to yield c (phenothiazine) = 0.11 μM) of phenothiazine in the final solution. Then 1.5 mL of the nanoparticle dispersion was added to the solution and thoroughly mixed. About 0.2 mL of the mixture was placed into an NMR tube and the Raman spectrum was recorded immediately. (Less suitable gold nanoparticle-phenothiazine dispersions without KCl were prepared with the same stoichiometries but no KCl added.)Gold nanorod-phenothiazine dispersions
To 1.5 mL of acetone an aliquot of the phenothiazine stock solution was added: 30 μL (to give c (phenothiazine) = 3.24 μM), 10 μL (to give c (phenothiazine) = 1.11 μM) or 1 μL (to yield c (phenothiazine) = 0.11 μM) of phenothiazine in the final solution. 1.0 mL of water was added to the solution, followed by 0.5 mL of gold nanorod dispersion and the combined solution was thoroughly mixed. 0.2 mL of the sample was placed into an NMR tube and the Raman spectrum was recorded immediately. Dispersions of spherical Au-NPs and Au-NRs with phenzothiazines had the same final concentration.Results and discussion
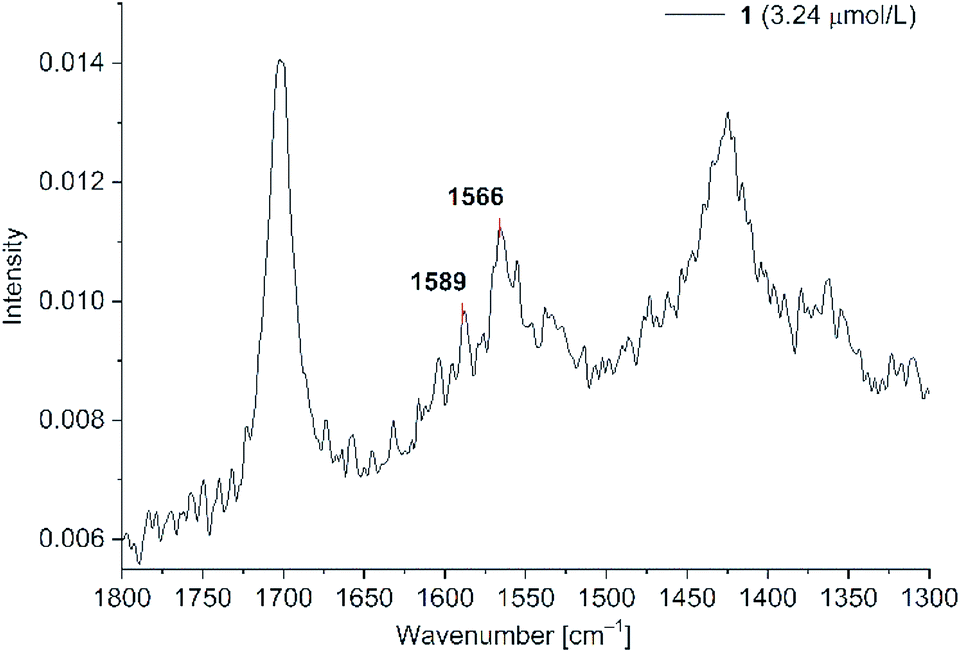
The nanoparticle dispersions were synthesized in water with trisodium citrate for spherical nanoparticles and CTAB for Au-NRs as capping agents to obtain stable dispersions. We chose gold nanomaterials over other metal nanoparticles, because of their higher stability and reported potential in photocurrent enhancement.26,27 PD 1–6 were essentially insoluble in water, i.e. the solubility was below the detection limit of UV/Vis and Raman spectroscopy. For studying the interaction of PD 1–6 with gold nanoparticles in solution a solvent system had to be established. From their non-polar structure, the phenothiazine dyes exhibited good solubility only in nonpolar solvents such as dichloromethane. While their solubility in water–miscible solvents, such as acetonitrile and ethanol, was too poor, water–miscible acetone allowed for preparing phenothiazine dye solutions with a concentration up to 0.33 mM. Still, this concentration was not high enough for solution-state Raman spectroscopy. Therefore, comparisons of the PD@Au-NP solution spectra had to be made with solid-state Raman spectra of the neat phenothiazine dyes. Fig. 4 shows the solid state spectrum of PD 1. The strong signals around 1600 cm−1 refer to the “C![[double bond, length as m-dash]](https://www.rsc.org/images/entities/char_e001.gif) C” stretching vibrations. At 1225 cm−1 signals for C–H stretching vibrations, and at 1407 cm−1 –CH2 and –CH3 stretching vibrations are visible. At 2228 cm−1 signals for the –C
C” stretching vibrations. At 1225 cm−1 signals for C–H stretching vibrations, and at 1407 cm−1 –CH2 and –CH3 stretching vibrations are visible. At 2228 cm−1 signals for the –C![[triple bond, length as m-dash]](https://www.rsc.org/images/entities/char_e002.gif) N group are seen. The signals for –CO in other phenothiazines were present at 1650–1800 cm−1, depending on the functional group present in the PD.
N group are seen. The signals for –CO in other phenothiazines were present at 1650–1800 cm−1, depending on the functional group present in the PD.
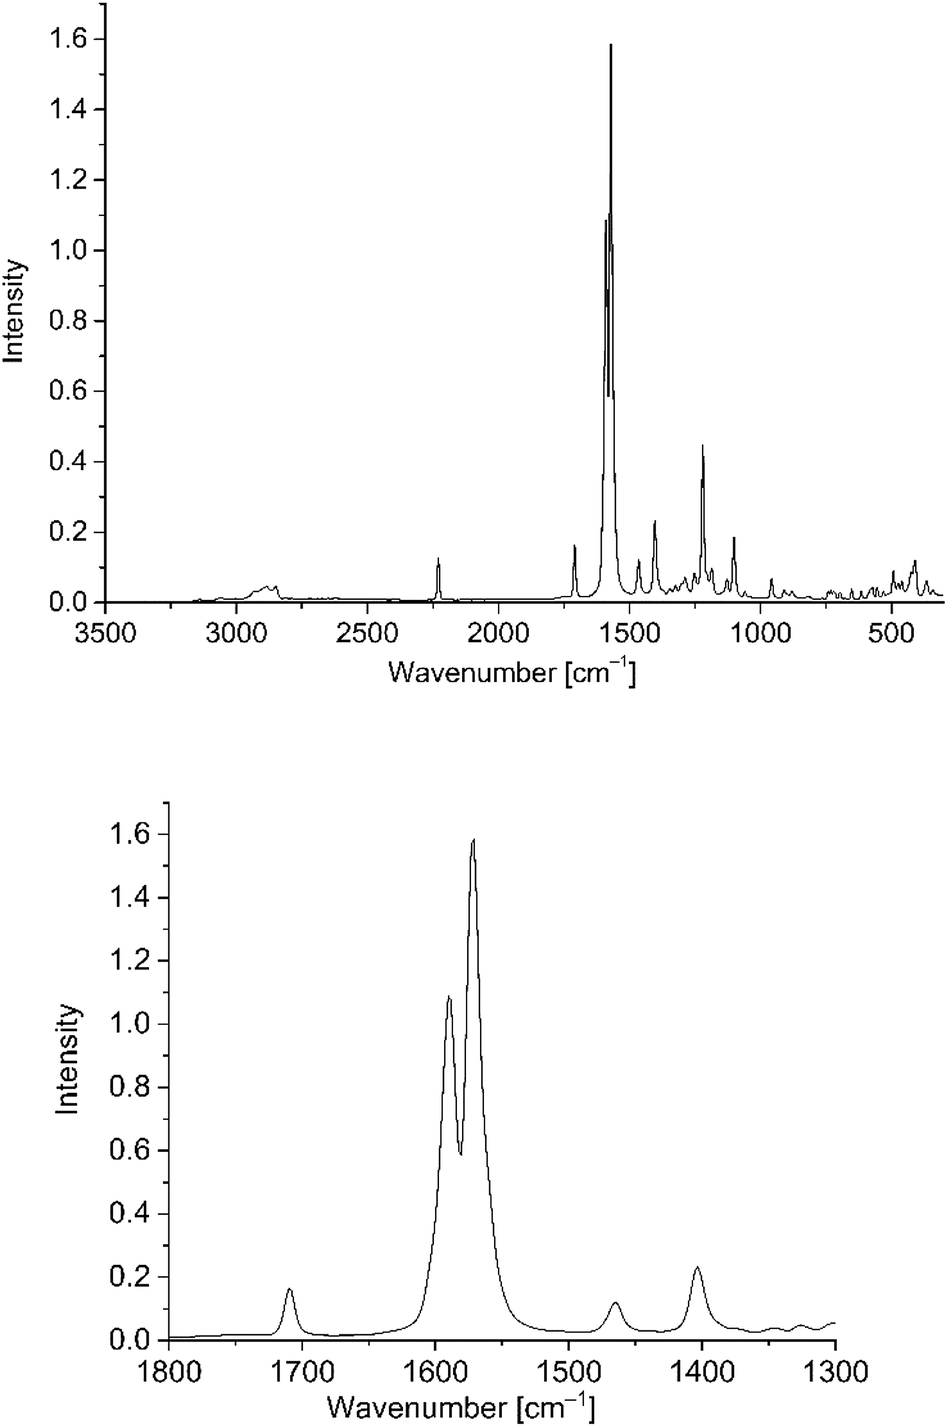 | ||
| Fig. 4 Solid-state Raman spectrum of PD 1 (top) as overview from 3500 to 500 cm−1 and (bottom) with the relevant CC stretching region from 1800 to 1300 cm−1 which was used for the subsequent SERS studies. It is important, that the signal at 1600 cm−1 does not interfere with the solvent signals from the water/acetone mixture (Fig. S7 in ESI†). | ||
Very weak signals of C–C vibrations appeared at 670–1100 cm−1. Of special interest are CC stretching vibrations, which occur for all used phenothiazines as very strong signals (see Fig. S7 in ESI†).47
Spherical gold nanoparticles (Au-NP)
The plasmon resonance of spherical gold nanoparticles in water at 525 nm48 is slightly shifted to 528 nm upon addition of acetone (to a water/acetone 1![[thin space (1/6-em)]](https://www.rsc.org/images/entities/char_2009.gif) :1 v/v mixture). In addition, a shoulder formed at around 680 nm which grew in intensity over the first 10 minutes and then remained stable for 17 h (Fig. 5). This suggests agglomeration of the Au-NPs after the addition of acetone.
:1 v/v mixture). In addition, a shoulder formed at around 680 nm which grew in intensity over the first 10 minutes and then remained stable for 17 h (Fig. 5). This suggests agglomeration of the Au-NPs after the addition of acetone.
 | ||
| Fig. 5 Time-dependent UV/Vis study of aqueous Au-NP after the addition of acetone (to a 1:1 v/v mixture). | ||
The agglomeration of the Au-NPs in the H2O/acetone dispersion was not evident in TEM images in comparison to TEM images from the aqueous Au-NP dispersion (compare Fig. S1 and S4 in ESI†) as the preparation of the TEM grids involved drying of the deposited dispersion, which will already have lead to some inherent aggregation.
Initial SERS studies on the PD@Au-NP mixtures showed no phenothiazine signals due to the difference between the Au-NP LSPR (528 nm) and the excitation wavelength of the near-infrared (NIR) laser (1064 nm). We decided to only show Raman measurements after the induced agglomeration of the nanoparticles with KCl, because of the higher SERS enhancements. Since the results were reproducible, we used this method with all phenothiazine dyes.
To excite the LSPR of the nanoparticles for obtaining the SERS effect, the laser excitation wavelength should be as close as possible to the LSPR. Instead of changing to a lower excitation wavelength like 785 nm or below, we decided to stay at an excitation wavelength of 1064 nm, because the phenothiazine dyes showed intense fluorescence in the range between 600–800 nm. This could lead to strong fluorescence background scattering in the Raman spectra.
To adjust the plasmon resonance of gold nanoparticles towards the excitation wavelength of 1064 nm we induced Au-NP agglomeration with potassium chloride, which is well known for liquid state SERS measurements.44 The Au-NP/KCl dispersion was stable for at least 30 min, underwent precipitation after 45 min and the plasmon resonance shifted to higher wavelengths. After the addition of 10 mg KCl to 3 mL of the Au-NP water–acetone mixture the LSPR at 528 nm shifted to a broad band around 800 nm (Fig. 6), but at over 1000 nm there is still a significant absorption due to the LSPR of the spherical particles. To verify the absorption of the Au-NPs in the near-infrared, additional absorption spectra were measured (Fig. S3 bottom in ESI†). The NIR spectrum still shows an absorption at 1064 nm, indicating that the Au-NPs are useable for SERS excitation. The peak for the LSPR of remaining non-aggregated spherical particles decreased in intensity and shifted slightly from 528 to 535 nm. The TEM image shows significant agglomeration (compare to Fig. S1 or S4 in ESI†). The primary particles retained their spherical morphology and did not change their size (average diameter 36 ± 7 nm). In the agglomerates small holes and gaps are apparent with a width between 2 nm and 14 nm. These gap sizes match with the sizes for previously reported “hot spots” in SERS measurements.40
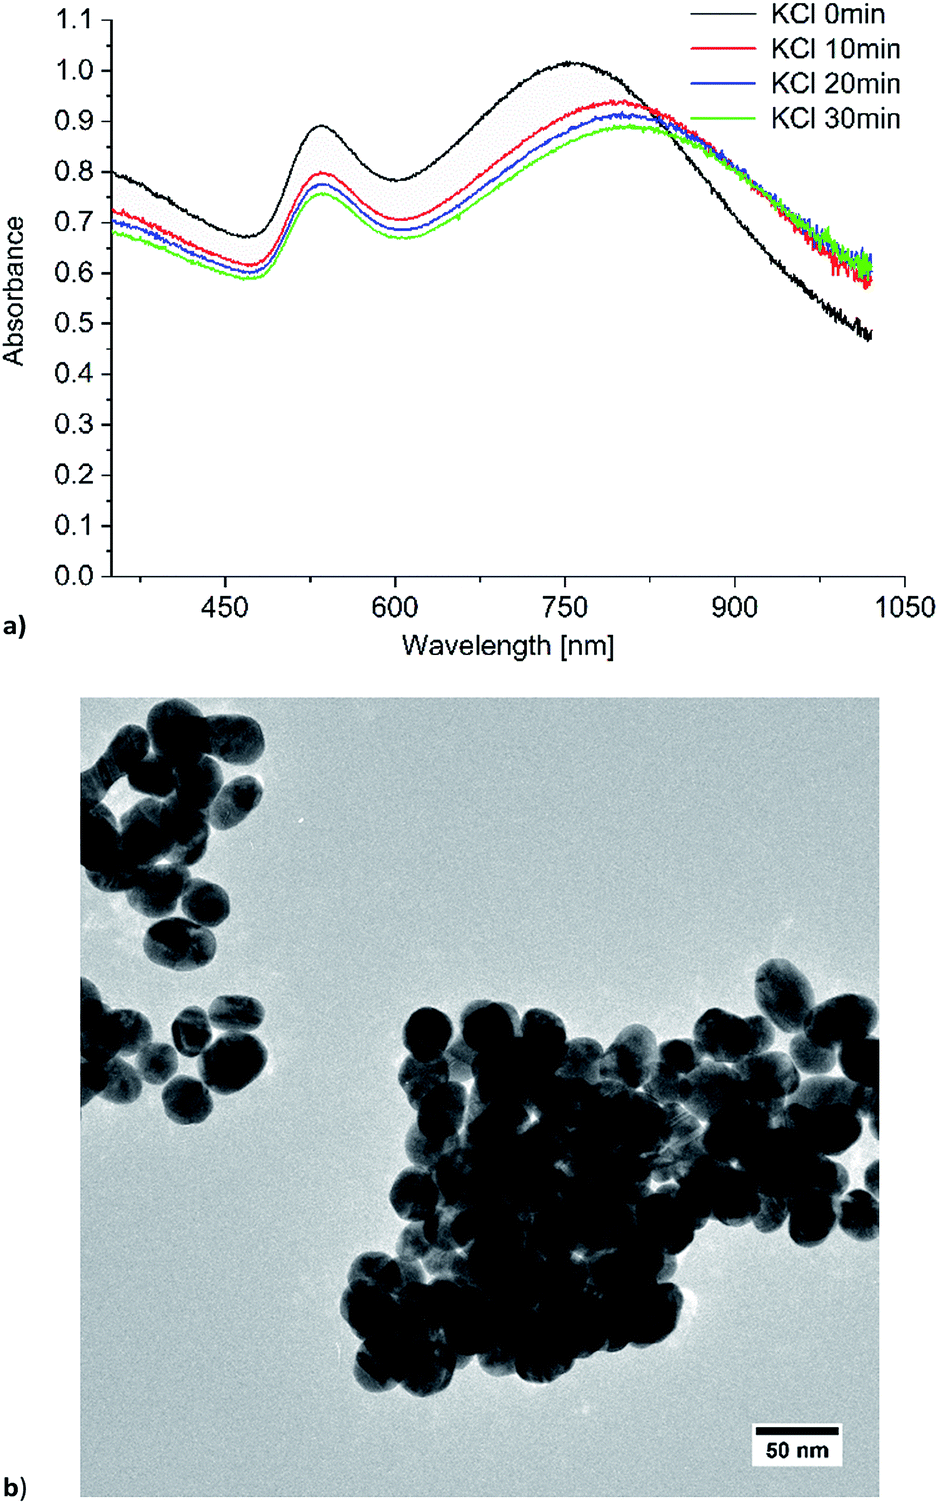 | ||
| Fig. 6 (a) Time dependent UV/Vis absorption and (b) TEM image of Au-NPs in water/acetone (1:1 v/v) with KCl added. | ||
Nanoparticle agglomeration can be used to adjust the plasmon resonance of nanoparticles, and was applied in SERS measurements before.49
SERS results with spherical gold nanoparticles (Au-NP)
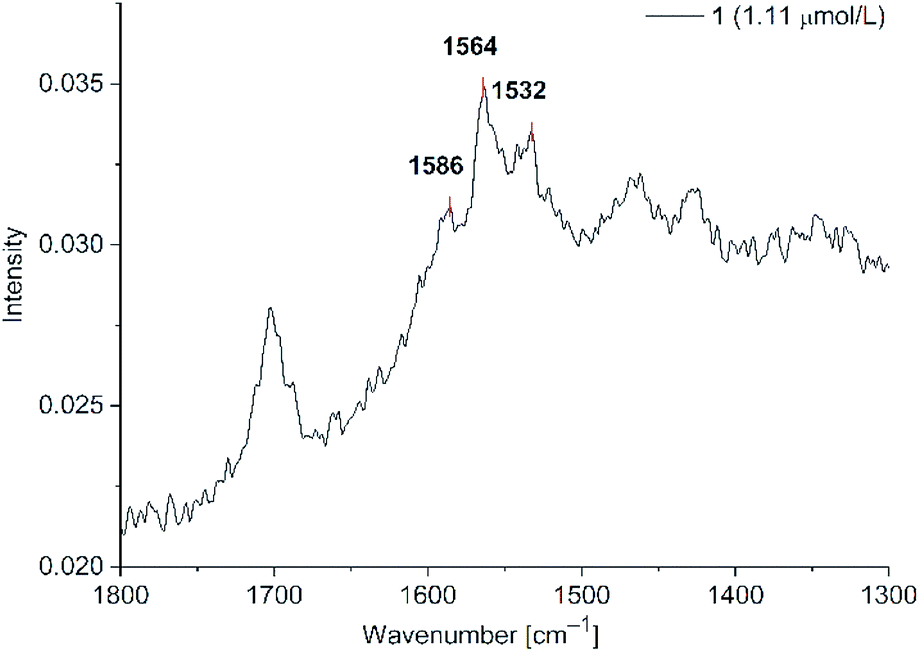
C stretching vibrations (cf. Fig. 4). In the absence of Au-NPs no dye related Raman signals were seen at the concentrations of 3.24, 1.11 and 0.11 μM. To excite Raman signals at around 1500 cm−1 with a 1064 nm laser, the Au-NPs need to have an absorption at around 1260 nm, which was achieved for the KCl-agglomerated Au-NPs (cf. Fig. S3, bottom in ESI†). For PD 1 at the concentration of 1.11 μM the CC vibration at 1588 cm−1 appears only as a shoulder, while it is a small peak for PD 2 (cf Fig. S8 in ESI†). We think that this is caused by variations of the signal intensities for liquid state Raman spectroscopy due to the Brownian motion of molecules in the laser beam. For PD 1 and 2 the limit of detection (LOD) was reached at a concentration of 0.11 μM. Both rhodanine based dyes show strong SERS signals with spherical gold nanoparticles, leading to a very low LOD of 0.11 μM, which can be correlated to the known affinity and bond formation between gold and sulfur50 of the S-thiocarbamate functionality of the rhodanine group. For PD 2 the SERS enhancement was slightly smaller than for PD 1, so enhancement of the laser power to 700 mW was needed for clear identification of Raman signals at 0.11 μM. Since it would be possible to see SERS enhancements for all three concentrations at a laser power of 700 mW, we decided, that 0.11 μM can be taken as the LOD. At lower concentrations we were not able to identify any PD related Raman signals at laser intensities up to 1000 mW.
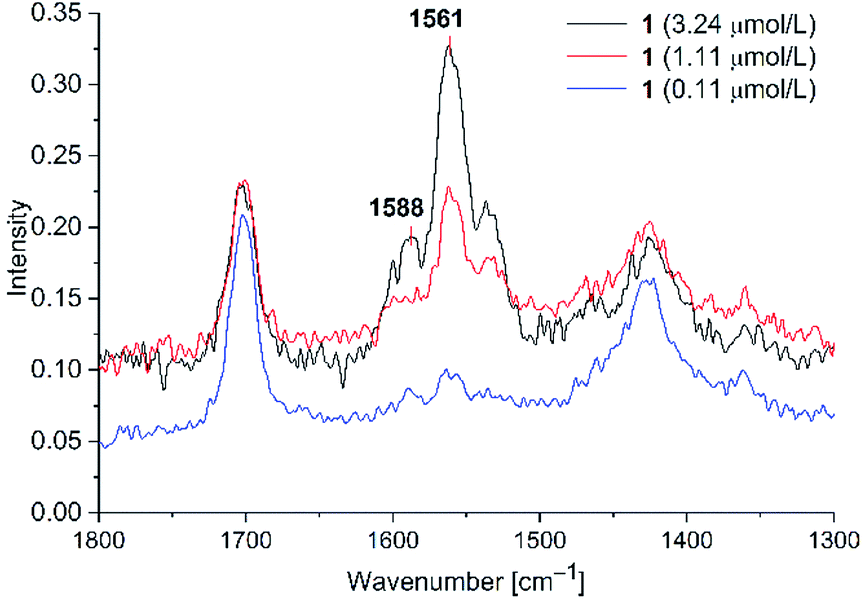 | ||
| Fig. 7 SERS studies (200 mW) for PD 1@Au-NP at concentrations of 3.24, 1.11 and 0.11 μM in H2O/acetone (1:1 v/v) and KCl added (see Fig. S8 in ESI† for PD 2). | ||
The signal to noise ratio appears to be low for the measured SERS spectra, which is caused by several reasons. We only show sections of the whole Raman spectra to depict the interesting signals of the spectra. The dye signals in the presented spectra are much smaller than the solvent signals because of their low concentrations. In this time-dependent measurement we were limited by the stability of the nanoparticle dispersions. In all SERS spectra the identified SERS signals are clearly stronger than the background noise. Also, we can note, that in Raman spectroscopy the intensity of Raman signals decreases with higher excitation wavelength, leading to lower S/N ratios.
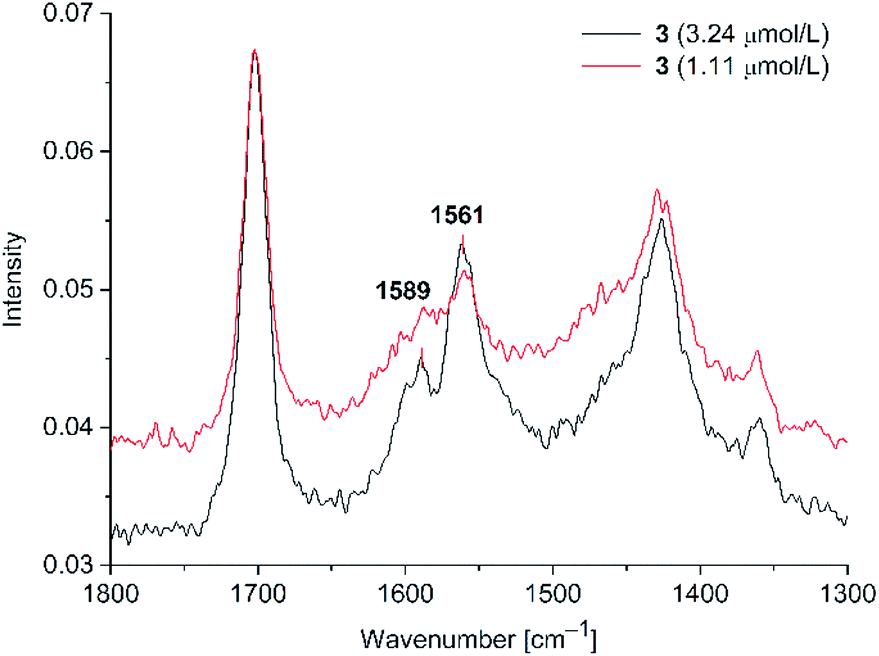 | ||
| Fig. 8 SERS studies for PD 3@Au-NP at 3.24 μM (500 mW) and 1.11 μM (700 mW) in H2O/acetone (1:1 v/v) with KCl added. (see S10 in ESI† for PD 4). | ||
Peak positions are matching with the solid state CC signals. For both dyes 3 and 4 we observed the SERS effect, albeit only at a higher laser power in comparison to PD 1 and 2. Also, the signal enhancement was smaller than for the rhodanine dyes 1 and 2. The detection limit was 1.11 μM for PD 3 and 4, indicating a weaker interaction of 3 and 4, which lack a sulfur donor group, with the gold nanoparticles. At this concentration, only the stronger CC vibration at 1561 cm−1 appears as a clearly discernible Raman signal, while the CC vibration at 1589 cm−1 is only visible as a small shoulder.
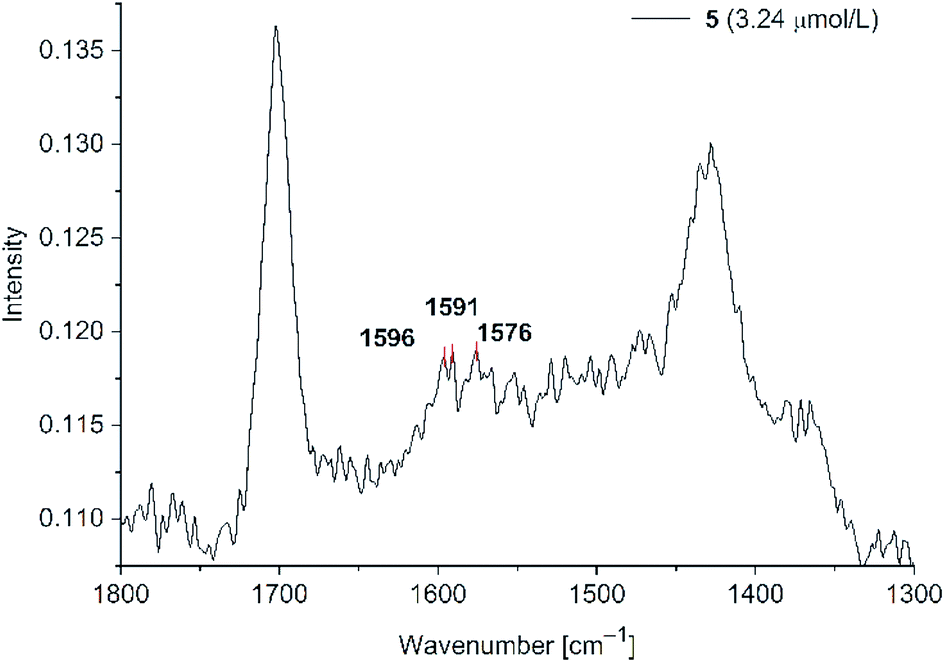 | ||
| Fig. 9 SERS studies for PD 5@Au-NP at 3.24 μM (500 mW) in H2O/acetone (1:1 v/v) in the presence of KCl (see Fig. S11 in ESI† for PD 6). | ||
Even at a concentration of 3.24 μM only very small signal intensities were observed at wavenumbers matching with the solid state spectra of PD 5. In addition to the Raman spectra fluorescence spectra for all phenothiazines were measured upon the addition of water and gold nanoparticle dispersion. PD 1–4 showed fluorescence quenching after addition of water and nanoparticles (see Fig S12, S13, S15 and S16 in ESI†). The emission spectra for phenothiazines 5 and 6 showed a different behaviour (Fig. 10).
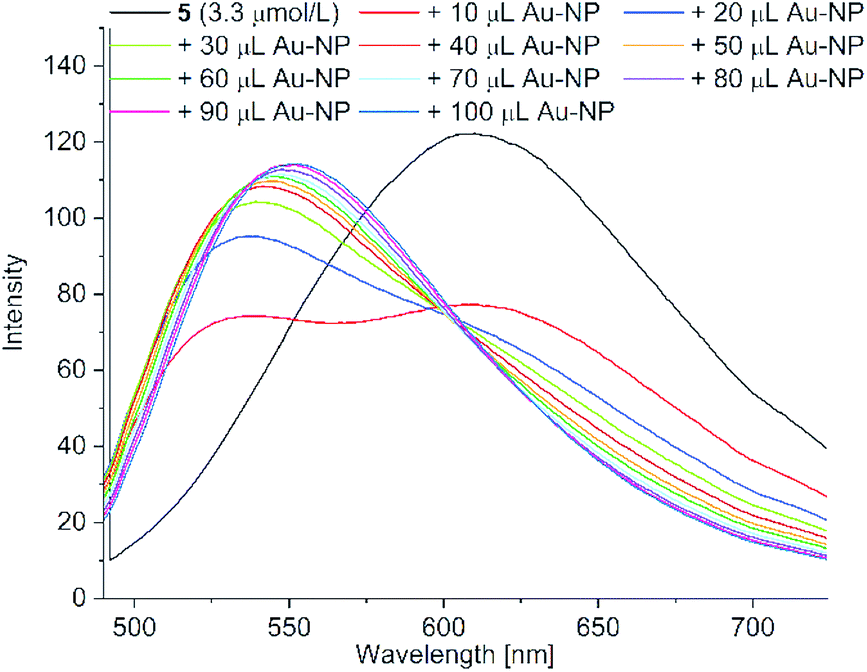 | ||
| Fig. 10 Fluorescence spectra of acetone solutions of PD 5 (c = 3.3 μM) with the stepwise addition of 10 μL aliquots of the aqueous Au-NP dispersion up to a total of 100 μL (excitation wavelength = 428 nm) (see Fig. S14 in ESI† for the fluorescence spectra of PD 6). | ||
The addition of an aqueous nanoparticle dispersion caused a hypsochromic shift in the emission spectrum of 5 from 608 nm to 535 nm with an isosbestic point at 601 nm upon increasing the amount of nanoparticle dispersion (Fig. 10; see Fig. S14 in ESI† for the fluorescence spectra of 6). We assume the formation of H-aggregates as the origin of the hypsochromic shift and the fluorescence attenuation.51 H-aggregates can be plausibly rationalized by replacement of the head-to-tail hydrogen bonding of the carboxylic acid group in acetone by hydrogen bonding to water with the increasing addition of aqueous Au-NP dispersion.52 Comparable studies with stepwise addition of water showed a similar hypsochromic shift due to the formation of H-aggregates in the fluorescence spectrum from 608 nm to 550 nm without an isobestic point for 5 (see Fig. S17 for 5 and Fig. S18 for 6†). This hydration of the carboxyl group presumably also prevents the cyanoacrylic carboxyl coordination to the gold nanoparticles, which has to occur in competition to the present citrate capping ligand. Consequently, this leads to much smaller SERS enhancements for PD 5 and 6.
We observed no effects due to the used trisodium citrate in our SERS spectra. There are numerous publications, which use trisodium citrate as a reducing and stabilizing agent in the synthesis of plasmonic particles for SERS experiments. In principle, it should be possible to detect the surfactant via SERS enhancement, but we assume that the interactions between the phenothiazine dyes and the Au-NP are stronger than the weak electrostatic interactions between trisodium citrate and gold. It is known that the citrate surfactant can be replaced easily by stronger bound surfactants with e.g. thiol groups.50 We also noticed no effects or signals on the SERS studies, which we correlated with trisodium citrate.
For the Au-NRs in an acetone/water mixture (1:1), the band at 540 nm did not change its position, while the band at 778 nm shifted to 693 nm and the one 936 nm to 978 nm (see Fig. S19 in ESI†). The shifts of the latter two bands could be explained by agglomeration of the nanorods. Addition of KCl led only to rapid precipitation of the nanorods and was not investigated further.
Initial SERS experiments with Au-NRs led to no SERS enhancement, because the high amounts of the structure forming and stabilizing agent CTAB on the NR surface interfered with SERS measurements. The surfactant CTAB is strongly bound to the metal surface, competing with the phenothiazine analytes for binding sites.55 CTAB stabilizes the Au-NR by formation of a bilayer. In the growth phase of the nanorods positively charged CTAB headgroups interact with the metal surface. In the second layer the headgroups orient themselves towards the solvent. This leads to a hydrophobic plenum between the layers comparable to a cellular membrane.56 Reduction of the amount of CTAB during the Au-NR synthesis was not possible, because the surfactant is indispensable for the formation of Au-NRs. CTAB forms micelles where nanorods are grown.55 Their length correspond to the CTAB concentration.53,53a Removing the CTAB with HCl by a protocol published by Cui et al.57 was successful, but led to fast Au-NR agglomeration and precipitation, which made it impossible to record Raman spectra. Instead, excessive CTAB was removed via centrifugation. The nanorod dispersion was centrifuged, washed and redispersed two times for 15 minutes at 8000 RPM and then redispersed in ultrapure water to decrease the amount of CTAB in the dispersion.
SERS results with gold nanorods (Au-NR)
 | ||
| Fig. 11 SERS studies (200 mW) for PD 1@Au-NR at 3.24 μM in H2O/acetone (1:1 v/v). See Fig. S20 for PD 2 in ESI.† | ||
Signal intensities were not as high as for agglomerated spherical nanoparticles, but the Au-NR dispersions were stable for over 2 h instead of 45 min. The signal intensity was lower because no hot-spots between the nanorods were formed. Furthermore, the remaining CTAB capping ligands are reducing the signal intensity through blocking binding sites at the nanorods. A brief test after the removal of CTAB showed more intense SERS signals, but with highly destabilized dispersions. When the concentration of 1 was lowered to 1.11 μM after the removal of excess CTAB (Fig. 12, for compound 2 see ESI Fig. S21†) the two characteristic phenothiazine signals at 1563 and 1586 cm−1 were still clearly visible. CTAB shows no Raman signals in the range of 1500–1600 cm−1. For CTAB there should be Raman signals at around 1400 cm−1 which, however, overlap with the solvent signals, which are far more intensive. The overall signal background increased in all CTAB stabilized samples compared to the spherical nanoparticles. Such an increased background is sometimes seen in the literature for gold nanorods without explanation.58 We believe that the background noise in the Au-NR measurements is due to the cationic surfactant and not by fluorescence excitation. It was not possible to detect SERS enhancements of 1 and 2 at concentrations lower than 1.11 μM.
 | ||
| Fig. 12 SERS studies (200 mW) for PD 1@Au-NR at 1.11 μM in H2O/acetone (1:1 v/v) (section between 1800–1300 cm−1). See Fig. S21 for PD 2 in ESI.† | ||
 | ||
| Fig. 13 SERS studies (200 mW) for PD 3@Au-NR at 3.24 μM in H2O/acetone (1:1 v/v) (section between 1800–1300 cm−1). See Fig. S22 for PD 4 in ESI.† | ||
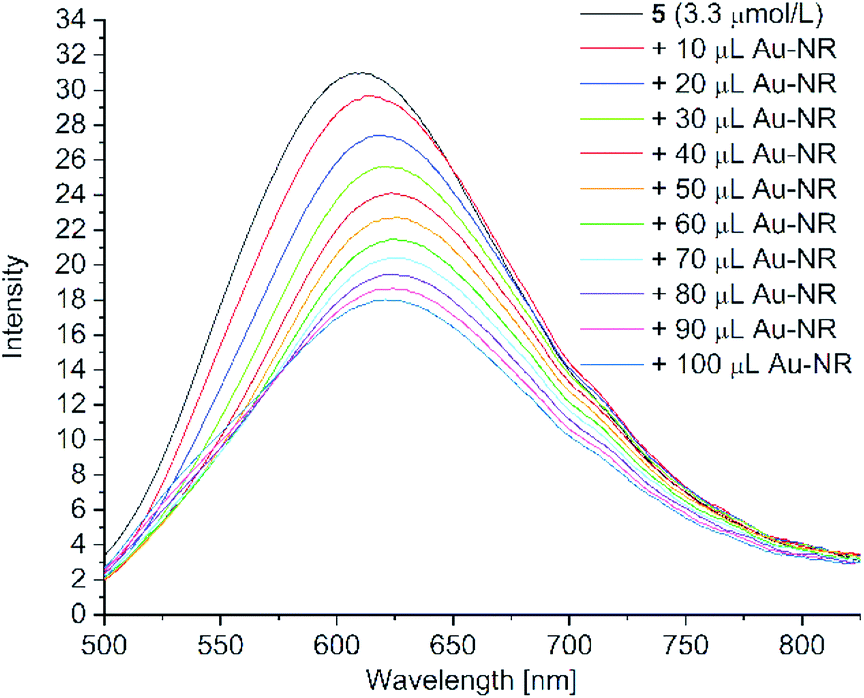 | ||
| Fig. 14 Fluorescence spectra of PD 5 (c = 3.3 μM) with the stepwise addition of 100 μL Au-NR (excitation wavelength = 428 nm). | ||
After the addition of nanorods, the hypsochromic signal shift is not as pronounced as after the addition of spherical gold nanoparticles (cf. Fig. 9). Again, this shift could be due to the H- aggregate formation of hydrogen bonds between carboxylic acid and water or carboxylic acid with itself. The effect is not as strong as seen with the spherical particles. We assume that the presence of CTAB, a cationic tenside, in the dispersion hampers the formation of hydrogen bonds as a consequence of its surfactant function. CTAB on the surface of the nanorods forms a bilayer with a hydrophobic plenum, which expels the hydrophilic carboxylic acid leading to no SERS enhancement. We also assume that the hydrophilic groups of the surfactant interact with water and the carboxylic acids of 5 and 6, minimizing the formation of H-aggregates.
We were able to measure the LODs of all dyes with Au-NPs and PD 1–4 with Au-NR (Table 1).
| PD | LOD [μM] Au-NP | LOD [μM] Au-NR |
|---|---|---|
| 1 | 0.11 | 1.11 |
| 2 | 0.11 | 1.11 |
| 3 | 1.11 | 3.24 |
| 4 | 1.11 | 3.24 |
| 5 | 3.24 | — |
| 6 | 3.24 | — |
Since all six phenothiazine dyes are novel it is not possible to compare the detection sensitivity to other reported studies. Compared to SERS measurements of other phenothiazine dyes like methylene blue, there are reports with comparable LODs. Trindade et al. measured concentrations of 10−4 M of dye adsorbed in fibers.59 Jang et al. measured methylene blue with Au-NRs surrounded by a SiO2 shell with an LOD of 10.4 μM and 3.6 μM.60 Camacho-López et al. were able to measure methylene blue using a Raman microscope at concentrations of 10−10 M on Au/Ag nanoparticles after evaporation of a dye solution for depositing and fixing the dye on the particle surface.61 These works show the wide range of LODs for dyes depending on the used plasmonic material and the measuring method. In our experiments we measured the dyes in the solution state as an easy and fast way to prepare SERS samples.
Conclusions
We were able to obtain SERS spectra with all six phenothiazine dyes after the addition of citrate-stabilized spherical gold nanoparticles, albeit only after the KCl-induced formation of hot spots, thereby providing evidence of interactions between gold nanoparticles and the phenothiazine dyes. Differences in SERS signal enhancement vary with the different functional groups of the dyes. PD 1 and 2 showed the lowest level of detection indicating strong interactions with the gold nanoparticles. We assume the formation of Au–S bonds lead to these intense contacts of nanoparticles and dyes. 1,3-indanedione containing PD 3 and 4 showed lower SERS intensities than the sulphur-containing PD 1,2. This indicates a weaker contact with the gold nanoparticles through adsorption, lacking the sustained contact to the nanoparticles through a chemical bond like for the rhodanine group. For the cyanoacrylic acid containing PD 5,6 only weak enhancements in the SERS spectra at a LOD of 3.24 μmol L−1 were apparent, leading to the conclusion that these dyes could not bond or adsorb to the surface of the gold nanoparticles.In addition to SERS studies, fluorescence studies were conducted to determine the utility of gold nanoparticles for use in Grätzel type solar cells. For rhodanine and 1,3-indanedione based phenothiazines 1–4, fluorescence attenuation was not observed after the addition of the aqueous nanoparticle dispersion in comparison to the addition of water alone which led to fluorescence quenching. We assume that these dyes interact with the LSPR of the gold nanoparticles and show no enhanced fluorescence quenching through the gold nanoparticles and nanorods. For these dyes, an enhancement of photocurrents by the addition of gold nanoparticles can be possible.
For 5 and 6 only weak enhancements in the SERS spectra were apparent. At the same time a strong hypsochromic shift by ∼70 nm is seen in fluorescence spectra. We assume that this is caused by the formation of H-aggregates in the presence of water. Since citrate stabilized gold nanoparticles are not very stable in organic solvents, we were not able to carry out studies without the addition of water. We conclude, that the possible formation of H-aggregate inhibits the use of these dyes in dye-sensitive solar cells.
For CTAB-stabilized gold nanorods, we were also able to record SERS spectra for PD 1–4. The detection limits were not as low as for the spherical gold particles due to the necessary presence and resulting surface-shielding effect of CTAB and missing SERS hot spots. Thus, SERS enhancements with gold nanorods were weaker than with gold nanoparticles and showed less hypsochromic shifts in the fluorescence spectra. One advantage of gold nanorods is the control of the LSPR through size control during the synthesis.
The order of SERS intensity for the PDs was rhodanine PD 1,2 > 1,3-indanedione PD 3,4 > cyanoacrylic acid PD 5,6. This order was the same with the gold nanoparticles and the gold nanorods. Overall, gold nanostructures could be suitable for enhancing photocurrents of the presented phenothiazine dyes in Grätzel type solar cells. In particular, easier to synthesize spherical nanoparticles allow for stronger interactions due to formation of “hot spots” and the absence of the strongly-bound surfactant CTAB.
We conclude that phenothiazine-merocyanine dyes 1–4 show potential for the usage in Grätzel type DSSCs with incorporated gold nanostructures. The spherical nanoparticles induced no enhanced fluorescence quenching and showed strong SERS signals depending on the interactions with the functional groups. Since SERS and photocurrent enhancement both use the nanoantennae effect of the LSPR, we can assume, that the dyes PD 1–4 should show photocurrent enhancement in the presence of gold nanostructures in DSSCs. Spherical nanoparticles are favoured against gold nanorods because of their easy and fast synthesis and their ability to produce hot spot regions due to induced agglomeration. PD 5,6 showed great sensitivity against the presence of even small amounts of water, leading to drastic decreases in fluorescence intensity and prevention of interactions with plasmonic nanoparticles and therefore should not be considered for further use in photocurrent enhanced DSSCs.
Conflicts of interest
There are no conflicts to declare.Acknowledgements
We thank Dr J. Barthel and the Ernst Ruska-Centrum für Mikroskopie und Spektroskopie mit Elektronen, 52425 Jülich (Germany) for the possibility to measure TEM images.References
- R. A. Aitken and K. M. Aitken, 1,4-Thiazines and their Benzo Derivatives, Comprehensive Heterocyclic Chemistry III, 2008, vol. 8, ch. 8.09, pp. 607–675 Search PubMed.
- S. P. Massie, Chem. Rev., 1954, 54, 797–833 CrossRef CAS.
- J. F. Casey, J. J. Lasky, C. J. Klett and L. E. Hollister, Am. J. Psychiatry, 1960, 117, 97–105 CrossRef CAS PubMed.
- S. H. Snyder, S. P. Banerjee, H. I. Yamamura and D. Greenberg, Science, 1974, 184, 1243–1253 CrossRef CAS PubMed.
- M. J. Ohlow and B. Moosmann, Drug Discovery Today, 2011, 16, 119–131 CrossRef CAS PubMed.
- K. Hochgräfe, A. Sydow, D. Matenia, D. Cadinu, S. Könen, O. Petrova, M. Pickhardt, P. Goll, F. Morellini, E. Mandelkow and E.-M. Mandelkow, Acta Neuropathol. Commun., 2015, 3(25), 1–22 Search PubMed.
- (a) F. L. Campbell, W. N. Sullivan, L. E. Smith and H. L. Haller, J. Econ. Entomol., 1934, 27, 1176–1185 CrossRef CAS; (b) N. F. Howard, L. W. Brannon and H. C. Mason, J. Econ. Entomol., 1935, 28, 444–448 CrossRef CAS.
- F. Deeds, A. B. Stockton and J. O. Thomas, J. Pharmacol. Exp. Ther., 1939, 65, 353–371 CAS.
- (a) M. Hauck, M. Stolte, J. Schönhaber, H. G. Kuball and T. J. J. Müller, Chem. – Eur. J., 2011, 17, 9984–9998 CrossRef CAS PubMed; (b) C. S. Krämer, K. Zeitler and T. J. J. Müller, Tetrahedron Lett., 2001, 42, 8619–8624 CrossRef; (c) D. Urselmann, B. Mayer and T. J. J. Müller, Beilstein J. Org. Chem., 2016, 12, 2055–2064 CrossRef CAS PubMed; (d) M. Sailer, A. W. Franz and T. J. J. Müller, Chem. – Eur. J., 2008, 14, 2602–2614 CrossRef CAS PubMed; (e) M. Sailer, M. Nonnenmacher, T. Oeser and T. J. J. Müller, Eur. J. Org. Chem., 2006, 2, 423–435 CrossRef.
- (a) A. P. Kulkarni, P.-T. Wu, T. W. Kwon and S. A. Jenekhe, J. Phys. Chem. B, 2005, 109, 19584–19594 CrossRef CAS PubMed; (b) T. Meyer, D. Ogermann, A. Pankrath, K. Kleinermanns and T. J. J. Müller, J. Org. Chem., 2012, 77, 3704–3715 CrossRef CAS PubMed.
- (a) N. Bucci and T. J. J. Müller, Tetrahedron Lett., 2006, 47, 8323–8327 CrossRef CAS; (b) N. Bucci and T. J. J. Müller, Tetrahedron Lett., 2006, 47, 8329–8332 CrossRef CAS; (c) S. Bay, T. Villnow, G. Ryseck, V. Rai-Constapel, P. Gilch and T. J. J. Müller, ChemPlusChem, 2013, 78, 137–141 CrossRef CAS.
- (a) T. J. J. Müller, Tetrahedron Lett., 1999, 40, 6563–6566 CrossRef; (b) C. S. Krämer and T. J. J. Müller, Eur. J. Org. Chem., 2003, 18, 3534–3548 CrossRef.
- (a) C. S. Barkschat, S. Stoycheva, M. Himmelhaus and T. J. J. Müller, Chem. Mater., 2010, 22, 52–63 CrossRef CAS; (b) A. W. Franz, S. Stoycheva, M. Himmelhaus and T. J. J. Müller, Beilstein J. Org. Chem., 2010, 6, 72 Search PubMed.
- J. Rechmann, A. Sarfraz, A. C. Götzinger, E. Dirksen, T. J. J. Müller and A. Erbe, Langmuir, 2015, 31, 7306–7316 CrossRef CAS PubMed.
- C. Buhrmester, L. Moshurchak, R. L. Wang and J. R. Dahn, J. Electrochem. Soc., 2006, 153, A288–A294 CrossRef CAS.
- M. Notarianni, K. Vernon, A. Chou, M. Aljada, J. Liu and N. Motta, Sol. Energy, 2014, 106, 23–37 CrossRef CAS.
- B. O`Reagan and M. Grätzel, Nature, 1991, 353, 737–739 CrossRef.
- M. Grätzel, J. Photochem. Photobiol., C, 2003, 4, 145–153 CrossRef.
- J. Gong, J. Liang and K. Sumathy, Renewable Sustainable Energy Rev., 2012, 16, 5848–5860 CrossRef CAS.
- M. K. Nazeeruddin, A. Kay, I. Rodicio, R. Humphry-Baker, E. Müller, P. Liska, N. Vlachopoulos and M. Grätzel, J. Am. Chem. Soc., 1993, 115, 6382–6390 CrossRef CAS.
- S. Shalini, R. Balasundaraprabhu, T. Satish Kumar, N. Prabavathy, S. Senthilarasu and S. Prasanna, Int. J. Energy Res., 2016, 40, 1303–1320 CrossRef CAS.
- (a) A. S. Hart, K. C. Chandra Bikram, N. K. Subbaiyan, P. A. Karr and F. D'Souza, ACS Appl. Mater. Interfaces, 2012, 4, 5813–5820 CrossRef CAS; (b) Z.-S. Huang, H. Meier and D. Cao, J. Mater. Chem. C, 2016, 4, 2404–2426 RSC.
- A. Hagfeldt, G. Boschloo, L. Sun, L. Kloo and H. Pettersson, Chem. Rev., 2010, 110, 6595–6663 CrossRef CAS.
- (a) M. D. Brown, T. Suteewong, R. Sai Santosh Kumar, V. D'Innocenzo, A. Petrozza, M. M. Lee, U. Wiesner and H. J. Snaith, Nano Lett., 2011, 11, 438–445 CrossRef CAS; (b) D. H. Song, H.-Y. Kim, H.-S. Kim, J. Sang Suh, B.-H. Jun and W.-Y. Rho, Chem. Phys. Lett., 2017, 687, 152–157 CrossRef CAS.
- (a) B. Törngren, S. Sandén, J. O. Nyman, A. Tiihonen, H. Jiang, J. Ruokolainen, J. Halme, R. Österbacka and J.-H. Smått, J. Nanopart. Res., 2017, 19, 365–376 CrossRef; (b) S. Chang, Q. Li, X. Xiao, K. Y. Wong and T. Chao, Energy Environ. Sci., 2012, 5, 9444–9448 RSC.
- T. Kawawaki, Y. Takahashi and T. Tatsuma, J. Phys. Chem. C, 2013, 117, 5901–5907 CrossRef CAS.
- T. Kawawaki, Y. Takahashi and T. Tatsuma, Nanoscale, 2011, 3, 2865–2867 RSC.
- M. Fleischmann, P. J. Hendra and A. J. McQuillan, Chem. Phys. Lett., 1974, 26, 163–166 CrossRef CAS.
- S. Nie and S. R. Emory, Science, 1997, 275, 1102–1106 CrossRef CAS PubMed.
- K. Kneipp, Y. Wang, H. Kneipp, L. T. Perelman, I. Itzkan, R. R. Dasari and M. S. Feld, Phys. Rev. Lett., 1997, 78, 1667–1670 CrossRef CAS.
- I. Freitag, C. Beleites, S. Dochow, J. H. Clement, C. Krafft and J. Popp, Analyst, 2016, 141, 5986–5989 RSC.
- L. A. Austin, S. Osseiran and C. L. Evans, Analyst, 2016, 141, 476–503 RSC.
- S. K. Jha, Y. Ekinci, M. Agio and J. F. Löffler, Analyst, 2015, 140, 5671–5677 RSC.
- S. Polisetti, A. N. Bible, J. L. Morrell-Falvey and P. W. Bohn, Analyst, 2016, 141, 2175–2182 RSC.
- O. Alharbi, Y. Xu and R. Goodacre, Analyst, 2015, 140, 5965–5970 RSC.
- J. P. Smith, O. B. Sutcliffe and C. E. Banks, Analyst, 2015, 140, 4932–4948 RSC.
- W. Xie and S. Schlücker, Chem. Commun., 2018, 54, 2326–2336 RSC.
- B. H. Loo, Y. Tse, K. Parsons, C. Adelman, A. El-Hage and Y. G. Lee, J. Raman Spectrosc., 2006, 37, 299–304 CrossRef CAS.
- E. del Puerto, A. Cuesta, S. Sanchez-Cortes, J. V. Garcia-Ramos and C. Domingo, Analyst, 2013, 138, 4670–4676 RSC.
- S. Schlücker, Angew. Chem., Int. Ed., 2014, 53, 4756–4795 CrossRef PubMed.
- P. G. Etchegoin and E. C. Le Ru, Surface Enhanced Raman Spectroscopy ed. S. Schlücker, Wiley-VCH, Weinheim, 2011, pp. 1–37 Search PubMed.
- L. Song, E. J. Hennink, I. T. Young and H. J. Tanke, Biophys. J., 1995, 68, 2588–2600 CrossRef CAS.
- E. V. Efremov, F. Ariese and C. Gooijer, Anal. Chim. Acta, 2008, 606, 119–134 CrossRef CAS PubMed.
- (a) N. Carl, S. Prèvorst, J. P. S. Fitzgerald and M. Karg, Phys. Chem. Chem. Phys., 2017, 19, 16348–16357 RSC; (b) P. G. Etchegoin and E. C. Le Ru, Surface Enhanced Raman Spectroscopy, ed. S. Schlücker, Wiley-VCH, Weinheim, 2011, pp. 1–37 Search PubMed; (c) L. Tian, M. Su, F. Yu, Y. Xu, X. Li, L. Li, H. Liu and W. Tan, Nat. Commun., 2018, 9(1), 3642 CrossRef; (d) I. Bruzas, W. Lum, Z. Gorunmez and L. Sagle, Analyst, 2018, 143, 3990–4008 RSC.
- S. Becht, S. Ernst, R. Bappert and C. Feldmann, Chem. Unserer Zeit, 2010, 44, 14–23 CrossRef CAS.
- A. Liopo, S. Wang, P. J. Derry, A. A. Oraevsky and E. R. Zubarev, RSC Adv., 2015, 5, 91587–91593 RSC.
- D. Pan and D.-L. Phillips, J. Phys. Chem. A, 1999, 103, 4737–4743 CrossRef CAS.
- Y. Sun and Y. Xia, Analyst, 2003, 128, 686–691 RSC.
- (a) M. W. Meyer and E. A. Smith, Analyst, 2011, 136, 3542–3549 RSC; (b) P. G. Etchegoin and E. C. Le Ru, Surface Enhanced Raman Spectroscopy ed. S. Schlücker, Wiley-VCH, Weinheim, 2011, pp. 47 – 50 Search PubMed.
- (a) M. K. Corbierre and R. B. Lennox, Chem. Mater., 2005, 17, 5691–5696 CrossRef CAS; (b) Á. I. López-Lorente, M. Laura Soriano and M. Valcárcel, Microchim. Acta, 2014, 181, 1789–1796 CrossRef.
- (a) U. Rösch, S. Yao, R. Wortmann and F. Würthner, Angew. Chem., Int. Ed., 2006, 45, 7026–7030 CrossRef; (b) L. Zhang and J. M. Cole, J. Mater. Chem. A, 2017, 5, 19541–19559 RSC.
- G. Ruderman, E. R. Caffarena, I. G. Mogilner and E. J. Tolosa, J. Solution Chem., 1998, 27, 935–948 CrossRef CAS.
- (a) M. R. K. Ali, B. Snyder and M. A. El-Sayed, Langmuir, 2012, 28, 9807–9815 CrossRef CAS PubMed; (b) R. Parveen, J. F. Gomes, S. Ullah, J. J. S. Acuña and G. Tremiliosi-Filho, J. Nanopart. Res., 2015, 17, 418 CrossRef.
- X. Ma, M.-C. Wang, F. You, J. Feng and X. Zhao, J. Alloys Compd., 2015, 649, 617–624 CrossRef CAS.
- B. Saute, R. Premasiri, L. Ziegler and R. Narayanan, Analyst, 2012, 137, 5082–5087 RSC.
- E. Locatelli, I. Monaco and M. Comes Franchini, RSC Adv., 2015, 5, 21681–21699 RSC.
- Z. Wang, S. Zong, J. Yang, C. Song, J. Li and Y. Cui, Biosens. Bioelectron., 2010, 26, 241–247 CrossRef CAS.
- A. Zoppi, S. Trigari, G. Margheri, M. Muniz-Miranda and E. Giorgetti, RSC Adv., 2015, 5, 8523–8532 RSC.
- S. Fateixa, M. Wilhelm, A. M. Jorge, H. I. S. Nogueira and T. Trindade, J. Raman Spectrosc., 2017, 48, 795–802 CrossRef CAS.
- K. D. Shim and E.-S. Jang, Bull. Korean Chem. Soc., 2018, 39, 936–940 CrossRef CAS.
- O. Olea-Mejía, M. Fernández-Mondragón, G. Rodríguez-de la Concha and M. Camacho-López, Appl. Surf. Sci., 2015, 348, 66–70 CrossRef.
Footnotes |
| † Electronic supplementary information (ESI) available: Au-NP and Au-NR synthesis, TEM images, Raman spectra of phenothiazines 2, 4 and 6. Fluorescence spectra after addition of water. See DOI: 10.1039/c9ra08675g |
| ‡ These authors contributed equally. |
| This journal is © The Royal Society of Chemistry 2019 |