
 Open Access Article
 This Open Access Article is licensed under a
 Creative Commons Attribution 3.0 Unported Licence
Centella asiatica phenolic extract-mediated bio-fabrication of silver nanoparticles: characterization, reduction of industrially relevant dyes in water and antimicrobial activities against foodborne pathogens
Fredrick Nwude Eze a,
Adesola Julius Tolab,
Ozioma Forstinus Nwabor*c and
Titilope John Jayeoye*d
a,
Adesola Julius Tolab,
Ozioma Forstinus Nwabor*c and
Titilope John Jayeoye*d
aDepartment of Chemical Sciences, Joseph Ayo Babalola University, Ikeji-Arakeji, Osun State, Nigeria
bDepartment of Chemistry, Biochemistry and Physics, Université du Québec à Trois-Rivières (UQTR), Trois-Rivières, Québec G9A 5H7, Canada
cDepartment of Microbiology, University of Nigeria Nsukka, Nigeria. E-mail: nwaborozed@gmail.com
dDepartment of Chemistry/Biochemistry/Molecular Biology, Alex Ekwueme Federal University, Ndufu Alike-Ikwo, Abakaliki, Ebonyi State, Nigeria. E-mail: titioye040@yahoo.com
First published on 20th November 2019
Abstract
In this article, we have reported an environmentally benign and cost-effective method for the synthesis of monodispersed silver nanoparticles (AgNPs), based on Centella asiatica phenolic extracts (CAPE). The presence of phenolics was confirmed by ultra high-performance liquid chromatography coupled with electrospray ionization quadrupole time of flight mass spectrometry (UHPLC-ESI-qTOF-MS). Colloidal AgNPs synthesized under different concentrations of silver nitrate were monitored with a UV-vis spectrophotometer. Maximum absorption spectra intensity was found to range between 430–440 nm, during a synthesis time of 90 minutes at room temperature. The as-synthesized CAPE-AgNPs, was subjected to various instrumental characterizations such as, transmission electron microscopy (TEM), X-ray powder diffraction (XRD), energy dispersive X-ray spectroscopy (EDS), Fourier transform infrared (FTIR) spectroscopy, dynamic light scattering (DLS) and zeta potential. At the optimized synthesis conditions, spherical and monodispersed CAPE-AgNPs were obtained, with an absorption maximum at 430 nm. The crystalline CAPE-AgNPs had a face-centered-cubic (fcc) crystallographic structure, possessing average sizes estimated from TEM, to be between 20–25 nm diameter, a hydrodynamic diameter from DLS of about 90 nm and a zeta potential value of −28.7 mV. FTIR results validated the presence of phenolics on the surfaces of CAPE-AgNPs. The anti-microbial capacity of CAPE-AgNPs was further demonstrated on different pathogenic bacterial strains with satisfactory performances. As a result of the high surface area to volume ratio of CAPE-AgNPs, it was investigated as a catalyst towards the reduction of prominent environmental pollutants, 4 nitrophenol (4 NP), Congo red (CR) and methylene blue (MB). Pseudo first order kinetics were obtained with rate constants of 3.9 × 10⁻³ s−1 for 4 NP, 54.7 × 10⁻³ min−1 for MB and 5.6 × 10⁻³ s−1 for CR. The catalytic performance and antimicrobial activities of CAPE-AgNPs suggest its potential application in wastewater treatment and control of pathogenic microbes.
1. Introduction
Environmental pollution is a major global challenge facing humanity today which results from man's indiscriminate use of resources. Azo dyes and nitrophenols arising from textile, paper, cosmetics, ceramics or explosives manufacturing and industrial processes constitute a substantial part of these worrisome pollutants.1–3 It has been estimated that about a hundred thousand types of dyes are produced yearly corresponding to an aggregated 700![[thin space (1/6-em)]](https://www.rsc.org/images/entities/char_2009.gif) 000 to 1000000 million tons for applications in rubber, plastic, paint, pigment, leather and paper industries.4 Moreover, it is estimated that between 10–15% of the dyes produced are released into water bodies constituting various forms of carcinogens, mutagens and bio-refractive pollutants that might cause deleterious health consequences to humans and aquatic life forms.1–3,5,6 Thus, rendering these compounds less hazardous prior to disposal or during wastewater treatment is critical for safeguarding human and environmental wellbeing. Traditionally, remediation of dye effluents had generally involved chemical and physical means such as, adsorption, ozonation, coagulation, reverse osmosis or precipitation. However, owing to the poor aqueous solubility and high resistance to degradation of these organic compounds,6–8 efficiently decolorizing and transforming them into innocuous forms using these conventional approaches have been limited by high cost, production of toxic by-products, and strict energy requirements.9–11 It is against this backdrop that research into eco-friendly, safe, more cost-effective and efficient, alternative approaches remain highly relevant. The use of metal nanomaterials in the presence NaBH4 for the chemical reduction and catalytic degradation of dye pollutants is currently gaining traction as a clean and an efficient approach.12,13
000 to 1000000 million tons for applications in rubber, plastic, paint, pigment, leather and paper industries.4 Moreover, it is estimated that between 10–15% of the dyes produced are released into water bodies constituting various forms of carcinogens, mutagens and bio-refractive pollutants that might cause deleterious health consequences to humans and aquatic life forms.1–3,5,6 Thus, rendering these compounds less hazardous prior to disposal or during wastewater treatment is critical for safeguarding human and environmental wellbeing. Traditionally, remediation of dye effluents had generally involved chemical and physical means such as, adsorption, ozonation, coagulation, reverse osmosis or precipitation. However, owing to the poor aqueous solubility and high resistance to degradation of these organic compounds,6–8 efficiently decolorizing and transforming them into innocuous forms using these conventional approaches have been limited by high cost, production of toxic by-products, and strict energy requirements.9–11 It is against this backdrop that research into eco-friendly, safe, more cost-effective and efficient, alternative approaches remain highly relevant. The use of metal nanomaterials in the presence NaBH4 for the chemical reduction and catalytic degradation of dye pollutants is currently gaining traction as a clean and an efficient approach.12,13
The development of environmentally benign nanomaterial with multi-applications owing to their unique chemical, physical, optical or thermodynamic characteristics is gaining prominence is diverse fields in modern research spanning catalysis,14 targeted drug delivery,15 diagnostics,16 sensing17 and antimicrobials. Given their high surface to volume ratios, noble metal nanoparticles can enhance the reactions between reactants as catalysts. As a result, efforts are continuously devoted to improving synthesis cost, by exploiting different reducing and capping agents. The conventional synthesis methods of metal nanoparticles are limited in terms of energy demand, cost of reducing agents used; which are oftentimes toxic to the environment and disruption in the surface architecture of the synthesized nanoparticles.18,19 Over the last few decades, metal nanoparticles synthesis from biomaterials have been popularized as alternative to the physical and chemical approaches with silver nanoparticles receiving the most attention.20,21 The abundance of biomolecules with varied natural constituents from renewable resources lend credence to the present zest in researches on green nano-synthesis. To this end, plethora of biomaterials especially from plants have been investigated for synthesis of biomolecule-stabilized and capped AgNPs.22–24
C. asiatica is a small perennial herbaceous medicinal plant belonging to the Umbelliferae family commonly found in tropical marshes across Africa and Asia. Over the millennia it has served both medicinal and nutritive functions. C. asiatica is endowed with vast array of bioactive metabolites including phenolics such as gallic acid, quinic acid, chlorogenic acids, catechin, quercetin kaempferol. It is also rich in triterpenes viz., asiatic acid, medecassic acid, asiaticoside, madecassoside.25,30 The antioxidative and reductive abilities of C. asiatica has been established in numerous studies, thus suggesting its potential for reductive biosynthesis.
Owing to the abundance of the aforementioned phytoconstituents in C. asiatica putatively capable reductive biosynthesis with better safety profile, we thus seek to report objective of the current study was to describe the bio-fabrication of silver nanoparticles from C. asiatica phenolic extract (CAPE) without any costly, hazardous or toxic stabilizing or capping agents. In comparison with other numerous works on green synthesis of metals nanoparticles, the sample extraction adopted in this work is completely green. This phenolics extraction step distinguished this work from others. As a result, only a small quantity of the bio-reductant was used in the synthesis proper. Finally, the CAPE mediated biogenic silver nanoparticles (CAPE-AgNPs) was characterized and investigated as a heterogenous catalyst for the reduction of organic dyes (4-nitrophenol, Congo red and methylene blue) in water at room temperature and its antimicrobial activities against pathogenic foodborne bacteria. The results from this work provide insights into the benign and eco-friendly synthesis CAPE-AgNPs and its potential implications in the control of environment pollution and pathogenic foodborne microbes.
2. Experimental
2.1. Plant materials and preparation of C. asiatica phenolic extract (CAPE)
Fresh C. asiatica aerial parts was obtained locally and processed as previously reported.26 The plant sample was washed with tap water and rinsed with reverse osmosis water. The aerial parts were air-dried to reduce moisture content for 12 hour and further oven dried at 60 °C for another 12 hours. The dried sample was ground into fine powder and stored in an opaque bottle at −20 °C for further extraction.Dried C. asiatica powder (50 g) was extracted using 500 mL of ethanol/water mixture (80:20 v/v) for 2 hours while gently stirring with an overhead stirrer. The mixture was filtered using a Buchner funnel overlaid with Whatman No 1 filter paper. The collected marc was re-extracted. The combined filtrate was concentrated using rotary evaporator at 40 °C to one-third of its original volume. Thereafter, the filtrate was kept at 4 °C overnight. A clear supernatant was obtained and subjected to reduced pressure in a speed-vac in order to remove any residual organic solvent. The mixture was filtered using Whatman No. 1 filter paper under gravity and then lyophilized to give a light brown powder (Fig. 1) hereafter referred to as C. asiatica phenolic extract (CAPE). CAPE was stored at −20 °C protected from light.
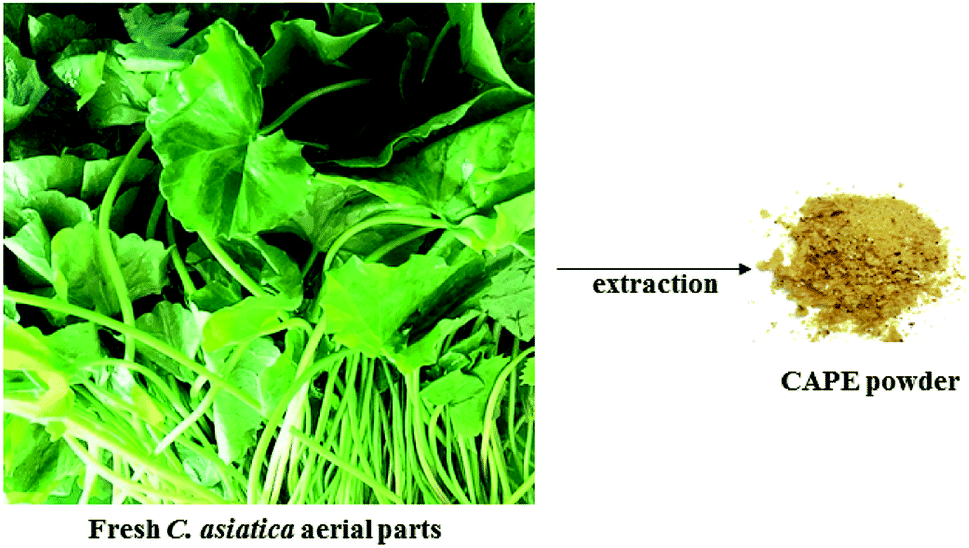 | ||
| Fig. 1 Preparation of CAPE from C. asiatica. | ||
2.2. Chemical characterization
:50 v/v). Briefly, 100 μL of sample, blank or standard was added to the test tubes. Thereafter, 200 μL of Folin-Ciocalteu reagent (10% v/v) was added and vortexed. After 5 min of incubation, the mixture was supplemented with 800 μL of sodium carbonate, vortexed and incubated in the dark at room temperature for 2 hours. 200 μL of the blue mixture formed was pipetted into a 96-well microplate and the absorbance was read at 765 nm using microplate reader. A standard curve for amount gallic acid (μg) versus absorbance at 765 nm was generated and used to determination of the total phenolic content of the sample.To determine the flavonoid content, CAPE (10 μg μL−1) and the standard – quercetin (1 μg μL−1) were prepared in 100% methanol. The CAPE or quercetin solution (30 μL) was diluted with 160 μL of methanol and subsequently, 10% aluminium chloride (30 μL), 1 M sodium acetate (30 μL), and distilled water (850 μL) were added. The mixture was vortexed and incubated in the dark for 30 min before reading the absorbance at 415 nm in a UV-visible spectrophotometer. Absorbance reading versus concentration of standard was used to obtain a calibration curve from which the total flavonoid content was derived.
000 rpm for 8 minutes. The supernatant was filtered through a 0.22 μM nylon filter to obtain a clear solution which was used for LC-MS analysis.The UHPLC-ESI-qTOF-MS analysis of CAPE was performed as earlier reported34 with slight modifications. Separation of chemical components from CAPE was carried out on an Agilent 1290 Infinity II LC System (Agilent Technologies, Santa Clara, CA) equipped with an autosampler, vacuum degasser, binary pump, thermostat and diode array detector. The sample was resolved using Agilent's ZORBAX Eclipse Plus C18, 150 × 2.1 mm, 1.8 μm column with acidified Milli-Q water (0.1% formic acid) and acetonitrile as mobile phases A and B, respectively. The elution gradient was set up as follows: 0.50 min, 0.00% B; 16.50 min, 100.00% B; 17.50 min, 100.00% B; 20.00 min, 0.00% B; 22.00 min, 0.00% B. The injection volume was 2.0 μL, the flow rate and temperature were maintained throughout the separation at 0.20 μL min−1 and 25 °C, respectively.
The HPLC system was coupled to an Agilent 6545 LC/Q-TOF MS mass spectrometer equipped with a Dual Agilent Jet Stream ESI operating in negative mode, covering spectra with mass range from m/z 100 to 1500 at a scan rate of 1.00 spectra per s. Accurate mass measurements by the instrument was ensured using an automated calibrant delivery system that continuously introduced a reference solution with mass mix of m/z 112.98558700 (TFA anion) to m/z 1033.98810900 (HP-0921) in the negative ESI mode, while m/z 121.05087300 (purine) and m/z 922.00979800 (HP-0921) were introduced in positive ESI mode. The ESI-MS parameters were as follows: drying gas temperature, 325 °C; drying gas flow rate, 13 L min−1; nebulizer gas pressure 35 psig; capillary voltage, 4000 V; fragmentor voltage, 175 V; radiofrequency voltage in the octupole (OctopoleRFPeak), 750 V and fixed collision energies of 10.00 eV, 20.00 eV and 40.00 eV. Data acquisition done using Mass Hunter Workstation Software Data Acquisition for Q-TOF version B.08.00 (B8058.3 SP1) and QTOF Firmware version 20.712.
2.3. Synthesis of silver nanoparticles
Biogenic silver nanoparticles were synthesized using CAPE as the reductant and stabilizer following a previous work29 with minor modification. Briefly, a 5.0 mg mL−1 of lyophilized CAPE sample was dissolved in ethanol:water mixture (1:3). Then different concentrations of AgNO3 were prepared (0.5–4.0) mM. 95 mL of AgNO3 was measured into a 250 mL beaker wrapped with an aluminium foil to prevent photo-oxidation and placed on a magnetic stirrer. CAPE solution (5.0 mL) adjusted to a pH 9.0 was added to the AgNO3 solution and stirred at room temperature for 90 minutes. Successful synthesis of CAPE-AgNPs was monitored with a UV-visible spectrophotometer. Parameters affecting CAPE-AgNPs, such as the effect of AgNO3 concentration and synthesis kinetics were briefly optimized. CAPE-AgNPs was centrifuged at 15000 rpm for 15 minutes and was washed with an ultra-pure water to remove excess CAPE and free AgNO3 that were not used for AgNPs synthesis from solution. The collected pellets were lyophilized prior to characterization and applications.
2.4. Materials characterization
CAPE-AgNPs was subjected to various instrumental characterizations to obtain vital, detailed information such as the shape and morphology of the synthesized nanoparticles. Transmission electron microscopy (TEM), images were observed on a JEM-2010 electron microscope from JOEL Ltd., Japan. Samples were prepared by spotting about 5 μL of colloidal solution of CAPE-AgNPs on a copper grid, then evaporating solvent at ambient temperature. UV-vis absorption spectra were obtained from a UV-2600 spectrophotometer (Shimadzu, Japan), with a 1.0 cm path length quartz cell. Particles hydrodynamic diameters and zeta potential were recorded with a Brookhaven's NanoBrooks ZetaPALS (Brookhaven instrument, USA). Colloidal solution of CAPE-AgNPs in cuvette was inserted into the sample holder of the equipment and the particle size was measured with a size measuring software, while the zeta potential was obtained using the zetasizer software.X-ray diffraction (XRD) of CAPE-AgNPs pellets was performed on an Empyrean XRD diffractometer (Empyrean, Netherland), for 2 theta value ranging from 20–80° using Cu Kα with a radiation wavelength of 0.154 nm and a scan speed of 70.2 seconds. Qualitative elemental compositions of CAPE-AgNPs were obtained using an energy dispersive X-ray spectroscopy (EDS) on Oxford instruments. Fourier transform infrared (FTIR) spectra were collected using a PerkinElmer spectrum BX, in the range of 400–4000 cm−1, with 4.0 cm−1 resolution. Powdered CAPE-AgNPs was ground with potassium bromide (KBr) into a thin circular film and was placed in the sample holder of the equipment.
2.5. Biological application (antimicrobial activity)
2.6. Catalytic applications
The catalytic efficacy of CAPE-AgNPs was demonstrated on notable environmental pollutants 4-nitrophenol (4-NP) and azo dyes (Congo red, CR and methylene blue, MB). Freshly prepared sodium borohydride (NaBH4) was used as the reducing agent. For the catalytic reduction of 4-NP, into a 3.0 mL glass vial, 1.4 mL of 215 μM of 4-NP was added, then 1.4 mL of 21.5 mM of NaBH4 was added, followed by the addition of 200 μL CAPE-AgNPs. The mixture was vortexed, then transferred into a cuvette and the UV-vis spectra recorded every 1 minute. For catalytic degradation of CR, 700 μL of 215 μM of CR, were mixed with 700 μL of 33.0 mM of NaBH4. 700 μL of ultra-pure water was added to the mixture, after which 200 μL of CAPE-AgNPs was added to complete 3.0 mL reaction mixture. The absorption spectra of the reaction mixture were read at 1 minute interval. For MB catalytic degradation, 700 μL of 215 μM of MB was added to 700 μL of 21.5 mM of NaBH4, then 1200 μL of ultra-pure water was added, followed by 400 μL of CAPE-AgNPs. The absorption spectra of the mixture were read at 2 minutes interval.3. Results and discussion
3.1 Chemical characteristics of CAPE
Numerous studies have demonstrated the synthesis of silver nanoparticles from phytoconstituents. While the precise mechanism underlying the photosynthesis of silver nanoparticles remains to be fully elucidated, literature data suggest polyols, chiefly flavonoids and phenolic compounds are largely responsible for the reduction of silver ions.31,32 As shown in Table 1, CAPE is endowed with phenolics and flavonoids, which in part explains its antioxidant activity and reduction potential, as revealed by the DPPH and FRAP values, respectively. CAPE's ability to reduce the ferric-TPTZ complex foreshadowed its potential to reduce silver ions towards the biogenic synthesis of nanoparticles.| Characteristics | CAPE |
|---|---|
| Yield (%) in dry weight | 24.6 |
| Phenolic content (mg gallic acid g−1) | 22.13 ± 0.25 |
| Flavonoid content (mg quercetin g−1) | 9.43 ± 0.12 |
| FRAP (μmol Trolox) | 190 ± 8.39 |
| DPPH [IC50] μg mL−1 | 310.08 ± 0.68 |
The UHPLC-ESI-qTOF-MS analysis revealed the identities of the individual biomolecules present in CAPE. As shown in Table 2, CAPE is mainly composed of phenolic compounds ranging from simple phenolics such as quinic acid, chlorogenic acids to complex polyphenols such as the flavonoid glycoside, quercetin 3′-O-glucuronide and condensed tannin, procyanidin B1. In addition, triterpenoids including, asiaticoside and madecassoside were part of CAPE. Previously it had been suggested that the most probable mechanism of a phyto complex such as CAPE mediated silver nanoparticle synthesis would involve the various chemical constituents working together in synergy and simultaneously serving as reducing and stabilizing agents.33,34
| Peak no. | RT (min) | Precursor | Mass | Formula | Diff (ppm) | Score (%) | Tentative compound identity |
|---|---|---|---|---|---|---|---|
| a RT: retention time. | |||||||
| 1 | 5.859 | 191.0558 | 192.06 | C7H12O6 | 1.98 | 95.22 | Quinic acid |
| 2 | 5.909 | 353.0875 | 354.09 | C16H18O9 | 0.52 | 99.39 | Chlorogenic acid |
| 3 | 6.361 | 299.0769 | 300.08 | C13H16O8 | 0.65 | 98.43 | Salicylic acid beta-D-glucoside |
| 4 | 6.963 | 395.0982 | 350.10 | C17H18O8 | 0.53 | 99.65 | 4-Feruloyl-1,5-quinolactone |
| 5 | 7.039 | 137.0243 | 138.03 | C7H6O3 | 1 | 99.1 | 3,4-Dihydroxybenzaldehyde |
| 6 | 7.139 | 173.0454 | 174.05 | C7H10O5 | 1.26 | 97.56 | Shikimic acid |
| 7 | 7.29 | 487.2185 | 428.20 | C21H32O9 | 0.05 | 99.06 | Taraxacolide 1-O-b-D-glucopyranoside |
| 8 | 7.34 | 367.1033 | 368.11 | C17H20O9 | 0.32 | 99.07 | 3-O-Caffeoyl-4-O-methylquinic acid |
| 9 | 7.416 | 371.0982 | 372.11 | C16H20O10 | 0.52 | 99.56 | Dihydroferulic acid 4-O-glucuronide |
| 10 | 7.667 | 693.2772 | 634.26 | C32H42O13 | −1.01 | 98.93 | Myricanene A 5-[arabinosyl-(1→6)-glucoside] |
| 11 | 7.817 | 477.0678 | 478.08 | C21H18O13 | −0.49 | 99.26 | Quercetin 3′-O-glucuronide |
| 12 | 7.842 | 301.0353 | 302.04 | C15H10O7 | 0.17 | 98.58 | Hieracin |
| 13 | 7.842 | 675.2663 | 630.27 | C33H42O12 | −0.48 | 99.48 | 13-Acetyl-9-dihydrobaccatin III |
| 14 | 8.018 | 505.0982 | 506.11 | C23H22O13 | 0.98 | 98.38 | Quercetin 7-(6′′-acetylglucoside) |
| 15 | 8.068 | 429.2123 | 384.21 | C20H32O7 | 2.07 | 96.07 | Cinnzeylanol |
| 16 | 8.081 | 515.1191 | 516.13 | C25H24O12 | 0.91 | 99.11 | 4,5-Di-O-caffeoylquinic acid |
| 17 | 8.219 | 461.0719 | 462.08 | C21H18O12 | 1.14 | 97.85 | Scutellarein 7-glucuronide |
| 18 | 8.244 | 923.1505 | 864.14 | C40H32O22 | 2.07 | 96.24 | 2′′,3′′,6′′-Trigalloyliriflophenone 3-C-glucoside |
| 19 | 8.244 | 973.5001 | 974.51 | C48H78O20 | 1.34 | 98.01 | Madecassoside |
| 20 | 8.244 | 1019.506 | 974.51 | C48H78O20 | 1.15 | 98.39 | Asiaticoside B |
| 21 | 8.269 | 471.2229 | 426.23 | C22H34O8 | 1.54 | 97.12 | Cinnzeylanine |
| 22 | 8.47 | 515.1189 | 516.13 | C25H24O12 | 1.12 | 98.22 | 4,5-Di-O-caffeoylquinic acid |
| 23 | 8.52 | 601.1202 | 602.12 | C28H26O15 | −0.01 | 99.06 | Eriodictyol 7-(6-galloylglucoside) |
| 24 | 8.57 | 557.1293 | 558.14 | C27H26O13 | 1.31 | 98.58 | Piceatannol 4′-galloylglucoside |
| 25 | 8.771 | 1003.51 | 958.51 | C48H78O19 | 2.39 | 94.59 | Mabiogenin 3-[rhamnosyl-(1→6)-[glucosyl-(1→2)]-glucoside] |
| 26 | 8.847 | 395.098 | 350.10 | C17H18O8 | 1 | 98.72 | 4-Feruloyl-1,5-quinolactone |
| 27 | 9.072 | 1061.515 | 1062.52 | C51H82O23 | 2.21 | 95.26 | 26-Desglucoavenacoside B |
| 28 | 9.098 | 529.1351 | 530.14 | C26H26O12 | −0.15 | 98.67 | 1-Feruloyl-5-caffeoylquinic acid |
| 29 | 9.148 | 563.3433 | 518.35 | C27H50O9 | −0.64 | 75.07 | 3-O-L-Rhamnosyl-3-hydroxydecanoyl-3-hydroxydecanoic acid |
| 30 | 9.361 | 1003.511 | 958.51 | C48H78O19 | 1.7 | 97.48 | Asiaticoside |
| 31 | 9.374 | 615.1349 | 616.14 | C29H28O15 | 1.23 | 98.77 | 3,5-Dicaffeoyl-4-succinoylquinic acid |
| 32 | 9.587 | 329.0671 | 330.07 | C17H14O7 | −1.15 | 99.29 | 7,3′,4′-Trihydroxy-3,8-dimethoxyflavone |
| 33 | 9.888 | 987.5167 | 942.52 | C48H78O18 | 0.67 | 99.38 | Soyasapogenol B 3-O-[a-L-rhamnosyl-(1→4)-b-D-galactosyl-(1→4)-b-D-glucuronide] |
| 34 | 10.277 | 577.1351 | 578.14 | C30H26O12 | 0.81 | 93.65 | Procyanidin B1 |
3.2 Synthesis of CAPE-AgNPs
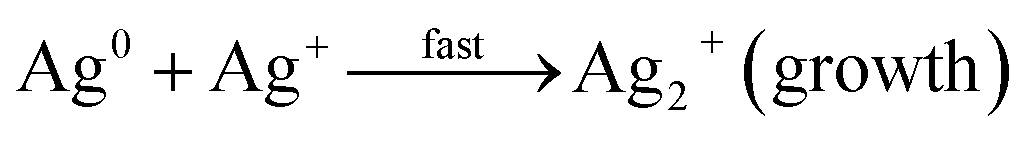
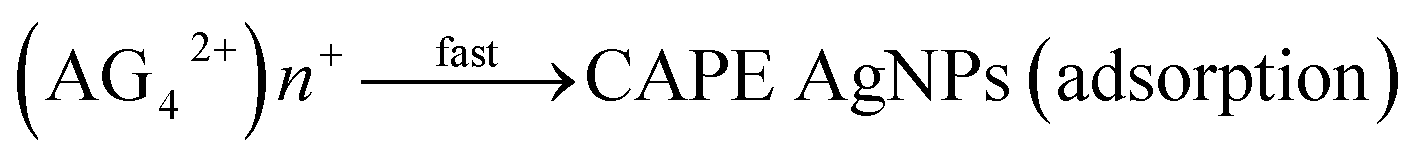
For reproducible synthesis of bio-fabricated AgNPs, 5 mg mL−1 of CAPE solution was prepared in ethanol:water (1:3), 5 mL of the solution was adjusted to pH 9.0 with NaOH, then added to 95 mL of AgNO3 solution (0.5 to 4.0 mM) while stirring at room temperature. The multitudinous phenolics can act as a potent reductant and stabilizer for the reduction of AgNO3. Research abounds where phytoconstituents in various plants parts have been exploited for biogenic synthesis of AgNPs.22,35,36 Biogenic synthesis of nanoparticles follows the general nucleation and growth mechanism. These reactions are kick-started ones the Gibb's free energy changes of the reaction are less than zero.37 Moreover, the nucleation and growth processes of nanoparticles synthesis are dependent on several factors such as: pH, temperature, concentration, type of precursor, reducing and stabilizing agent and the molar ratio of precursor to stabilizer.38 In the present CAPE mediated synthesis of monodispersed AgNPs, Ag+ are reduced in solution by CAPE, by receiving an electron from CAPE, to switch from a positive valence state to a zero valent configuration, followed by nucleation and growth process. These reactions are aptly depicted in the equations below using a notable phenolic present in CAPE (chlorogenic acid, CA) as a decoy of reductive bioactives. At the beginning, chlorogenic acid reduces positive valence state Ag+ very slowly, while it is converted to a radical (eqn (1)). This radical reacts with more Ag+ in solution rather vigorously, as a result, chlorogenic acids are oxidized to their respective ketone analogues, with concomitant formation of zero valence Ag0 (eqn (2)). The formed Ag0 are of very small particles diameter and are highly unstable.39 Ag0 acted as a catalyst towards further reduction of more Ag+ in solution to form an intermediate specie Ag2+ (eqn (3)). These intermediate Ag2+, further coalesce (eqn (4)), then grow/increase in size to form another intermediate species Ag42+ in the popular Ostwald ripening phenomenon.40 In the final stage of CAPE synthesis of AgNPs, ripe nanoparticles are further stabilized by other phenolics to prevent particles aggregation through adsorption (eqn (5)).
 | (1) |
 | (2) |
 | (3) |
| Ag2+ + Ag2+ → Ag42+ (growth) | (4) |
 | (5) |
As it is generally known, the stability of colloidal metal nanoparticles is dependent on several parameters. From the outset, we investigated the effect of concentration of AgNO3 towards AgNPs synthesis, by varying concentration from 0.5 to 4.0 mM. As shown in Fig. 2A, different concentrations of AgNO3 resulted in the formation of different AgNPs with distinct visual images (Fig. 2A inset). The absorption spectra collected between 300–700 nm showed maximum absorption at 436 nm (0.5 mM), 438 nm (1.0 mM), 430 nm (2.0 mM), 440 nm (4.0 mM). Optimization condition revealed that the absorbance values of AgNPs synthesized with 2.0 and 4.0 mM AgNO3 (Fig. 2A-d and e) are much higher than those synthesized at 0.5 and 1.0 mM AgNO3 (Fig. 2A-b and c). It has been speculated that nano-sized AgNPs with maximum absorption spectra between 400–450 nm are of close size distributions, with mostly monodispersed morphology.18 It is worth mentioning that the sharp peaks between 430–440 nm of AgNPs result from the electronic oscillation of the conduction electrons on nanoparticles surfaces as a result of interaction with the electromagnetic radiation. This phenomenon is known as the surface plasmon resonance (SPR), which imbue metals nanoparticles with ability to serve in diverse applications and have thus revolutionized the nanotechnology field. Since a red shift in absorption spectra of nanoparticles are often associated with increased particles sizes, CAPE-AgNPs synthesized with 2.0 mM AgNO3 having maximum absorption spectrum at 430 nm was used for further investigation. Fig. 2B, shows the kinetics of CAPE-AgNPs synthesis at 2.0 mM AgNO3. As can be observed, the absorbance and the intensity at 430 nm increases as a function of time. A plot of absorbance at 430 nm against time (Fig. 2C), shows a swift synthesis kinetics, that is completed at about 90 minutes. Thus, reproducible synthesis of CAPE-AgNPs was achievable at 90 min.
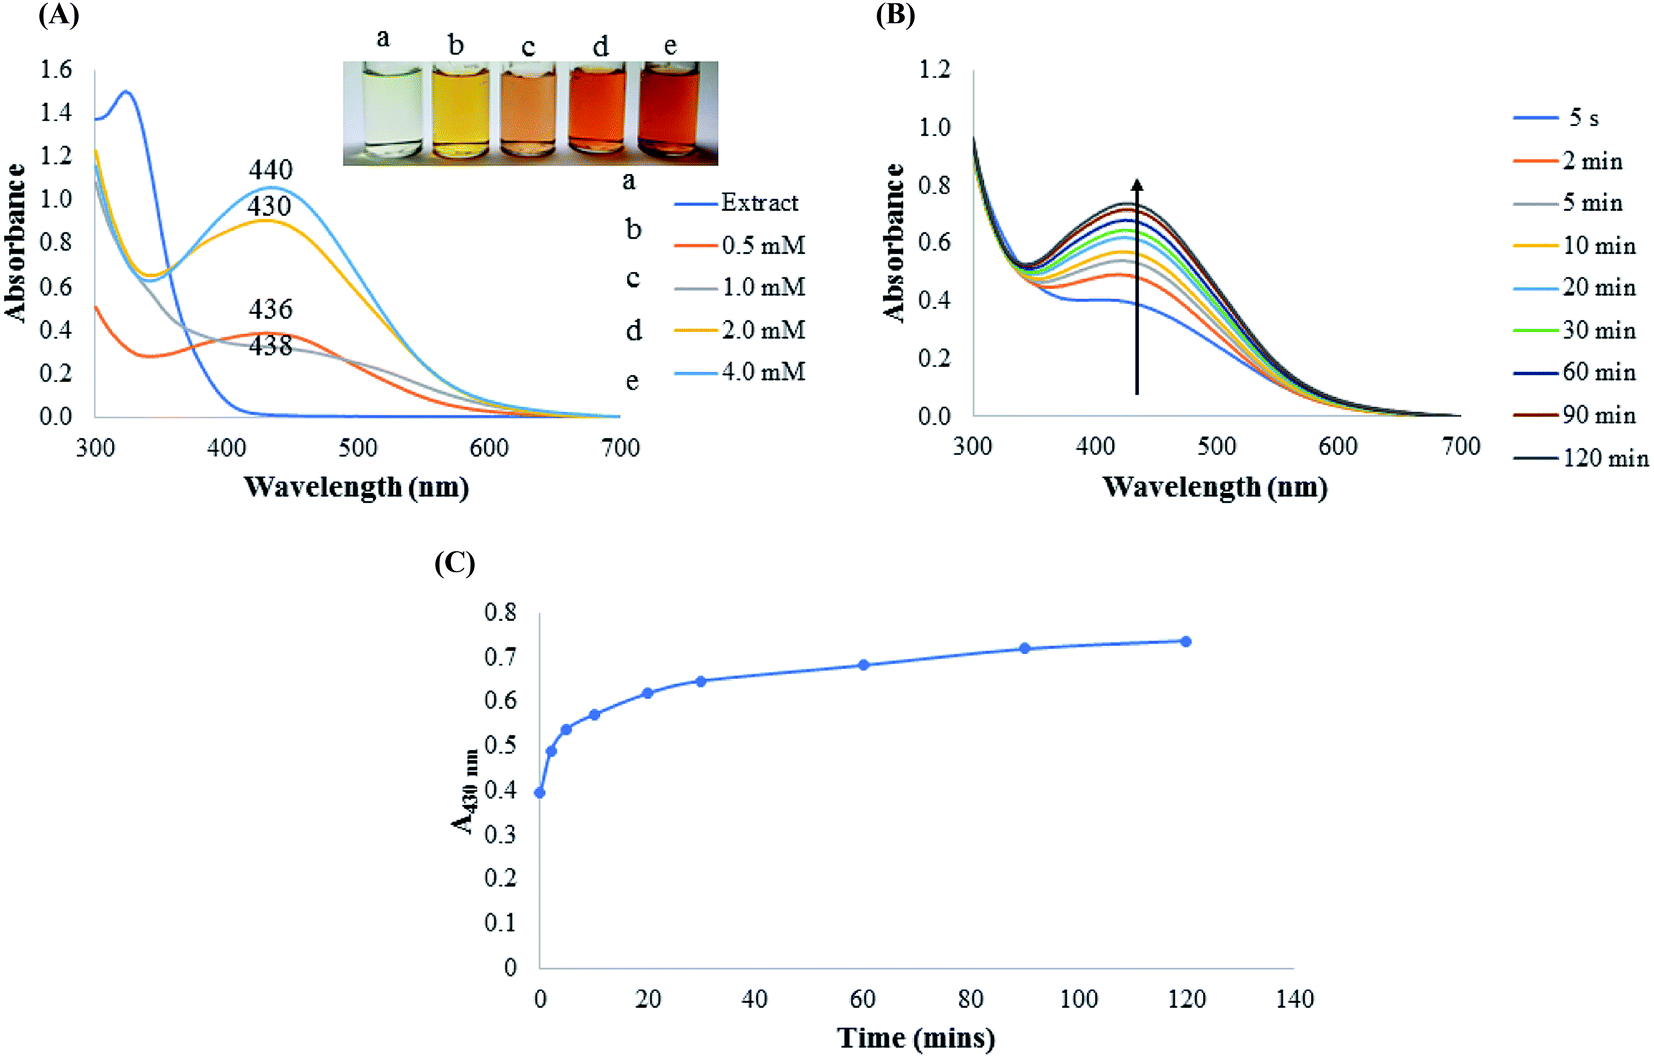 | ||
| Fig. 2 (A) Synthesis of CAPE-AgNPs under different concentrations of AgNO3. Inset shows the photographic images of CAPE-AgNPs with (a) CAPE extract (b) 0.5 mM (c) 1.0 mM (d) 2.0 mM and (e) 4.0 mM AgNO3 (B) kinetics of CAPE-AgNPs synthesis under 2.0 mM AgNO3 within time of 0–120 min and (C) Plot of absorbance at 400 nm of CAPE-AgNPs with time. | ||
3.3 Materials characterization
CAPE-AgNPs synthesized under our optimized conditions was obtained after three cycles of centrifugation and wash in ultra-pure water. The cleaned CAPE-AgNPs powder obtained through lyophilization was subjected to different instrumental analyses for characterization. Fig. 3 shows the result of the images observed under a transmission electron microscope (TEM). As can be seen, the particles of CAPE-AgNPs are spherical and dispersed. Fig. 3a–c. Fig. 3d, shows the histogram plot of the particles observed with an Image J software. It shows a significant particle distribution around 20–25 nm. The selected area electron diffraction (SAED) image of CAPE-AgNPs is shown in Fig. 3e. The crystalline nature of AgNPs are conspicuously observed as different circles attributed to the different diffraction structure of AgNPs.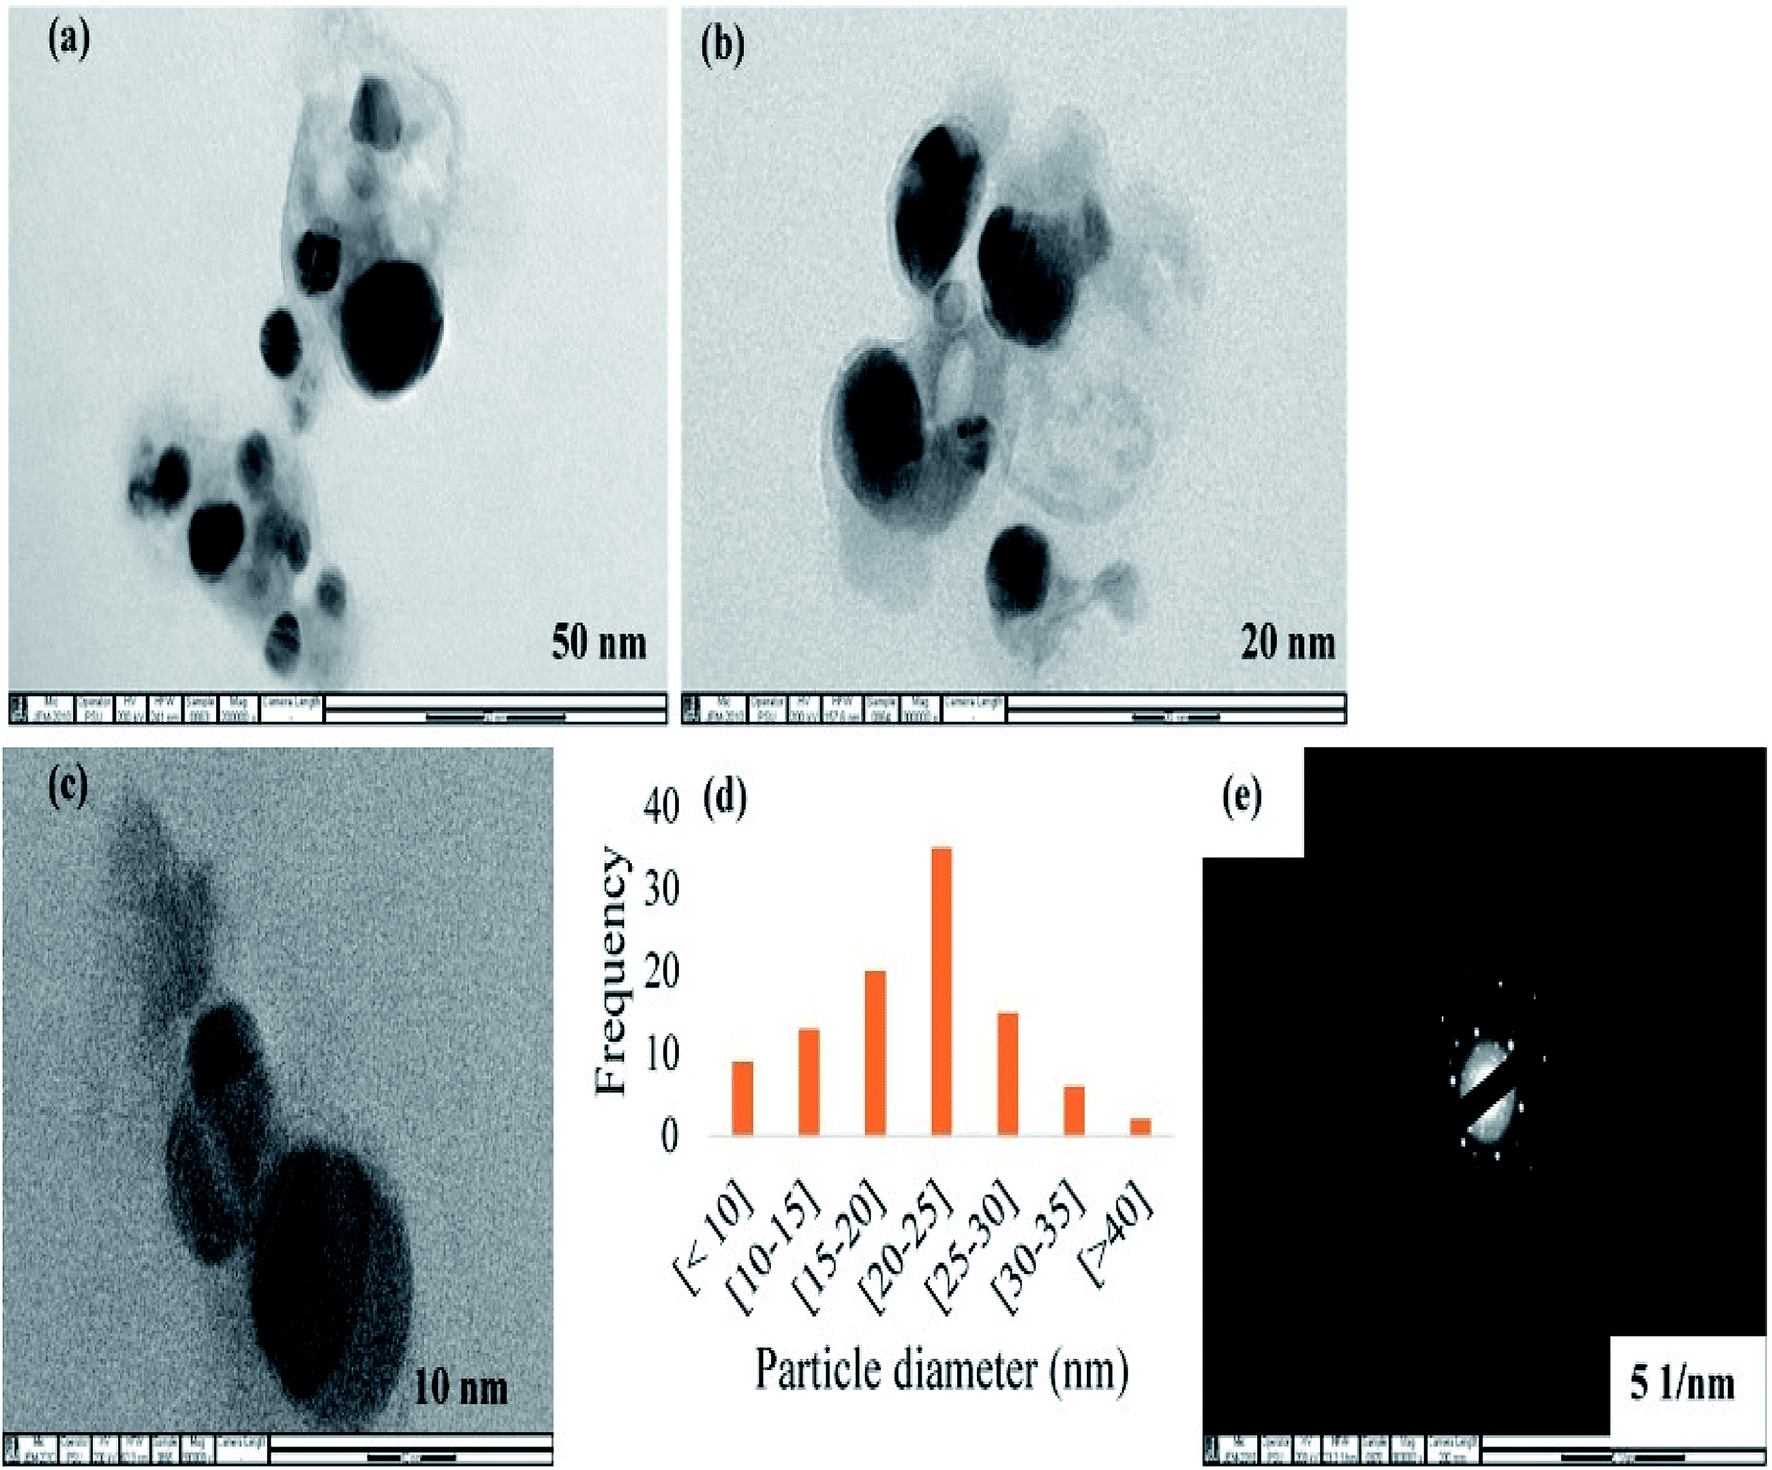 | ||
| Fig. 3 TEM images of CAPE-AgNPs at (a) 50 nm (b) 20 nm (c) 10 nm (d) histogram plot of 100 particles from image J software and (e) selected area electron diffraction images. | ||
Moreover, particles diameter of CAPE-AgNPs was also investigated using a dynamic light scattering (DLS) instrument. DLS is one of the most reliable techniques used in verifying colloidal nanoparticles sizes. It should be noted that the particle sizes obtained from DLS are often much larger than the results from TEM. This is because, DLS is used in an aqueous environment and are thus prone to estimating particle sizes in addition to the hydration sphere.41 Fig. 4a, shows DLS result of CAPE-AgNPs, with average hydrodynamic diameter of 90.3 nm and a poly dispersity index (PDI) of 0.186, attesting to the mono-dispersity of the particles. Colloidal nanoparticles with PDI greater than 0.4 are generally attributed to particles having poly dispersed morphology.42 Zeta potential analysis of colloidal metal nanoparticles is another important technique imbued with capacity to reveal information about the stability of nanoparticles. CAPE-AgNPs zeta potential was estimated on a Nano Zetasizer and a value of −28.7 mV was obtained. The negative charges show CAPE-AgNPs are stable in solution and are covered with biomolecules offering stability against facile aggregation. Generally, colloidal nanoparticles with zeta potential values in the range of ±30 mV are assigned to highly stable and dispersed particles.43 Thus, CAPE-AgNPs zeta value further validated its stability through phenolics capping on it surfaces.
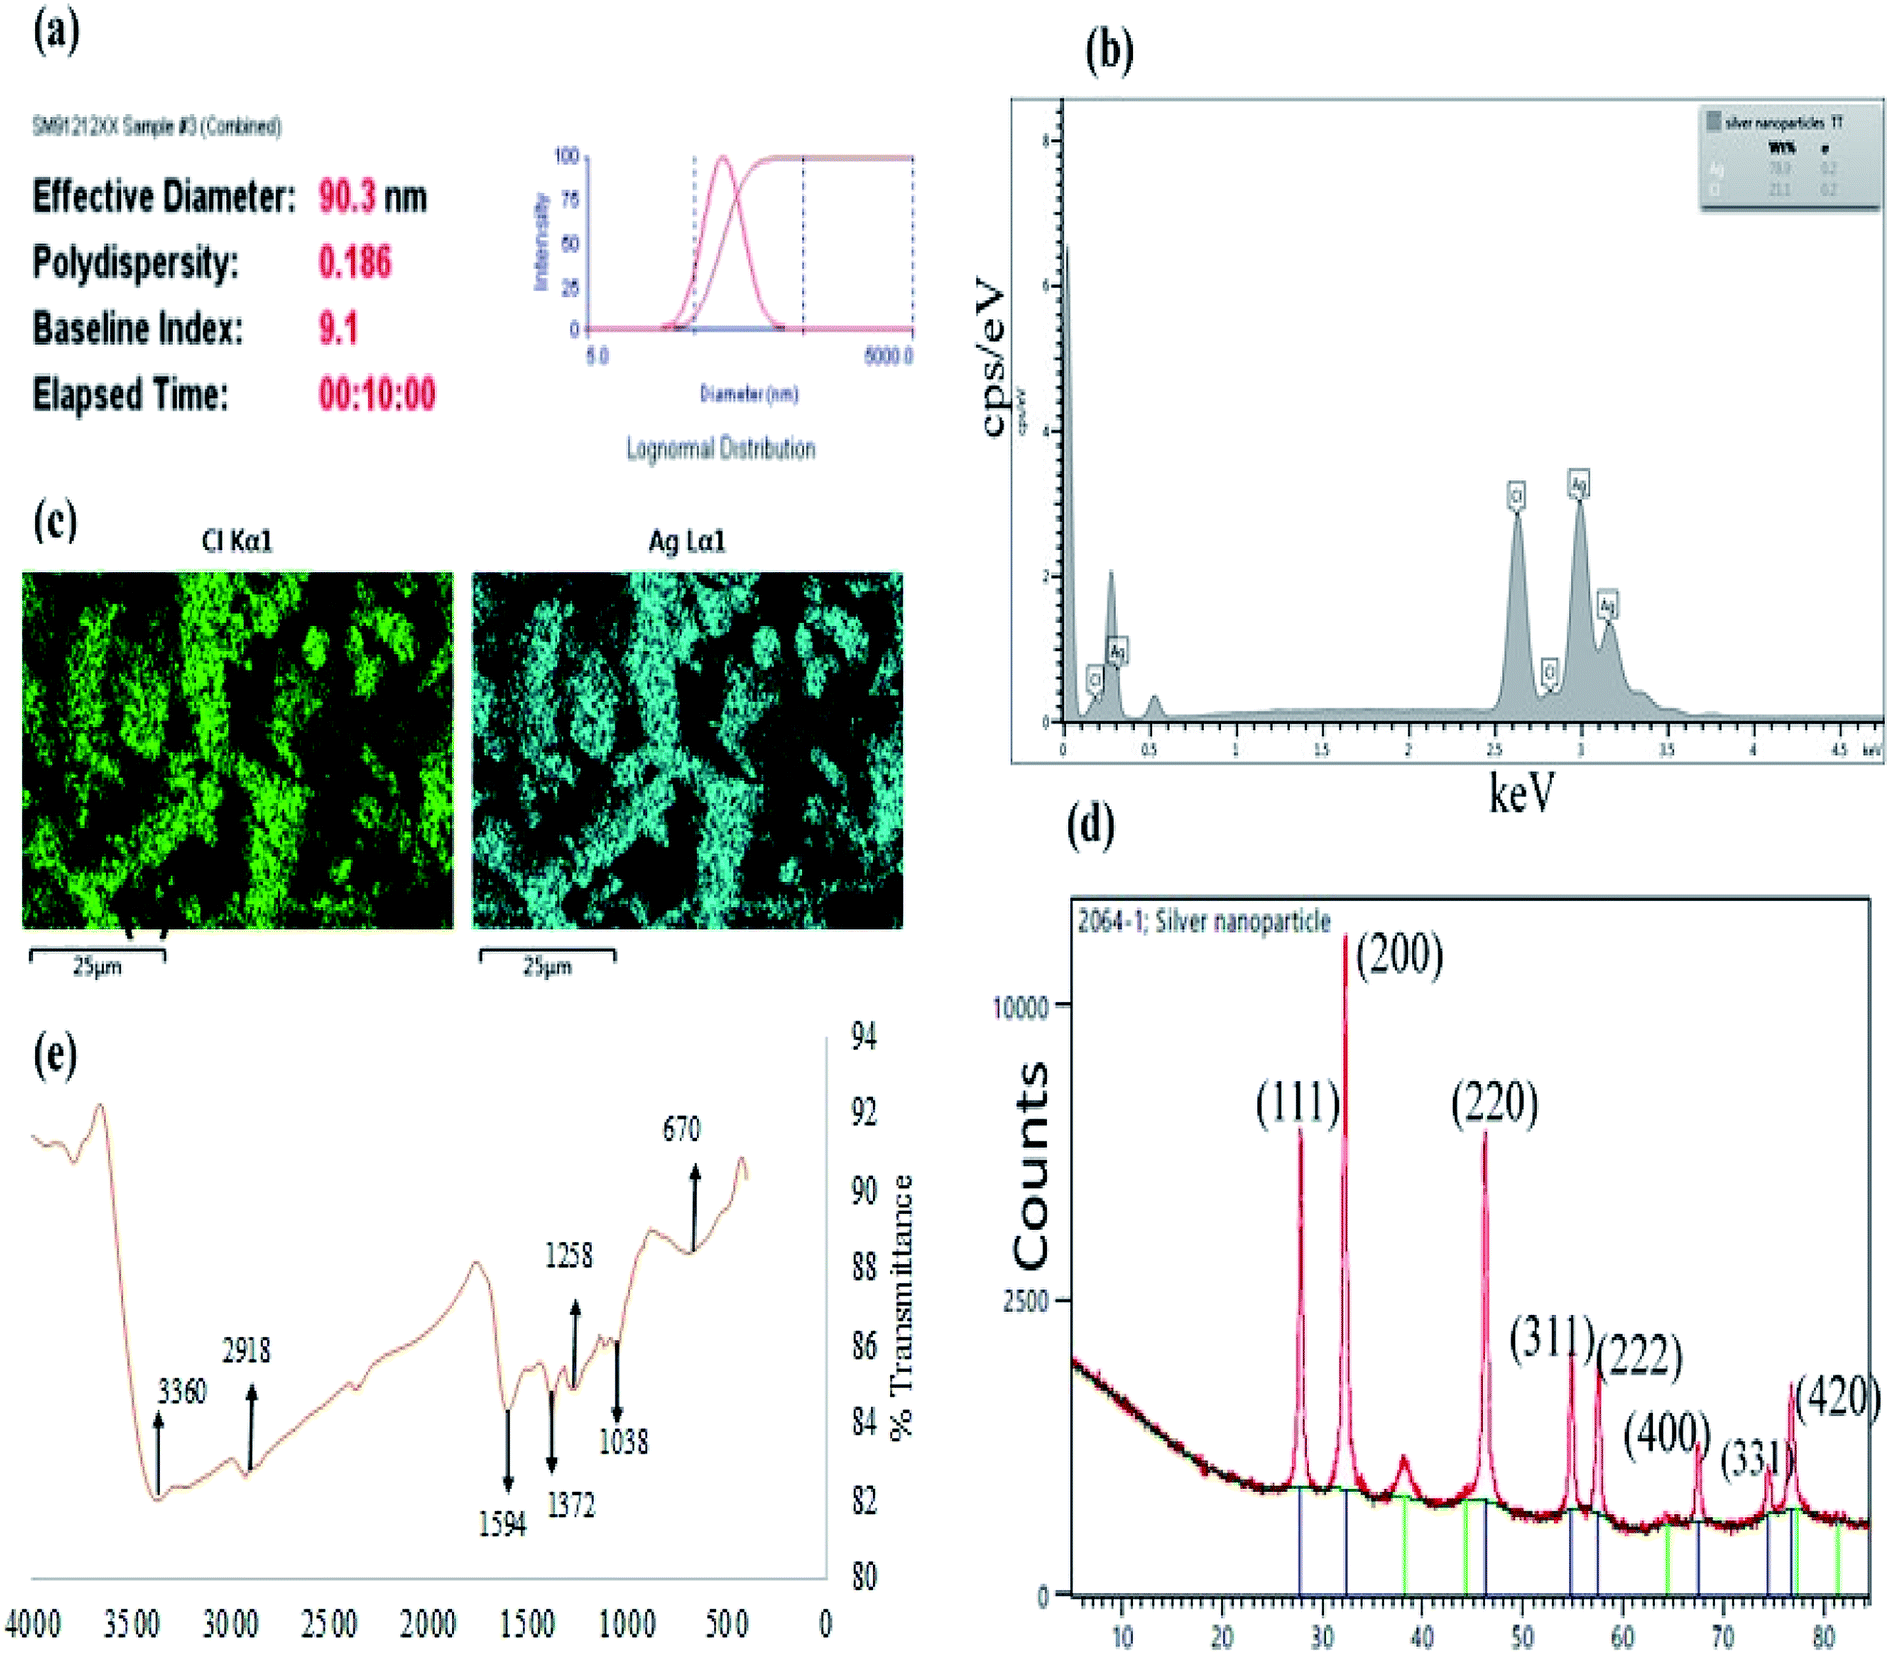 | ||
| Fig. 4 (a) Particles diameter estimate of CAPE-AgNPs from DLS (b) energy dispersive X-ray analysis of CAPE-AgNPs (c) selected elemental mapping of CAPE-AgNPs (d) FTIR Spectrum of CAPE-AgNPs and (e) X-ray diffraction of CAPE-AgNPs. | ||
Furthermore, the elemental compositions of CAPE-AgNPs was investigated by carrying out an energy dispersive X-ray spectroscopic (EDS) analysis. As shown in Fig. 4b, a sharp peak of Ag (78.9%) was observed at 3 keV and another peak of Cl (21.2%) at 2.5 keV. The elemental mapping of CAPE-AgNPs (Fig. 4c), shows the presence of Ag and Cl.
The crystalline nature of CAPE-AgNPs was obtained through X-ray powder diffraction (XRD) analysis. Fig. 4d, reveals major peaks at 27.84, 32.25, 46.20, 54.83, 57.46, 67.45, 74.45, and 77.45 which are located on 2 theta degree of the XRD spectra (111), (200), (220), (311), (222), (400), (331), and (420) crystalline surfaces, which is in conformity with ICDD number (00-031-1238). This result confirmed the face-centered-cubic crystallographic structure of AgNPs. Similar results have been reported by.44–46 Moreover, the Scherrer equation, [D = kλ/βcosθ] can be used to estimate the particle crystalline sizes of synthesized nanoparticles where D is the average crystalline size of nanoparticles, k is assigned 0.9 value, λ is the wavelength of the X-ray radiation source and β is the angular full width at half maximum (FWHM) of the highest peak at (200) diffraction angle θ. The estimated average crystalline size is about 16 nm.
In order to probe the presence of bioactives on the surfaces of CAPE-AgNPs, functional group elucidation was investigated with a Fourier transform infrared (FTIR) spectroscopy. Fig. 4e shows the FTIR spectrum of CAPE-AgNPs. Major peaks can be identified at 3360, 2918, 1594, 1372, 1258, 1038, and 670 cm−1. The peak at 3360 cm−1 is attributed to O–H stretching of OH in phenols and alcohols, peak at 2918 cm−1 is due to C–H stretching aliphatic groups, the peak at 1594 cm−1 can be attributed to C![[double bond, length as m-dash]](https://www.rsc.org/images/entities/char_e001.gif) C or CO stretching of amide,39 peak at 1372 and 1258 cm−1 is assigned to C–C stretching of (in ring) of aromatic compounds47 and C–N stretching of amines, the peaks at 1038 cm−1 can be assigned to the C–O–C and C–OH stretching vibrations of secondary alcohols. The observed functional groups on CAPE-AgNPs show that CAPE-AgNPs are stabilized by high OH possessing biomolecule probably derived from phenolics, saponins or sugars (Table 2).
C or CO stretching of amide,39 peak at 1372 and 1258 cm−1 is assigned to C–C stretching of (in ring) of aromatic compounds47 and C–N stretching of amines, the peaks at 1038 cm−1 can be assigned to the C–O–C and C–OH stretching vibrations of secondary alcohols. The observed functional groups on CAPE-AgNPs show that CAPE-AgNPs are stabilized by high OH possessing biomolecule probably derived from phenolics, saponins or sugars (Table 2).
3.4 Antibacterial activity
Plant phenolic extracts are excellent sources of bioactive antimicrobial compounds. In this study, CAPE showed an antimicrobial activity with MIC and MBC range of 10 to >40 mg mL−1 against the tested bacteria isolates. The antimicrobial activities of extracts from the leaves and root of C. asiatica have been previously reported with MIC range of 10 to 20 mg mL−1 and 5 to >10 mg mL−1.46,48 As shown in Table 3, the green synthesized AgNPs demonstrated excellent antibacterial activity against the tested isolates with MIC of 0.625 to 1.249 μg mL−1 and MBC range of 2.498 to 9.994 μg mL−1. The antimicrobial mechanisms of AgNPs are not elaborately understood, however it is suggested that the binding of the positively charge silver ions to the negatively charged bacterial cell wall components facilitates the penetration of the AgNPs across the membrane resulting in disruption of cell membrane, disintegration of DNA and interaction with cellular enzymes, transport proteins and other cytoplasmic components resulting in cell death.49 Moreover, the efficacy of some notable organelles such as mitochondria, Golgi apparatus, endoplasmic reticulum is severely compromised, resulting in reduced or interrupted transmembrane electron transport50 with devastating consequences.| Bacterial isolates | Extract | CAPE-AgNPs | ||
|---|---|---|---|---|
| MIC–MBC (mg mL−1) | MIC–MBC (μg mL−1) | |||
| B. cereus | 10 | 40 | 0.625 | 2.498 |
| E. coli | 20 | >40 | 0.625 | 2.498 |
| L. monocytogenes | 20 | >40 | 1.249 | 9.994 |
| P. aeruginosa | 20 | 40 | 0.625 | 2.498 |
| S. aureus | 10 | >40 | 1.249 | 4.997 |
3.5 Catalytic applications of CAPE-AgNPs
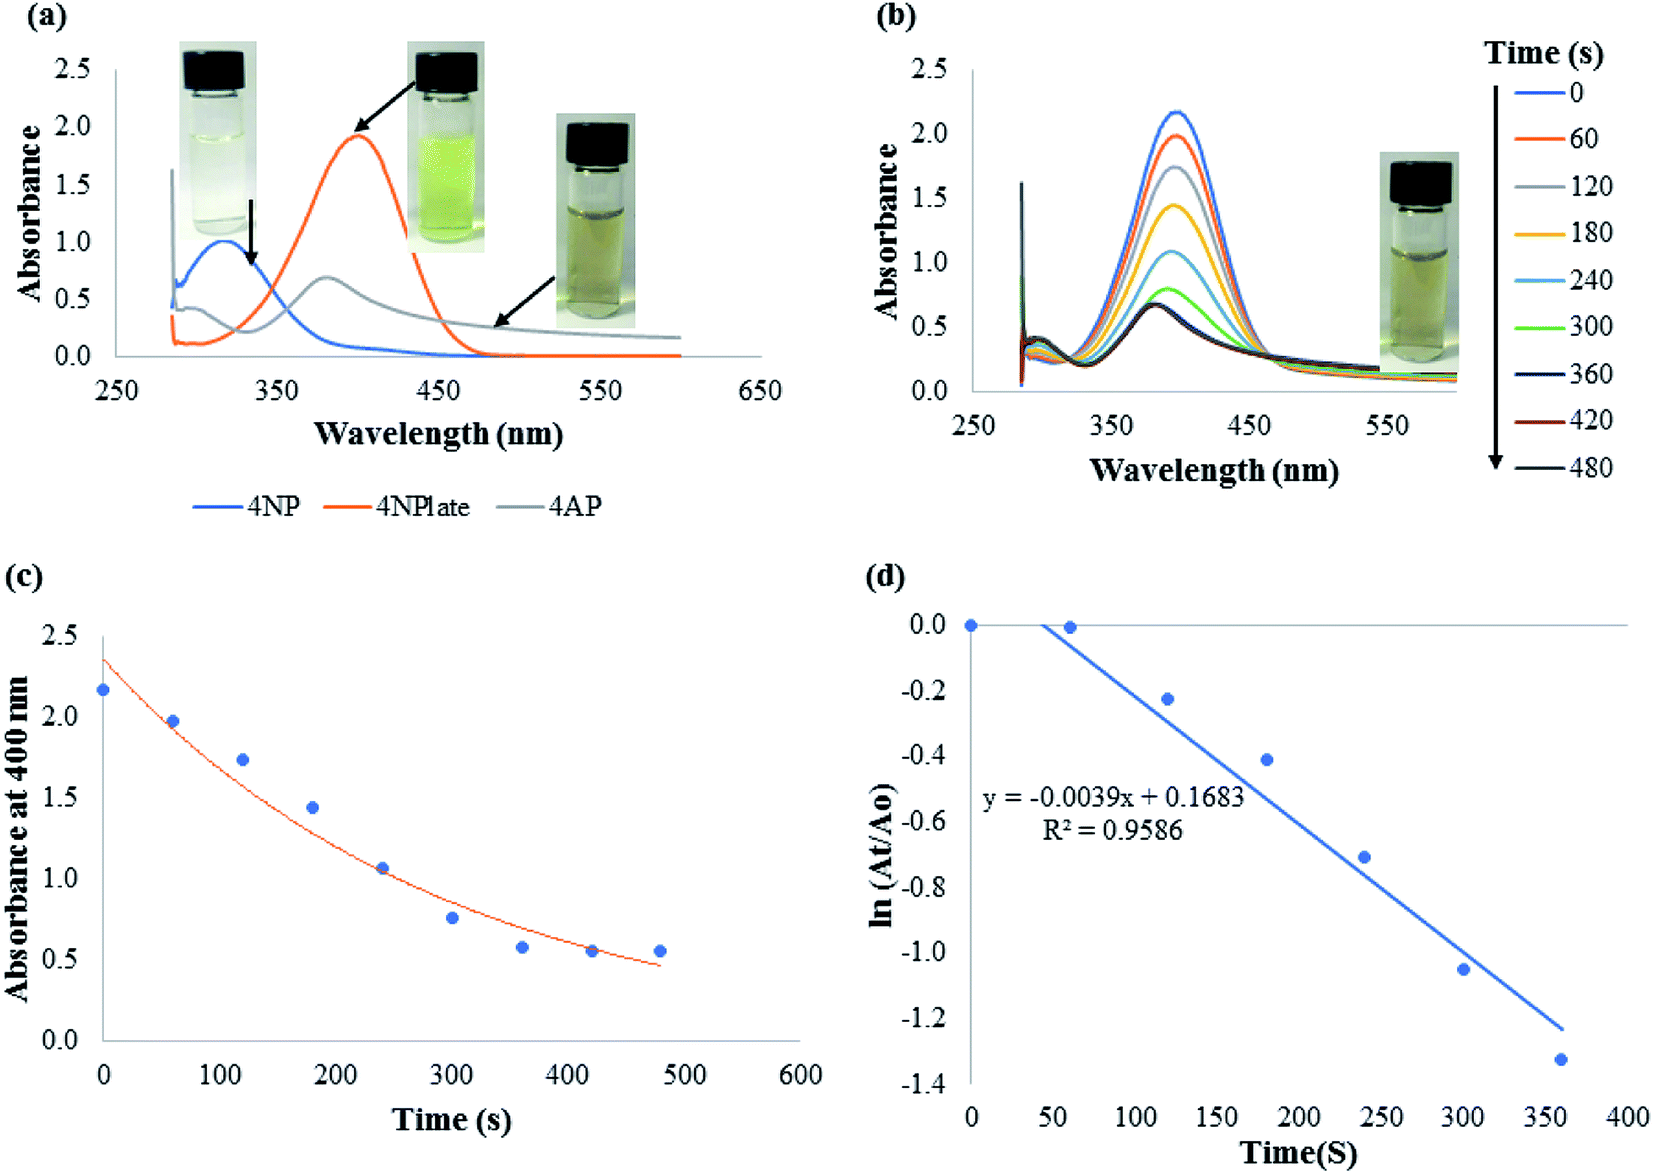 | ||
| Fig. 5 (a) UV-vis absorption plot of 4 NP, 4 NPlate and 4 AP. Inset shows the photographic images (b) UV-vis absorption spectra of 4 NPlate reduction with time. Inset shows the photographic image of the degradation product (c) plot of absorbance at 400 nm with time and (d) linear plot of ln(At/Ao) vs. time. | ||
| Pollutant | Nanomaterials for catalytic degradation | Rate constant (k) | References |
|---|---|---|---|
| a PDDA = poly(diallyldimethylammonium chloride), PtNPs = platinum nanoparticles, BMNPS = bimetallic nanoparticles, TA = tannic acid. | |||
| 4 NP | Co-WP-CC | 11.1 × 10⁻³ s−1 | 57 |
| AuNPs@fungus Trichoderma | 4.9 × 10⁻³ s−1 | 58 | |
| PtNPs@PDDA | 0.5 × 10⁻³ s−1 | 59 | |
| Cu–Ag BMNPs | 4.05 × 10⁻³ s−1 | 60 | |
| CAPE-AgNPs | 3.9 × 10⁻³ s−1 | This work | |
| MB | AgNPs@Zanthoxylum armatum | 1.44 × 10⁻³ min−1 | 61 |
| Fe3O4@TA/Ag | 68.5 × 10⁻³ min−1 | 41 | |
| CAPE-AgNPs | 54.7 × 10⁻³ min−1 | This work | |
| CR | AgNPs@bacterial exopolysaccharide | 2.6 × 10⁻³ s−1 | 62 |
| AuNPs@Dalbergia-coromandeliana | 4.5 × 10⁻³ s−1 | 63 | |
| CAPE-AgNPs | 5.6 × 10⁻³ s−1 | This work | |
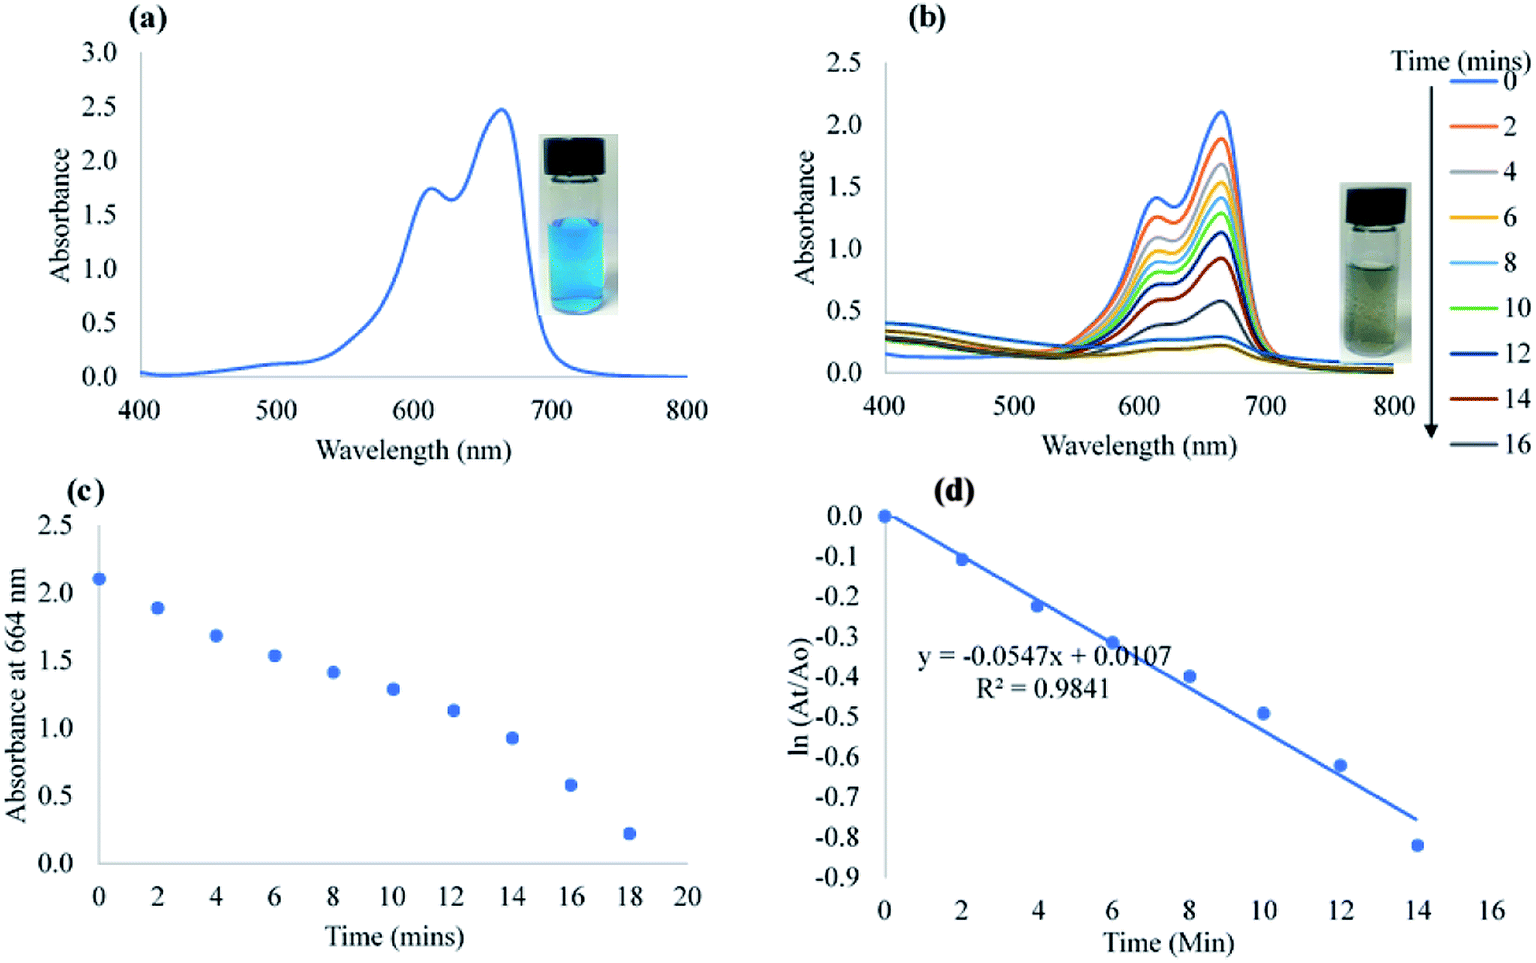 | ||
| Fig. 6 (a) UV-vis absorption plot of MB. Inset shows the photographic image (b) UV-vis absorption spectra of MB reduction with time. Inset shows the photographic image of the degradation product (c) plot of absorbance at 664 nm with time and (d) linear plot of ln(At/Ao) vs. time. | ||
The rate constant of CAPE-AgNPs catalytic degradation of MB 54.7 × 10⁻³ min−1, was compared with other reported works. As shown in Table 4, CAPE-AgNPs demonstrated a satisfactory degradation capacity.
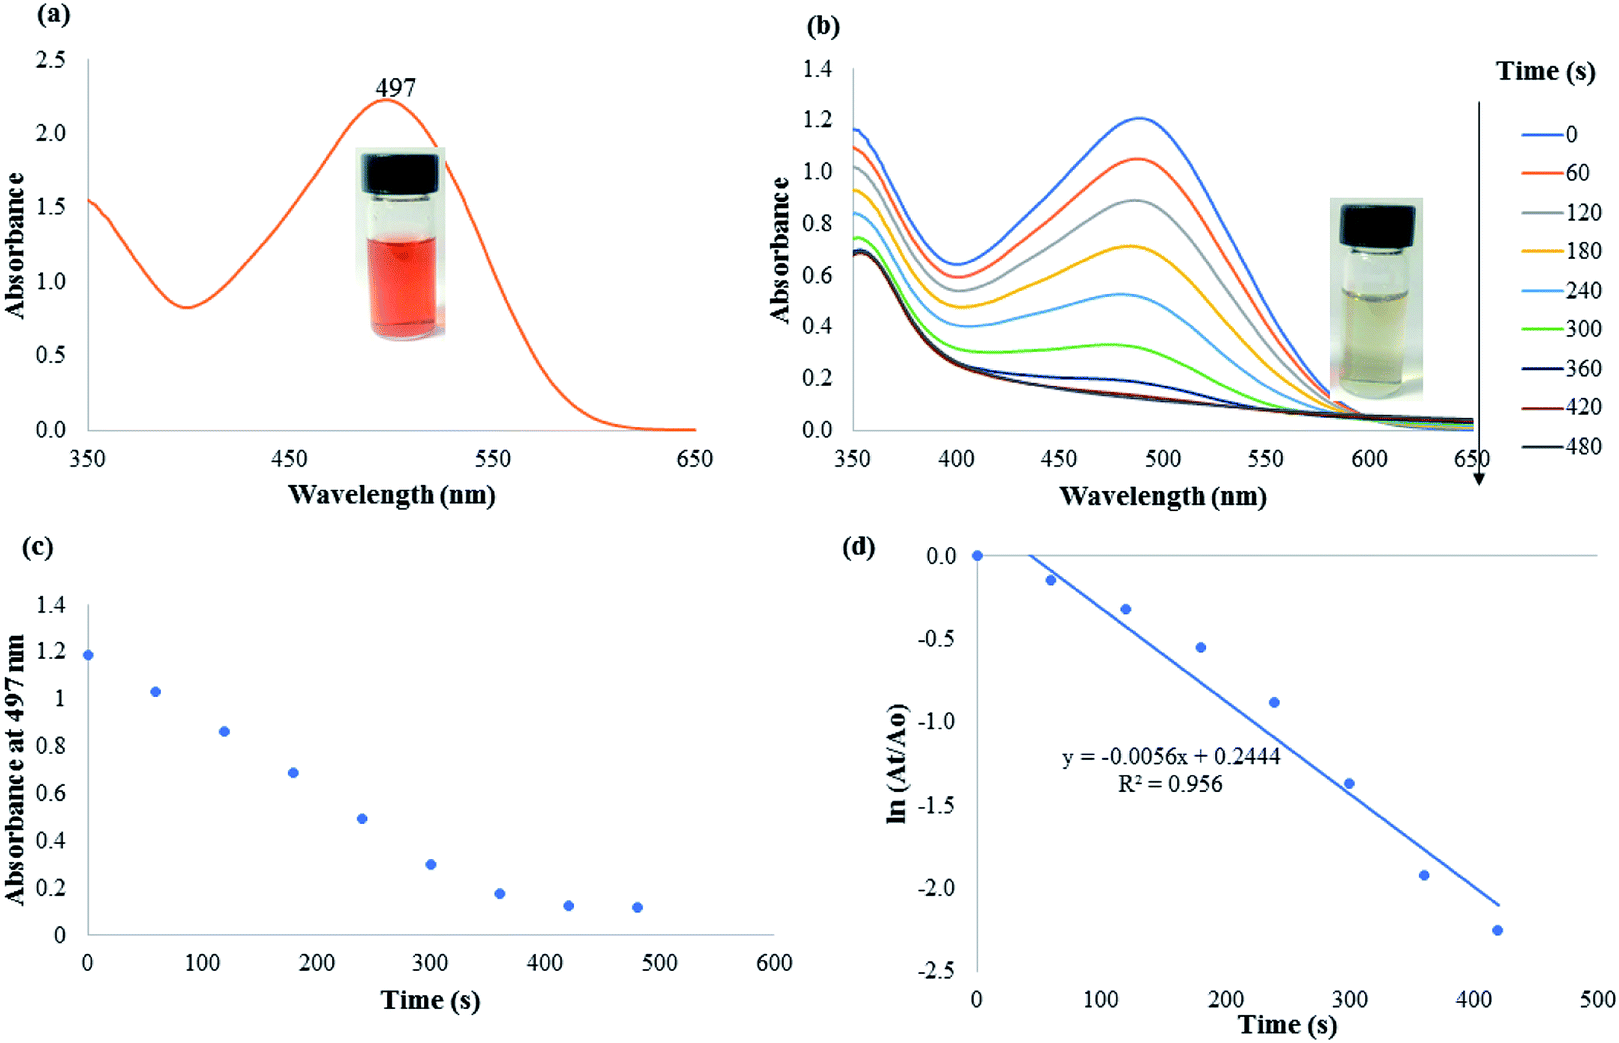 | ||
| Fig. 7 (a) UV-vis absorption plot of CR. Inset shows the photographic image (b) UV-vis absorption spectra of CR reduction with time. Inset shows the photographic image of the degradation product (c) plot of absorbance at 497 nm with time and (d) linear plot of ln(At/Ao) vs. time. | ||
Moreover, comparison of the reduction efficacy of CAPE-AgNPs towards MB and CR, though of same concentration in the reaction mixture must have stemmed from the differences in their structures. While CR is an anionic azo dye with a diazo group (–NN–), in their structure, MB on the other hand is a cationic dye, without an azo group. The diazo group is very prone to attack from reducing agents much more than other classes of dyes, hence the significant time differences in their reduction time.
4. Conclusion
In conclusion, we have synthesized a spherical and monodispersed biogenic AgNPs using C. asiatica phenolic extract (CAPE), tagged CAPE-AgNPs. An UHPLC-ESI-qTOF-MS analysis of the extracted CAPE sample confirmed the presence of copious amounts of different classes of phenolics and other bioactives. The as-synthesized AgNPs was subjected to several instrumental characterizations in order to probe and obtain information such as size, shape or morphology. CAPE-AgNPs of average diameters between 20–25 nm were obtained after optimizing synthesis conditions. CAPE-AgNPs was synthesized within 90 minutes at room temperature, thus avoiding energy consumption. The anti-bacterial activity of CAPE-AgNPs was investigated against some notable foodborne pathogenic bacterial strains. We further exploited the catalytic effectivity of CAPE-AgNPs against some notable environmental pollutants (4 NP, MB and CR). It was found that the catalytic capacity of CAPE-AgNPs was comparable to most of the works reported. This is as a result of the significantly high surface area of CAPE-AgNPs which facilitated facile adsorption of pollutants and the electron donor NaBH4 towards catalytic reduction. Thus, this work, offers a potential path towards wastewater treatment involving the transformation of toxic dye pollutants into less harmful components as well as control of pathogenic bacterial strains.Conflicts of interest
There are no conflicts to declare.References
- S. Hemmati, L. Mehrazin, H. Ghorban, S. H. Garakani, T. H. Mobaraki, P. Mohammadi and H. Veisi, Green synthesis of Pd nanoparticles supported on reduced graphene oxide, using the extract of Rosa canina fruit, and their use as recyclable and heterogeneous nanocatalysts for the degradation of dye pollutants in water, RSC Adv., 2018, 8, 21020–21028 RSC
.
- U. Kurtan, A. Baykal and H. Sözeri, Recyclable Fe3O4@Tween20@Ag Nanocatalyst for Catalytic Degradation of Azo Dyes, J. Inorg. Organomet. Polym., 2015, 25, 921–929 CrossRef CAS
- R. Saravanan, V. K. Gupta, T. Prakash, V. Narayanan and A. Stephen, Synthesis, characterization and photocatalytic activity of novel Hg doped ZnO nanorods prepared by thermal decomposition method, J. Mol. Liq., 2013, 178, 88–93 CrossRef CAS
- S. Chowdhury and P. Saha, Adsorption Kinetic Modeling of Safranin onto Rice Husk Biomatrix Using Pseudo-first- and Pseudo-second-order Kinetic Models: Comparison of Linear and Non-linear Methods, Clean: Soil, Air, Water, 2011, 39, 274–282 CAS
- Y. S. Al-Degs, M. I. El-Barghouthi, A. H. El-Sheikh and G. M. Walker, Effect of solution pH, ionic strength, and temperature on adsorption behavior of reactive dyes on activated carbon, Dyes Pigm., 2008, 77, 16–23 CrossRef CAS
- M. Atarod, M. Nasrollahzadeh and S. M. Sajadi, Green synthesis of Pd/RGO/Fe3O4 nanocomposite using Withania coagulans leaf extract and its application as magnetically separable and reusable catalyst for the reduction of 4-nitrophenol, J. Colloid Interface Sci., 2016, 465, 249–258 CrossRef CAS PubMed
- O. Lefebvre and R. Moletta, Treatment of organic pollution in industrial saline wastewater: a literature review, Water Res., 2006, 40, 3671–3682 CrossRef CAS PubMed
- I. Mohmood, C. B. Lopes, I. Lopes, I. Ahmad, A. C. Duarte and E. Pereira, Nanoscale materials and their use in water contaminants removal-a review, Environ. Sci. Pollut. Res. Int., 2013, 20, 1239–1260 CrossRef CAS
- B. Manu and S. Chaudhari, Anaerobic decolorisation of simulated textile wastewater containing azo dyes, Bioresour. Technol., 2002, 82, 225–231 CrossRef CAS PubMed
- R. Patel and S. Suresh, Decolourization of azo dyes using magnesium-palladium system, J. Hazard. Mater., 2006, 137, 1729–1741 CrossRef CAS PubMed
- L. Gomathi Devi, S. Girish Kumar, K. Mohan Reddy and C. Munikrishnappa, Photo degradation of methyl orange an azo dye by advanced Fenton process using zero valent metallic iron: influence of various reaction parameters and its degradation mechanism, J. Hazard. Mater., 2009, 164, 459–467 CrossRef CAS PubMed
- M. Nasrollahzadeh, S. M. Sajadi and A. Hatamifard, Waste chicken eggshell as a natural valuable resource and environmentally benign support for biosynthesis of catalytically active Cu/eggshell, Fe3O4/eggshell and Cu/Fe3O4/eggshell nanocomposites, Appl. Catal., B, 2016, 191, 209–227 CrossRef CAS
- R. Dai, J. Chen, J. Lin, S. Xiao, S. Chen and Y. Deng, Reduction of nitro phenols using nitroreductase from E. coli in the presence of NADH, J. Hazard. Mater., 2009, 170, 141–143 CrossRef CAS PubMed
- N. Mukwevho, R. Gusain, E. Fosso-Kankeu, N. Kumar, F. Waanders and S. S. Ray, Removal of naphthalene from simulated wastewater through adsorption-photodegradation by ZnO/Ag/GO nanocomposite, J. Ind. Eng. Chem. DOI:10.1016/j.jiec.2019.09.030
- P. Ghosh, G. Han, M. De, C. K. Kim and V. M. Rotello, Gold nanoparticles in delivery applications, Adv. Drug Delivery Rev., 2008, 60, 1307–1315 CrossRef CAS PubMed
- H. M. E. Azzazy, M. M. H. Mansour, T. M. Samir and R. Franco, Gold nanoparticles in the clinical laboratory: principles of preparation and applications, Clin. Chem. Lab. Med., 2011, 50, 193–209 Search PubMed
- R. G. Motsoeneng, I. Kortidis, S. S. Ray and D. E. Motaung, Designing SnO2 Nanostructure-Based Sensors with Tailored Selectivity toward Propanol and Ethanol Vapors, ACS Omega, 2019, 4, 13696–13709 CrossRef CAS
- M. Rafique, I. Sadaf, M. S. Rafique and M. B. Tahir, A review on green synthesis of silver nanoparticles and their applications, Artif. Cells, Nanomed., Biotechnol., 2017, 45, 1272–1291 CrossRef CAS PubMed
- S. H. Lee and B.-H. Jun, Silver Nanoparticles: Synthesis and Application for Nanomedicine, Int. J. Mol. Sci. DOI:10.3390/ijms20040865
- N. Savithramma, M. L. Rao and K. Rukmini, 2011.
- H. H. Lara, E. N. Garza-Treviño, L. Ixtepan-Turrent and D. K. Singh, Silver nanoparticles are broad-spectrum bactericidal and virucidal compounds, J. Nanobiotechnol., 2011, 9, 30 CrossRef CAS PubMed
- E. E. Elemike, D. C. Onwudiwe, A. C. Ekennia, R. C. Ehiri and N. J. Nnaji, Phytosynthesis of silver nanoparticles using aqueous leaf extracts of Lippia citriodora: Antimicrobial, larvicidal and photocatalytic evaluations, Mater. Sci. Eng., C, 2017, 75, 980–989 CrossRef CAS PubMed
- B. Ahmad, F. Shireen, S. Bashir, I. Khan and S. Azam, Green synthesis, characterisation and biological evaluation of AgNPs using Agave americana, Mentha spicata and Mangifera indica aqueous leaves extract, IET Nanobiotechnol., 2016, 10, 281–287 CrossRef PubMed
- S. Ramanathan, S. C. B. Gopinath, P. Anbu, T. Lakshmipriya, F. H. Kasim and C.-G. Lee, Eco-friendly synthesis of Solanum trilobatum extract-capped silver nanoparticles is compatible with good antimicrobial activities, J. Mol. Struct., 2018, 1160, 80–91 CrossRef CAS
- N. E. Gray, A. Alcazar Magana, P. Lak, K. M. Wright, J. Quinn, J. F. Stevens, C. S. Maier and A. Soumyanath, Centella asiatica: phytochemistry and mechanisms of neuroprotection and cognitive enhancement, Phytochem. Rev., 2018, 17, 161–194 CrossRef CAS PubMed
- F. N. Eze, L. Leelawatwattana and P. Prapunpoj, Structural Stabilization of Human Transthyretin by Centella asiatica (L.) Urban Extract: Implications for TTR Amyloidosis, Biomolecules DOI:10.3390/biom9040128
- P. K. Mukherjee, V. Kumar and P. J. Houghton, Screening of Indian medicinal plants for acetylcholinesterase inhibitory activity, Phytother. Res., 2007, 21, 1142–1145 CrossRef PubMed
- I. F. Benzie and J. J. Strain, The ferric reducing ability of plasma (FRAP) as a measure of ‘antioxidant power’: the FRAP assay, Anal. Biochem., 1996, 239, 70–76 CrossRef CAS PubMed
- L. Wang, F. Lu, Y. Liu, Y. Wu and Z. Wu, Photocatalytic degradation of organic dyes and antimicrobial activity of silver nanoparticles fast synthesized by flavonoids fraction of Psidium guajava L. leaves, J. Mol. Liq., 2018, 263, 187–192 CrossRef CAS
- M. P. Weinstein, Clinical and Laboratory Standards Institute, Performance standards for antimicrobial susceptibility testing, 2019 Search PubMed
- E. A. Terenteva, V. V. Apyari, S. G. Dmitrienko and Y. A. Zolotov, Formation of plasmonic silver nanoparticles by flavonoid reduction: A comparative study and application for determination of these substances, Spectrochim. Acta, Part A, 2015, 151, 89–95 CrossRef CAS
- S. Ahmed, M. Ahmad, B. L. Swami and S. Ikram, A review on plants extract mediated synthesis of silver nanoparticles for antimicrobial applications: A green expertise, J. Adv. Res., 2016, 7, 17–28 CrossRef CAS PubMed
- I. Fierascu, M. I. Georgiev, A. Ortan, R. C. Fierascu, S. M. Avramescu, D. Ionescu, A. Sutan, A. Brinzan and L. M. Ditu, Phyto-mediated metallic nano-architectures via Melissa officinalis L.: synthesis, characterization and biological properties, Sci. Rep., 2017, 7, 12428 CrossRef PubMed
- N. A. Sutan, D. S. Manolescu, I. Fierascu, A. M. Neblea, C. Sutan, C. Ducu, L. C. Soare, D. Negrea, S. M. Avramescu and R. C. Fierascu, Phytosynthesis of gold and silver nanoparticles enhance in vitro antioxidant and mitostimulatory activity of Aconitum toxicum Reichenb. rhizomes alcoholic extracts, Mater. Sci. Eng., C, 2018, 93, 746–758 CrossRef CAS PubMed
- S. Pirtarighat, M. Ghannadnia and S. Baghshahi, Biosynthesis of silver nanoparticles using Ocimum basilicum cultured under controlled
conditions for bactericidal application, Mater. Sci. Eng., C, 2019, 98, 250–255 CrossRef CAS PubMed
- D. Tripathi, A. Modi, G. Narayan and S. P. Rai, Green and cost effective synthesis of silver nanoparticles from endangered medicinal plant Withania coagulans and their potential biomedical properties, Mater. Sci. Eng., C, 2019, 100, 152–164 CrossRef CAS PubMed
- N. T. K. Thanh, N. Maclean and S. Mahiddine, Mechanisms of Nucleation and Growth of Nanoparticles in Solution, Chem. Rev., 2014, 114, 7610–7630 CrossRef CAS PubMed
- T. C. Dakal, A. Kumar, R. S. Majumdar and V. Yadav, Mechanistic Basis of Antimicrobial Actions of Silver Nanoparticles, Front. Microbiol. DOI:10.3389/fmicb.2016.01831
- M. H. Kahsay, D. RamaDevi, Y. P. Kumar, B. S. Mohan, A. Tadesse, G. Battu and K. Basavaiah, Synthesis of silver nanoparticles using aqueous extract of Dolichos lablab for reduction of 4-Nitrophenol, antimicrobial and anticancer activities, OpenNano, 2018, 3, 28–37 CrossRef
- E. O. Dare, C. O. Oseghale, A. H. Labulo, E. T. Adesuji, E. E. Elemike, J. C. Onwuka and J. T. Bamgbose, Green synthesis and growth kinetics of nanosilver under bio-diversified plant extracts influence, J. Nanostruct. Chem., 2015, 5, 85–94 CrossRef CAS
- J. Wells, O. Kazakova, O. Posth, U. Steinhoff, S. Petronis, L. K. Bogart, P. Southern, Q. Pankhurst and C. Johansson, Standardisation of magnetic nanoparticles in liquid suspension, J. Phys. D: Appl. Phys., 2017, 50, 383003 CrossRef
- K. N. Clayton, J. W. Salameh, S. T. Wereley and T. L. Kinzer-Ursem, Physical characterization of nanoparticle size and surface modification using particle scattering diffusometry, Biomicrofluidics, 2016, 10, 054107 CrossRef PubMed
- J. Hedberg, M. Lundin, T. Lowe, E. Blomberg, S. Wold and I. O. Wallinder, Interactions between surfactants and silver nanoparticles of varying charge, J. Colloid Interface Sci., 2012, 369, 193–201 CrossRef CAS PubMed
- E. Prabakaran and K. Pillay, One step synthesis of AgClNPs/PANI/D-dextrose nanocomposite by interfacial polymerization method and its catalytic and photocatalytic applications, J. Mol. Liq., 2019, 283, 6–29 CrossRef CAS
- M. Choi, K.-H. Shin and J. Jang, Plasmonic photocatalytic system using silver chloride/silver nanostructures under visible light, J. Colloid Interface Sci., 2010, 341, 83–87 CrossRef CAS PubMed
- Antimicrobial Activities of Centella asiatica Leaf and Root Extracts on Selected Pathogenic Micro-organisms, https://scialert.net/abstract/?doi=jms.2018.198.204, accessed 16 October 2019.
- N. Acero, A. Gradillas, M. Beltran, A. García and D. Muñoz Mingarro, Comparison of phenolic compounds profile and antioxidant properties of different sweet cherry (Prunus avium L.) varieties, Food Chem., 2019, 279, 260–271 CrossRef CAS PubMed
- O. S. Soyingbe, N. I. Mongalo and T. J. Makhafola, In vitro antibacterial and cytotoxic activity of leaf extracts of Centella asiatica (L.) Urb, Warburgia salutaris (Bertol. F.) Chiov and Curtisia dentata (Burm. F.) C.A.Sm - medicinal plants used in South Africa, BMC Complementary Altern. Med. DOI:10.1186/s12906-018-2378-3
- J. Du, Z. Hu, Z. Yu, H. Li, J. Pan, D. Zhao and Y. Bai, Antibacterial activity of a novel Forsythia suspensa fruit mediated green silver nanoparticles against food-borne pathogens and mechanisms investigation, Mater. Sci. Eng., C, 2019, 102, 247–253 CrossRef CAS PubMed
- A. K. Potbhare, R. G. Chaudhary, P. B. Chouke, S. Yerpude, A. Mondal, V. N. Sonkusare, A. R. Rai and H. D. Juneja, Phytosynthesis of nearly monodisperse CuO nanospheres using Phyllanthus reticulatus/Conyza bonariensis and its antioxidant/antibacterial assays, Mater. Sci. Eng., C, 2019, 99, 783–793 CrossRef CAS PubMed
- H. Yin, Y. Zhou, S. Ai, X. Liu, L. Zhu and L. Lu, Electrochemical oxidative determination of 4-nitrophenol based on a glassy carbon electrode modified with a hydroxyapatite nanopowder, Microchim. Acta, 2010, 169, 87–92 CrossRef CAS
- P. S. Rajegaonkar, B. A. Deshpande, M. S. More, S. S. Waghmare, V. V. Sangawe, A. Inamdar, M. D. Shirsat and N. N. Adhapure, Catalytic reduction of p-nitrophenol and methylene blue by microbiologically synthesized silver nanoparticles, Mater. Sci. Eng., C, 2018, 93, 623–629 CrossRef CAS PubMed
- H. Veisi, S. B. Moradi, A. Saljooqi and P. Safarimehr, Silver nanoparticle-decorated on tannic acid-modified magnetite nanoparticles (Fe3O4@TA/Ag) for highly active catalytic reduction of 4-nitrophenol, Rhodamine B and Methylene blue, Mater. Sci. Eng., C, 2019, 100, 445–452 CrossRef CAS PubMed
- Y. Lin, Y. Qiao, Y. Wang, Y. Yan and J. Huang, Self-assembled laminated nanoribbon-directed synthesis of noble metallic nanoparticle-decorated silica nanotubes and their catalytic applications, J. Mater. Chem., 2012, 22, 18314–18320 RSC
- J. Saha, A. Begum, A. Mukherjee and S. Kumar, A novel green synthesis of silver nanoparticles and their catalytic action in reduction of Methylene Blue dye, Sustainable Environ. Res., 2017, 27, 245–250 CrossRef CAS
- U. P. Azad, V. Ganesan and M. Pal, Catalytic reduction of organic dyes at gold nanoparticles impregnated silica materials: influence of functional groups and surfactants, J. Nanopart. Res., 2011, 13, 3951–3959 CrossRef CAS
- Y. Wei, X. Huang, J. Wang, H. Yu, X. Zhao and D. Cheng, Synthesis of bifunctional non-noble monolithic catalyst Co-W-P/carbon cloth for sodium borohydride hydrolysis and reduction of 4-nitrophenol, Int. J. Hydrogen Energy, 2017, 42, 25860–25868 CrossRef CAS
- Y. Qu, X. Li, S. Lian, C. Dai, Z. Jv, B. Zhao and H. Zhou, Biosynthesis of gold nanoparticles using fungus Trichoderma sp. WL-Go and their catalysis in degradation of aromatic pollutants, IET Nanobiotechnol., 2019, 13, 12–17 CrossRef
- J.-G. You, C. Shanmugam, Y.-W. Liu, C.-J. Yu and W.-L. Tseng, Boosting catalytic activity of metal nanoparticles for 4-nitrophenol reduction: Modification of metal naoparticles with poly(diallyldimethylammonium chloride), J. Hazard. Mater., 2017, 324, 420–427 CrossRef CAS PubMed
- M. Ismail, M. I. Khan, S. B. Khan, M. A. Khan, K. Akhtar and A. M. Asiri, Green synthesis of plant supported CuAg and CuNi bimetallic nanoparticles in the reduction of nitrophenols and organic dyes for water treatment, J. Mol. Liq., 2018, 260, 78–91 CrossRef CAS
- K. Jyoti and A. Singh, Green synthesis of nanostructured silver particles and their catalytic application in dye degradation, J. Genet. Eng. Biotechnol., 2016, 14, 311–317 CrossRef PubMed
- C. Saravanan, R. Rajesh, T. Kaviarasan, K. Muthukumar, D. Kavitake and P. H. Shetty, Synthesis of silver nanoparticles using bacterial exopolysaccharide and its application for degradation of azo-dyes, Biotechnology Reports, 2017, 15, 33–40 CrossRef PubMed
- C. Umamaheswari, A. Lakshmanan and N. S. Nagarajan, Green synthesis, characterization and catalytic degradation studies of gold nanoparticles against congo red and methyl orange, J. Photochem. Photobiol., B, 2018, 178, 33–39 CrossRef CAS
| This journal is © The Royal Society of Chemistry 2019 |