 Open Access Article
Largely enhanced thermal conductivity and thermal stability of ultra high molecular weight polyethylene composites via BN/CNT synergy†
Yiyou Guoa,
Changlin Caoa,
Fubin Luoa,
Baoquan Huang*a,
Liren Xiaoa,
Qingrong Qian *a and
Qinghua Chenab
aEngineering Research Center of Polymer Green Recycling of Ministry Education, Fujian Key Laboratory of Pollution Control & Resource Reuse, College of Environmental Science and Engineering, Fujian Normal University, Fuzhou 350007, China. E-mail: qbh811@fjnu.edu.cn; qrqian@fjnu.edu.cn
bFujian Normal University, Fuqing Branch, Fuzhou 350300, China
First published on 9th December 2019
Abstract
In recent years, thermally conductive polymer-based composites have garnered significant attention due to their light weight and easy formation process. In this work, the thermal conductivity of ultra high molecular weight polyethylene (UPE) composites was improved through construction of a hybrid filler network of boron nitride sheets (BNs) and carbon nanotubes (CNTs) in the matrix via hot compression. The morphology, UPE aggregate structure, thermal conductivity, heat dissipation capacity and thermal stability of the UPE composites were investigated. The thermal conduction mechanism of the UPE composites was explored through simulations with Agari's semi-empirical formula. The results showed that the thermal conductivity of the UPE composite with 40 wt% BNs and 7 wt% CNTs was 2.38 W m−1 K−1, which was 495% higher than that of pure UPE, showing a synergistic effect between BNs and CNTs. The simulations with Agari's semi-empirical simulation suggested that increasing the CNT content contributed to synergistically assist BNs to form a better continuous and effective hybrid filler thermal network, thereby reducing phonon scattering and thermal resistance between BNs. In addition, UPE composites doped with BNs and CNTs presented better heat dissipation capacity and higher thermal stability as compared to that of pure UPE.
1. Introduction
With the rapid progress of miniaturization and weight reduction of electronic components1–3 and thermal management materials,4–6 thermally conductive polymer-based composites have garnered significant attention due to their light weight and easy formation process. However, the low intrinsic thermal conductivity of polymers severely restricts the utilization of polymers in electronic equipment.Compared to manipulating polymer chain alignment to form specific orientations7–9 and yield high crystallinity10,11 in the matrix to obtain high thermal conductivity, doping fillers with high thermal conductivity into polymers is a simple and effective way to improve the thermal conductivity of composites. However, the type,12–15 dimensions,16–19 size20,21 and concentration22,23 of the filler are factors that play significant roles in the thermal conductivity of composites. In addition to the above factors, two other important factors are the filler arrangement in the polymer matrix,24–27 which forms thermal conduction pathways, and the interfacial thermal resistance caused by the poor dispersion and weak interaction of the filler.28–30 Currently, the filler arrangement resulting from a segregated structure31–34 in a polymer matrix is a typical method of constructing a continuous thermal conduction network. Adjusting the filler orientation35–38 in a polymer matrix is a special way to gain a better filler arrangement, resulting in higher thermal conductivity. In terms of filler orientation, novel two-dimensional (2D) materials39–41 with unique atomic configurations and singular properties have attracted attention. Meanwhile, this finding has drawn attention to increasing the thermal conductivity of composites by adding hybrid fillers to reduce the interfacial thermal resistance inside composites.42–44 Some researchers45 have demonstrated the synergistic effect of carbon nanotubes (CNTs) and graphene nanoplatelets (GNPs) via constructing a hybrid filler thermal conduction network in polyvinylidene fluoride (PVDF) composites. Other researchers46 have constructed and optimized the thermal conduction network of hybrid fillers by regulating the mass ratio between boron nitride (BN) and aluminium nitride (AlN), confirming the synergistic effect of zero-dimensional and two-dimensional fillers for generating large thermal conductivity enhancements. Another study47 adopted GNPs to replace BN for constructing thermal conduction channels, thereby increasing the thermal conductivity of polyethylene glycol (PEG) composites. Hence, these composites with hybrid thermally conductive fillers could offer higher thermal conductivity at lower filler concentrations, which may be better for use in electronic components and thermal management materials.
Although constructing hybrid filler thermal conduction networks is very effective for obtaining composites with high thermal conductivity, there are few reports about the thermal conduction mechanism of hybrid fillers in the construction of thermally conductive networks. In this work, ultra high molecular weight polyethylene (UPE) is chosen as the matrix because UPE has better performance than other thermoplastic polymers. We hope to prepare thermally conductive UPE composite materials to broaden the application field of thermally conductive polymer-based composites. Then, the hybrid filler thermal conduction network is constructed by introducing two-dimensional sheet-like BN and one-dimensional CNTs. The thermal conduction mechanism of the hybrid filler network is explored via scanning electron microscopy (SEM) morphology observations, thermal conductivity measurements and Agari's semi-empirical equation simulations. In addition, the effects of the hybrid filler network on crystallization, heat dissipation, and thermal stability are also discussed.
2. Materials and methods
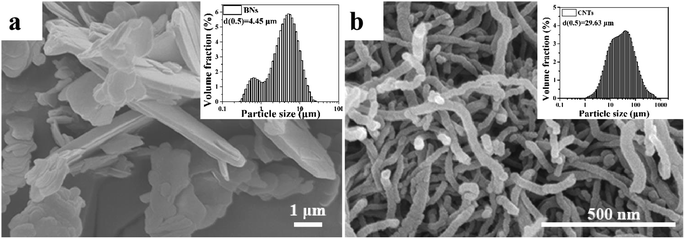
The average diameter of the UPE powders (Mv = 2.5 × 10⁶ g mol−1) was 150 μm, which were supplied by LianLe Chemical Co., Ltd. (Shanghai, China). The average diameter and density of the hexagonal boron nitride sheets (BNs) was 4.45 μm (Fig. 1) and 2.25 g cm−3, respectively, which were obtained from Yingkou Tianyuan Chemical Research Institute Co., Ltd. (Liaoning, China). Industrial grade multi-walled CNTs with an average diameter of 20–40 nm and an average length of 29.43 μm (Fig. 1) and a true density of 2.1 g cm−3 were purchased from Nanjing XFNANO Materials Tech Co., Ltd. (Nanjing, China).2.1. Preparation of the UPE composites
BN microsheets were first dried in an oven at 80 °C for 12 h. UPE powder was then mixed with a certain number of BN microsheets in a high-speed mixing machine for 1 min. During high-speed mixing, the UPE and BN surfaces were negatively charged and adsorbed on the inner wall of the device due to friction between the UPE, BNs and the metal inner wall of the equipment. Then, a certain number of CNTs was added to the mixing machine, followed by another 1 min of mixing. At this time, the CNTs had adsorbed on the surface of the UPE and BNs due to electrostatic adsorption. Next, the mixtures were diverted to a mould for hot pressing at 220 °C and 17.6 MPa for 5 min after preheating for 20 min. The resulting UPE composites were cold compression moulded for 40 min. The sample notation and the corresponding compositions are listed in Table 1.| Sample | UPE (wt%) | BN (wt%) | CNT (wt%) |
|---|---|---|---|
| a x or y represents the concentration of BNs or CNTs in the composites. | |||
| UPE | 100 | 0 | 0 |
| UPE/xBN | 60–99 | 1–40 | 0 |
| UPE/yCNT | 60–99 | 0 | 1–40 |
| UPE/xBN/yCNT | 50–98 | 1–40 | 1–10 |
2.2. Characterization
A scanning electron microscope (JSM-7500F, JEOL, Japan) was used to observe the morphology of the samples, wherein the SEM observations were performed at an acceleration voltage of 5 kV. The samples were gold sputtered for 4 min before SEM examination.The weight loss of samples was obtained by a thermal gravimetric analyser (Q50, TA) operated over a range from 40–600 °C at a heating rate of 10 °C min−1 under a nitrogen atmosphere.
The crystalline properties of the samples were evaluated with a differential scanning calorimeter (Q20, TA). The samples were heated to 200 °C first, cooled to 40 °C and then reheated to 200 °C at a rate of 10 °C min−1. The crystallinity (Xc) was determined according to the following equation:
 | (1) |
The thermal conductivity was measured with a hot-wire thermal conductivity instrument (Xiatech TC3000E, China) in accordance with ASTM D5930. Before the thermal conductivity measurement, the hot wire was placed between two of the same samples with thicknesses of 3 mm, followed by applying a certain pressure on top of the stacked samples to promote better contact between the hot wire and the samples.
The real-time temperature of the UPE composites was monitored with a thermal camera (MAG62, Shanghai Juge Electronic Technology Co., Ltd.), and thermal images were obtained during the cooling procedure.
The filler size distribution was determined with a laser particle size analyser (Mastersizer 2000, UK).
3. Results and discussion
3.1. Morphology of the UPE/BN composites
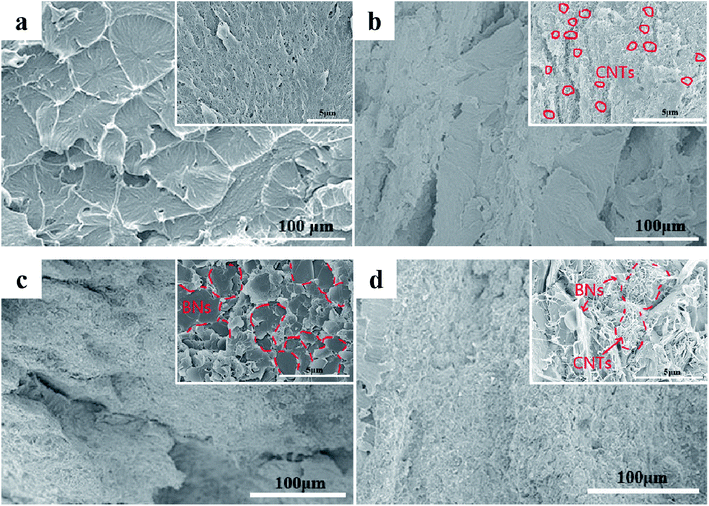
The Fig. 2 shows the SEM morphologies of the cryo-fracture surfaces of UPE composites with various concentrations of BNs or CNTs. As illustrated in Fig. 2a and b, a clearly porous structure is found for the cryo-fracture surface of pure UPE. The porous structure disappeared after introducing a small concentration of CNTs. However, a small CNT concentration cannot form a complete segregated structure in the UPE matrix via hot compression. With the addition of BNs up to 40 wt%, most of the BN microflakes overlap each other to form a continuous pathway (Fig. 2c). In addition, Fig. 2d demonstrates that a small number of CNTs appear in the gap between the BN microchips, effectively assisting the BNs to form a better continuous path. The related EDS morphologies of the UPE/40BN and UPE/40BN/7CNT composites are presented in Fig. S1.† With the introduction of CNTs, the EDS results show that the CNTs exist between BNs. This also indicate that the CNTs play a bridge role in the interlayer of BNs. Moreover, a similar effect can also be found from TEM image (Fig. S2†) could further confirm the bridging of BNs by the flexible one dimension fillers (CNTs).3.2. Crystallization behaviour of the UPE composites
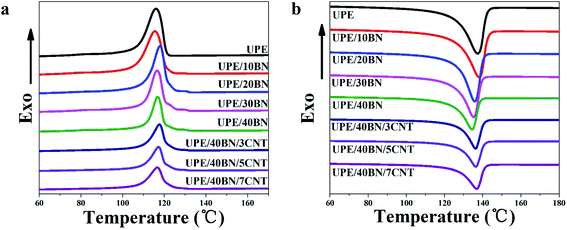
The aggregate structure of composites is one of the factors affecting thermal conductivity. Herein, differential scanning calorimetry (DSC) was used to study the melting peak temperature, crystallization peak temperature and relative crystallinity of the UPE composites. The melting curves and crystallization curves are shown in Fig. 3, and the DSC thermal parameters are summarized in Tables 2 and S1.† Fig. 3 shows that the melting peak temperatures and crystallization temperatures of the composites fluctuate slightly in the range of 3 °C as the BN or CNT concentration increases. Table 2 shows that as the BNs content increases, the crystallinity of the UPE/BN composites first increases and then decreases. This behaviour indicates that in the case of a certain concentration of BNs, BNs play a good role in heterogeneous nucleation in the UPE matrix, resulting in improved crystallinity. Then, further adding BNs restricts the movement of UPE chains, hindering the orderly arrangement of molecular chains during the cooling process, resulting in a decreased crystallinity. Furthermore, when the content of BNs is fixed at 40 wt%, the introduction of CNTs leads to a further decrease in crystallinity. A small CNT concentration could contribute to the improvement of the UPE/CNT composites (Table S1†).49 This finding indicates that when the content of BNs is high, further doping CNTs only reduces the crystallinity of the UPE/BN/CNT composites due to the restriction of UPE chain motion.| Sample | Tm (°C) | ΔHm (J g−1) | Tc (°C) | ΔHc (J g−1) | Xc (%) |
|---|---|---|---|---|---|
| UPE | 137.4 | 159.4 | 116.0 | 159.9 | 54.83 |
| UPE/10BN | 138.1 | 155.0 | 115.5 | 153.8 | 59.39 |
| UPE/20BN | 135.8 | 141.3 | 117.9 | 136.6 | 60.91 |
| UPE/30BN | 135.3 | 120.9 | 116.6 | 116.2 | 59.56 |
| UPE/40BN | 134.4 | 91.3 | 116.8 | 88.3 | 52.47 |
| UPE/40BN/3CNT | 136.2 | 81.5 | 117.7 | 77.5 | 47.27 |
| UPE/40BN/5CNT | 136.4 | 74.1 | 117.2 | 70.9 | 46.48 |
| UPE/40BN/7CNT | 136.8 | 71.2 | 116.6 | 69.1 | 46.31 |
3.3. Thermal stability of the UPE/BN/CNT composites
TGA can be used to characterize the thermal stability of the UPE composites from room temperature to 600 °C under a nitrogen atmosphere. The TGA and DTA curves are presented in Fig. 4, and the relevant thermal data are listed in Tables 3 and S2.† These curves show that there is only a single thermal decomposition process of the UPE composites from 400 °C to 500 °C. This finding indicates that the addition of BNs or CNTs has no effect on the thermal decomposition mechanism. The 5% weight loss temperature (T5) of pure UPE is 431.7 °C. The T5 of the UPE/40BN composite is 459.4 °C, which is 27.7 °C higher than that of pure UPE, showing that the introduction of BNs helps to improve the T5 of composites due to the high thermal conductivity of BNs.50 And these BNs efficiently hinder the diffusion of the volatile decomposition part.51 Furthermore, the T5 of the UPE/BN composites doped with 3 wt% CNTs was further increased. The T5 of the UPE/40BN/3CNT composite is 458.2 °C, which is 26.5 °C higher than that of pure UPE. Moreover, when the fixed BN content is 40 wt%, the T5 of the UPE/40BN/7CNT composite is 464.1 °C, which is 32.4 °C higher than that of pure UPE. To better understand the role of thermal decomposition temperature in thermal stability, some researchers52–54 have adopted the heat resistance index (THRI) to comprehensively characterize the thermal stability of composites according to the T5 and T30 of the composites. The higher the THRI is, the better the thermal stability. In the case of the same BN content, the THRI values of the composites doped with 3 wt% CNTs are higher than those of the samples without CNTs (Table S2†). Moreover, when the content of BNs is fixed at 40 wt%, the T5 is further increased by adding CNTs. A possible reason for this phenomenon is that the introduction of CNTs leads to the formation of more efficient hybrid filler conduction pathways in the matrix, which efficiently hinders the diffusion of the volatile decomposition part.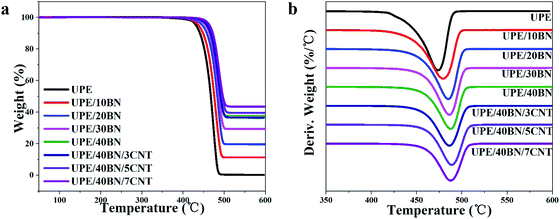 | ||
| Fig. 4 (a) Thermogravimetric analysis (TGA) and (b) differential thermal analysis (DTA) curves of the UPE composites. | ||
| Sample | T5 (°C) | T30 (°C) | T50 (°C) | Tmaxa (°C) | THRIb (°C) |
|---|---|---|---|---|---|
| a Decomposition temperature at the maximum rate of weight loss.b THRI = 0.49[T5 + 0.6(T30 − T5)], T5 and T30 are the 5% and 30% weight loss temperatures, respectively. | |||||
| UPE | 431.7 | 458.6 | 467.4 | 473.6 | 219.4 |
| UPE/10BN | 437.8 | 466.7 | 475.9 | 479.2 | 223.0 |
| UPE/20BN | 447.0 | 474.6 | 483.3 | 485.0 | 227.2 |
| UPE/30BN | 454.7 | 479.2 | 487.6 | 486.2 | 230.0 |
| UPE/40BN | 459.4 | 482.5 | 491.6 | 487.7 | 231.9 |
| UPE/40BN/3CNT | 458.2 | 481.6 | 491.2 | 486.1 | 231.4 |
| UPE/40BN/5CNT | 464.6 | 485.7 | 495.4 | 488.8 | 233.9 |
| UPE/40BN/7CNT | 464.1 | 485.7 | 496.8 | 487.5 | 233.8 |
3.4. Heat dissipation behaviour
The sample was placed on a hot plate for 30 min to ensure that the inside of the sample reached 75 °C. Then, the heated samples were transferred quickly to a copper platform. At the same time, the temperature change curves and infrared images were recorded with an infrared camera to investigate the heat dissipation capacity of the composites. Fig. 5a and b shows that pure UPE takes a substantial amount of time to cool from 75 °C to 40 °C, showing a relatively low heat dissipation speed. UPE/7CNT takes as much time as pure UPE to cool during the same temperature range. This finding shows that 7 wt% CNTs rarely contribute to the increase in the heat dissipation speed of UPE/7CNTs. Moreover, it could be observed that the decline in the surface temperature follows the following sequence: UPE/40BN/7CNT > UPE/40BN > UPE/7CNT ≈ pure UPE. Note that UPE/40BN/7CNT exhibits a faster heat dissipation speed than UPE/40BN, UPE/7CNT and pure UPE. This finding indicates that the existence of CNTs synergistically enhances the heat dissipation capability of composites.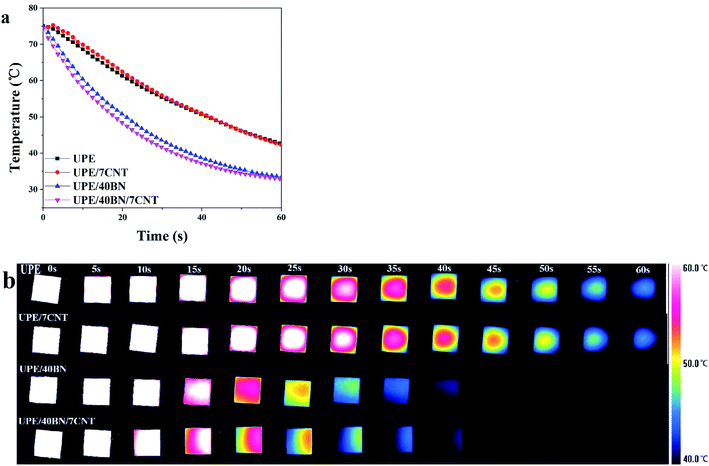 | ||
| Fig. 5 (a) Temperature profiles of the UPE composite as a function of cooling time and (b) thermal infrared images of the UPE composites during the cooling process. | ||
3.5. Thermal conductivity of the UPE/BN/CNT composites
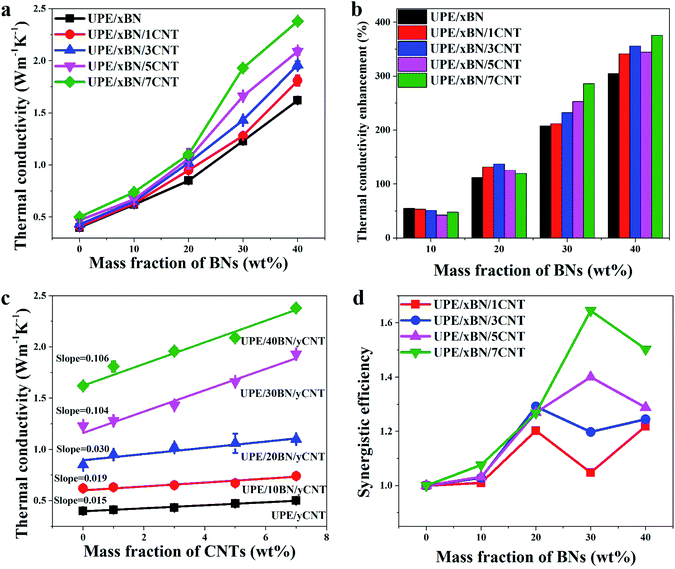
Fig. 6a and b presents the thermal conductivity and enhancement of the UPE composites with various contents of BNs. The thermal conductivity enhancement ratio (TCER) of the UPE/BN/CNT composites shown in Fig. 6b could be defined as follows:
 | (2) |
The thermal conductivity of pure UPE is only 0.4 W m−1 K−1. The introduction of BNs could enhance the thermal conductivity of the UPE composites.55 With the addition of 40 wt% BNs, the mechanical properties of the UPE composites decreased (Fig. S4 and Table S3†). But the thermal conductivity of the UPE/40BN, UPE/40BN/1CNT, UPE/40BN/3CNT, UPE/40BN/5CNT and UPE/40BN/7CNT samples reached 1.62, 1.81, 1.96, 2.09 and 2.38 W m−1 K−1, respectively, which are 341.46%, 355.81%, 344.68% and 376% higher than that of pure UPE, UPE/1CNT, UPE/3CNT, UPE/5CNT and UPE/7CNT composites, respectively. The thermal conductivity of the UPE/40BN/7CNT samples is 495% higher than that of pure UPE, which is a large thermal conductivity enhancement for the UPE composites (Fig. S5†). This finding indicates that the increases in the thermal conductivity of the UPE samples is quite dependent on the concentration of BNs, possibly because BNs form a filler network in the UPE matrix. This reason will cause thermal energy to rapidly transfer along the filler network, further resulting in great improvement in the thermal conductivity of the UPE composites.
However, different CNT contents can improve the thermal conductivity of composites to different degrees. To further understand the role of CNTs in UPE composites, the thermal conductivity of the composites can be drawn in Fig. 6c. As the CNT content increases, the thermal conductivity of the UPE/7CNT samples was only 0.5 W m−1 K−1, which is a limited improvement in the thermal conductivity of the UPE composites. The slope of the thermal conductivity curves increases from 0.015 without the addition of BNs to 0.106 with the incorporation of 40 wt% BNs. This finding indicates that the effect of CNTs on the improvement in thermal conductivity is limited without BNs. However, as the BN content increases, the effect of adding CNTs on improving the thermal conductivity of the UPE composites is becoming increasingly obvious.
To obtain a better sense of whether this effect is positive or negative, the synergistic efficiency (f) is introduced and defined as follows:
 | (3) |
Fig. 6d shows that the f values of all UPE/BN/CNT composites are higher than 1, which suggests that there is a synergistic effect between BNs and CNTs. Moreover, under any BN content, the higher the content of CNTs is, the higher the value of f, indicating a stronger synergistic effect between BNs and CNTs. However, different CNT contents have different synergistic effects on different BN contents. For instance, when the CNT content is 1 wt% or 3 wt%, the maximum value of f appears when the BN content is 20 wt%. When the CNT content is 5 wt% or 7 wt%, the maximum value of f when the BN content is 30 wt%. Obviously, it is essential to understand why the thermal conductivity of the UPE/BN/CNT composites could be improved by doping a small number of CNTs. This behaviour will be discussed in the following section.
3.6. Thermal model simulation
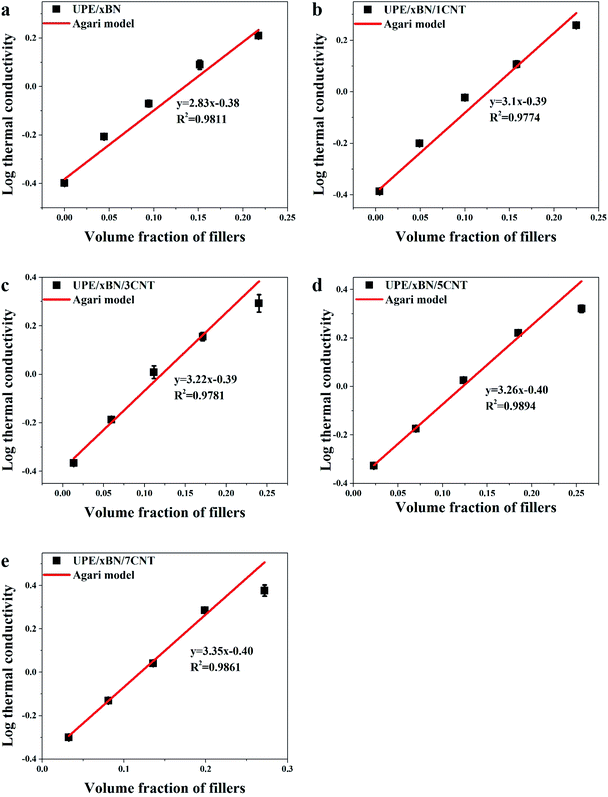
To better understand the construction of the thermal conduction channels in the composites, the experimental data were fitted with Agari's semi-empirical model,56–58 which could be used to characterize the connection mechanisms in UPE composites. The logarithmic equation of Agari is shown as follows:
log![[thin space (1/6-em)]](https://www.rsc.org/images/entities/char_2009.gif) λ = V(X2C2 λ = V(X2C2![[thin space (1/6-em)]](https://www.rsc.org/images/entities/char_2009.gif) log log![[thin space (1/6-em)]](https://www.rsc.org/images/entities/char_2009.gif) λ2 + X3C3 λ2 + X3C3![[thin space (1/6-em)]](https://www.rsc.org/images/entities/char_2009.gif) log log![[thin space (1/6-em)]](https://www.rsc.org/images/entities/char_2009.gif) λ3) + (1 − V)log(λ1C1) λ3) + (1 − V)log(λ1C1)
| (4) |
Fig. 7 shows the logarithmic values of thermal conductivities as a function of the total volume fraction of fillers. The correlation coefficients obtained by fitting the experimental data of the UPE/xBN, UPE/xBN/1CNT, UPE/xBN/3CNT, UPE/xBN/5CNT and UPE/xBN/7CNT samples are 0.9811, 0.9774, 0.9781, 0.9894 and 0.9861, respectively. Herein, λ2 is 290 W m−1 K−1, λ3 is 3000 W m−1 K−1 (ref. 59) and λ1 is 0.40 W m−1 K−1. The results calculated with eqn (4) are shown in Table 4. The results shows that the parameter C2 of the UPE/xBN composites is 1.04. The parameters C2 and C3 of the UPE/xBN/1CNT composites are 1.10 and 0.78, respectively, which are higher that the C2 of the UPE/xBN composites. This finding suggests that the introduction of a small number of CNTs decreases the thermal resistance of the UPE/xBN/1CNT composites,58 contributing to phonon transmission and forming an effective continuous thermal conduction path in the UPE composites, thereby increasing the thermal conductivity of the composites. Moreover, with increasing CNT concentration, the parameters C2 and C3 of the UPE/xBN/7CNT composites are 1.19 and 0.85, respectively, showing the general trend of sustained growth. This finding indicates that CNTs synergistically assist BNs to form a better hybrid filler thermal network, which effectively reduces the thermal resistance among the fillers and improves the thermal conductivity of the composites.
| Sample | C1 | C2 | C3 |
|---|---|---|---|
| UPE/xBN | 0.99 | 1.04 | |
| UPE/xBN/1CNT | 1.01 | 1.10 | 0.78 |
| UPE/xBN/3CNT | 1.02 | 1.15 | 0.81 |
| UPE/xBN/5CNT | 0.99 | 1.16 | 0.82 |
| UPE/xBN/7CNT | 0.99 | 1.19 | 0.85 |
3.7. Mechanism of thermal conductivity enhancement
Fig. 8 shows the thermally conductive enhancement mechanism according to the results obtained by thermal conductivity measurement and morphological characterization. As depicted above, there are several factors determining the thermal conductivity of the UPE composites, which mainly include the aggregate structure of the matrix, filler type, filler content, filler dispersion and thermal resistance between fillers. In this work, we mainly study the hybrid filler network constructed by BNs and CNTs and their synergistic effects on UPE composites.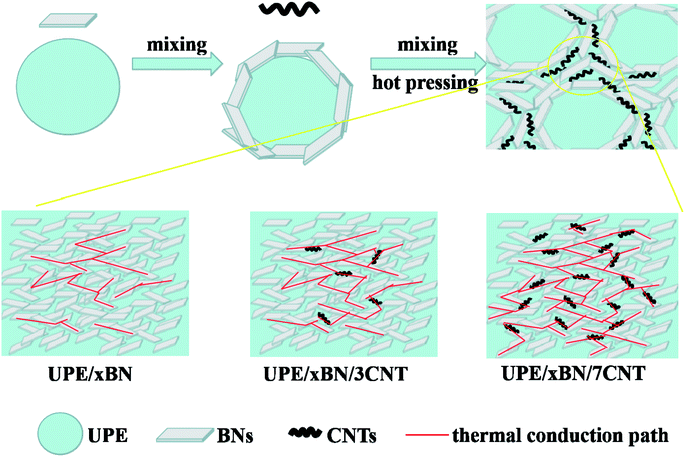 | ||
| Fig. 8 Schematic diagram of preparation process and heat transport pathways of UPE/BN/CNT composites. | ||
When only a small number of CNTs is added, there is long distance between BNs, which causes strong phonon scattering among BNs, resulting in limited improvement of thermal conductivity of UPE/BN composites. At this time, doping CNTs that play a role as bridges shortens the distance among the BNs but still cannot form a continuous thermally conductive hybrid filler network. Similarly, for the UPE/10BN/3CNT and UPE/10BN/7CNT composite, the improvement in the thermal conductivity is limited, which is just 4.84% and 19.35% higher than that of UPE/10BN, respectively. When a large number of BNs exists, the role of flexible one-dimensional filler (CNTs) bridging two-dimensional filler (BNs) is significantly enhanced,60 resulting in the formation of a better continuous and effective hybrid filler thermal network.46,61 For example, the thermal conductivity of UPE/40BN/3CNT (1.96 W m−1 K−1) and UPE/40BN/7CNT (2.38 W m−1 K−1) is 20.99% and 46.91% higher than that of UPE/40BN, respectively. This obtained result indicates that the effectiveness of CNTs as bridges depends on the content of BNs in the UPE matrix. The higher the BN content is, the more obvious the effect. In addition, increasing the CNT content contributes to reducing the gap and thermal resistance between BNs, improving the heat transport among BNs, which contributes to the formation of a better continuous and effective hybrid filler thermal network.
In short, the introduction of CNTs synergistically assists BNs to form a better continuous and effective hybrid filler thermal network, which leads to a significant increase in UPE/BN/CNT composites. This hybrid filler thermal network also greatly improves the heat dissipation capacity and thermal stability of the composite.
4. Conclusions
In summary, UPE composites doped with BNs and CNTs were prepared via hot compression. A small number of CNTs cannot form a continuous thermal conduction path in the UPE matrix, resulting in low thermal conductivity of UPE/CNT composites. When the BN content increases, the SEM morphology shows that CNTs exist as bridges between BNs, promoting BNs to form a better continuous thermal conduction channel, leading to high thermal conductivity in the UPE composites. When the BN content is 40 wt%, further doping with 7 wt% CNTs further improves the thermal conductivity of UPE composites. The thermal conductivity of UPE/40BN/7CNT reaches 2.38 W m−1 K−1, which is 376% and 495% higher than that of UPE/7CNT and UPE samples, respectively. Meantime, the C2 and C3 of the UPE/xBN/7CNT composites calculated by Agari's semi-empirical equation are higher than those of the UPE/xBN/1CNT composites. This result shows that the introduction of CNTs synergistically assists BNs to form a better continuous and effective hybrid filler thermal network, reducing phonon scattering and thermal resistance between BNs, which possibly can be the main reason for the improvement in the thermal conductivity of the composite. Moreover, UPE composites doped with BNs and CNTs exhibits a better heat dissipation capacity than pure UPE or UPE composites with single filler. In addition, the T5 of UPE/40BN/7CNT is 464.1 °C, which is 32.4 °C and 4.7 °C higher than that of the pure UPE and UPE/40BN samples, respectively. This finding indicates that the construction of such a hybrid filler thermal network can achieve higher thermal stability. These obtained results could provide some good application prospects for UPE composites in areas where require thermal conduction, heat dissipation and thermal stability.Conflicts of interest
The authors declare no conflict of interest.Acknowledgements
We gratefully acknowledge the funding from National Key Research and Development Program of China (2016YFB0302300).References
- H. Nesser, H. Debéda, J. Yuan, A. Colin, P. Poulin, I. Dufour and C. Ayela, Nano Energy, 2018, 44, 1–6 CrossRef CAS.
- Y. Ma, L. Kou, A. Du, B. Huang, Y. Dai and T. Heine, Phys. Rev. B, 2018, 97, 035444 CrossRef CAS.
- L.-M. Yang, I. A. Popov, T. Frauenheim, A. I. Boldyrev, T. Heine, V. Bacic and E. Ganz, Phys. Chem. Chem. Phys., 2015, 17, 26043–26048 RSC.
- L. Mu, T. Ji, L. Chen, N. Mehra, Y. Shi and J. Zhu, ACS Appl. Mater. Interfaces, 2016, 8, 29080–29087 CrossRef CAS.
- A. L. Moore and L. Shi, Mater. Today, 2014, 17, 163–174 CrossRef CAS.
- L.-M. Yang, I. A. Popov, A. I. Boldyrev, T. Heine, T. Frauenheim and E. Ganz, Phys. Chem. Chem. Phys., 2015, 17, 17545–17551 RSC.
- W. Zhou, C. Wang, T. Ai, K. Wu, F. Zhao and H. Gu, Composites, Part A, 2009, 40, 830–836 CrossRef.
- J. Liu and R. Yang, Phys. Rev. B: Condens. Matter Mater. Phys., 2010, 81, 174122 CrossRef.
- S. Ronca, T. Igarashi, G. Forte and S. Rastogi, Polymer, 2017, 123, 203–210 CrossRef CAS.
- J. Yu, B. Sundqvist, B. Tonpheng and O. Andersson, Polymer, 2014, 55, 195–200 CrossRef CAS.
- F. Zhong, R. Thomann and R. Mülhaupt, Macromol. Mater. Eng., 2018, 303, 1800022 CrossRef.
- W. Zhou, Thermochim. Acta, 2011, 512, 183–188 CrossRef CAS.
- J. Gu, Y. Guo, Z. Lv, W. Geng and Q. Zhang, Composites, Part A, 2015, 78, 95–101 CrossRef CAS.
- L. Kou, C. Chen and S. C. Smith, J. Phys. Chem. Lett., 2015, 6, 2794–2805 CrossRef CAS.
- T. Kusunose, T. Yagi, S. Firoz and T. Sekino, J. Mater. Chem. A, 2013, 1, 3440–3445 RSC.
- F. Deng, Q.-S. Zheng, L.-F. Wang and C.-W. Nan, Appl. Phys. Lett., 2007, 90, 021914 CrossRef.
- L.-M. Yang, E. Ganz, Z. Chen, Z.-X. Wang and P. v. R. Schleyer, Angew. Chem., Int. Ed., 2015, 54, 9468–9501 CrossRef CAS.
- L.-M. Yang and E. Ganz, Phys. Chem. Chem. Phys., 2016, 18, 17586–17591 RSC.
- S. Chinkanjanarot, J. M. Tomasi, J. A. King and G. M. Odegard, Carbon, 2018, 140, 653–663 CrossRef CAS.
- Y. Zhao, Z. Zhai and D. Drummer, Polymers, 2018, 10, 457 CrossRef.
- L. Kou, T. Frauenheim and C. Chen, J. Phys. Chem. Lett., 2014, 5, 2675–2681 CrossRef CAS.
- B. Yang, Y. Shi, J.-B. Miao, R. Xia, L.-F. Su, J.-S. Qian, P. Chen, Q.-L. Zhang and J.-M. Liu, Polym. Test., 2018, 67, 122–135 CrossRef CAS.
- J. Shang, Y. Ma, Y. Gu and L. Kou, Phys. Chem. Chem. Phys., 2018, 20, 28964–28978 RSC.
- Z. Su, H. Wang, X. Ye, K. Tian, W. Huang, J. He, Y. Guo and X. Tian, Composites, Part A, 2018, 109, 402–412 CrossRef CAS.
- L.-C. Xu, A. Du and L. Dai, Phys. Chem. Chem. Phys., 2016, 18, 27284–27289 RSC.
- B.-H. Xie, X. Huang and G.-J. Zhang, Compos. Sci. Technol., 2013, 85, 98–103 CrossRef CAS.
- T. Fujihara, H.-B. Cho, T. Nakayama, T. Suzuki, W. Jiang, H. Suematsu, H. D. Kim and K. Niihara, J. Am. Ceram. Soc., 2012, 95, 369–373 CrossRef CAS.
- I. V. Singh, M. Tanaka and M. Endo, Int. J. Therm. Sci., 2007, 46, 842–847 CrossRef CAS.
- L.-M. Yang, V. Bacic, I. A. Popov, A. I Boldyrev, T. Heine, T. Frauenheim and E. Ganz, J. Am. Chem. Soc., 2015, 137, 2757–2762 CrossRef CAS.
- X. Li, X. Fan, Y. Zhu, J. Li, J. M. Adams, S. Shen and H. Li, Comput. Mater. Sci., 2012, 63, 207–213 CrossRef CAS.
- C. Xiao, Y. Tang, L. Chen, X. Zhang, K. Zheng and X. Tian, Composites, Part A, 2019, 121, 330–340 CrossRef CAS.
- R. Peng, Y. Ma, Z. He, B. Huang, L. Kou and Y. Dai, Nano Lett., 2019, 19, 1227–1233 CrossRef.
- F. Zhao, G. Zhang, S. Zhao, J. Cui, A. Gao and Y. Yan, Compos. Sci. Technol., 2018, 159, 232–239 CrossRef CAS.
- Y. Jiang, Y. Liu, P. Min and G. Sui, Compos. Sci. Technol., 2017, 144, 63–69 CrossRef CAS.
- S. Uchida, R. Ishige and S. Ando, Polymers, 2017, 9, 263 CrossRef.
- C. Jin, X. Tang, X. Tan, S. C. Smith, Y. Dai and L. Kou, J. Mater. Chem. A, 2019, 7, 1099–1106 RSC.
- T. Zhang, Y. Ma, L. Yu, B. Huang and Y. Dai, Mater. Horiz., 2019, 6, 1930–1937 RSC.
- R. M. Erb, R. Libanori, N. Rothfuchs and A. R. Studart, Science, 2012, 335, 199–204 CrossRef CAS.
- Y. Ma, L. Kou, B. Huang, Y. Dai and T. Heine, Phys. Rev. B, 2018, 98, 085420 CrossRef CAS.
- B. Song, Y. Zhou, H.-M. Yang, J.-H. Liao, L.-M. Yang, X.-B. Yang and E. Ganz, J. Am. Chem. Soc., 2019, 141, 3630–3640 CrossRef CAS.
- R. Peng, Y. Ma, Q. Wu, B. Huang and Y. Dai, Nanoscale, 2019, 11, 11413–11428 RSC.
- P. V. Trinh, N. N. Anh, N. T. Hong, P. N. Hong, P. N. Minh and B. H. Thang, J. Mol. Liq., 2018, 269, 344–353 CrossRef.
- Z.-G. Wang, Y.-F. Huang, G.-Q. Zhang, H.-Q. Wang, J.-Z. Xu, J. Lei, L. Zhu, F. Gong and Z.-M. Li, Ind. Eng. Chem. Res., 2018, 57, 10391–10397 CrossRef CAS.
- T. Huang, X. Zeng, Y. Yao, R. Sun, F. Meng, J. Xu and C. Wong, RSC Adv., 2017, 7, 23355–23362 RSC.
- Y.-J. Xiao, W.-Y. Wang, X.-J. Chen, T. Lin, Y.-T. Zhang, J.-H. Yang, Y. Wang and Z.-W. Zhou, Composites, Part A, 2016, 90, 614–625 CrossRef CAS.
- Z.-G. Wang, F. Gong, W.-C. Yu, Y.-F. Huang, L. Zhu, J. Lei, J.-Z. Xu and Z.-M. Li, Compos. Sci. Technol., 2018, 162, 7–13 CrossRef CAS.
- J. Yang, L.-S. Tang, R.-Y. Bao, L. Bai, Z.-Y. Liu, W. Yang, B.-H. Xie and M.-B. Yang, Chem. Eng. J., 2017, 315, 481–490 CrossRef CAS.
- F. J. Medel, M. J. Martínez-Morlanes, P. J. Alonso, J. Rubin, F. J. Pascual and J. A. Puertolas, Mater. Sci. Eng., C, 2013, 33, 182–188 CrossRef CAS.
- S. K. Reddy, S. Kumar, K. M. Varadarajan, P. R. Marpu, T. K. Gupta and M. Choosri, Mater. Sci. Eng., C, 2018, 92, 957–968 CrossRef CAS.
- X. Yang, Y. Guo, X. Luo, N. Zheng, T. Ma, J. Tan, C. Li, Q. Zhang and J. Gu, Compos. Sci. Technol., 2018, 164, 59–64 CrossRef CAS.
- W. Jin, L. Yuan, G. Liang and A. Gu, ACS Appl. Mater. Interfaces, 2014, 6, 14931–14944 CrossRef CAS.
- X. Yang, L. Tang, Y. Guo, C. Liang, Q. Zhang, K. Kou and J. Gu, Composites, Part A, 2017, 101, 237–242 CrossRef CAS.
- Y. Li, G. Xu, Y. Guo, T. Ma, X. Zhong, Q. Zhang and J. Gu, Composites, Part A, 2018, 107, 570–578 CrossRef CAS.
- Y. Guo, X. Yang, K. Ruan, J. Kong, M. Dong, J. Zhang, J. Gu and Z. Guo, ACS Appl. Mater. Interfaces, 2019, 11, 25465–25473 CrossRef CAS.
- H.-J. Hong, S. M. Kwan, D. S. Lee, S. M. Kim, Y. H. Kim, J. S. Lim, J. Y. Hwang and H. S. Jeong, Compos. Sci. Technol., 2017, 152, 94–100 CrossRef CAS.
- S. Yang, W. Li, S. Bai and Q. Wang, J. Mater. Chem. C, 2018, 6, 11209–11218 RSC.
- Y. Agari, A. Ueda and S. Nagai, J. Appl. Polym. Sci., 1993, 49, 1625–1634 CrossRef CAS.
- J. Xu, B. Gao, H. Du and F. Kang, Int. J. Therm. Sci., 2016, 104, 348–356 CrossRef.
- P. Kim, L. Shi, A. Majumdar and P. L. McEuen, Phys. Rev. Lett., 2001, 87, 215502 CrossRef CAS.
- J. Che, M. Jing, D. Liu, K. Wang and Q. Fu, Composites, Part A, 2018, 112, 32–39 CrossRef CAS.
- X.-J. Zha, J. Yang, J.-H. Pu, C.-P. Feng, L. Bai, R.-Y. Bao, Z.-Y. Liu, M.-B. Yang and W. Yang, Adv. Mater. Interfaces, 2019, 6, 1900081 CrossRef.
Footnote |
| † Electronic supplementary information (ESI) available. See DOI: 10.1039/c9ra08416a |
| This journal is © The Royal Society of Chemistry 2019 |

